Superior Industries International
Superior Industries International — FY2024 Earnings Presentation
28 slides from Superior Industries International's earnings presentation, Mar 6, 2025

Slide 1: Full Year and Fourth Quarter 2024 Earnings Conference Call
Full Year and Fourth Quarter 2024 Earnings Conference Call March 6, 2025
Slide 2: Forward-Looking Statements and Non-GAAP Financial Measures
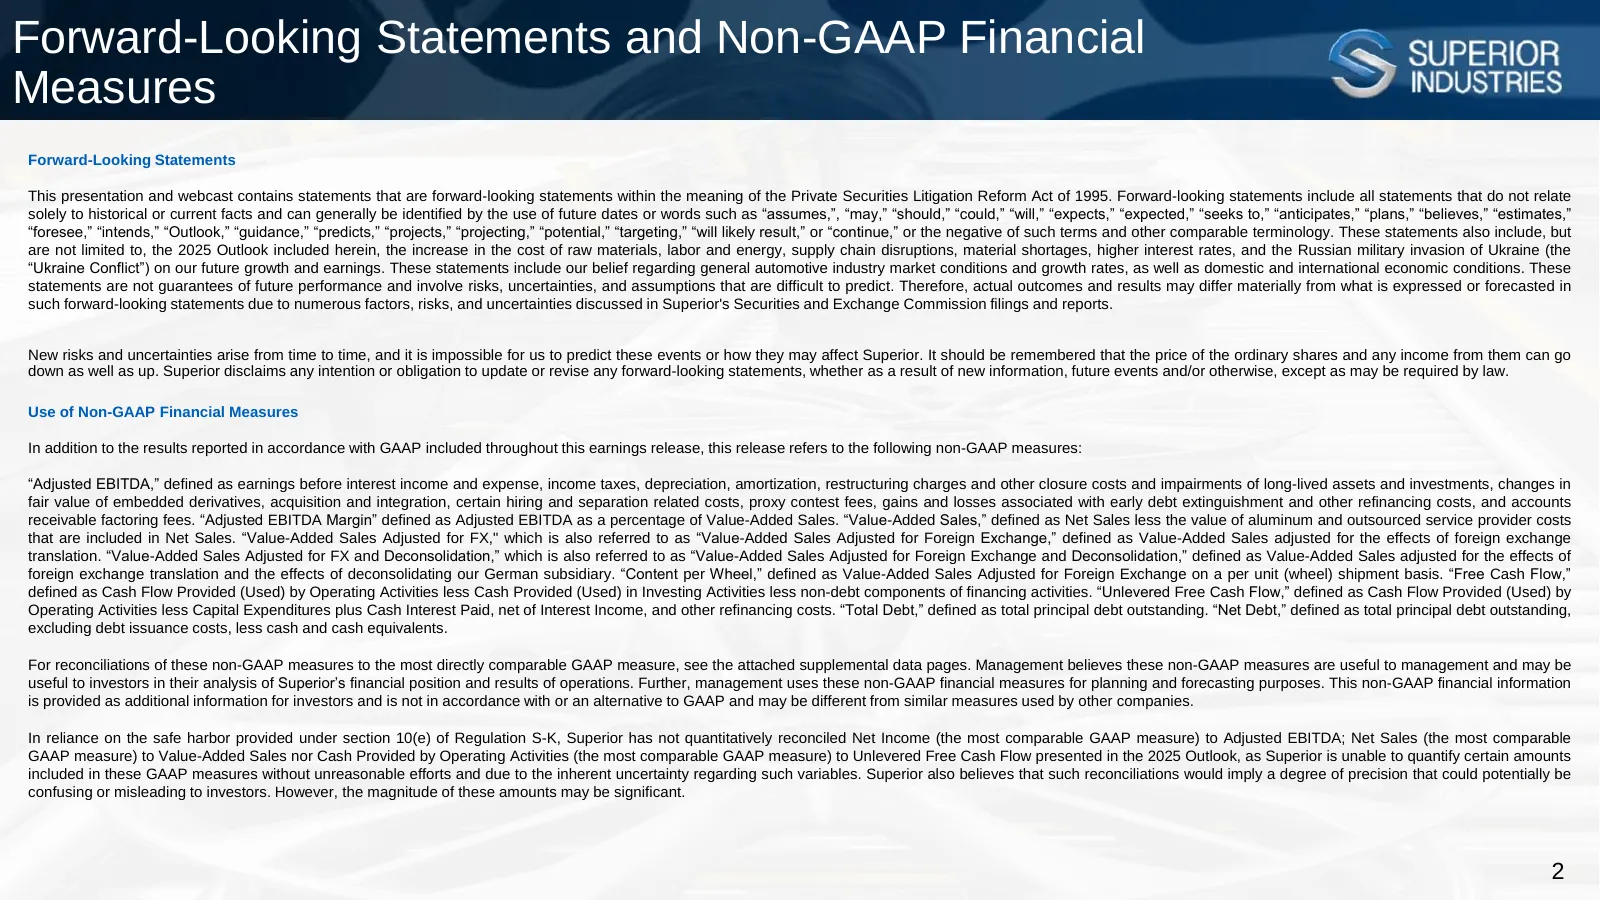
Forward-Looking Statements and Non-GAAP Financial Measures Forward-Looking Statements This presentation and webcast contains statements that are forward-looking statements within the meaning of the Private Securities Litigation Reform Act of 1995. Forward-looking statements include all statements th
Slide 3: Agenda
Agenda Introduction Dan Lee Senior Vice President and Chief Financial Officer Business Update Majdi Abulaban President and Chief Executive Officer Financial Review Dan Lee Senior Vice President and Chief Financial Officer Delivering innovative solutions 3
Slide 4: Financial and Operational Highlights
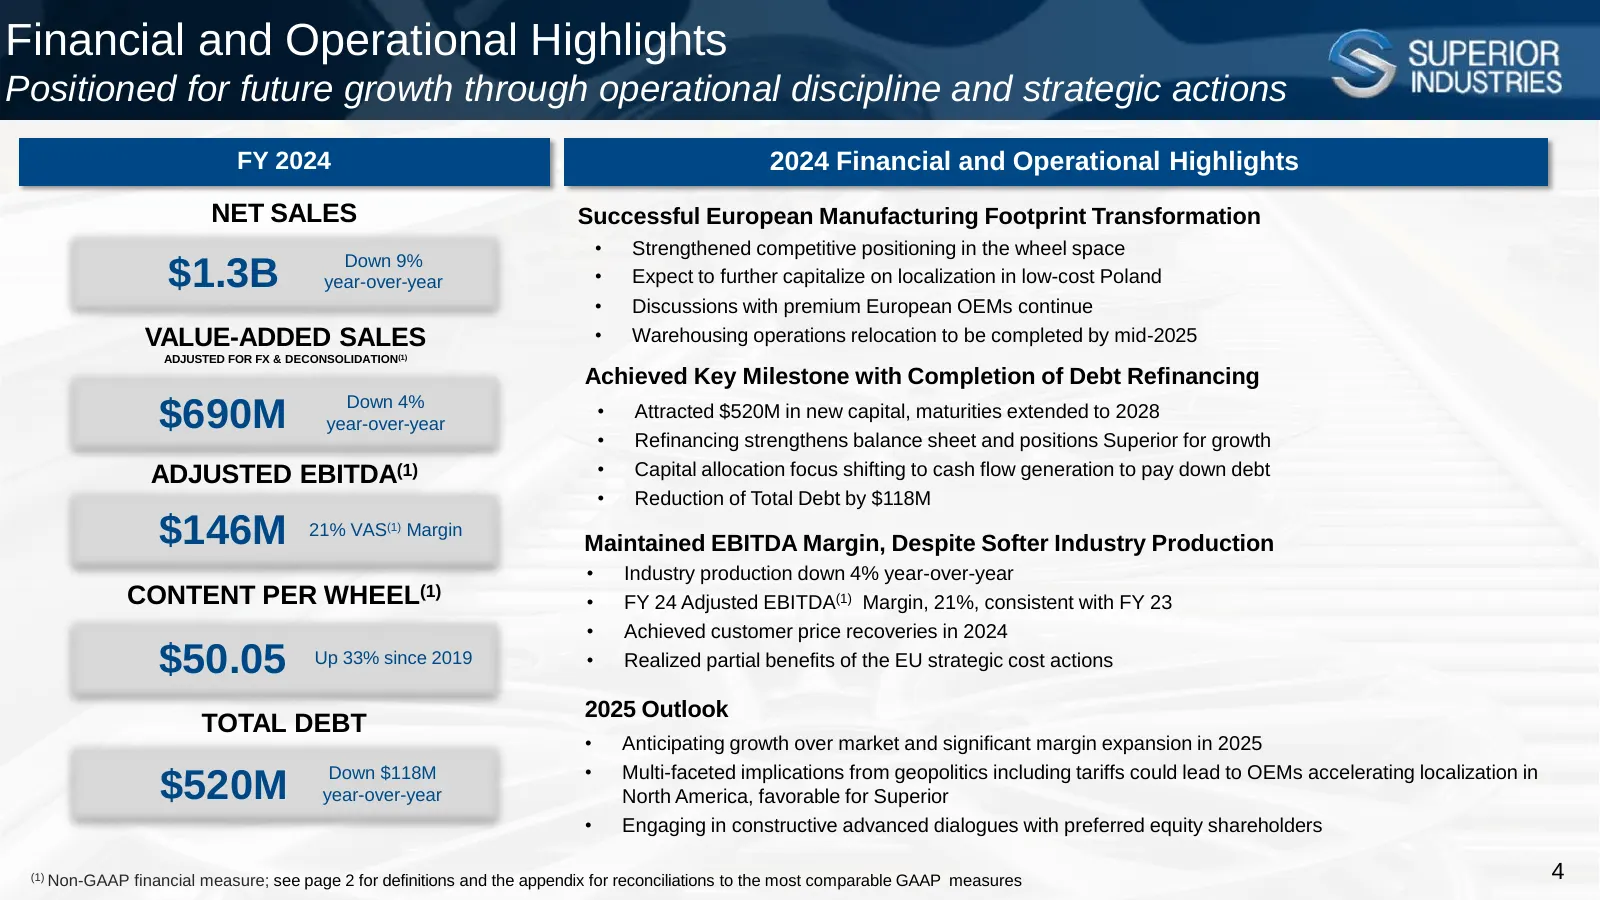
Financial and Operational Highlights Positioned for future growth through operational discipline and strategic actions FY 2024 2024 Financial and Operational Highlights NET SALES Successful European Manufacturing Footprint Transformation • Strengthened competitive positioning in the wheel space Down
Slide 5: Europe Transformation and Cost Reductions Impact to 2025E Adj. EBITDA
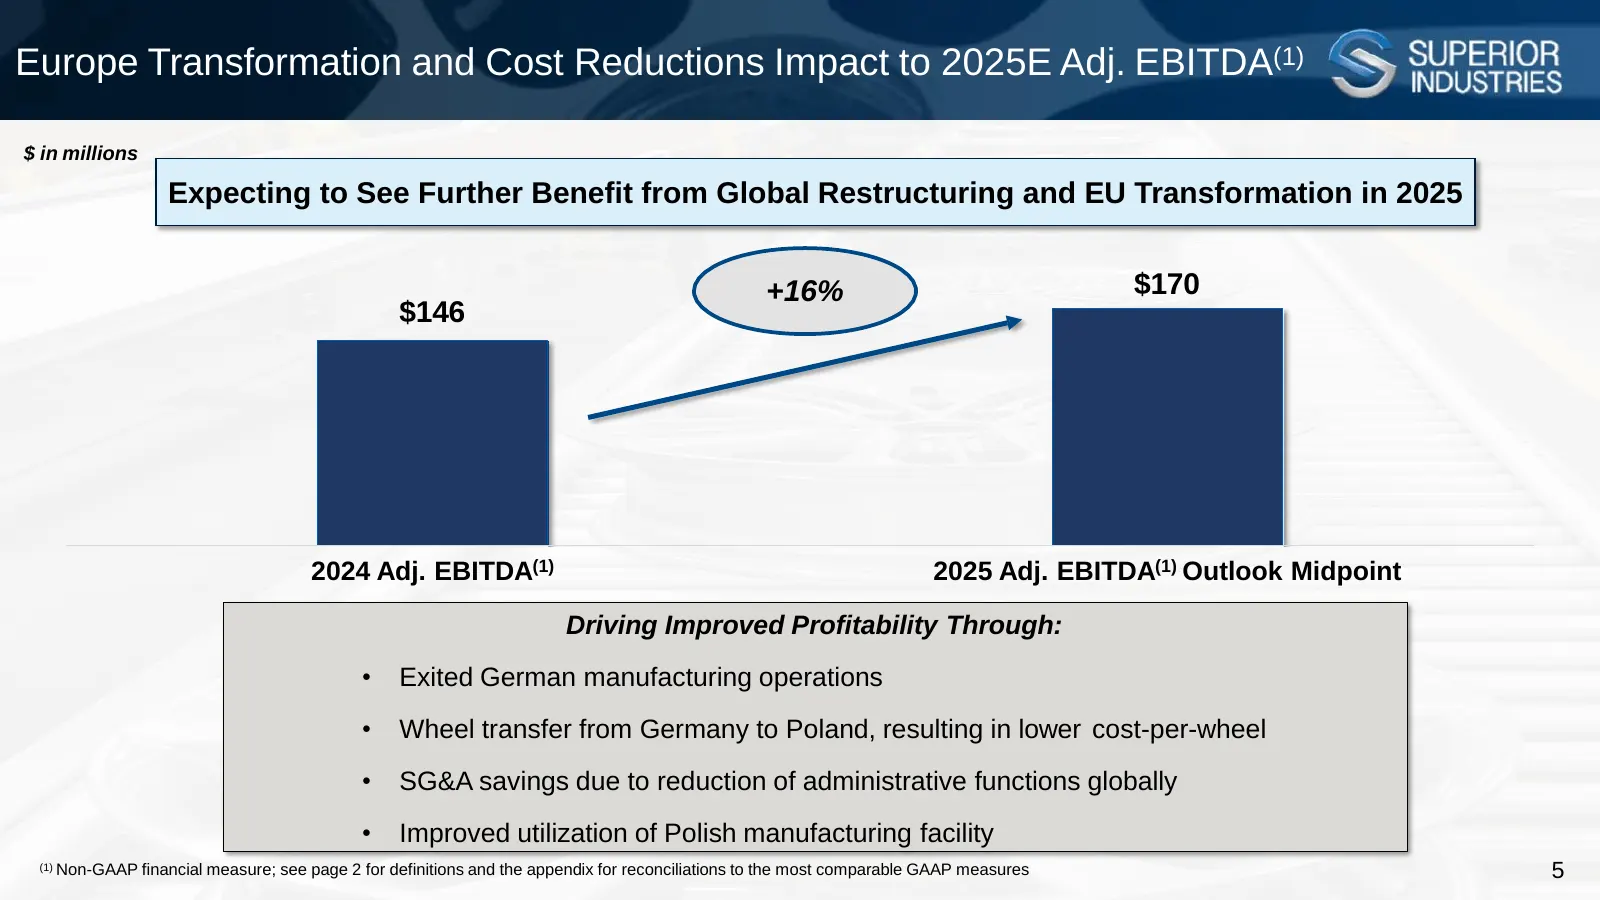
Europe Transformation and Cost Reductions Impact to 2025E Adj. EBITDA(1) $ in millions Expecting to See Further Benefit from Global Restructuring and EU Transformation in 2025 +16% $170 $146 2024 Adj. EBITDA(1) 2025 Adj. EBITDA(1) Outlook Midpoint Driving Improved Profitability Through: • Exited Ger
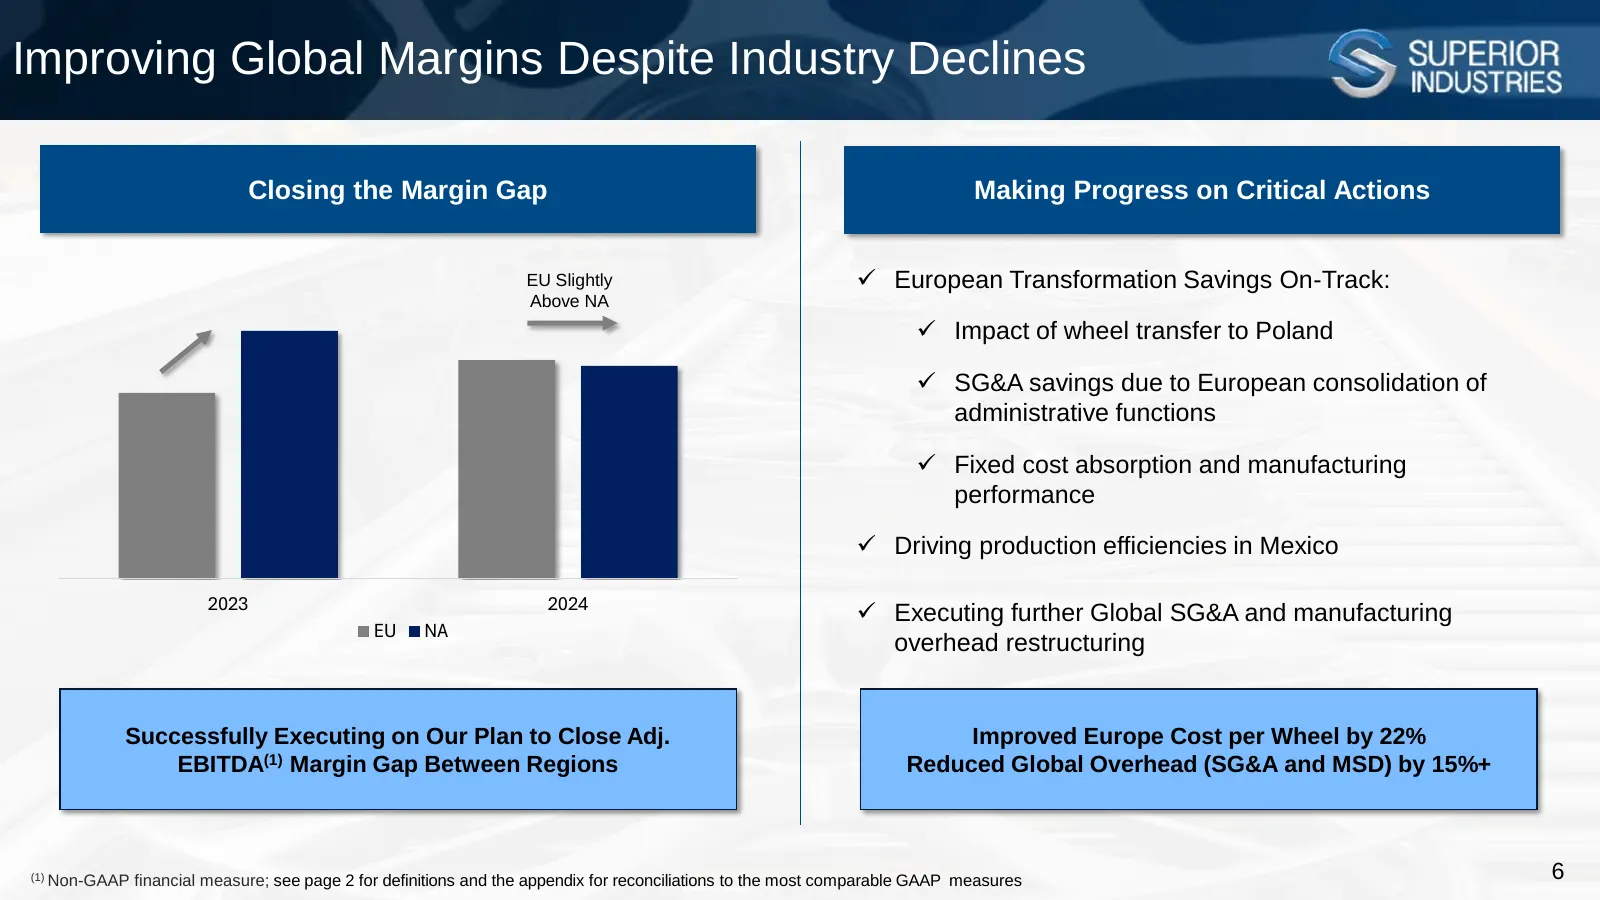
Slide 6: Improving Global Margins Despite Industry Declines
Improving Global Margins Despite Industry Declines Closing the Margin Gap Making Progress on Critical Actions EU Slightly ✓ European Transformation Savings On-Track: Above NA ✓ Impact of wheel transfer to Poland ✓ SG&A savings due to European consolidation of administrative functions ✓ Fixed cost ab
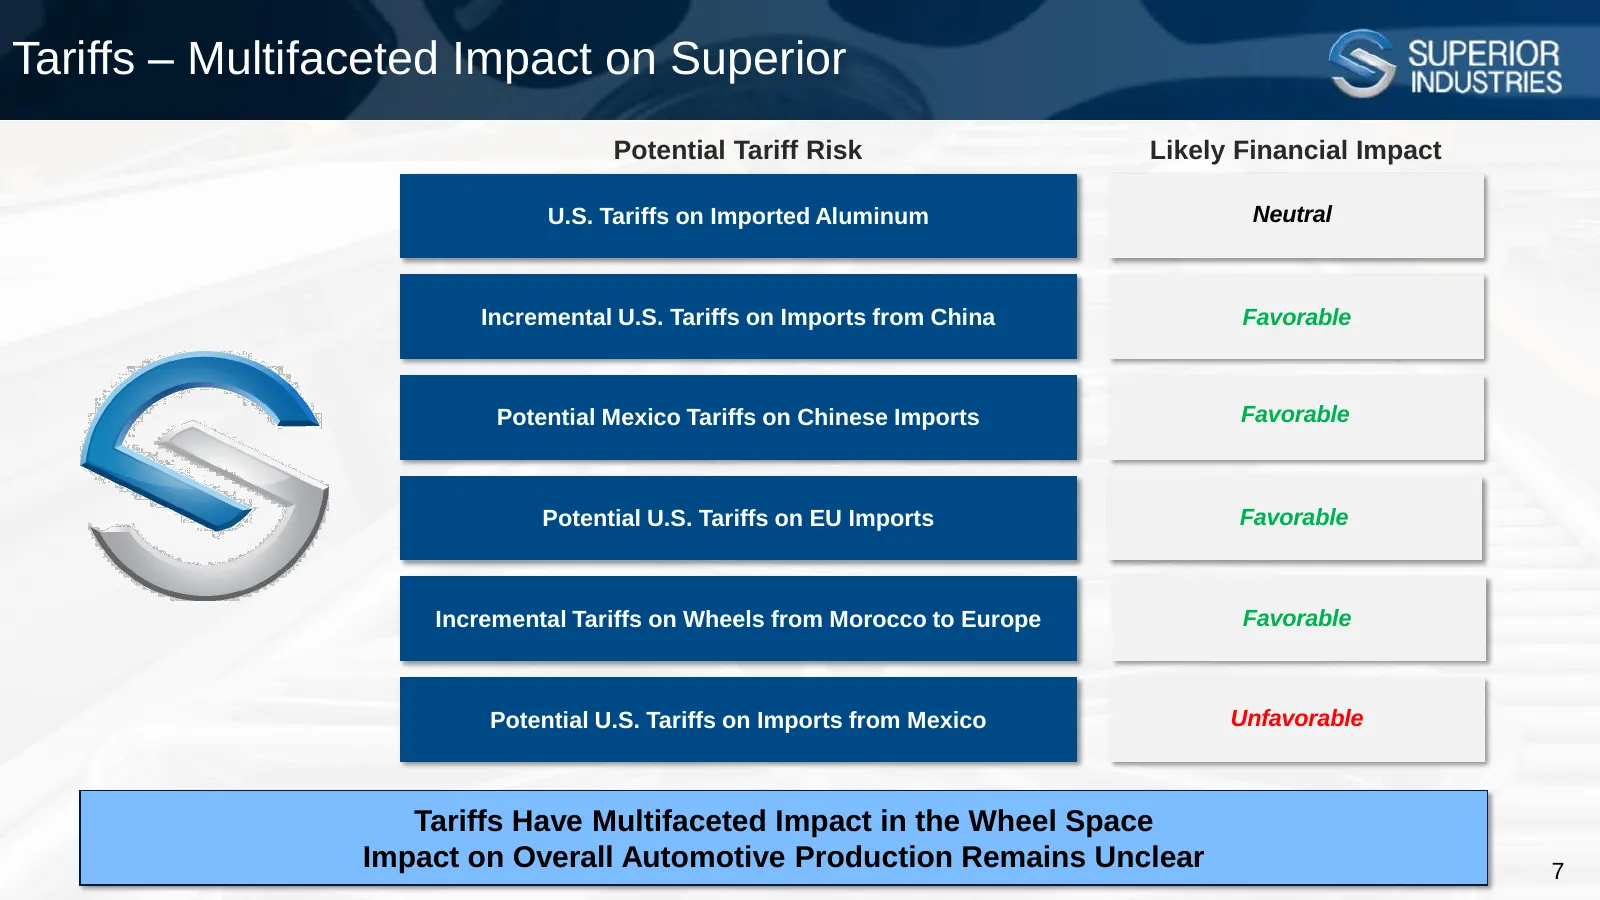
Slide 7: Tariffs – Multifaceted Impact on Superior
Tariffs – Multifaceted Impact on Superior Potential Tariff Risk Likely Financial Impact U.S. Tariffs on Imported Aluminum Neutral Incremental U.S. Tariffs on Imports from China Favorable Potential Mexico Tariffs on Chinese Imports Favorable Potential U.S. Tariffs on EU Imports Favorable Incremental
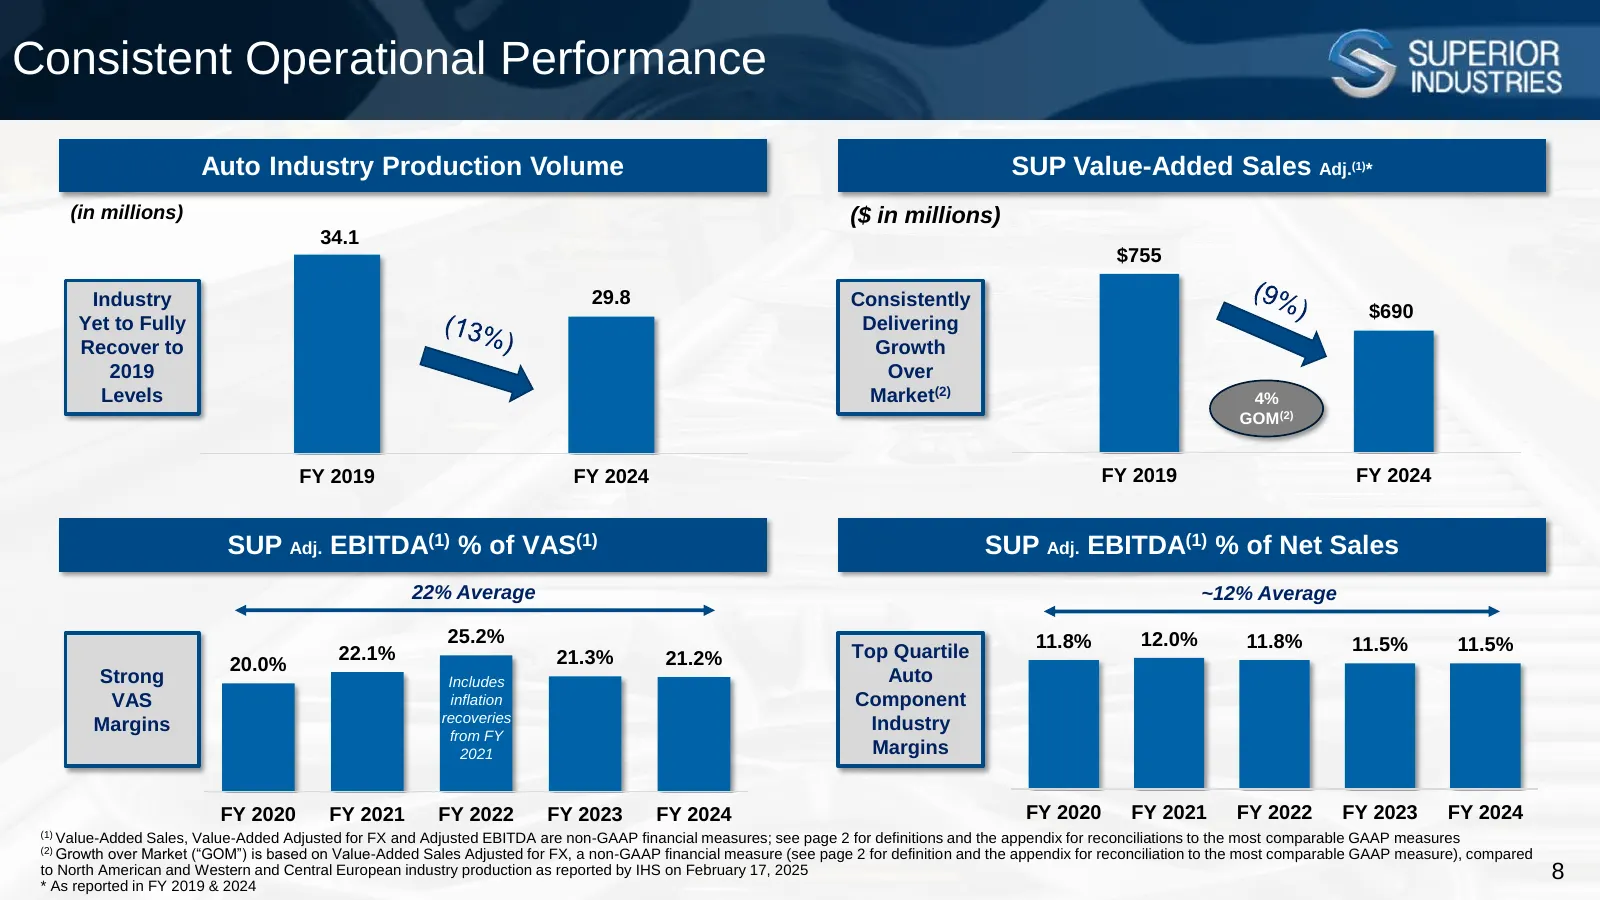
Slide 8: Consistent Operational Performance
Consistent Operational Performance Auto Industry Production Volume SUP Value-Added Sales Adj.(1)* (in millions) ($ in millions) 34.1 $755 Industry 29.8 Consistently $690 Yet to Fully Delivering Recover to Growth 2019 Over Levels Market(2) 4% GOM(2) FY 2019 FY 2024 FY 2019 FY 2024 SUP Adj. EBITDA(1)
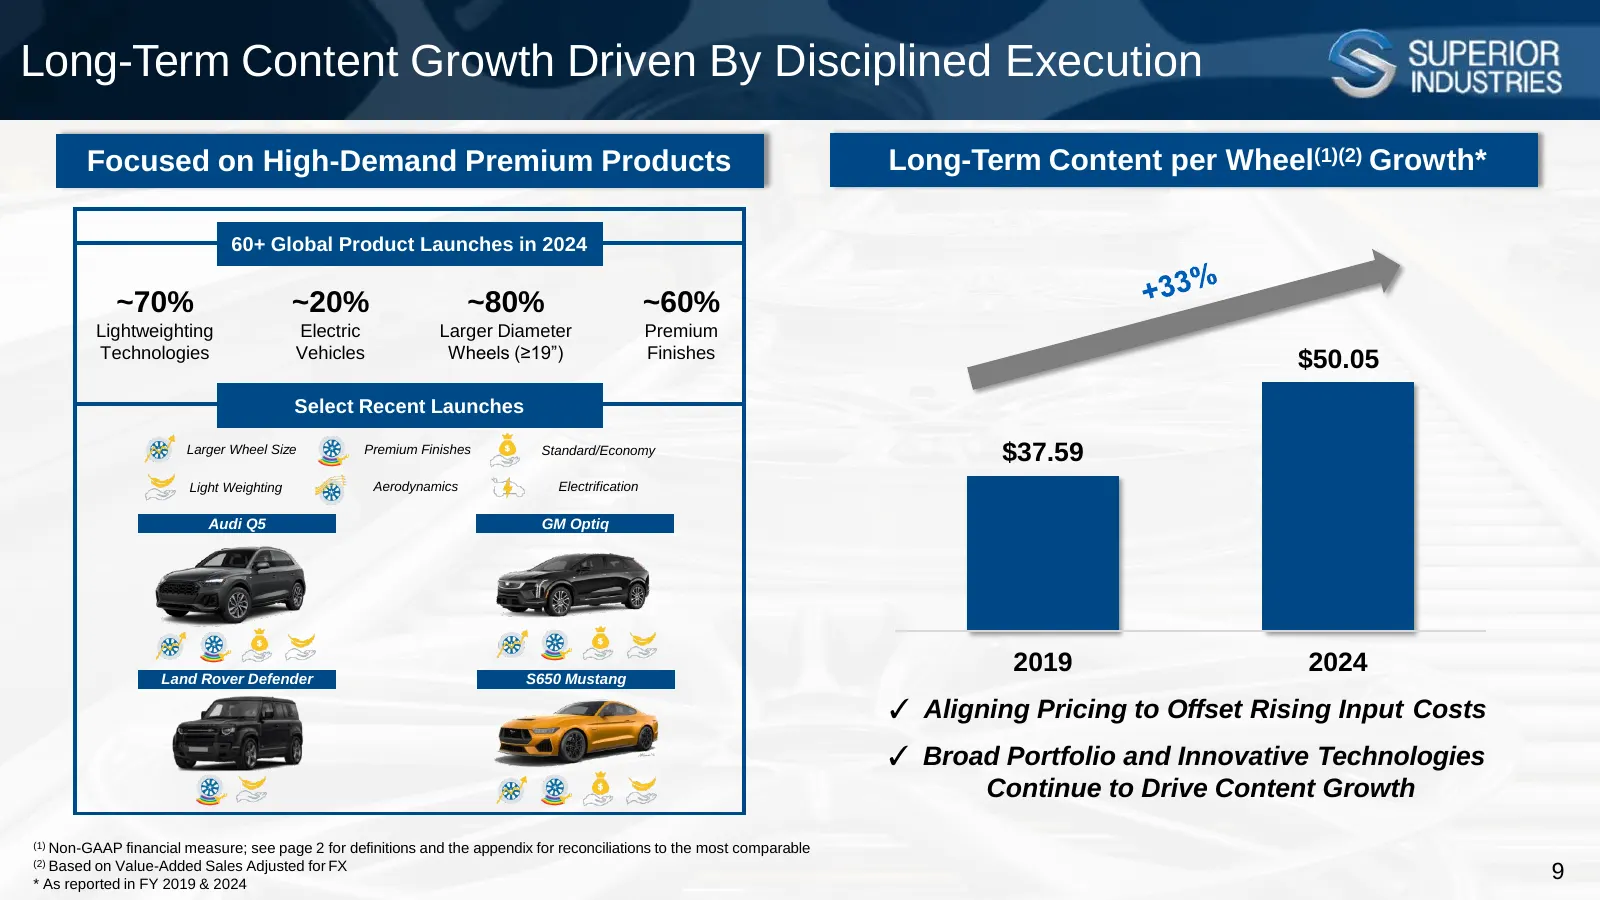
Slide 9: Long-Term Content Growth Driven By Disciplined Execution
Long-Term Content Growth Driven By Disciplined Execution Focused on High-Demand Premium Products Long-Term Content per Wheel(1)(2) Growth* 60+ Global Product Launches in 2024 ~70% ~20% ~80% ~60% Lightweighting Electric Larger Diameter Premium Technologies Vehicles Wheels (≥19”) Finishes $50.05 Selec
Slide 10: Disciplined Execution / Shareholder Value
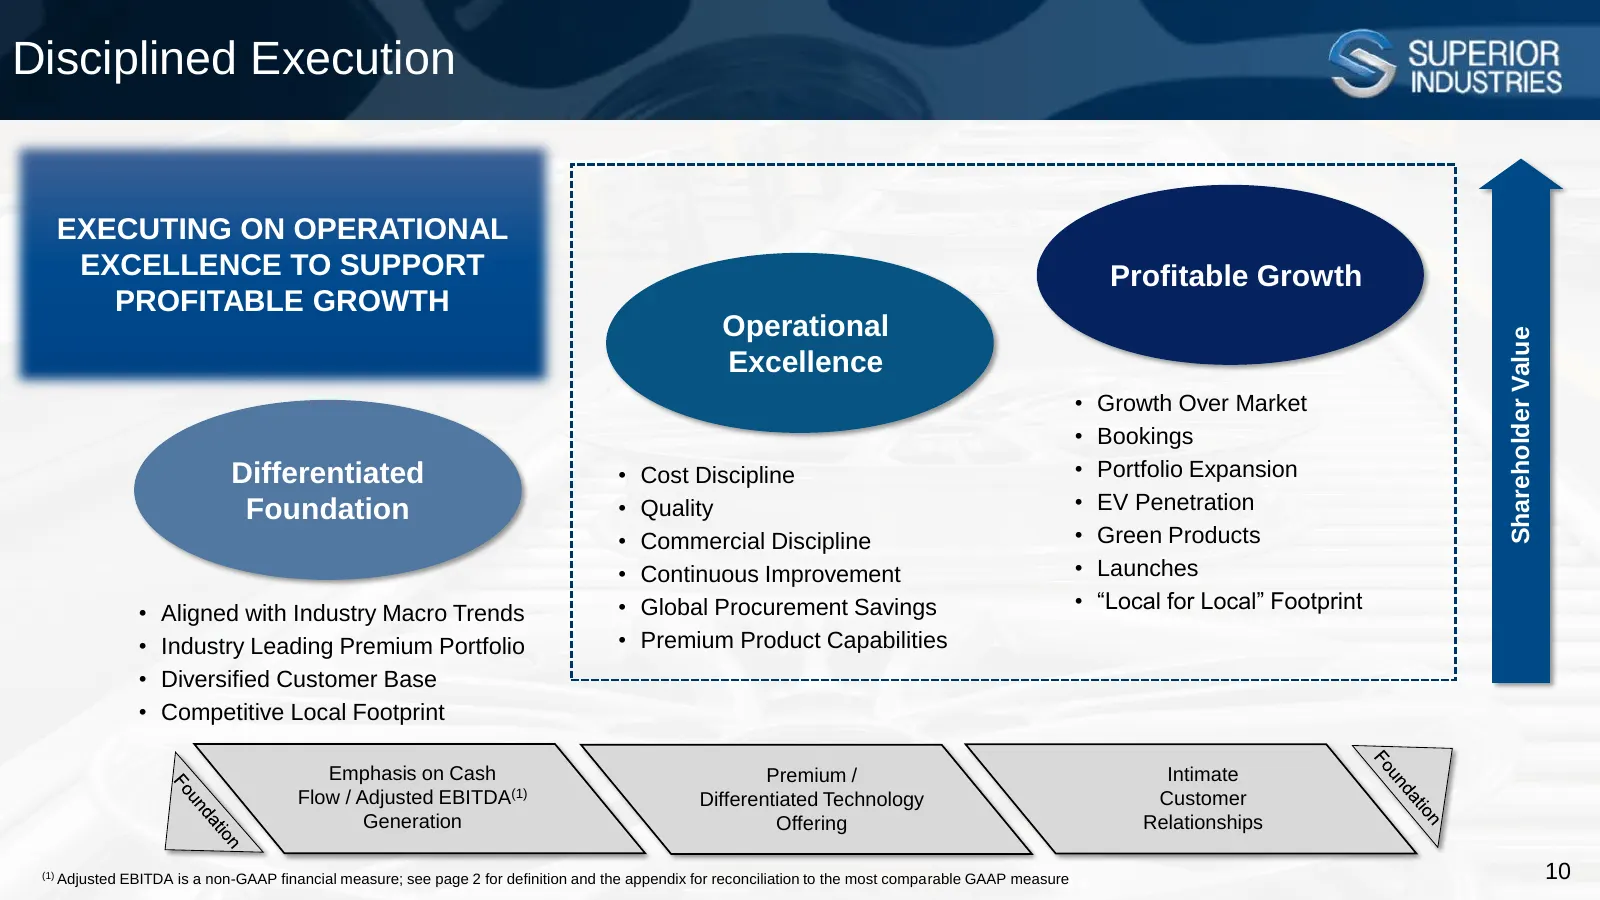
Disciplined Execution EXECUTING ON OPERATIONAL EXCELLENCE TO SUPPORT Profitable Growth PROFITABLE GROWTH Operational Shareholder Value Excellence • Growth Over Market • Bookings Differentiated • Cost Discipline • Portfolio Expansion Foundation • Quality • EV Penetration • Commercial Discipline • Gre
Slide 11: Full Year 2025 Outlook
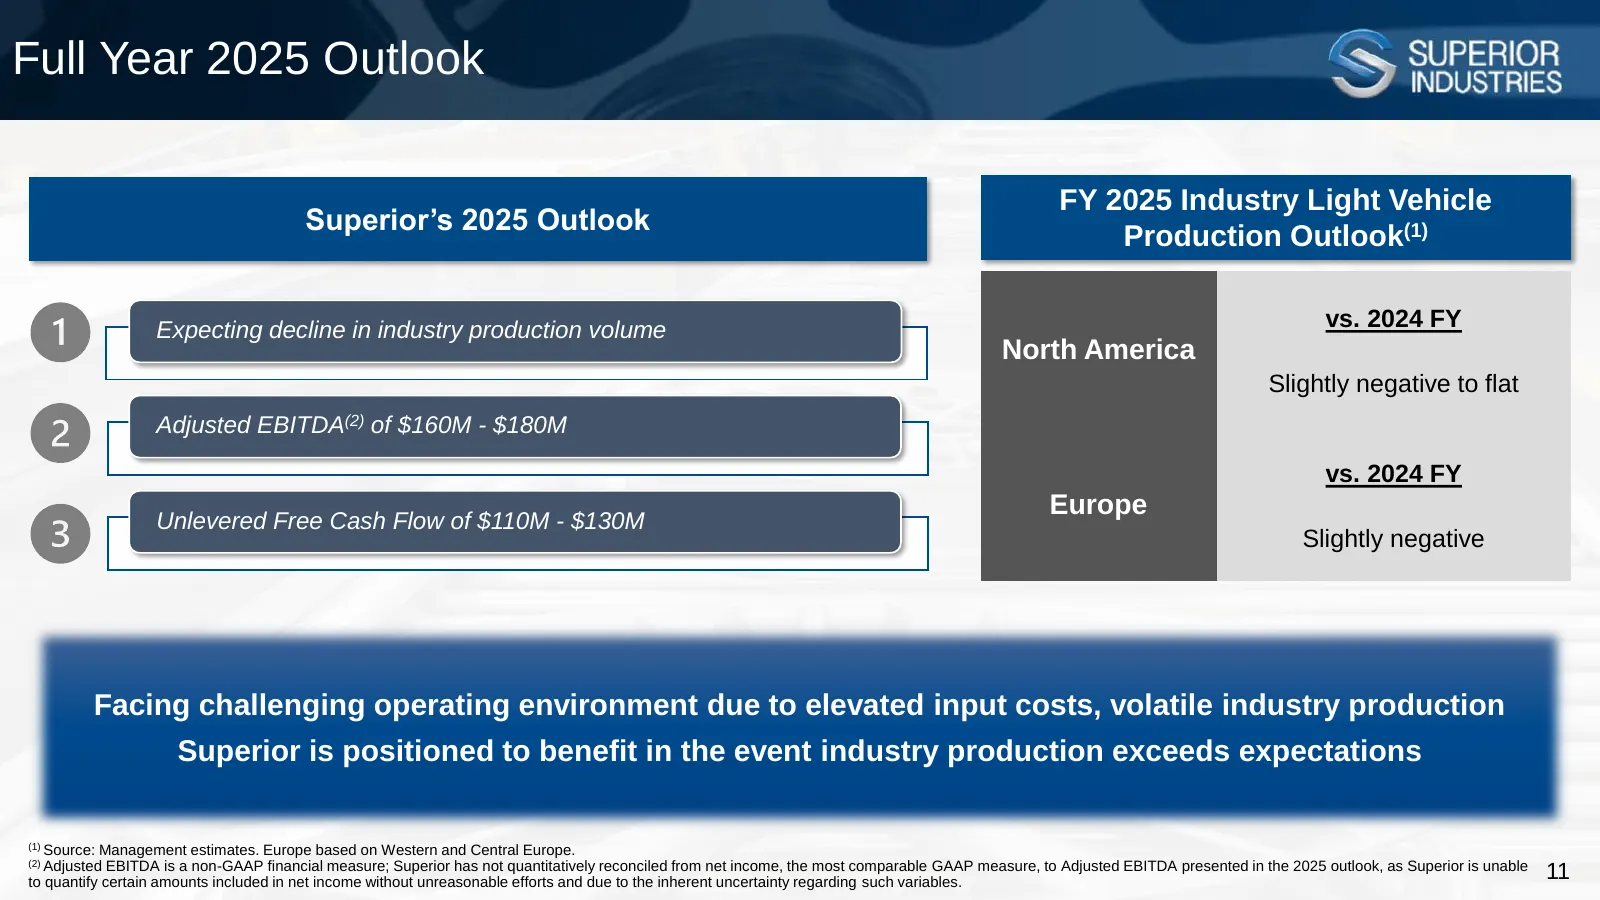
Full Year 2025 Outlook FY 2025 Industry Light Vehicle Superior’s 2025 Outlook Production Outlook(1) Expecting decline in industry production volume vs. 2024 FY North America Slightly negative to flat Adjusted EBITDA(2) of $160M - $180M vs. 2024 FY Europe Unlevered Free Cash Flow of $110M - $130M Sli
Slide 12: Financial Review
Financial Review S SLLERIOR
Slide 13: Fourth Quarter and Full Year 2024 Financial Summary
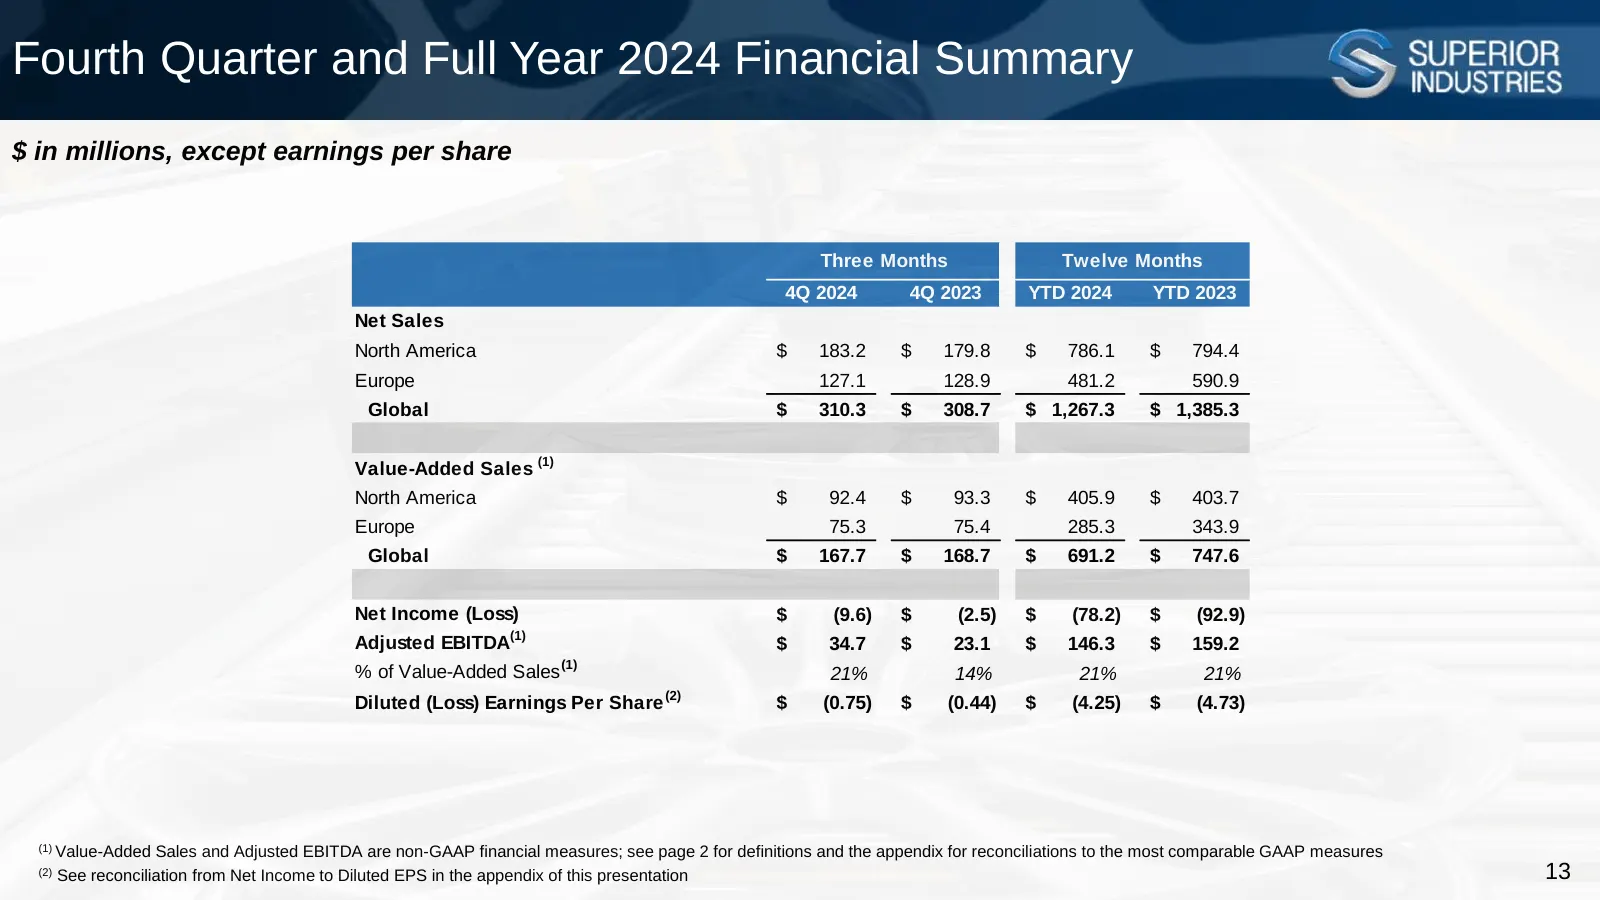
Fourth Quarter and Full Year 2024 Financial Summary $ in millions, except earnings per share Three Months Twelve Months 4Q 2024 4Q 2023 YTD 2024 YTD 2023 Net Sales North America $ 183.2 $ 179.8 $ 786.1 $ 794.4 Europe 127.1 128.9 481.2 590.9 Global $ 310.3 $ 308.7 $ 1,267.3 $ 1,385.3 Value-Added Sale
Slide 14: Fourth Quarter 2024 Year-over-Year Sales Bridge
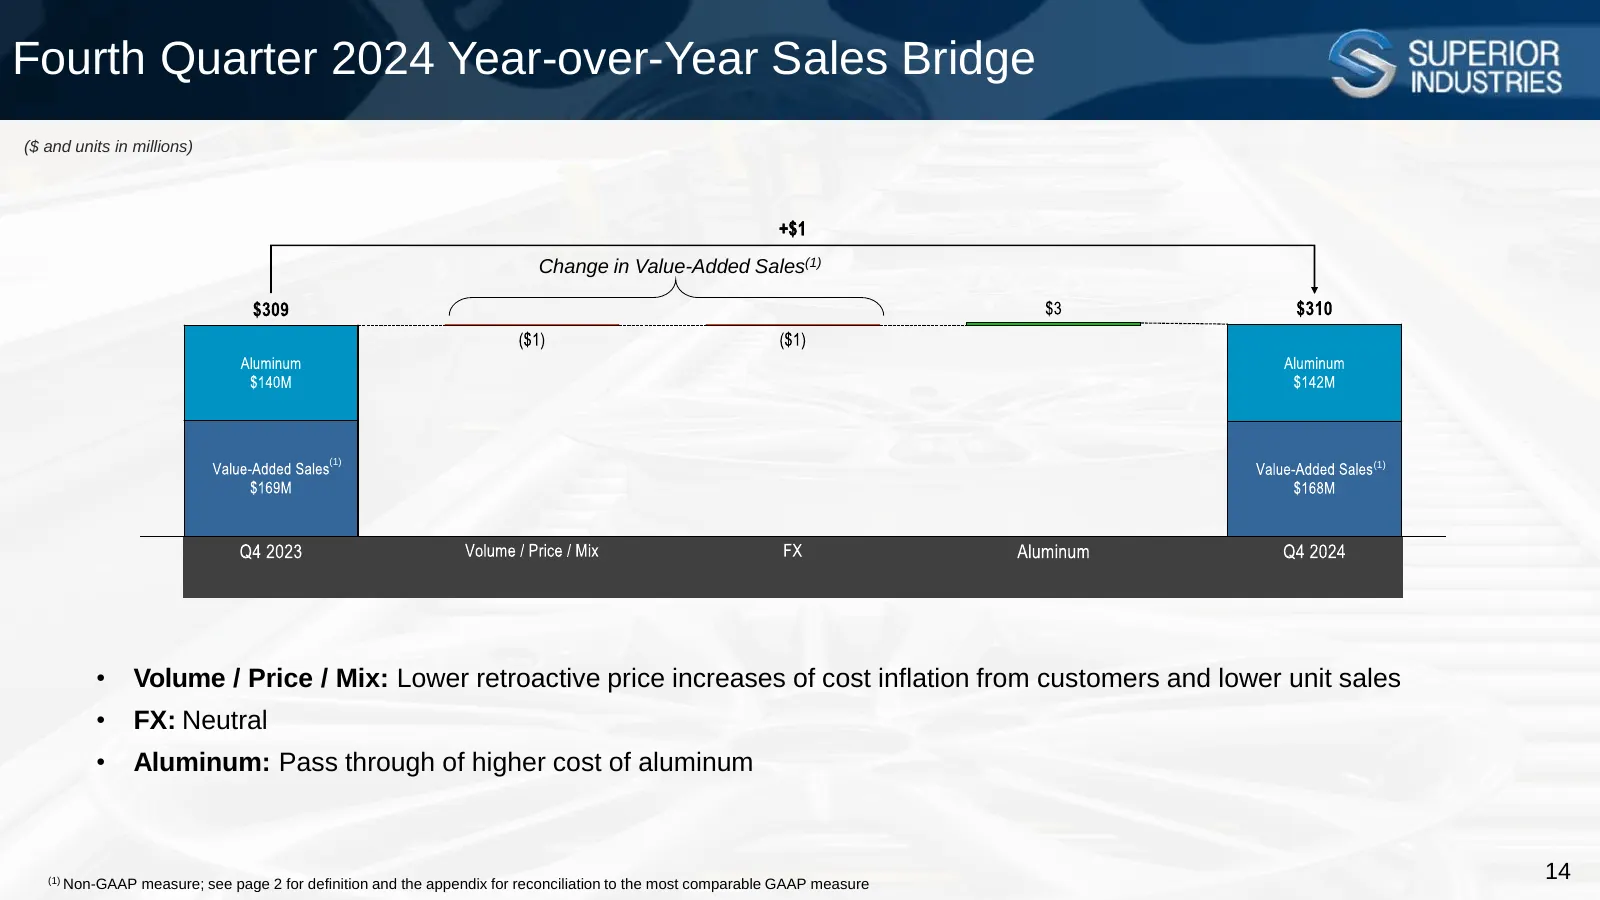
Fourth Quarter 2024 Year-over-Year Sales Bridge ($ and units in millions) Change in Value-Added Sales(1) (1) (1) • Volume / Price / Mix: Lower retroactive price increases of cost inflation from customers and lower unit sales • FX: Neutral • Aluminum: Pass through of higher cost of aluminum (1) Non-G
Slide 15: FY 2024 Year-over-Year Sales Bridge
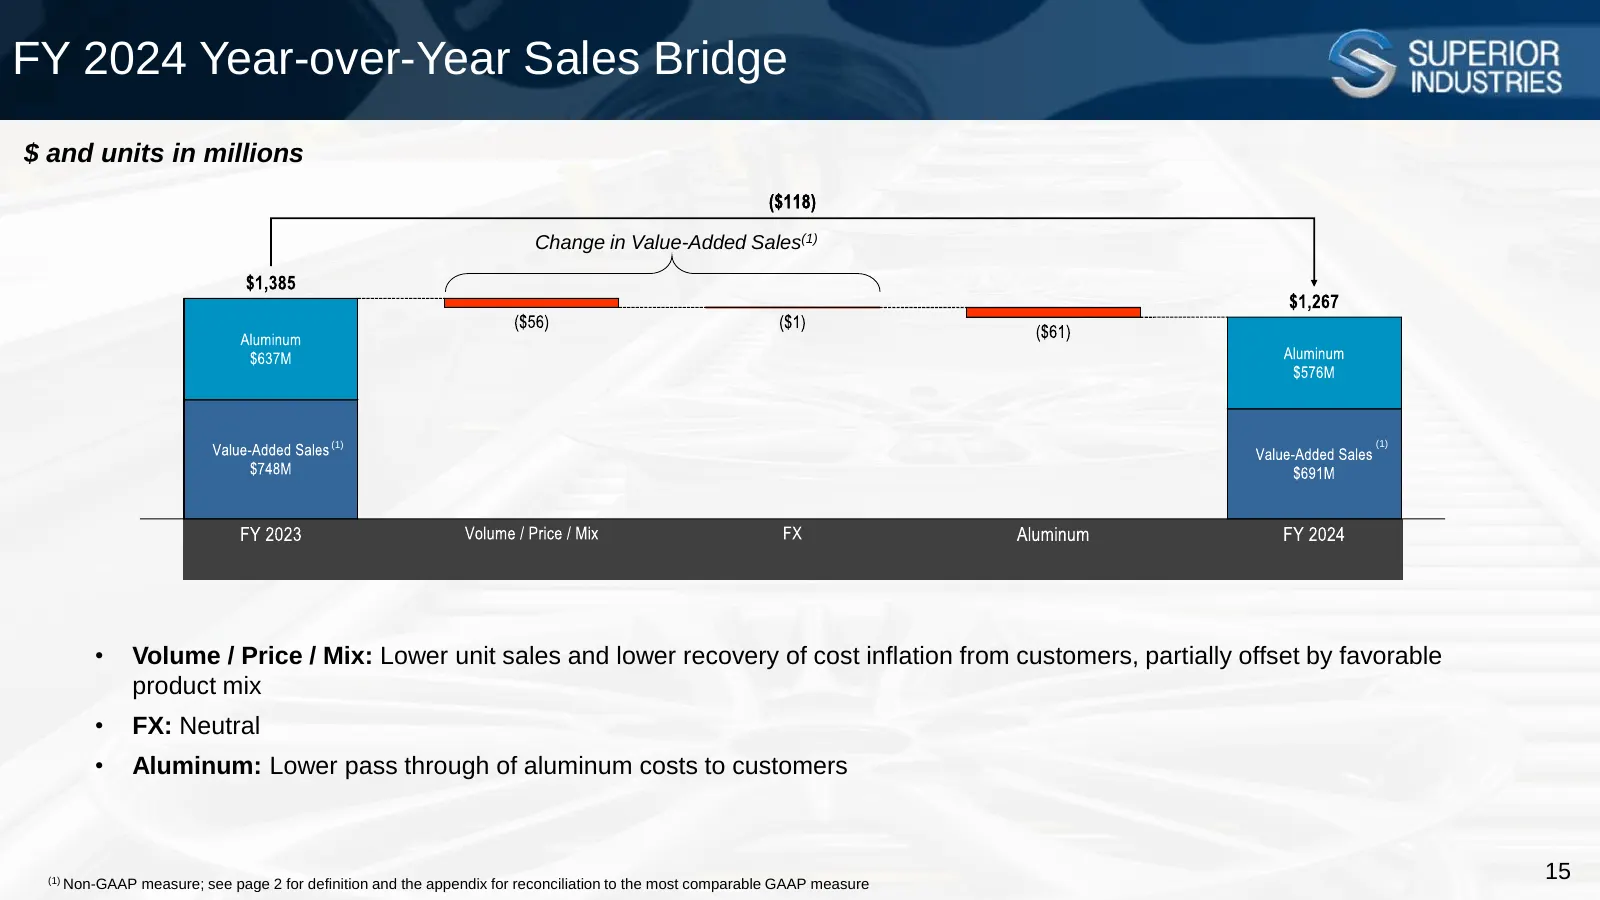
FY 2024 Year-over-Year Sales Bridge $ and units in millions Change in Value-Added Sales(1) (1) (1) • Volume / Price / Mix: Lower unit sales and lower recovery of cost inflation from customers, partially offset by favorable product mix • FX: Neutral • Aluminum: Lower pass through of aluminum costs to
Slide 16: Fourth Quarter 2024 Year-over-Year Adjusted EBITDA Bridge
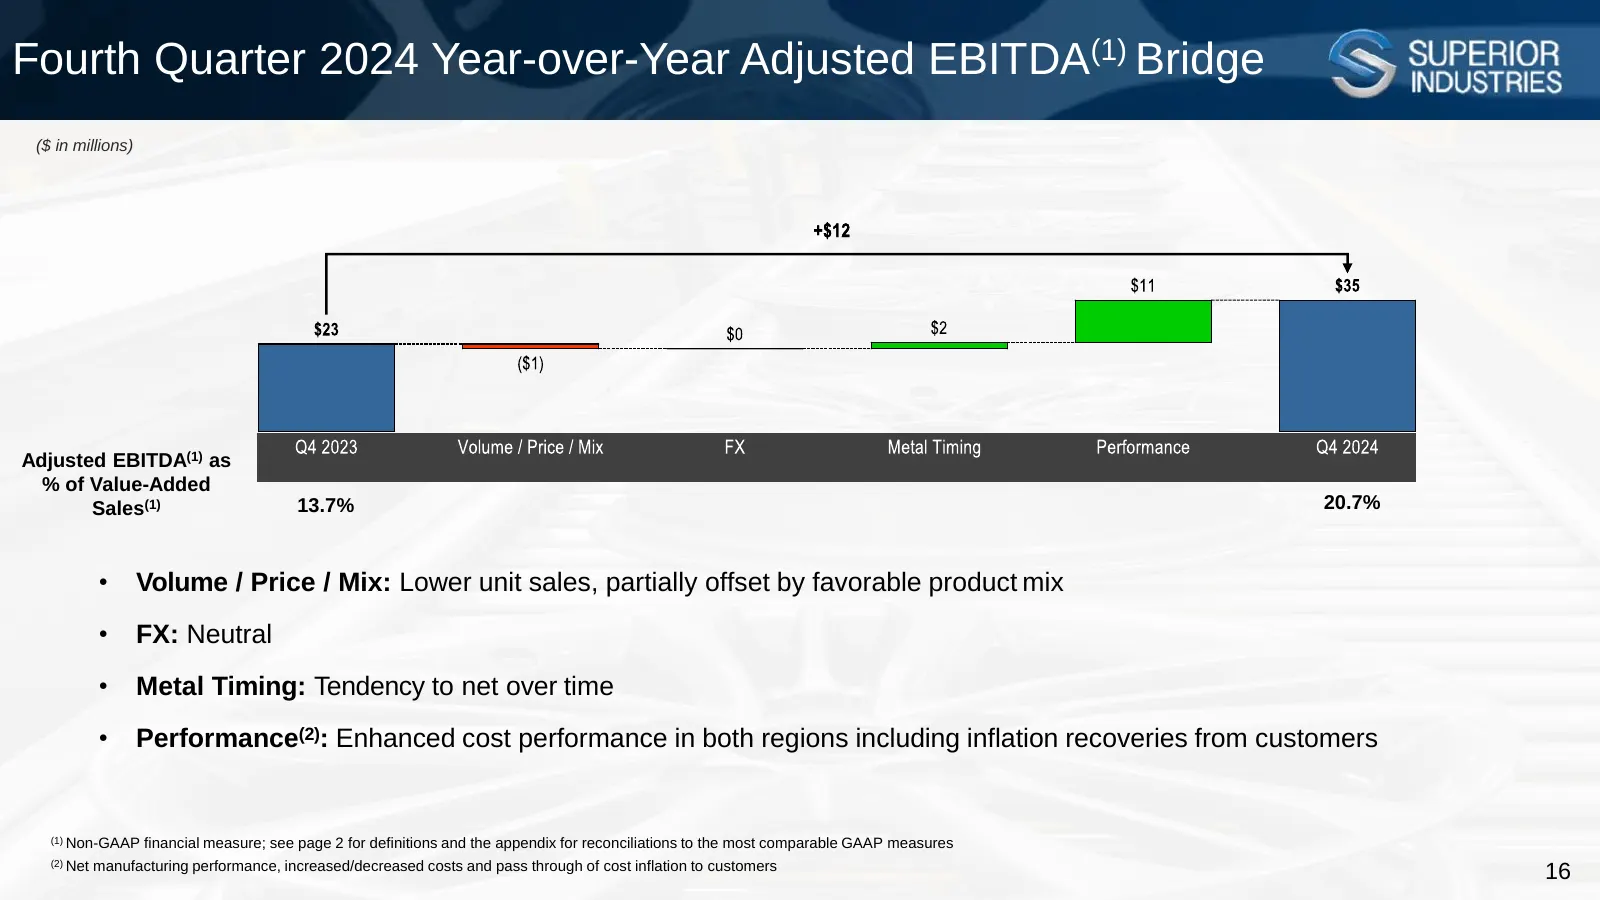
Fourth Quarter 2024 Year-over-Year Adjusted EBITDA(1) Bridge ($ in millions) Adjusted EBITDA(1) as % of Value-Added Sales(1) 13.7% 20.7% • Volume / Price / Mix: Lower unit sales, partially offset by favorable product mix • FX: Neutral • Metal Timing: Tendency to net over time • Performance(2): Enhan
Slide 17: FY 2024 Year-over-Year Adjusted EBITDA Bridge
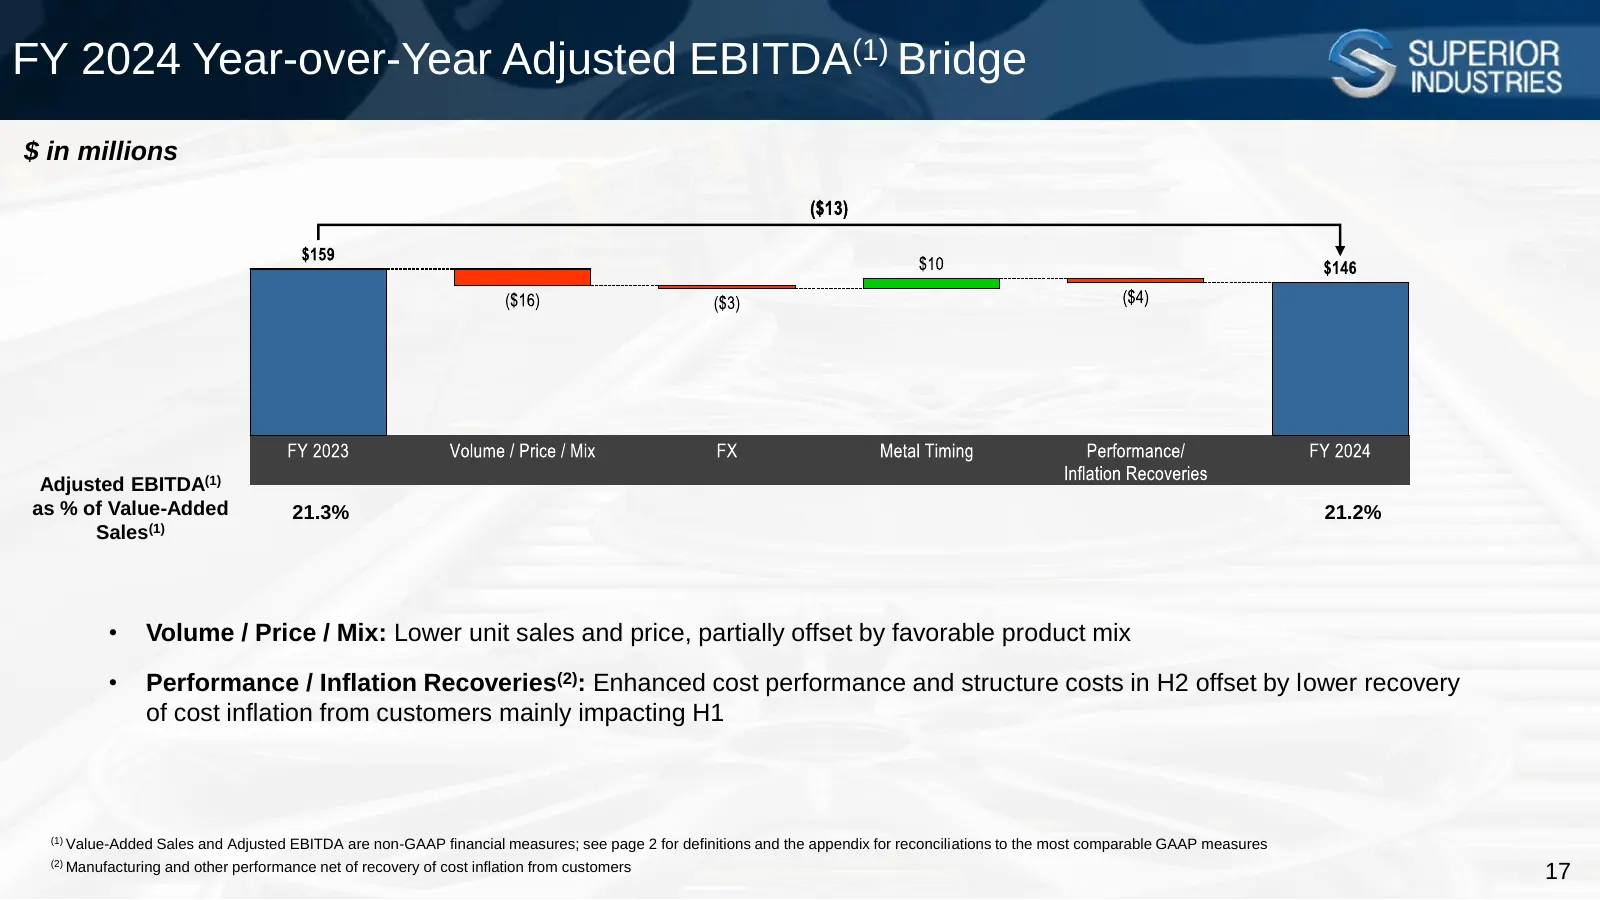
FY 2024 Year-over-Year Adjusted EBITDA(1) Bridge $ in millions Adjusted EBITDA(1) as % of Value-Added 21.3% 21.2% Sales(1) • Volume / Price / Mix: Lower unit sales and price, partially offset by favorable product mix • Performance / Inflation Recoveries(2): Enhanced cost performance and structure co
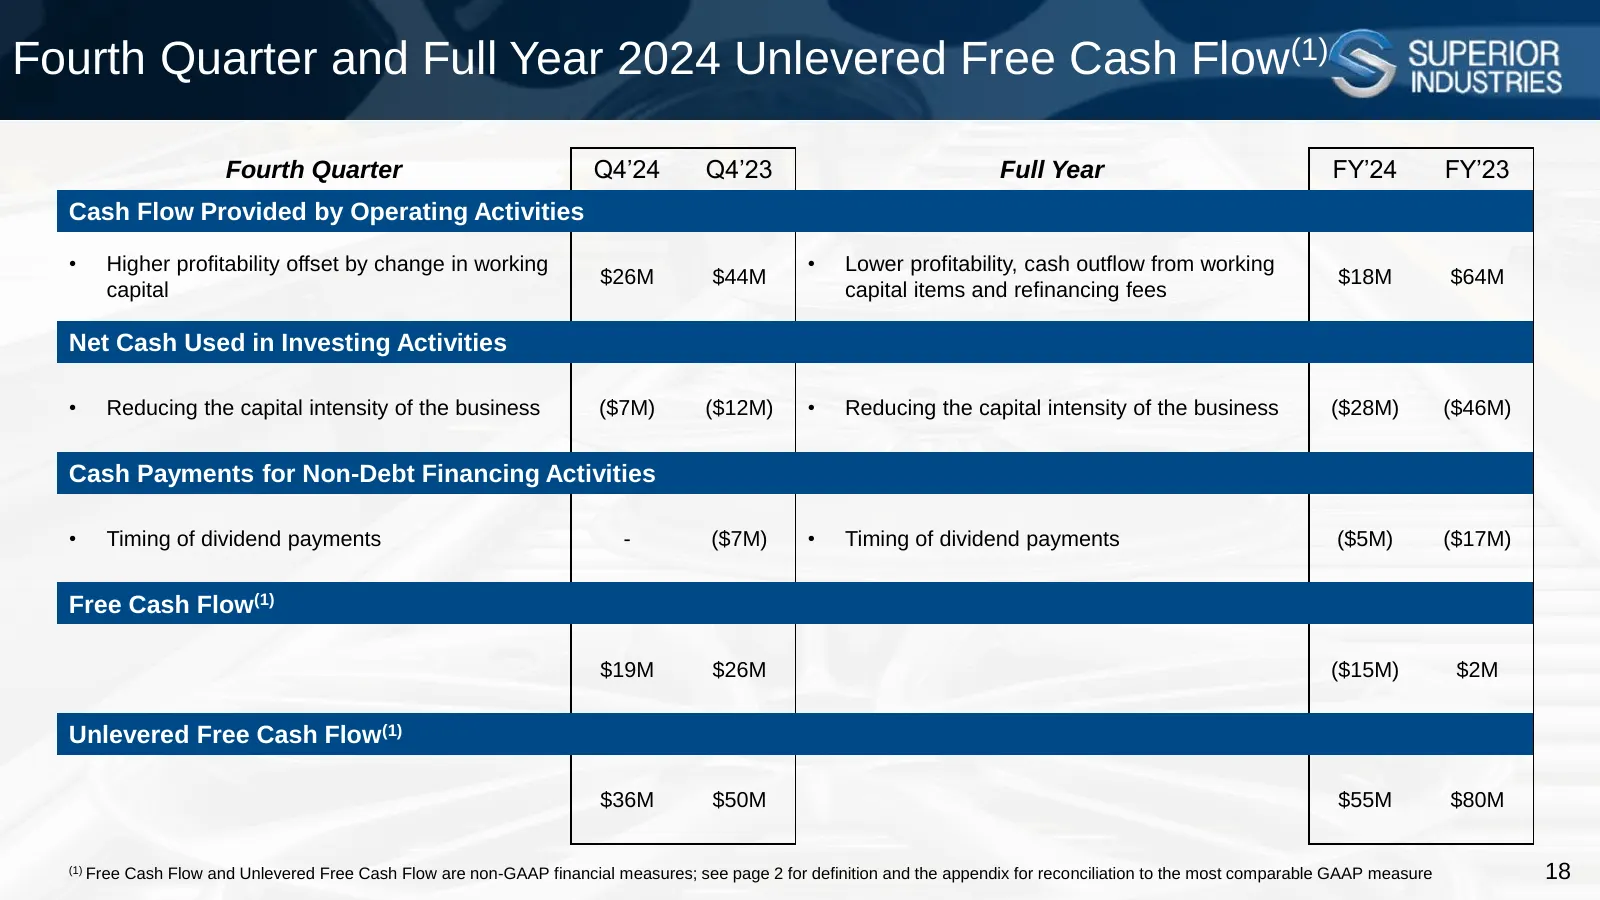
Slide 18: Fourth Quarter and Full Year 2024 Unlevered Free Cash Flow
Fourth Quarter and Full Year 2024 Unlevered Free Cash Flow(1) Fourth Quarter Q4’24 Q4’23 Full Year FY’24 FY’23 Cash Flow Provided by Operating Activities • Higher profitability offset by change in working • Lower profitability, cash outflow from working $26M $44M $18M $64M capital capital items and
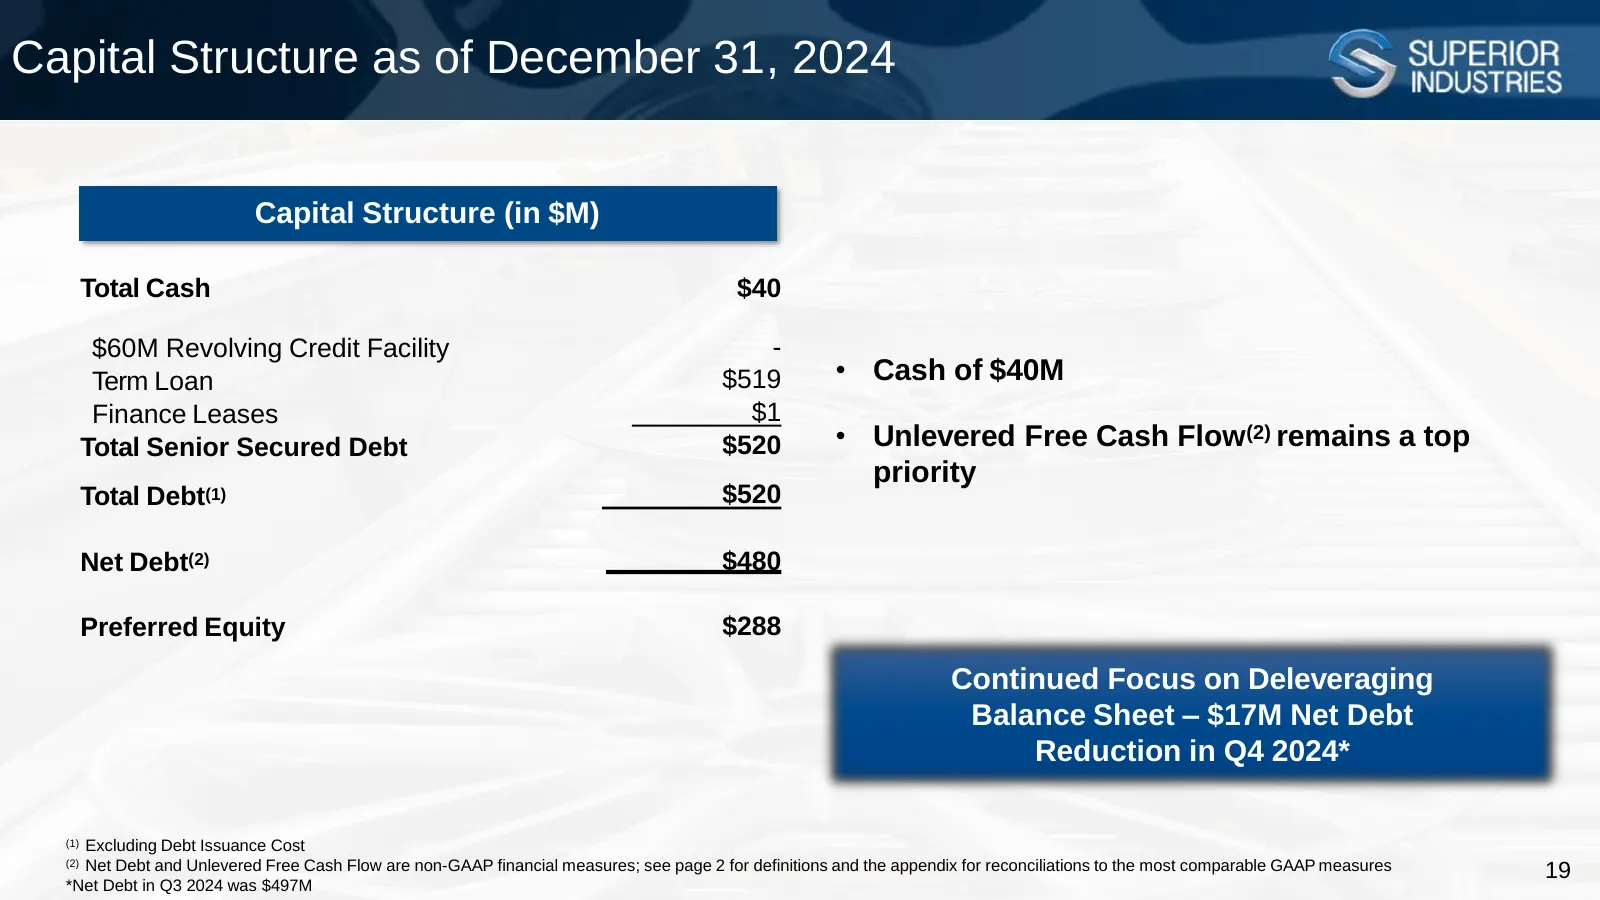
Slide 19: Capital Structure as of December 31, 2024
Capital Structure as of December 31, 2024 Capital Structure (in $M) Total Cash $40 $60M Revolving Credit Facility - Term Loan $519 • Cash of $40M Finance Leases $1 Total Senior Secured Debt $520 • Unlevered Free Cash Flow(2) remains a top priority Total Debt(1) $520 Net Debt(2) $480 Preferred Equity
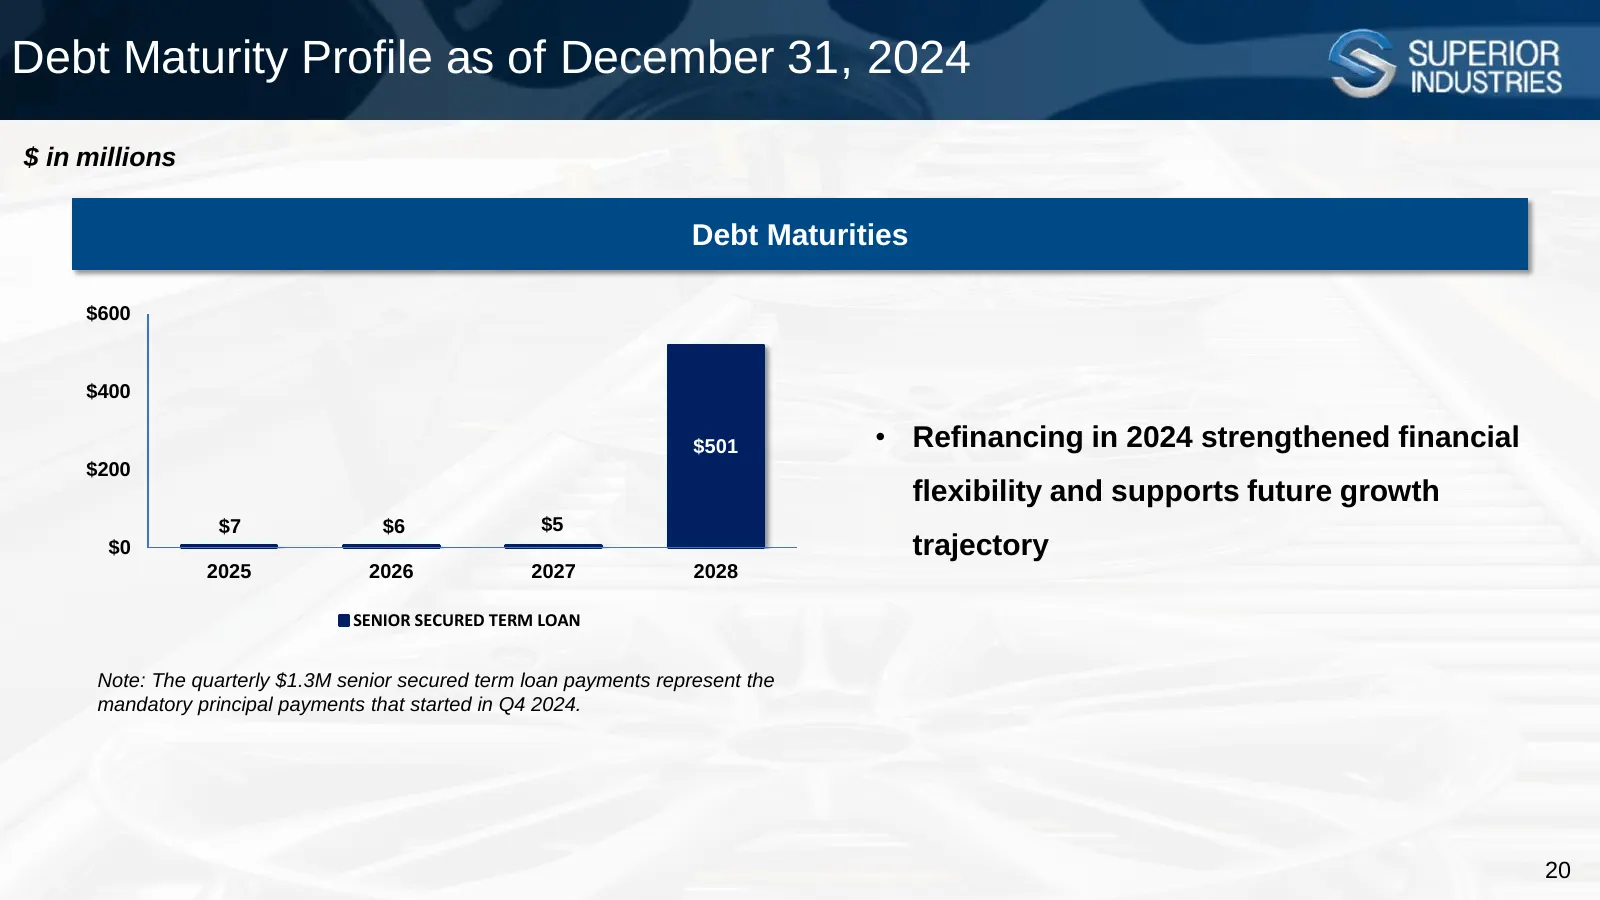
Slide 20: Debt Maturity Profile as of December 31, 2024
Debt Maturity Profile as of December 31, 2024 $ in millions Debt Maturities $600 $400 $501 • Refinancing in 2024 strengthened financial $200 flexibility and supports future growth $7 $6 $5 $0 trajectory 2025 2026 2027 2028 SENIOR SECURED TERM LOAN Note: The quarterly $1.3M senior secured term loan p
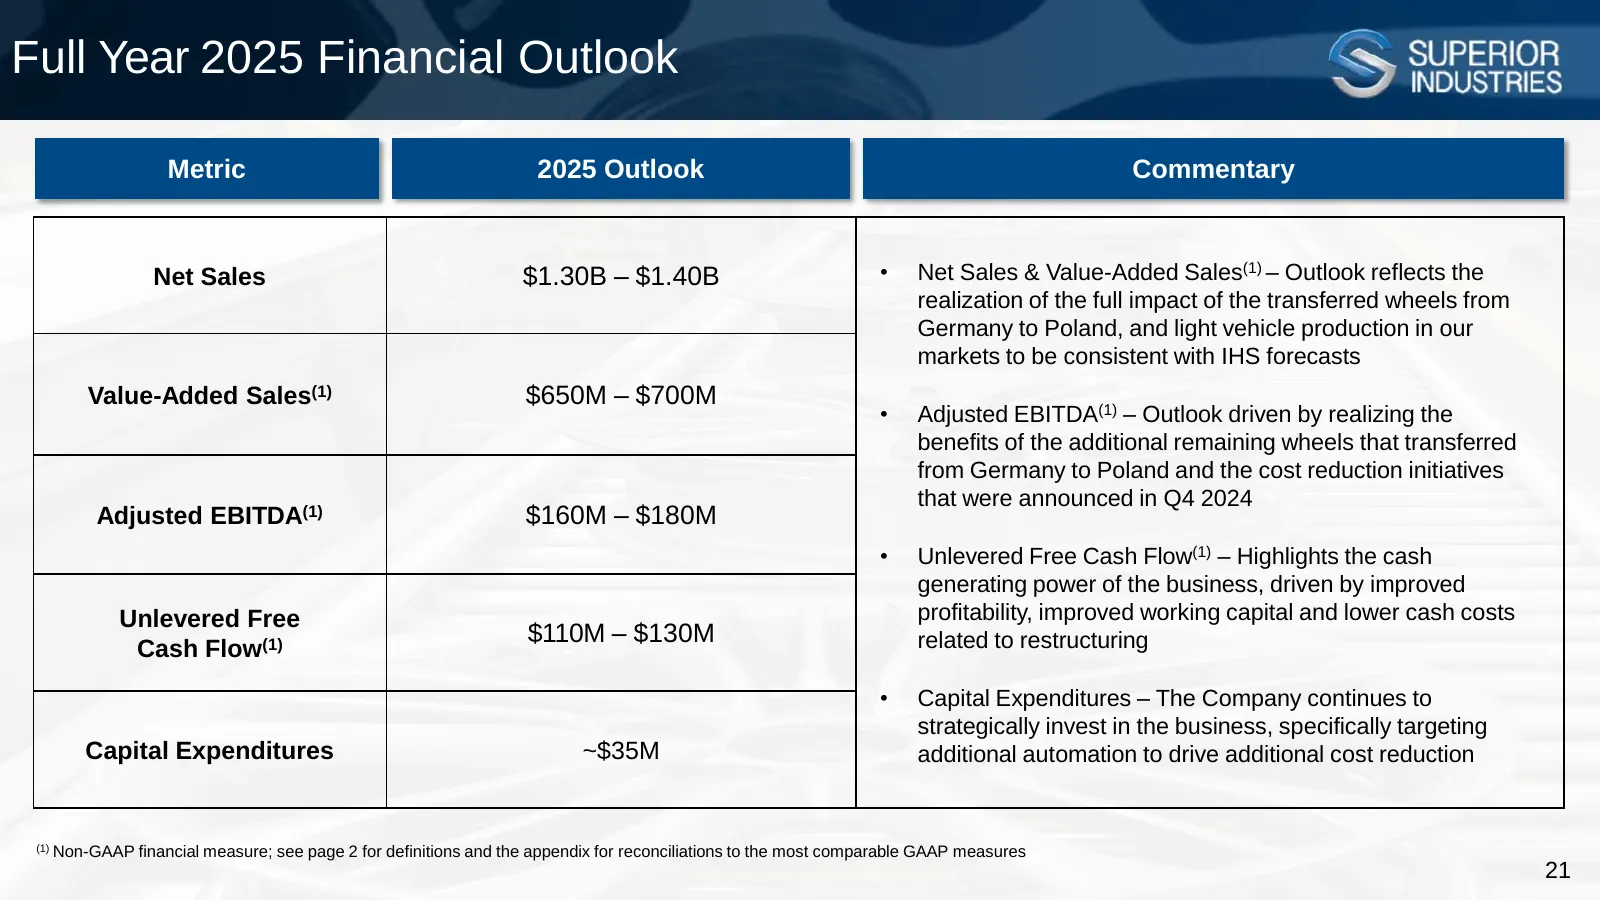
Slide 21: Full Year 2025 Financial Outlook
Full Year 2025 Financial Outlook Metric 2025 Outlook Commentary Net Sales $1.30B – $1.40B • Net Sales & Value-Added Sales(1) – Outlook reflects the realization of the full impact of the transferred wheels from Germany to Poland, and light vehicle production in our markets to be consistent with IHS f

Slide 22: Appendix
Appendix S SLLERIOR
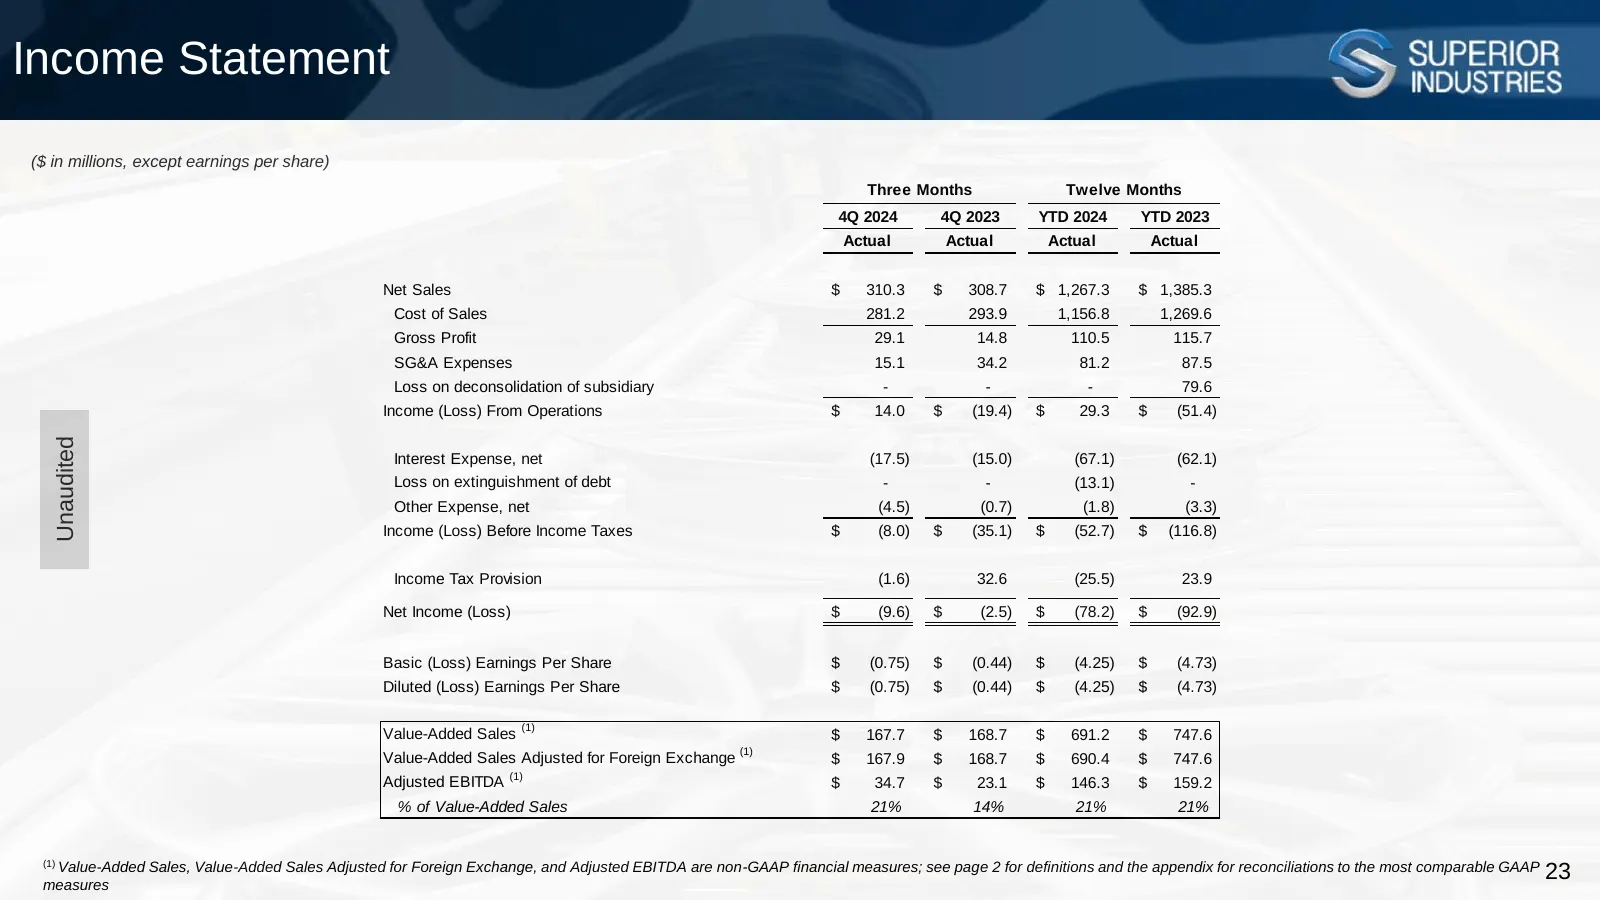
Slide 23: Income Statement
Income Statement ($ in millions, except earnings per share) Three Months Twelve Months 4Q 2024 4Q 2023 YTD 2024 YTD 2023 Actual Actual Actual Actual Net Sales $ 310.3 $ 308.7 $ 1,267.3 $ 1,385.3 Cost of Sales 281.2 293.9 1,156.8 1,269.6 Gross Profit 29.1 14.8 110.5 115.7 SG&A Expenses 15.1 34.2 81.2
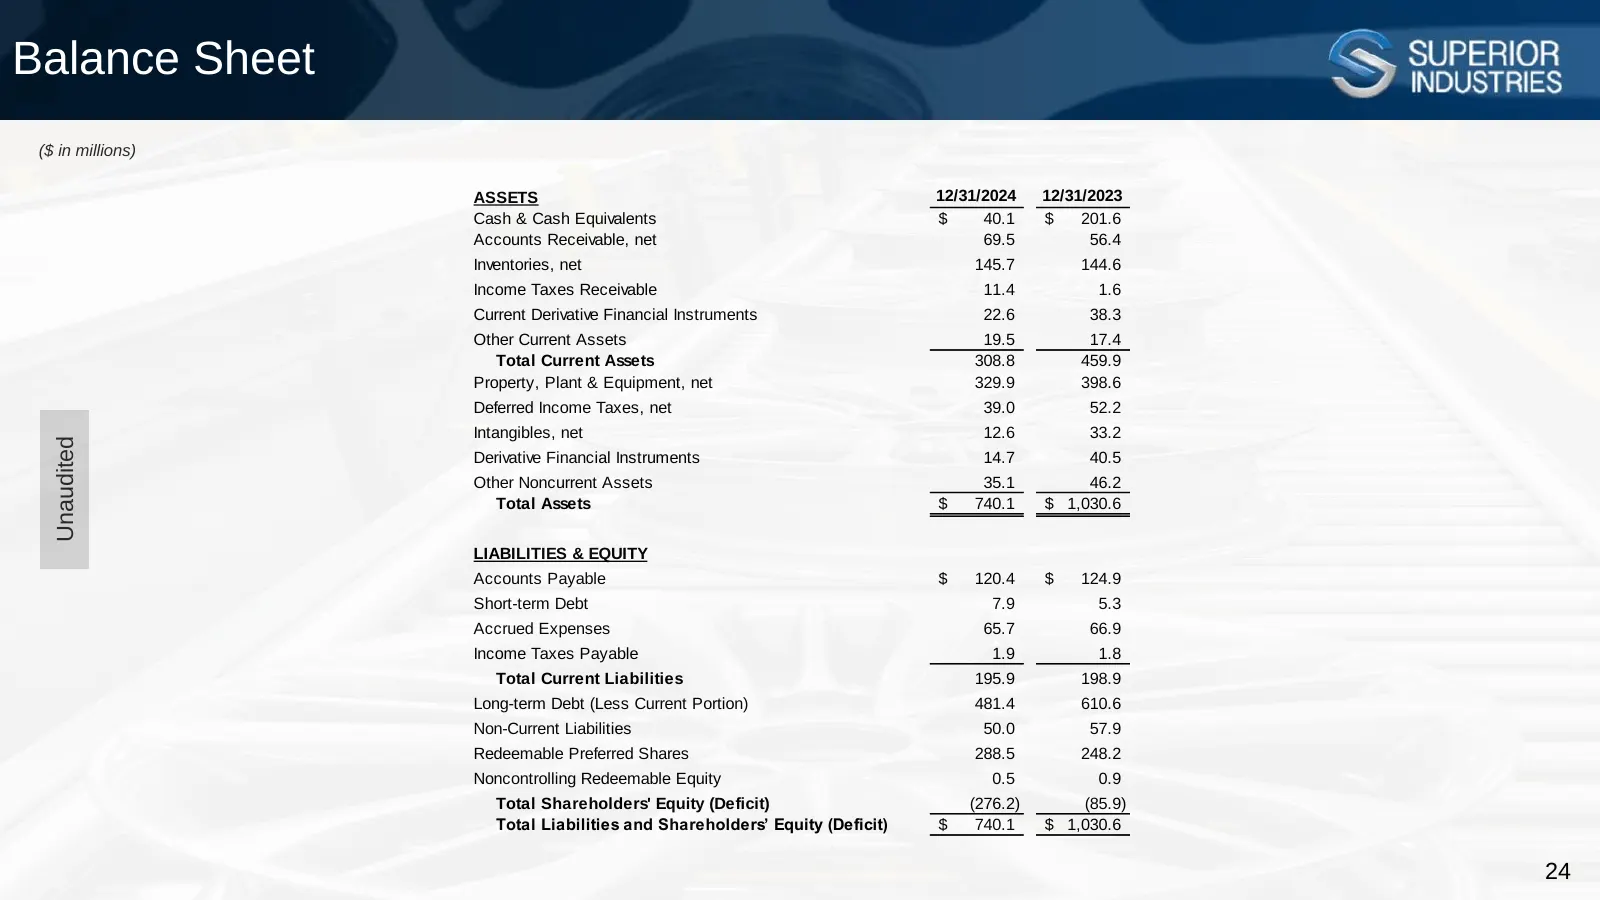
Slide 24: Balance Sheet
Balance Sheet ($ in millions) ASSETS 12/31/2024 12/31/2023 Cash & Cash Equivalents $ 40.1 $ 201.6 Accounts Receivable, net 69.5 56.4 Inventories, net 145.7 144.6 Income Taxes Receivable 11.4 1.6 Current Derivative Financial Instruments 22.6 38.3 Other Current Assets 19.5 17.4 Total Current Assets 30
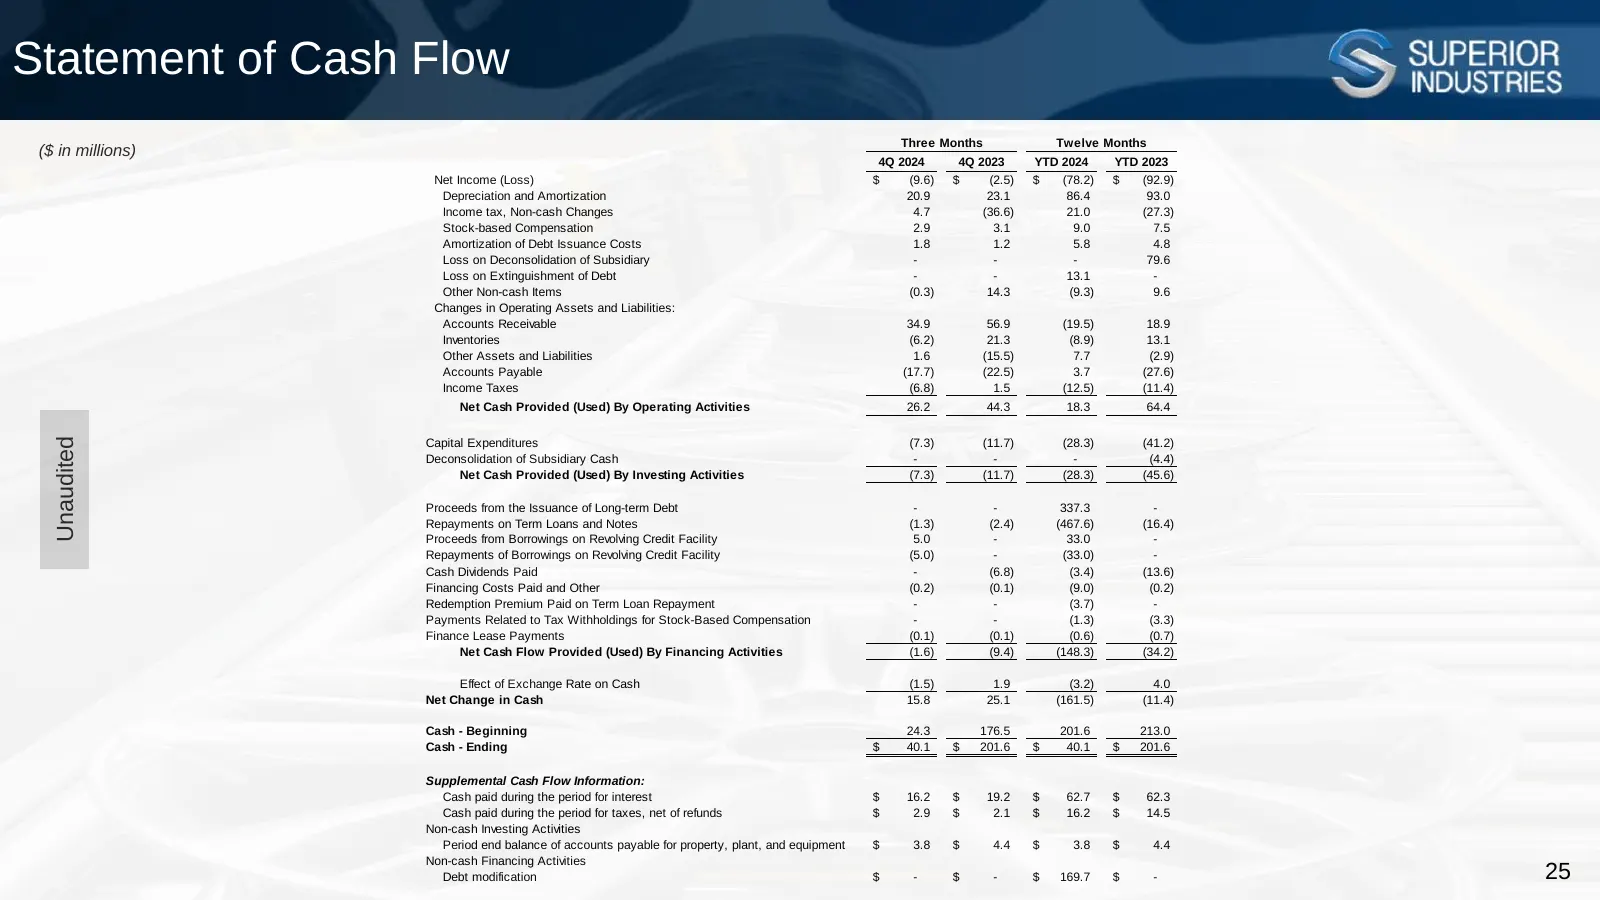
Slide 25: Statement of Cash Flow
Statement of Cash Flow Three Months Twelve Months ($ in millions) 4Q 2024 4Q 2023 YTD 2024 YTD 2023 Net Income (Loss) $ (9.6) $ (2.5) $ (78.2) $ (92.9) Depreciation and Amortization 20.9 23.1 86.4 93.0 Income tax, Non-cash Changes 4.7 (36.6) 21.0 (27.3) Stock-based Compensation 2.9 3.1 9.0 7.5 Amort
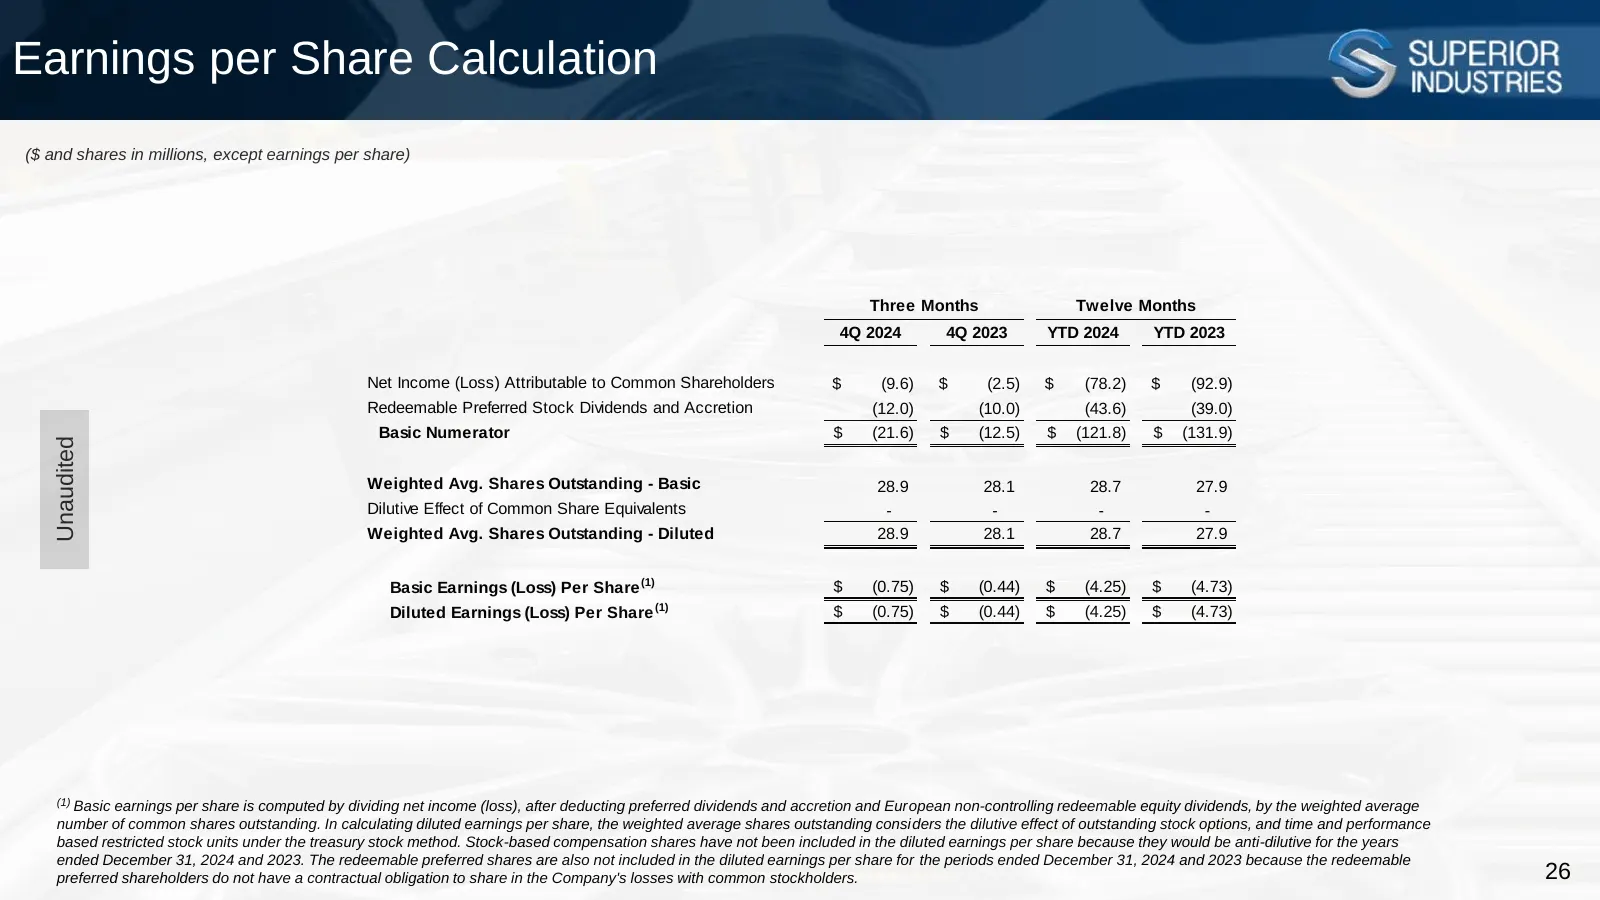
Slide 26: Earnings per Share Calculation
Earnings per Share Calculation ($ and shares in millions, except earnings per share) Three Months Twelve Months 4Q 2024 4Q 2023 YTD 2024 YTD 2023 Net Income (Loss) Attributable to Common Shareholders $ (9.6) $ (2.5) $ (78.2) $ (92.9) Redeemable Preferred Stock Dividends and Accretion (12.0) (10.0) (
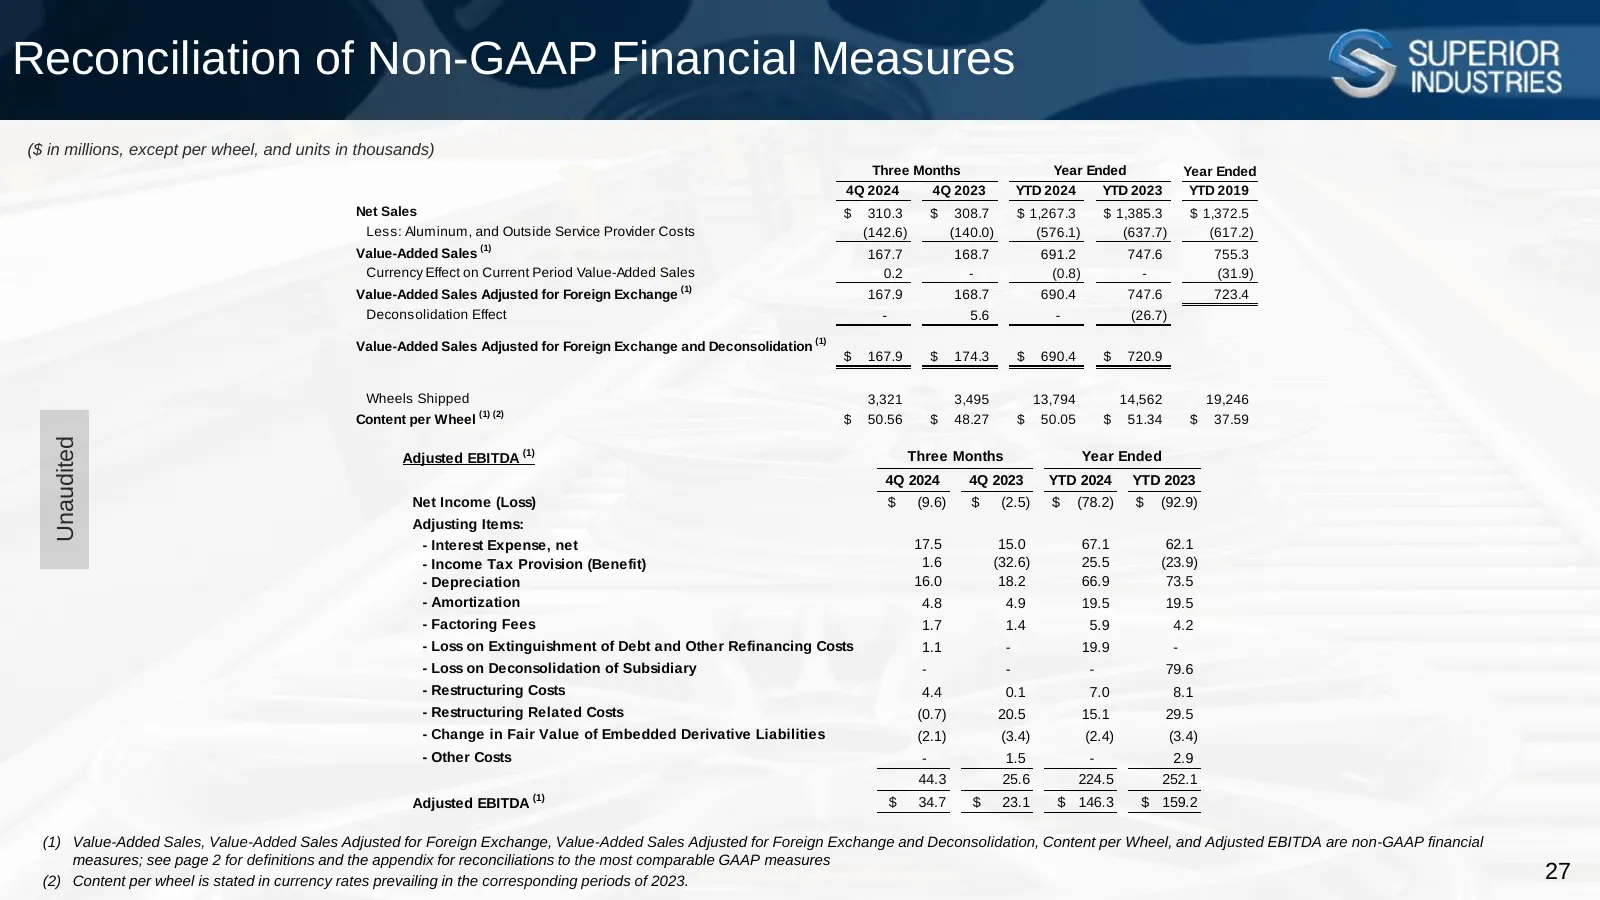
Slide 27: Reconciliation of Non-GAAP Financial Measures
Reconciliation of Non-GAAP Financial Measures ($ in millions, except per wheel, and units in thousands) Three Months Year Ended Year Ended 4Q 2024 4Q 2023 YTD 2024 YTD 2023 YTD 2019 Net Sales $ 310.3 $ 308.7 $ 1,267.3 $ 1,385.3 $ 1,372.5 Less: Aluminum, and Outside Service Provider Costs (142.6) (14
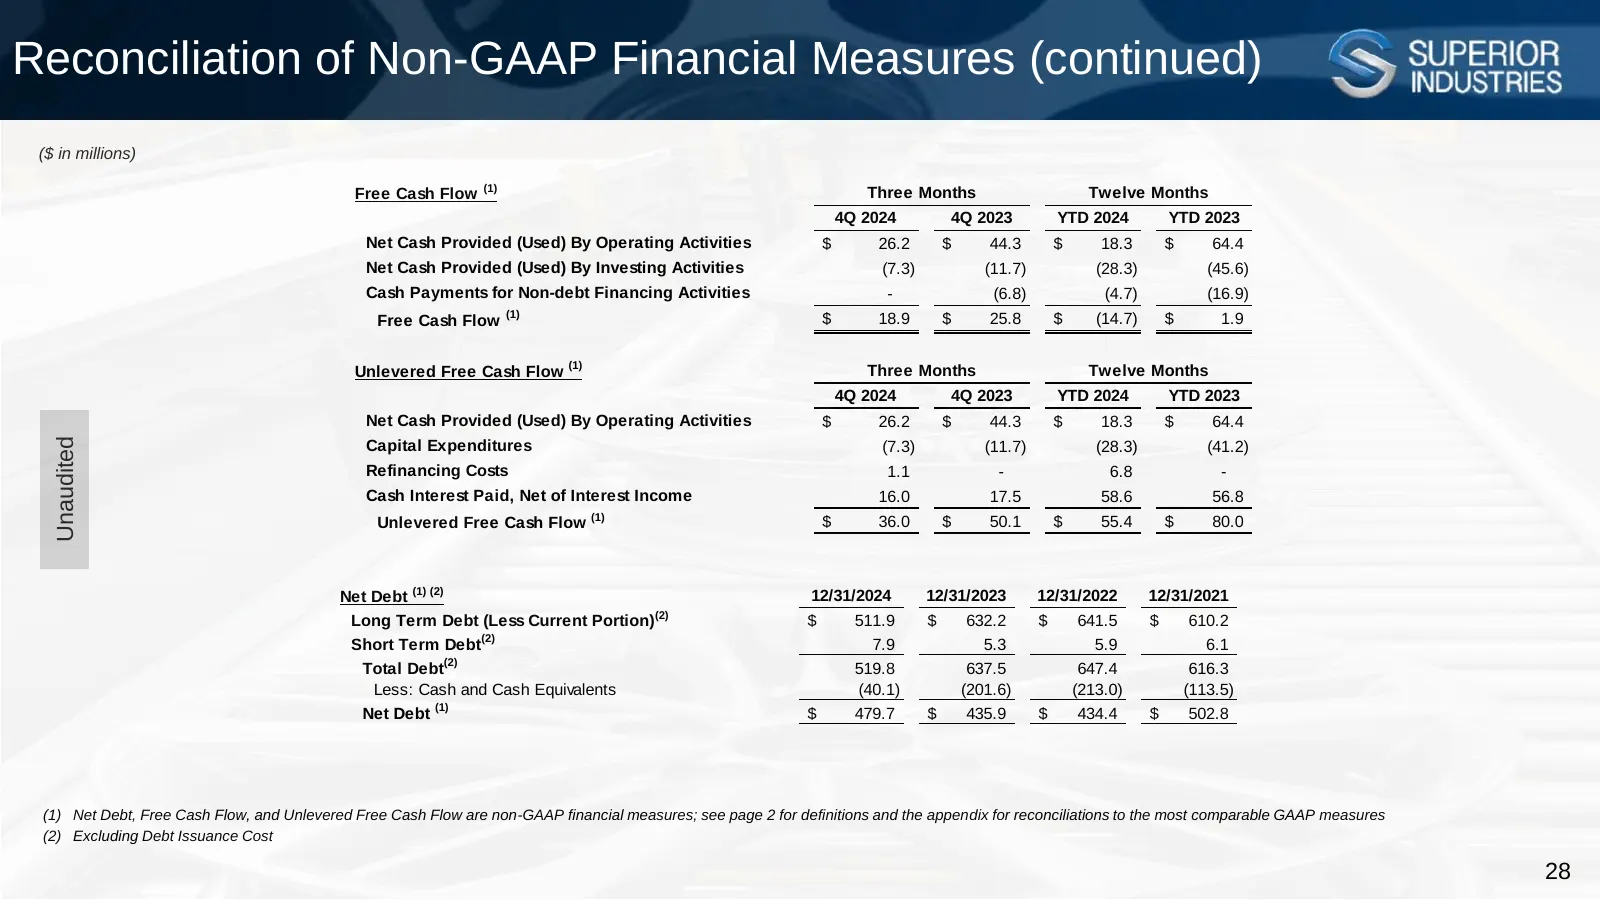
Slide 28: Reconciliation of Non-GAAP Financial Measures (continued)
Reconciliation of Non-GAAP Financial Measures (continued) ($ in millions) Free Cash Flow (1) Three Months Twelve Months 4Q 2024 4Q 2023 YTD 2024 YTD 2023 Net Cash Provided (Used) By Operating Activities $ 26.2 $ 44.3 $ 18.3 $ 64.4 Net Cash Provided (Used) By Investing Activities (7.3) (11.7) (28.3)
Source: EarningsCall slides
More decks from Superior Industries International
 Q1 2025 Earnings Presentation22 slides · May 12, 2025
 Q3 2024 Earnings Presentation23 slides · Nov 7, 2024
 Q2 2024 Earnings Presentation26 slides · Aug 8, 2024
 Q1 2024 Earnings Presentation28 slides · May 2, 2024
 FY2023 Earnings Presentation35 slides · Mar 7, 2024
 Q3 2023 Earnings Presentation26 slides · Nov 1, 2023