Inland Real Estate — Investor Presentation (November 2012)
23 slides from Inland Real Estate's investor presentation, Nov 13, 2012

Slide 1: Investor Presentation Third Quarter 2012
Investor Presentation Third Quarter 2012 www.inlandrealestate.com NYSE: IRC November 2012
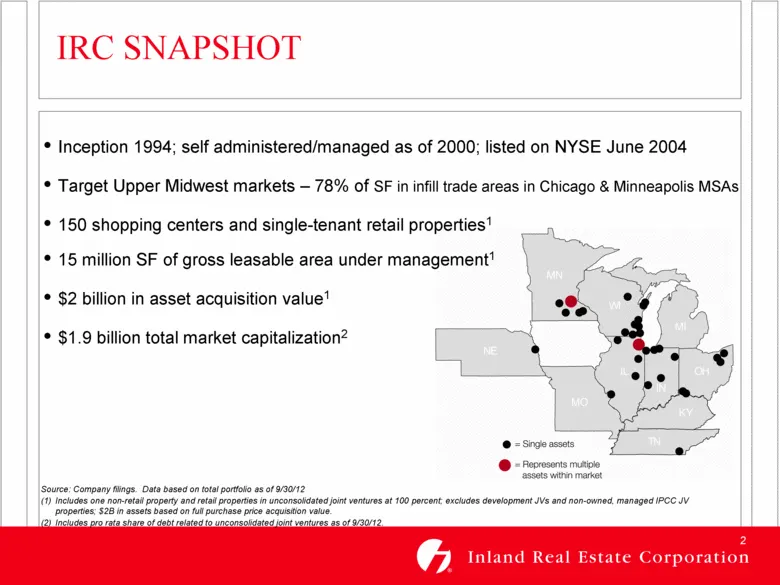
Slide 2: IRC Snapshot
IRC SNAPSHOT Source: Company filings. Data based on total portfolio as of 9/30/12 (1) Includes one non-retail property and retail properties in unconsolidated joint ventures at 100 percent; excludes development JVs and non-owned, managed IPCC JV properties; $2B in assets based on full purchase price
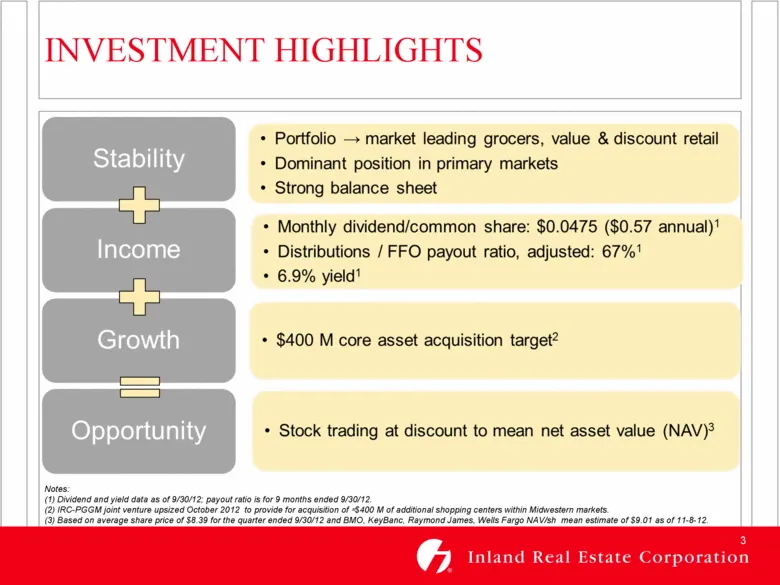
Slide 3: Investment Highlights
INVESTMENT HIGHLIGHTS Notes: (1) Dividend and yield data as of 9/30/12; payout ratio is for 9 months ended 9/30/12. (2) IRC-PGGM joint venture upsized October 2012 to provide for acquisition of ≈$400 M of additional shopping centers within Midwestern markets. (3) Based on average share price of $8.3
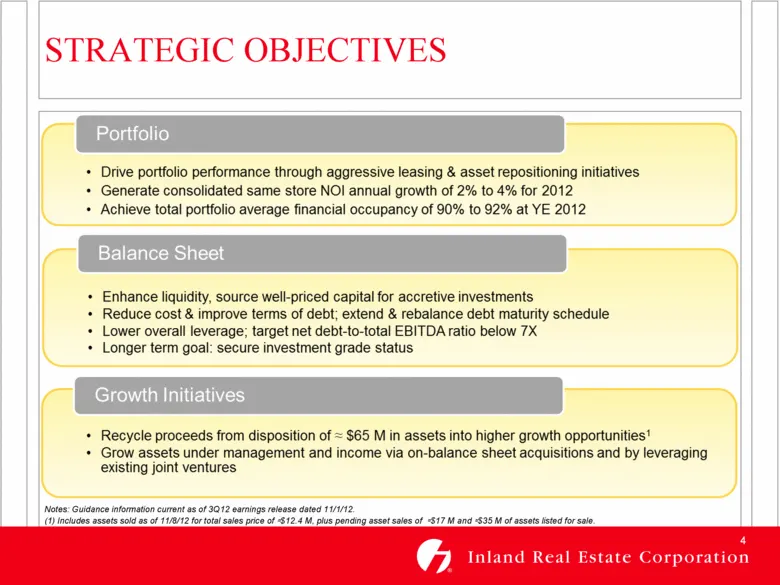
Slide 4: Strategic Objectives
STRATEGIC OBJECTIVES Notes: Guidance information current as of 3Q12 earnings release dated 11/1/12. (1) Includes assets sold as of 11/8/12 for total sales price of ≈$12.4 M, plus pending asset sales of ≈$17 M and ≈$35 M of assets listed for sale. Portfolio Drive portfolio performance through aggress
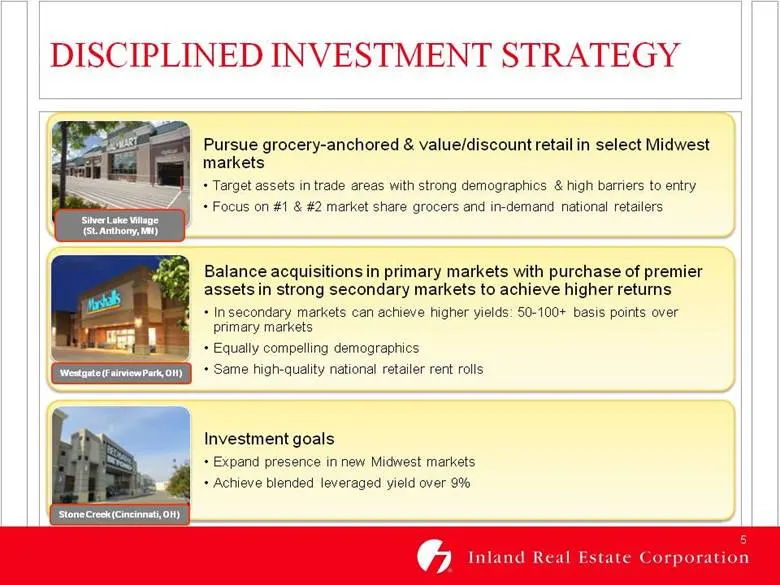
Slide 5: Disciplined Investment Strategy
DISCIPLINED INVESTMENT STRATEGY Silver Lake Village (St. Anthony, MN) Westgate (Fairview Park, OH) Stone Creek (Cincinnati, OH) Pursue grocery-anchored & value/discount retail in select Midwest markets Target assets in trade areas with strong demographics & high barriers to entry Focus on #1 & #2 ma
Slide 6: High Quality, Stable Portfolio
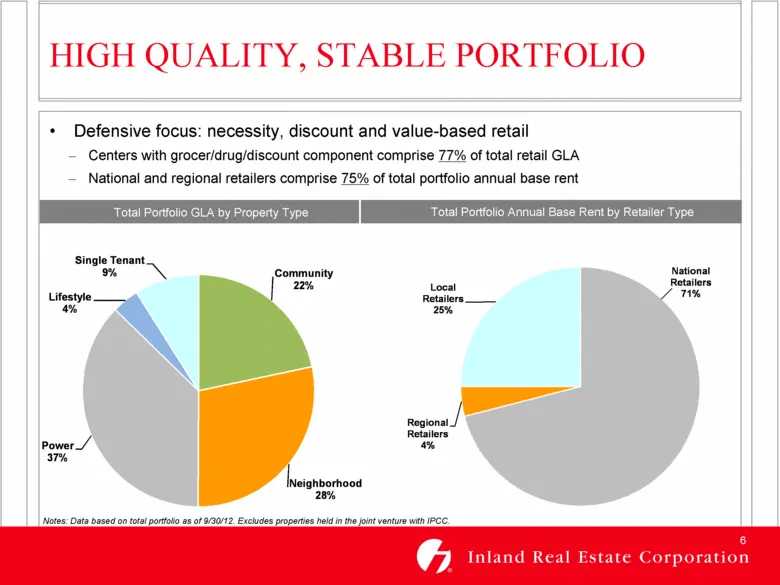
HIGH QUALITY, STABLE PORTFOLIO Notes: Data based on total portfolio as of 9/30/12. Excludes properties held in the joint venture with IPCC. Total Portfolio GLA by Property Type Total Portfolio Annual Base Rent by Retailer Type Defensive focus: necessity, discount and value-based retail Centers with
Slide 7: Diversified Tenant Base
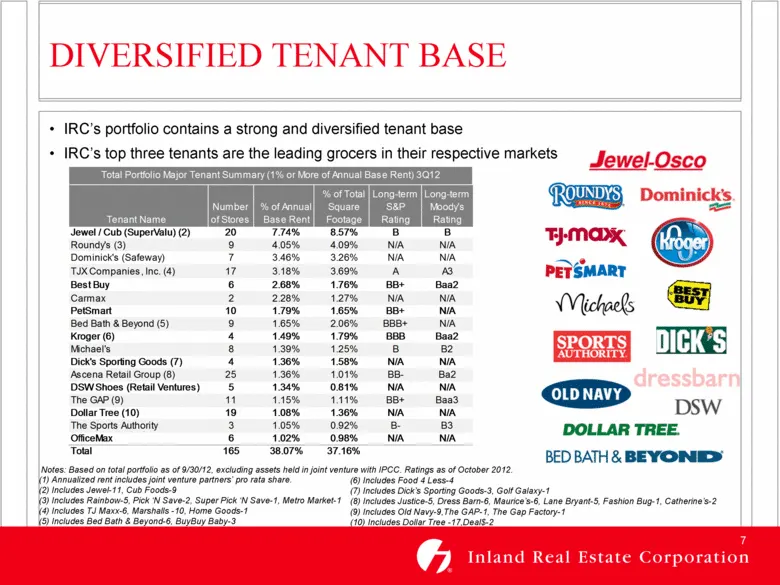
(6) Includes Food 4 Less-4 (7) Includes Dick’s Sporting Goods-3, Golf Galaxy-1 (8) Includes Justice-5, Dress Barn-6, Maurice’s-6, Lane Bryant-5, Fashion Bug-1, Catherine’s-2 (9) Includes Old Navy-9,The GAP-1, The Gap Factory-1 (10) Includes Dollar Tree -17,Deal$-2 DIVERSIFIED TENANT BASE IRC’s portf
Slide 8: Strong Market Demographics
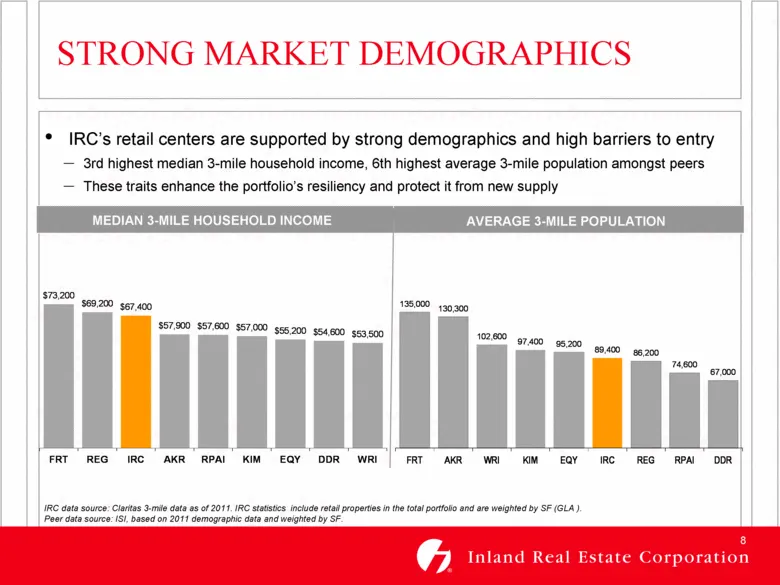
STRONG MARKET DEMOGRAPHICS IRC’s retail centers are supported by strong demographics and high barriers to entry 3rd highest median 3-mile household income, 6th highest average 3-mile population amongst peers These traits enhance the portfolio’s resiliency and protect it from new supply MEDIAN 3-MILE
Slide 9: Primary Markets: Greater Chicago and Minneapolis-St. Paul
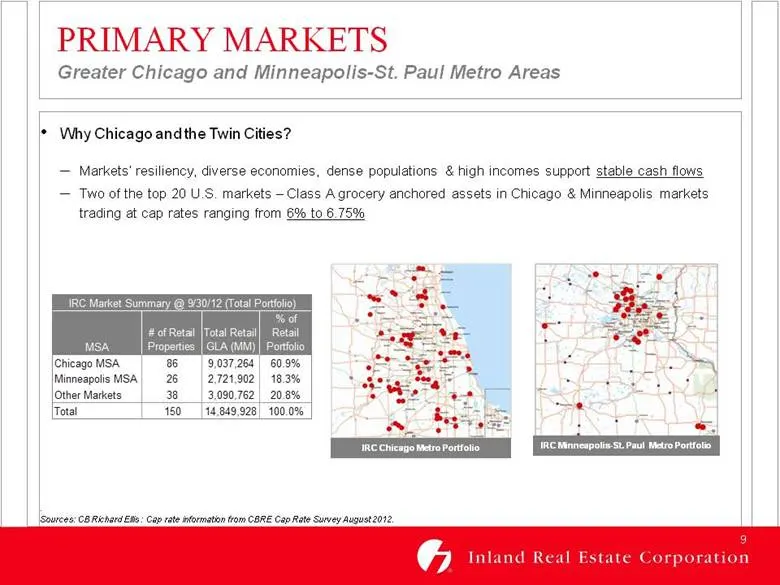
PRIMARY MARKETS Greater Chicago and Minneapolis-St. Paul Metro Areas Sources: CB Richard Ellis : Cap rate information from CBRE Cap Rate Survey August 2012. Why Chicago and the Twin Cities? Markets’ resiliency, diverse economies, dense populations & high incomes support stable cash flows Two of the
Slide 10: Dominant REIT in Primary Markets
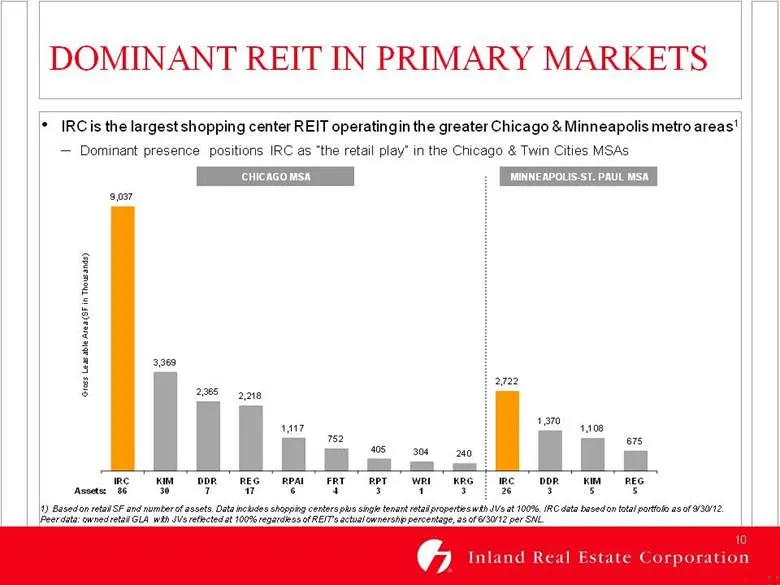
Assets: DOMINANT REIT IN PRIMARY MARKETS IRC is the largest shopping center REIT operating in the greater Chicago & Minneapolis metro areas1 Dominant presence positions IRC as “the retail play” in the Chicago & Twin Cities MSAs 1) Based on retail SF and number of assets. Data includes shopping cente
Slide 11: Successful Business Model
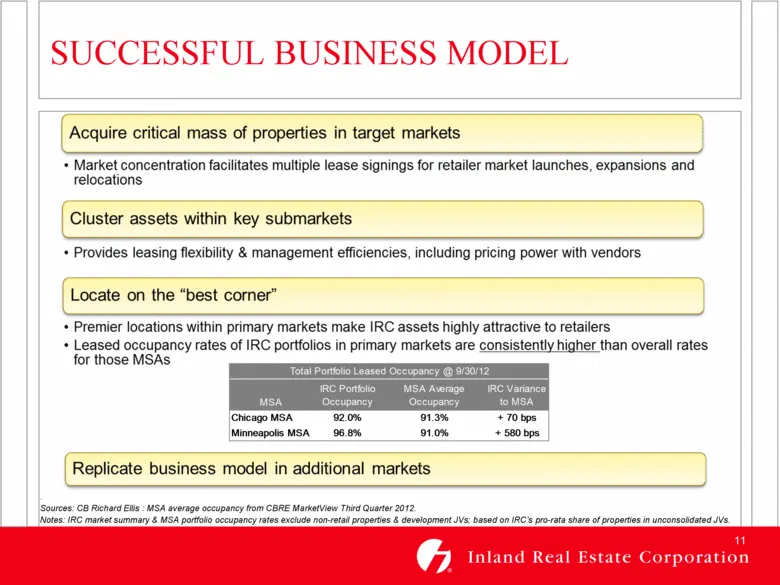
Sources: CB Richard Ellis : MSA average occupancy from CBRE MarketView Third Quarter 2012. Notes: IRC market summary & MSA portfolio occupancy rates exclude non-retail properties & development JVs; based on IRC’s pro-rata share of properties in unconsolidated JVs. SUCCESSFUL BUSINESS MODEL MSA IRC P
Slide 12: Leasing Efficiencies
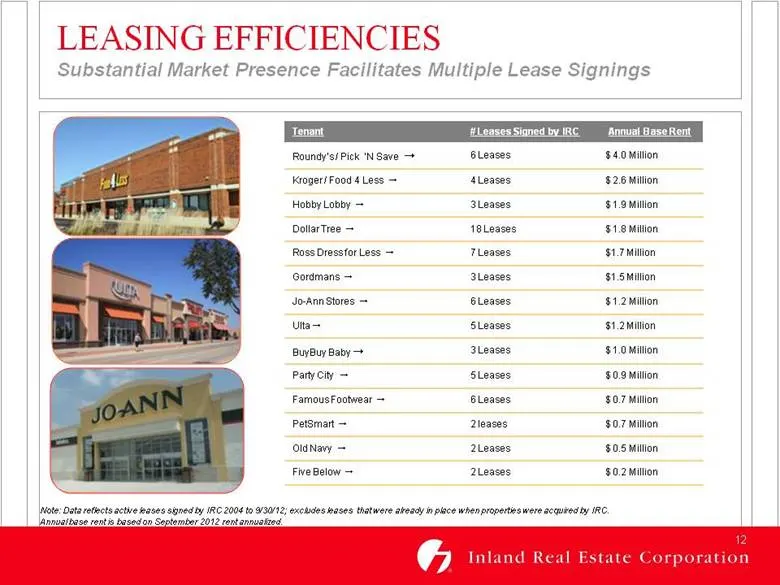
Tenant # Leases Signed by IRC Annual Base Rent Roundy’s / Pick ‘N Save 6 Leases $ 4.0 Million Kroger / Food 4 Less 4 Leases $ 2.6 Million Hobby Lobby 3 Leases $ 1.9 Million Dollar Tree 18 Leases $ 1.8 Million Ross Dress for Less 7 Leases $1.7 Million Gordmans 3 Leases $1.5 Million Jo-Ann Stores 6 Le
Slide 13: Operating Fundamentals: Positive Leasing Spreads
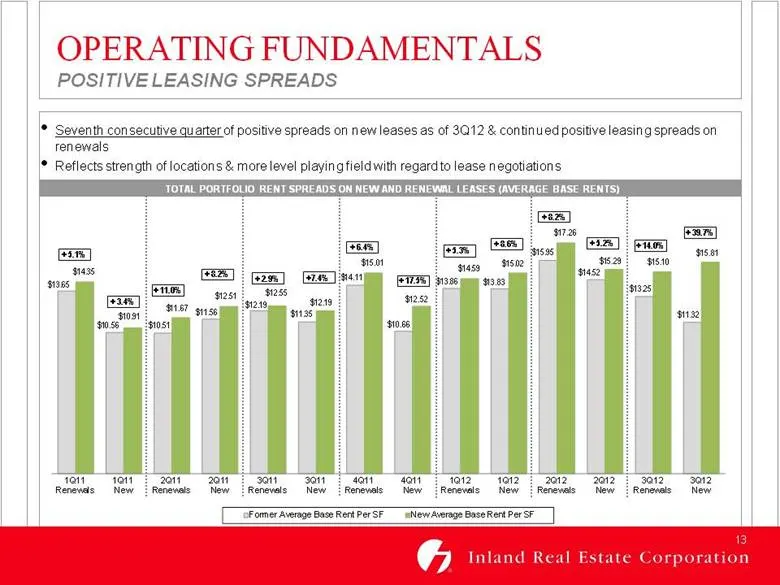
Seventh consecutive quarter of positive spreads on new leases as of 3Q12 & continued positive leasing spreads on renewals Reflects strength of locations & more level playing field with regard to lease negotiations TOTAL PORTFOLIO RENT SPREADS ON NEW AND RENEWAL LEASES (AVERAGE BASE RENTS) OPERATING
Slide 14: Same Store NOI Growth
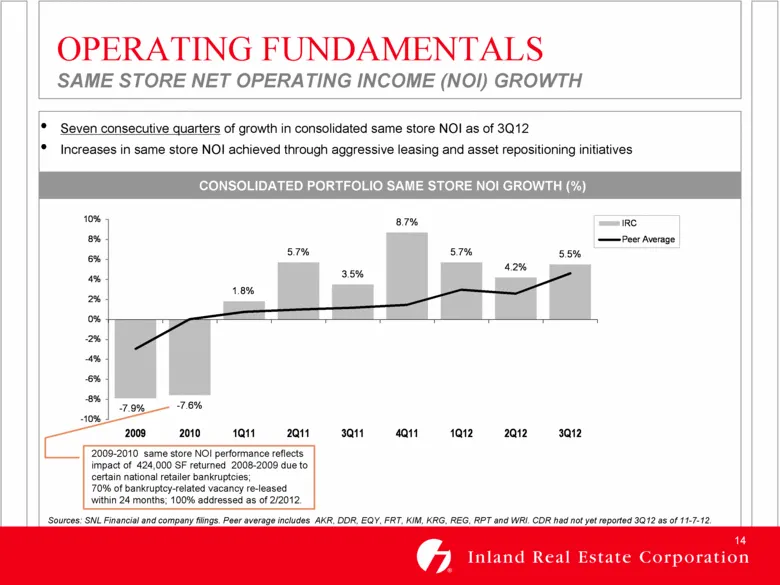
Seven consecutive quarters of growth in consolidated same store NOI as of 3Q12 Increases in same store NOI achieved through aggressive leasing and asset repositioning initiatives CONSOLIDATED PORTFOLIO SAME STORE NOI GROWTH (%) OPERATING FUNDAMENTALS SAME STORE NET OPERATING INCOME (NOI) GROWTH Sour
Slide 15: Recent Asset Redevelopment Projects – Case Studies
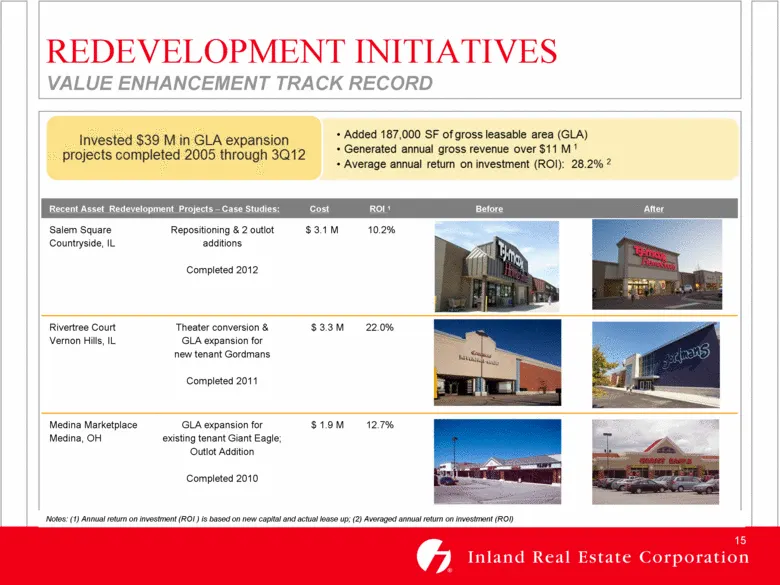
Recent Asset Redevelopment Projects – Case Studies: Cost ROI 1 Before After Salem Square Countryside, IL Repositioning & 2 outlot additions Completed 2012 $ 3.1 M 10.2% Rivertree Court Vernon Hills, IL Theater conversion & GLA expansion for new tenant Gordmans Completed 2011 $ 3.3 M 22.0% Medina Mar
Slide 16: Joint Venture Growth Strategies
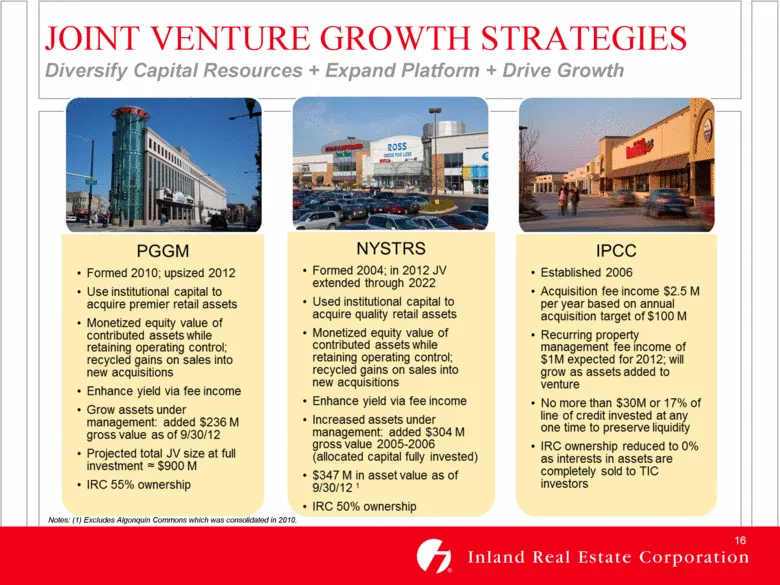
JOINT VENTURE GROWTH STRATEGIES Diversify Capital Resources + Expand Platform + Drive Growth Notes: (1) Excludes Algonquin Commons which was consolidated in 2010. PGGM Formed 2010; upsized 2012 Use institutional capital to acquire premier retail assets Monetized equity value of contributed assets wh
Slide 17: Joint Venture Fee Income
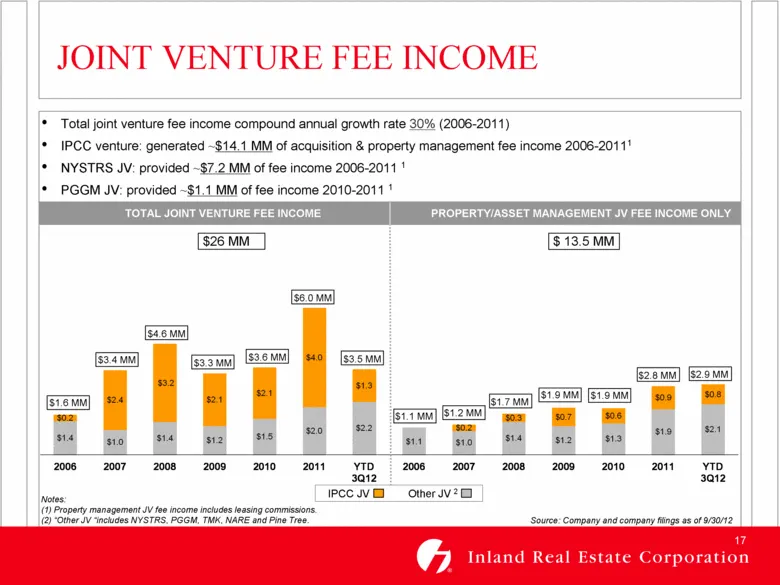
$3.4 MM $3.3 MM $1.6 MM $4.6 MM $3.6 MM $6.0 MM $1.1 MM $1.2 MM $1.7 MM $1.9 MM $2.8 MM $1.9 MM JOINT VENTURE FEE INCOME Total joint venture fee income compound annual growth rate 30% (2006-2011) IPCC venture: generated ~$14.1 MM of acquisition & property management fee income 2006-20111 NYSTRS JV:
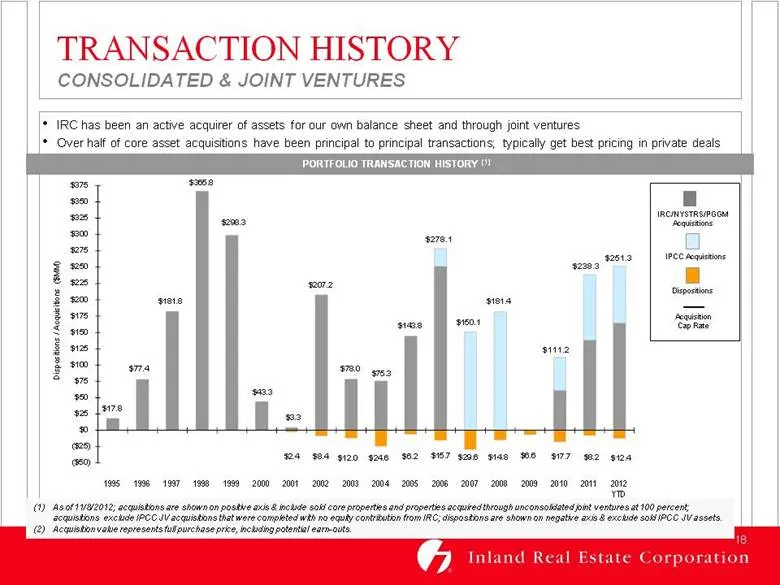
Slide 18: Portfolio Transaction History
As of 11/8/2012; acquisitions are shown on positive axis & include sold core properties and properties acquired through unconsolidated joint ventures at 100 percent; acquisitions exclude IPCC JV acquisitions that were completed with no equity contribution from IRC; dispositions are shown on negative
Slide 19: Balance Sheet Objectives
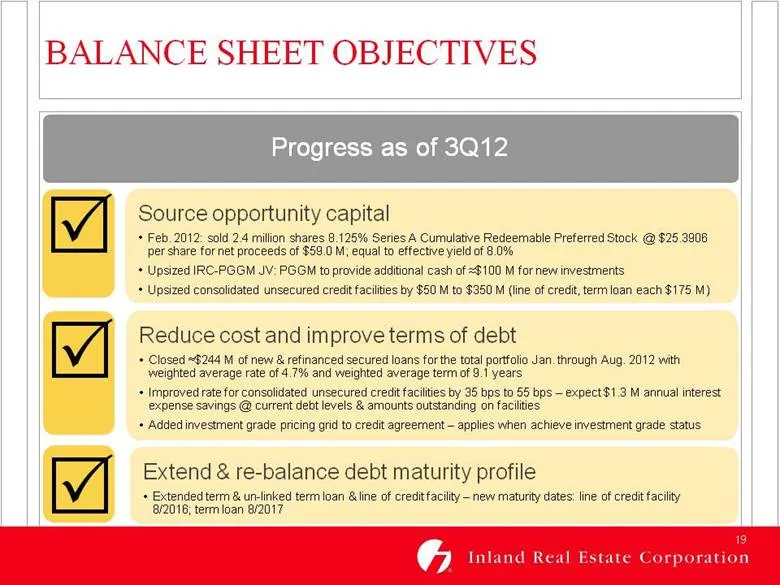
xxx BALANCE SHEET OBJECTIVES Progress as of 3Q12 Source opportunity capital Feb. 2012: sold 2.4 million shares 8.125% Series A Cumulative Redeemable Preferred Stock @ $25.3906 per share for net proceeds of $59.0 M; equal to effective yield of 8.0% Upsized IRC-PGGM JV: PGGM to provide additional cash
Slide 20: Consolidated Debt Maturities
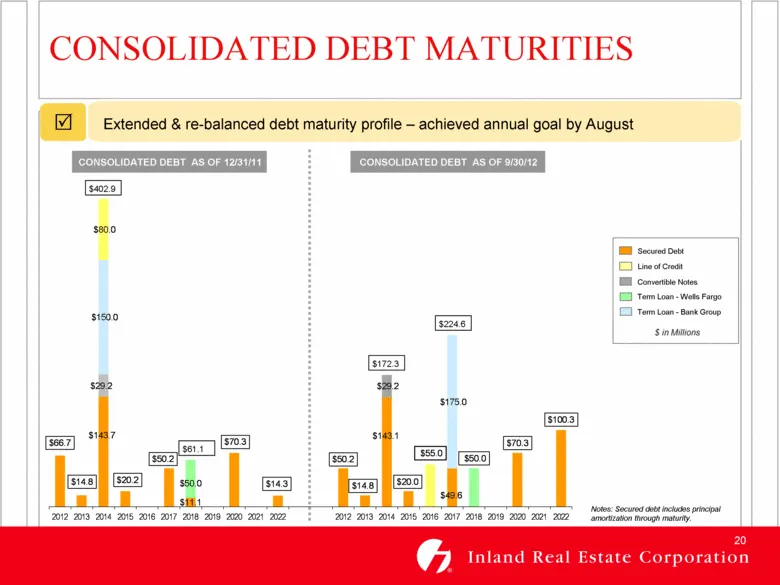
$402.9 $172.3 $61.1 $224.6 Term Loan - Bank Group Term Loan - Wells Fargo Notes: Secured debt includes principal amortization through maturity. CONSOLIDATED DEBT AS OF 9/30/12 CONSOLIDATED DEBT AS OF 12/31/11 Extended & re-balanced debt maturity profile – achieved annual goal by August CONSOLIDATED
Slide 21: Experienced Leadership Team
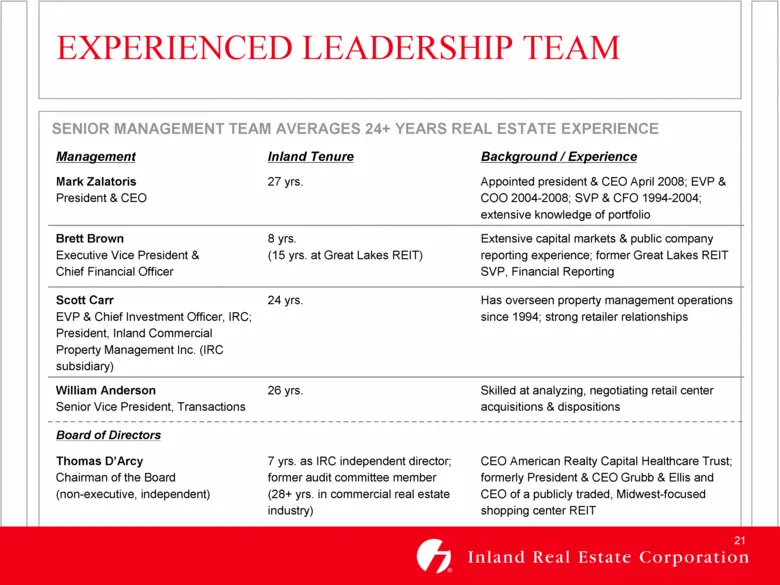
EXPERIENCED LEADERSHIP TEAM Management Inland Tenure Background / Experience Mark Zalatoris President & CEO 27 yrs. Appointed president & CEO April 2008; EVP & COO 2004-2008; SVP & CFO 1994-2004; extensive knowledge of portfolio Brett Brown Executive Vice President & Chief Financial Officer 8 yrs. (
Slide 22: IRC Today
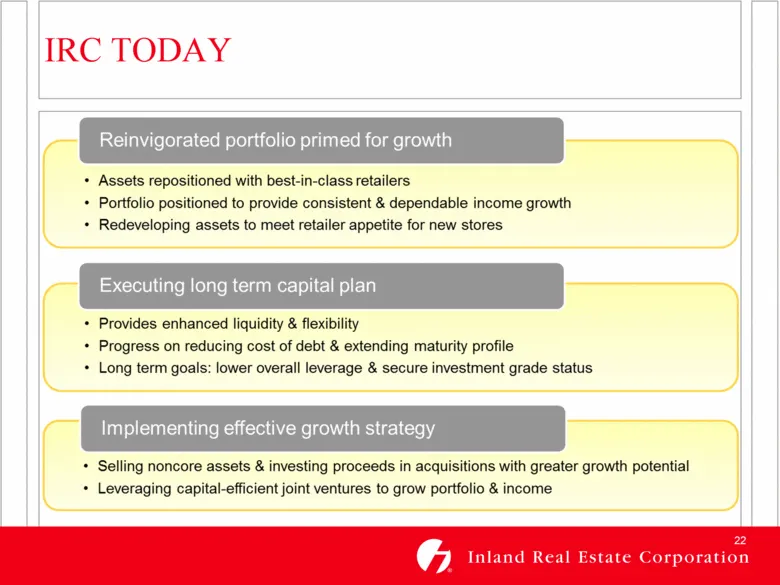
IRC TODAY Reinvigorated portfolio primed for growth Assets repositioned with best-in-class retailers Portfolio positioned to provide consistent & dependable income growth Redeveloping assets to meet retailer appetite for new stores Executing long term capital plan provides enhanced liquidity & flexi
Slide 23: Forward-Looking Statements
FORWARD-LOOKING STATEMENTS Certain statements in this presentation constitute "forward-looking statements" within the meaning of the Federal Private Securities Litigation Reform Act of 1995. These forward-looking statements are not historical facts but are the intent, belief or current expectations
Source: SEC EDGAR · 8-K filed Nov 13, 2012
More decks from Inland Real Estate Corp
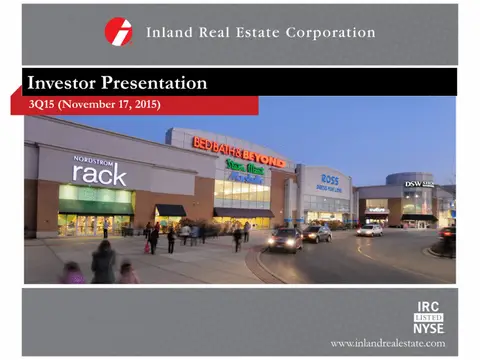 Investor Presentation (November 2015)30 slides · Nov 17, 2015
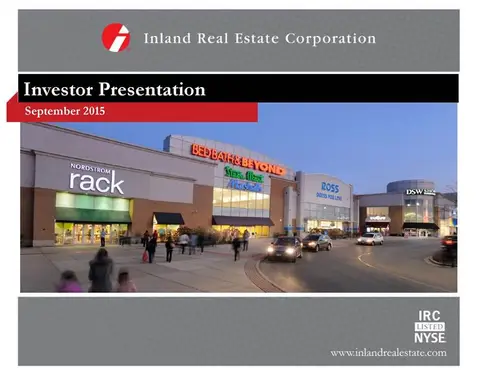 Investor Presentation (September 2015)29 slides · Sep 16, 2015
 Investor Presentation (June 2015)29 slides · Jun 9, 2015
 Investor Presentation (May 2015)26 slides · May 15, 2015
 Investor Presentation (February 2015)26 slides · Feb 24, 2015
 Investor Presentation (November 2014)26 slides · Nov 5, 2014