TransAtlantic Petroleum — Q4 2012 Earnings Presentation
28 slides from TransAtlantic Petroleum's earnings presentation, Mar 19, 2013
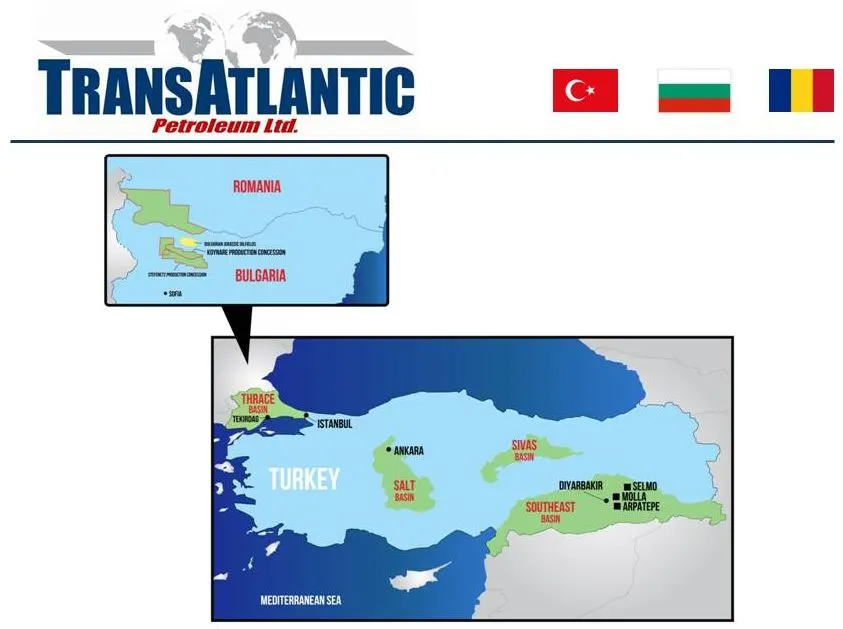
Slide 1: 4Q12 Preliminary Financial and Operations Review
4Q12 Preliminary Financial and Operations Review March 19, 2013 Exhibit 99.2
Slide 2: Forward Looking Statements
Forward Looking Statements Outlooks, projections, estimates, targets, and business plans in this presentation or any related subsequent discussions are forward-looking statements. Actual future results, including TransAtlantic Petroleum Ltd.’s own production growth and mix; financial results; the am
Slide 3: Company Overview
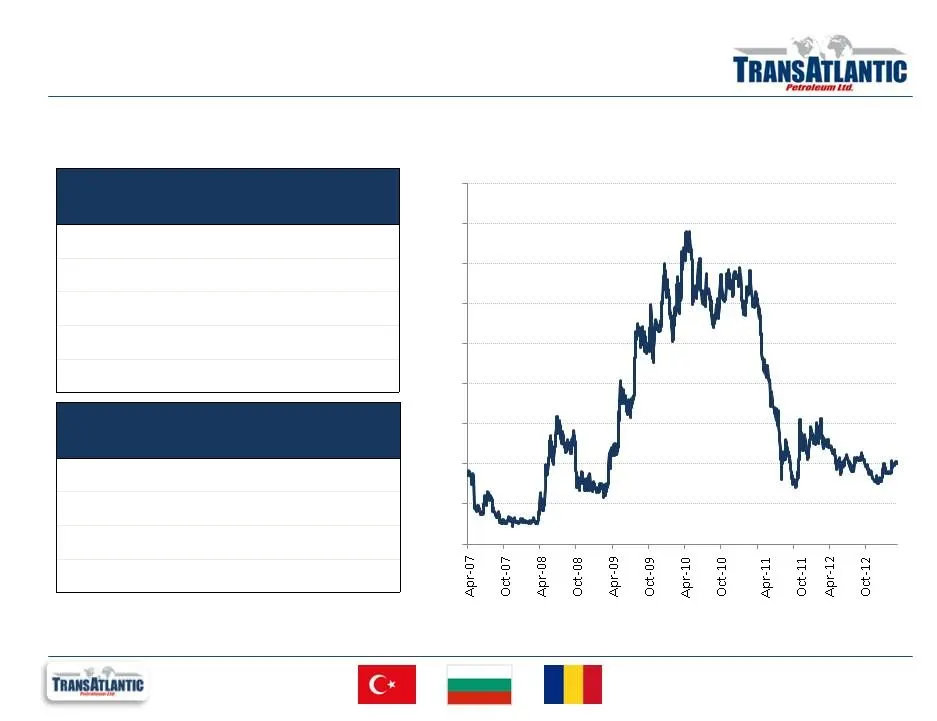
NYSE-AMEX: Toronto: TAT TNP Executive Management Company Overview TransAtlantic Petroleum Ltd. is an international energy company engaged in the acquisition, development, exploration, and production of crude oil and natural gas in Turkey, Bulgaria and Romania. Share Price (1) : $1.01 Market Cap (1)
Slide 4: Asset Characteristics
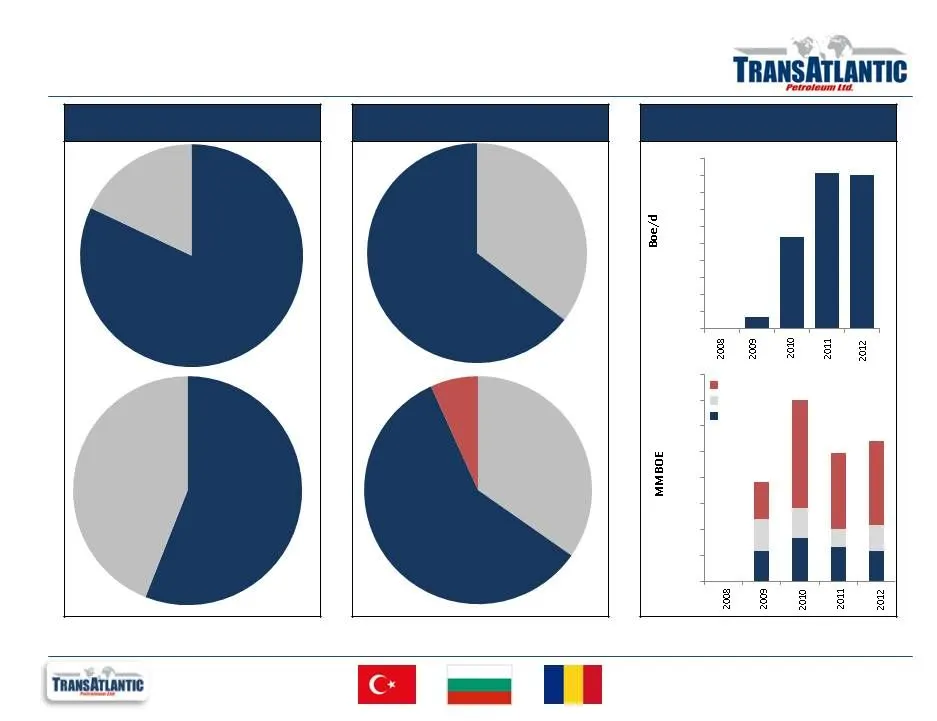
Oil 82% Developed 56% Oil 65% Selmo 59% Growth Profile Reserve Profile 4Q12 Production Profile (1) (1) Asset Characteristics (1) Reflects DeGolyer and MacNaughton (“D&M”) reserve report, effective 12/31/2012 based on $108.30/barrel and $8.94/Mcf. BOE conversions are calculated by the Company. Natura
Slide 5: Delayed 10-K
Delayed 10-K As announced in our Press Release yesterday, TransAtlantic needs additional time to file our Form 10-K, and we have filed Form 12b-25 which provides an additional 15 days to file our Form 10-K • Time extension is due to prior period errors that relate to the allocation of well costs to
Slide 6: Preliminary 4Q12 Financials
Preliminary 4Q12 Financials • Until we file the 10-K, we can only provide limited financial information • We expect fourth quarter Net Loss from Continuing Operations to be between $20 to $25 million • The fourth quarter included exploration, abandonment and impairment charges of approximately $24 m
Slide 7: 2013 CapEx and Operating Plan
$131 Million Capital Budget Southeast Turkey Northwest Turkey – Thrace Basin Other 2013 CapEx and Operating Plan • Within current cash flow, cash on hand, and credit availability. • Accelerate with consummation of a joint venture • Drill horizontal wells to increase productivity. • Expand 2012 disco
Slide 8: Management Transition
Management Transition Success of horizontal, unconventional plays drive increased need for drilling and completions team managed and staffed with team leaders with heavy experience in horizontal drilling, multi-stage fracture design, and North American activity pace. Key New Hires/Promotions: Ian De
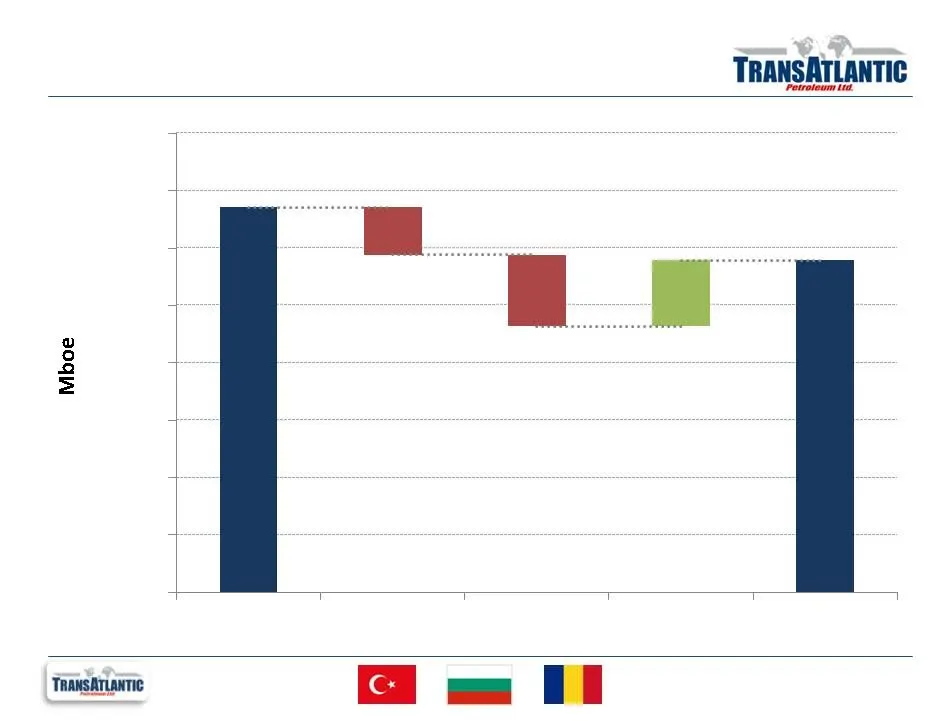
Slide 9: 1P Reserves Roll-forward
1P Reserves Roll-forward YE2011 Production Revisions Discoveries YE2012 2,000 4,000 6,000 8,000 10,000 12,000 14,000 16,000
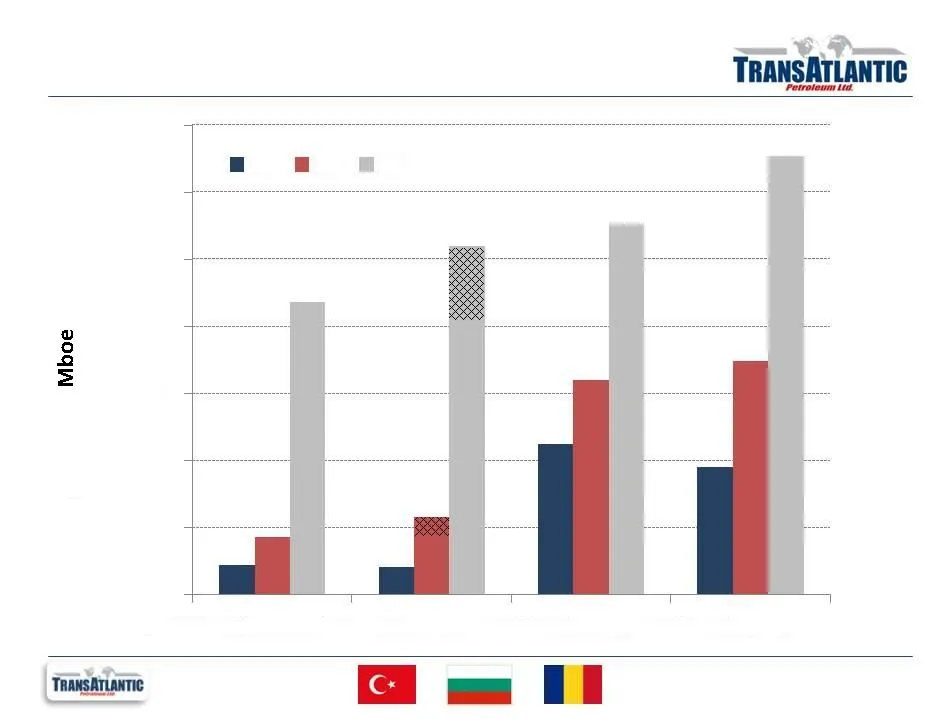
Slide 10: Year-end 3P Reserves Profile and Comparison
Year-end 3P Reserves Profile and Comparison *Hatched area represents increased 2P/3P independent reserves evaluation disclosed by Valeura Energy, which benefitted from three additional weeks of study/review. 5,000 10,000 15,000 20,000 25,000 30,000 35,000 2011 Gas 2012 Gas* 2011 Oil 2012 Oil 1P 2P 3
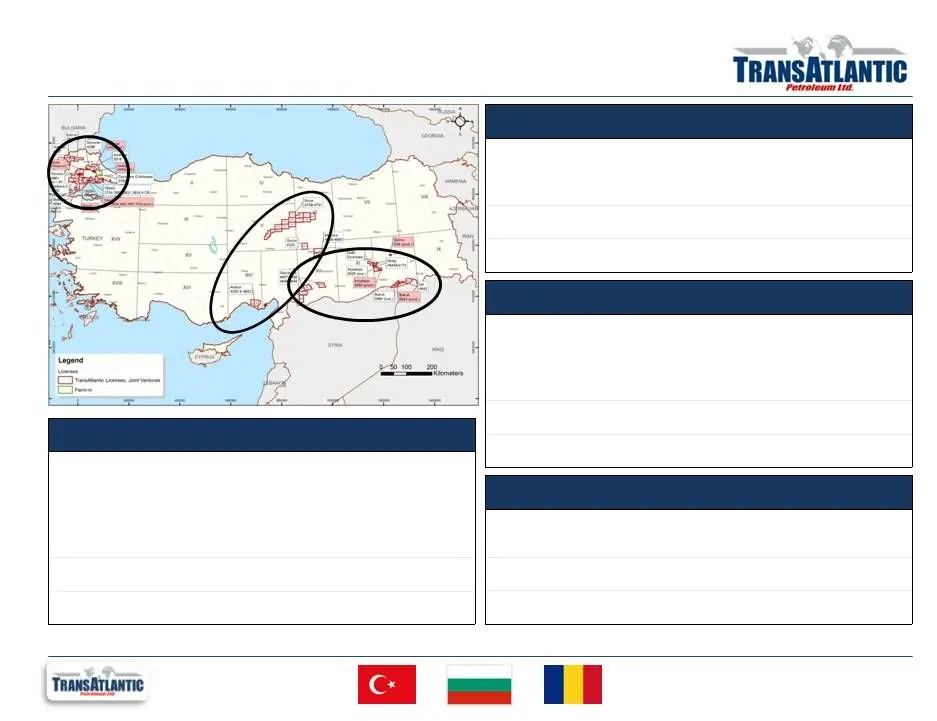
Slide 11: Turkey: Activity Overview
Thrace Basin Southeast Central Overview Turkey: Activity Overview Region Summary: Conventional and tight natural gas production with upside potential from deep intervals and technological application. Proved Reserves: 11.1 Bcf (1) 4Q12 Production: 9.2 MMcf/d Thrace Basin Southeast Central Region Sum
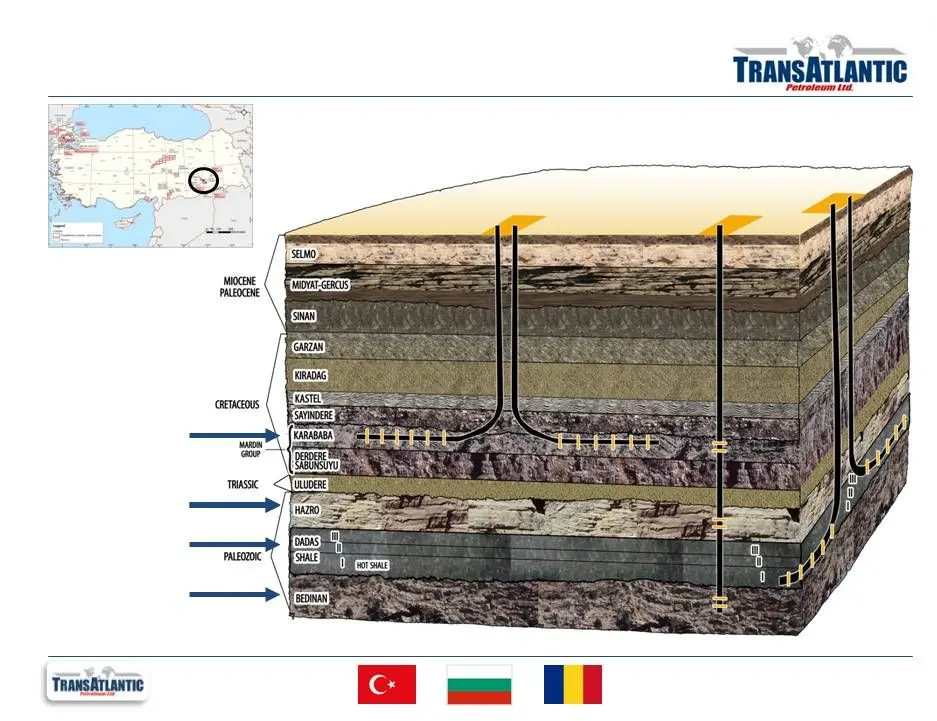
Slide 12: Molla: Demonstrating Stacked Pay Potential
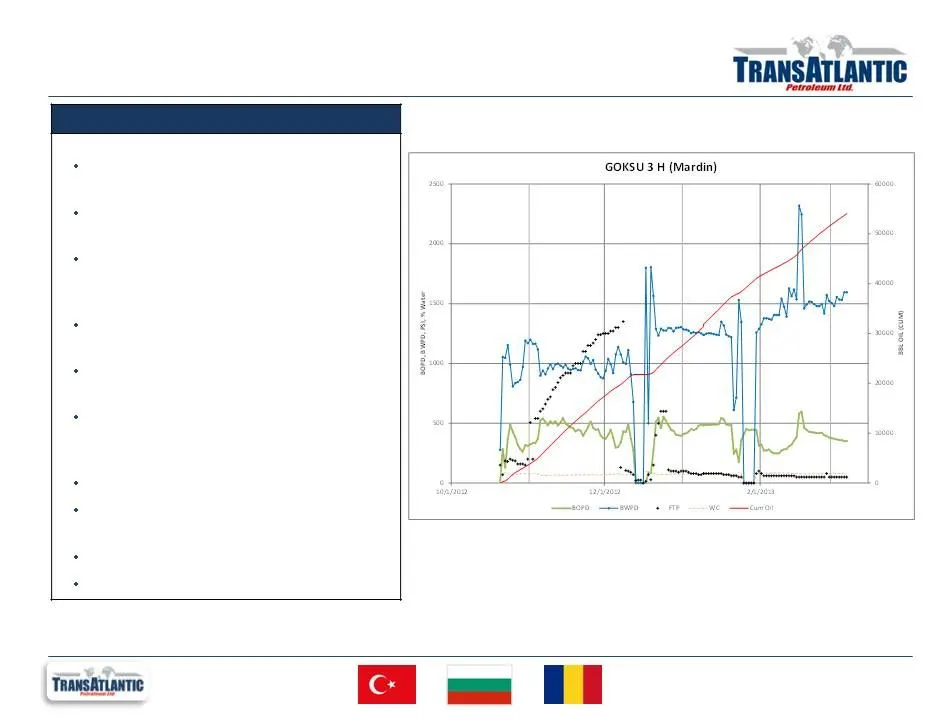
Molla: Demonstrating Stacked Pay Potential Demonstrated horizontal success with Goksu 3H over 300 BOPD after ~5 months of production. Vertical discovery (Bahar-1) IP after frac at ~600 BOPD. Horizontal currently drilling. Tested 150 BOPD (Bahar-1). Two cores taken.
Slide 13: Molla-area Gravity Map
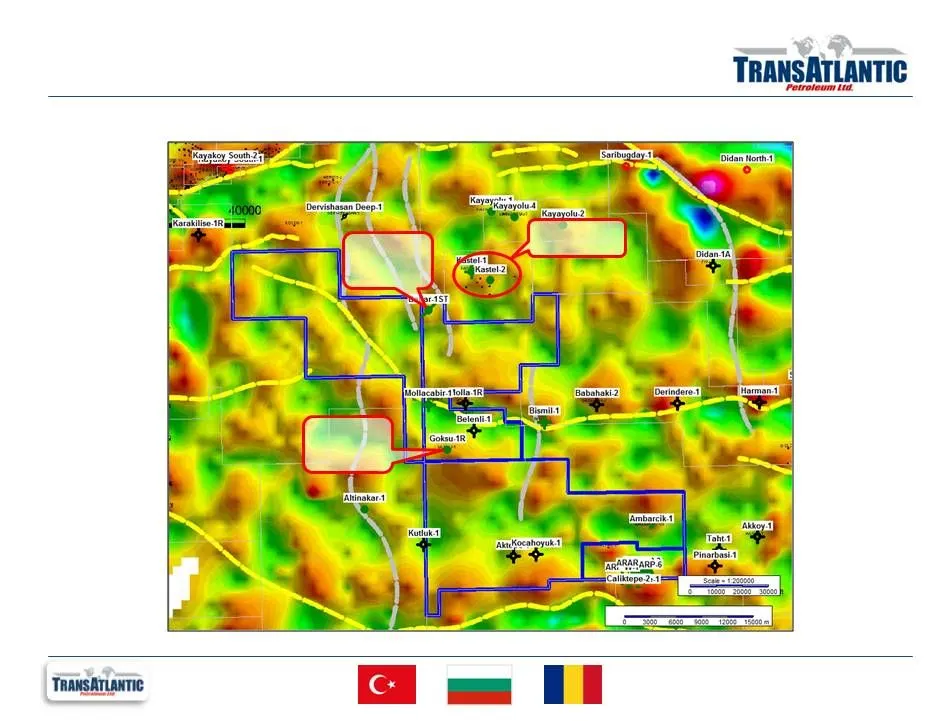
Molla-area Gravity Map * DeGolyer & McNaughton as of 12/31/2012 Goksu: 2P Reserves: 2.9 MMbbls* Field discoveries align well with gravity data. Meaningful running room whether structural or stratigraphic. Kastel Field: EUR 15 MMbbls Bahar: 2P Reserves: 2.5 MMbbls*
Slide 14: Molla: Mardin Potential and Goksu Discovery
Molla: Mardin Overview Molla: Mardin Potential and Goksu Discovery * DeGolyer & McNaughton as of 12/31/2012. Mardin Formation Fractured Cretaceous carbonate present across the region. Initial vertical discoveries bolstered by recent application of horizontal drilling processes. Total 1P reserves of
Slide 15: Molla: Mardin Reserves
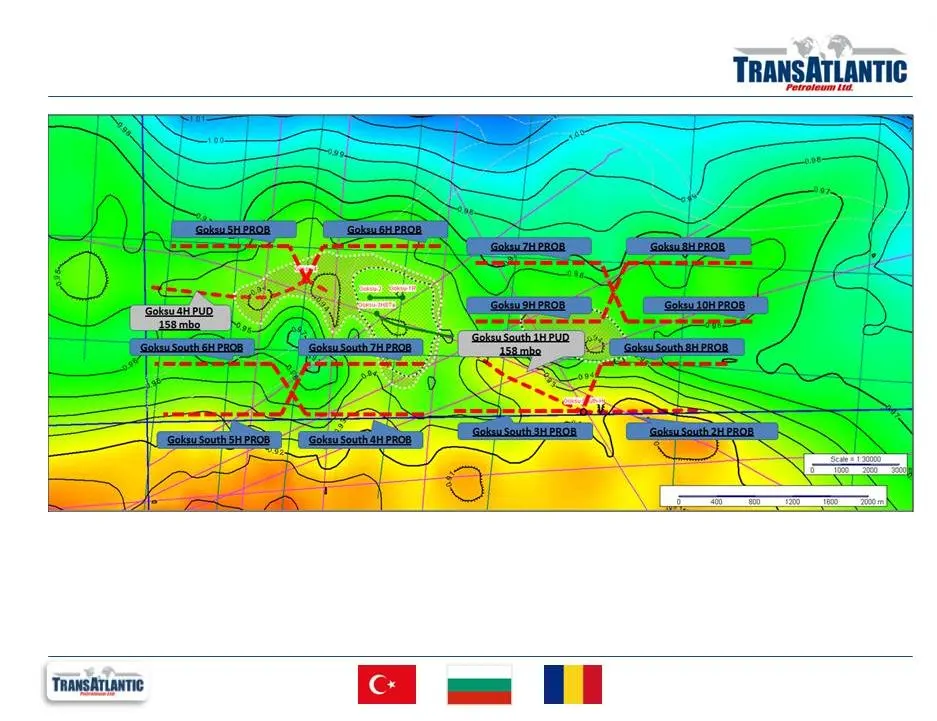
Molla: Mardin Reserves * DeGolyer & McNaughton as of 12/31/2012.
Slide 16: Molla: Mardin Horizontal – Ambar Structure
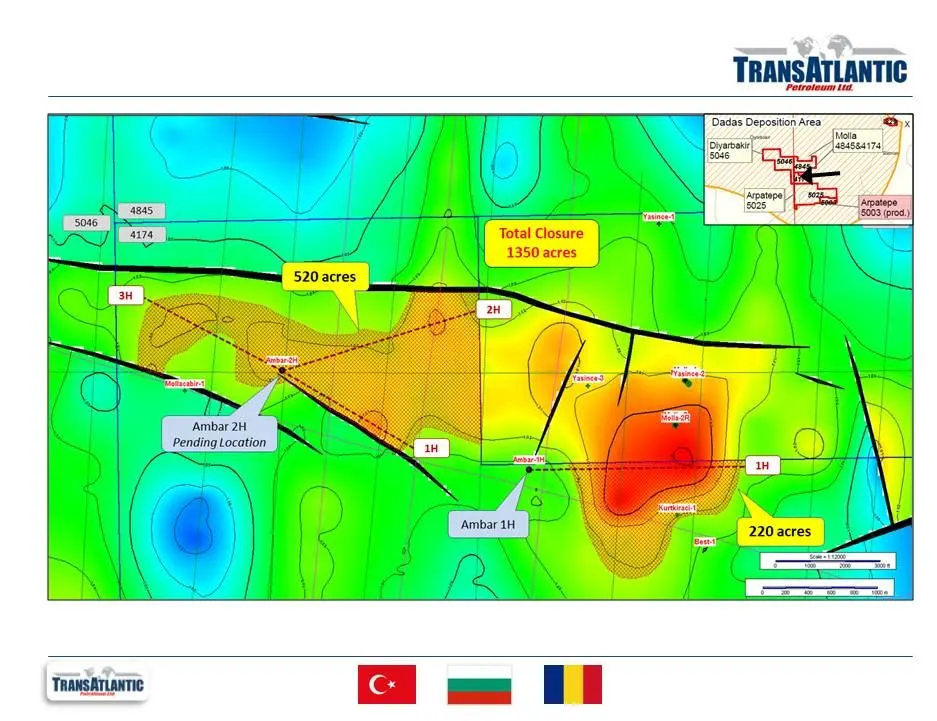
Molla: Mardin Horizontal – Ambar Structure
Slide 17: Molla: Bedinan and Hazro Discovery
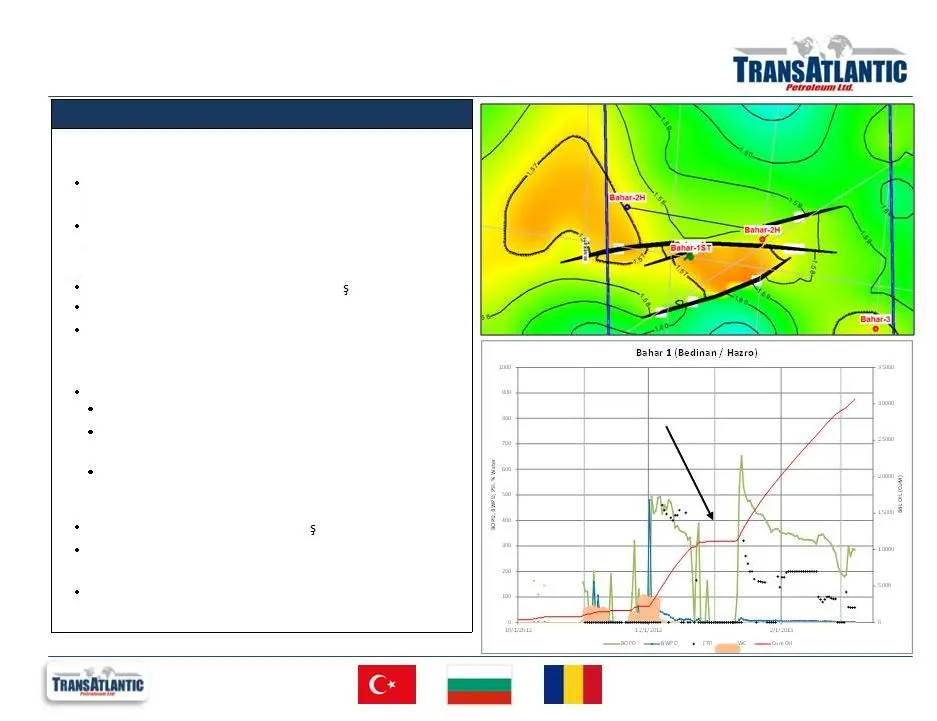
Molla: Bedinan & Hazro Overview Molla: Bedinan and Hazro Discovery * DeGolyer & McNaughton as of 12/31/2012. Conventional targets immediately above and below Dadas with prospectivity demonstrated via recent discovery well. Bedinan Formation Hazro Formation Shut-in while Hazro tested (150 bopd) Analo
Slide 18: Molla: Bedinan Horizontal – Cataksu-1H
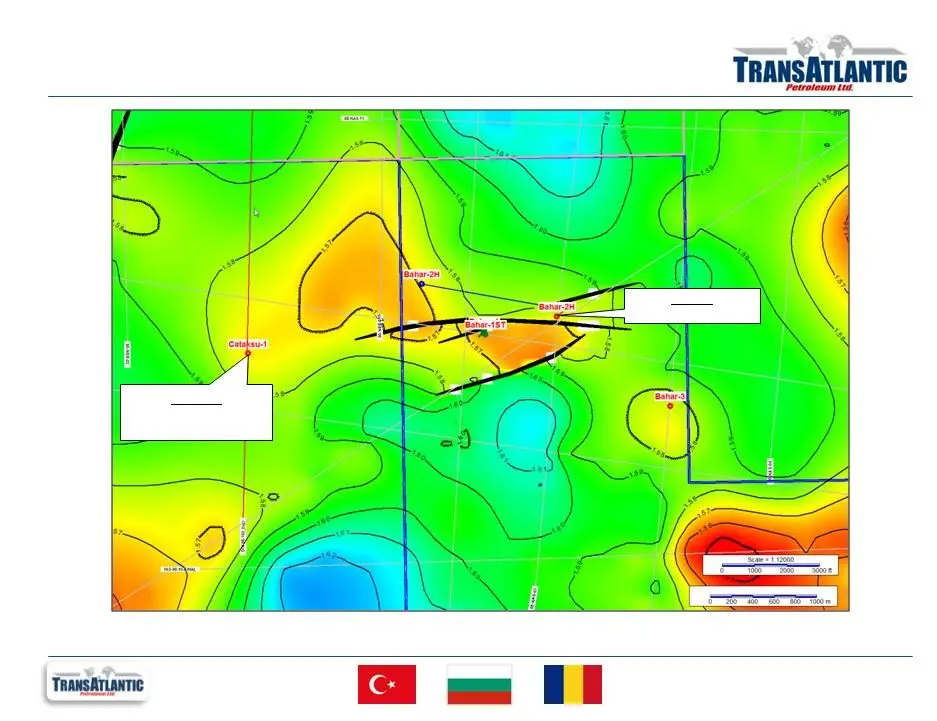
Molla: Bedinan Horizontal – Cataksu-1H Bahar-2H Drilling Curve Now Cataksu-1H Next well in program. Lateral trajectory TBD.
Slide 19: Selmo Remapping
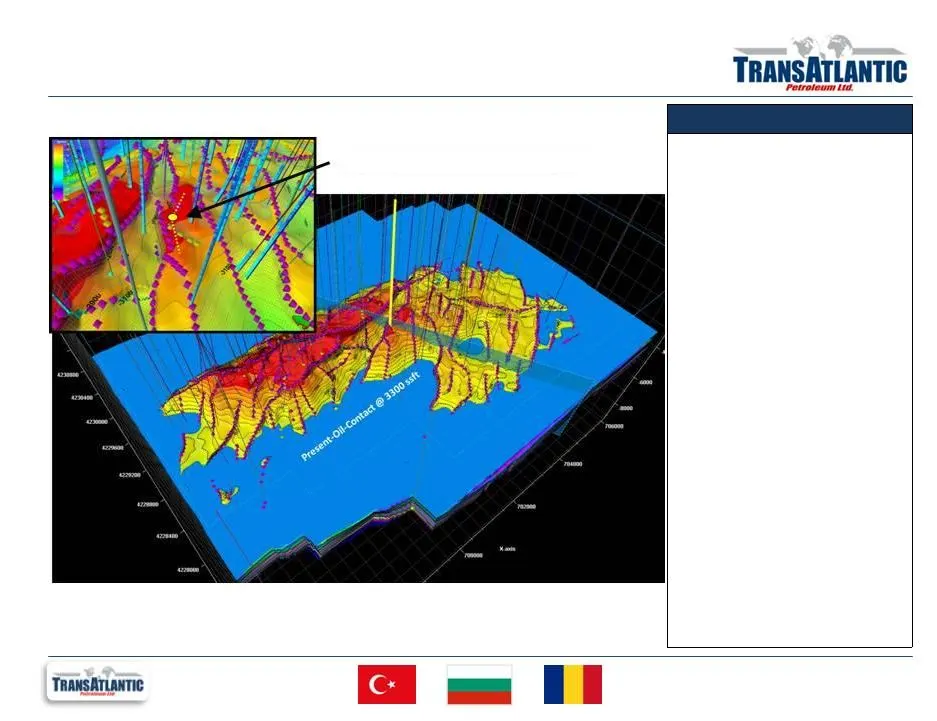
Selmo Overview Selmo Remapping • Extensive work has been done to remap and model Selmo to identify bypassed oil due to the extremely fractured nature of the field. • New dynamic model incorporates updated substructure mapping with production and pressure histories to determine the areas of the field
Slide 20: New License Applications
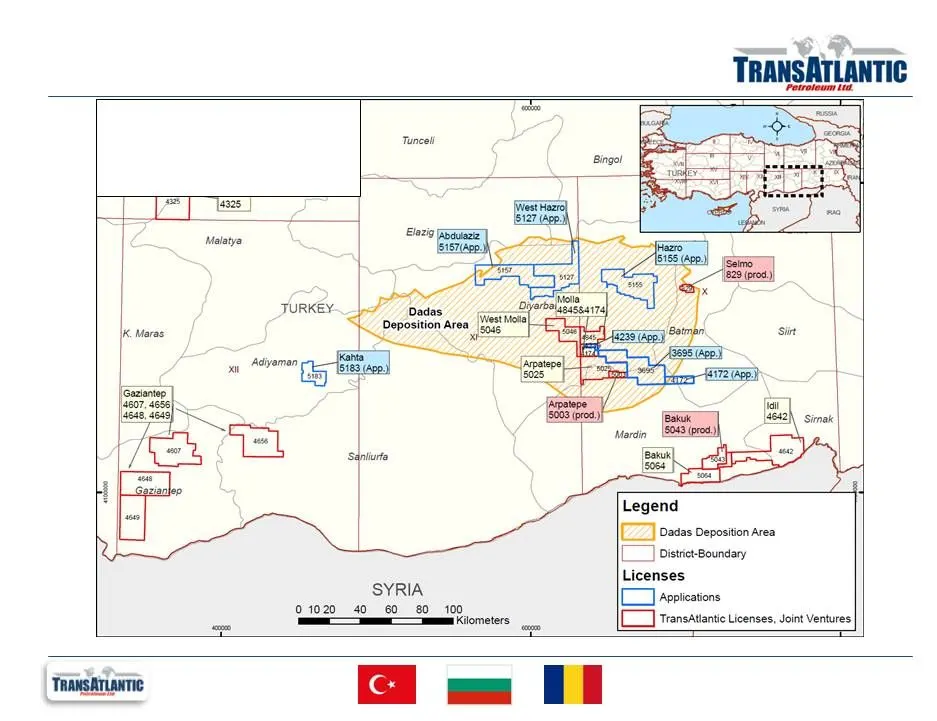
New License Applications Acquired or applied for seven new licenses totaling over 550k acres.
Slide 21: Thrace Basin – Mezardere Formation
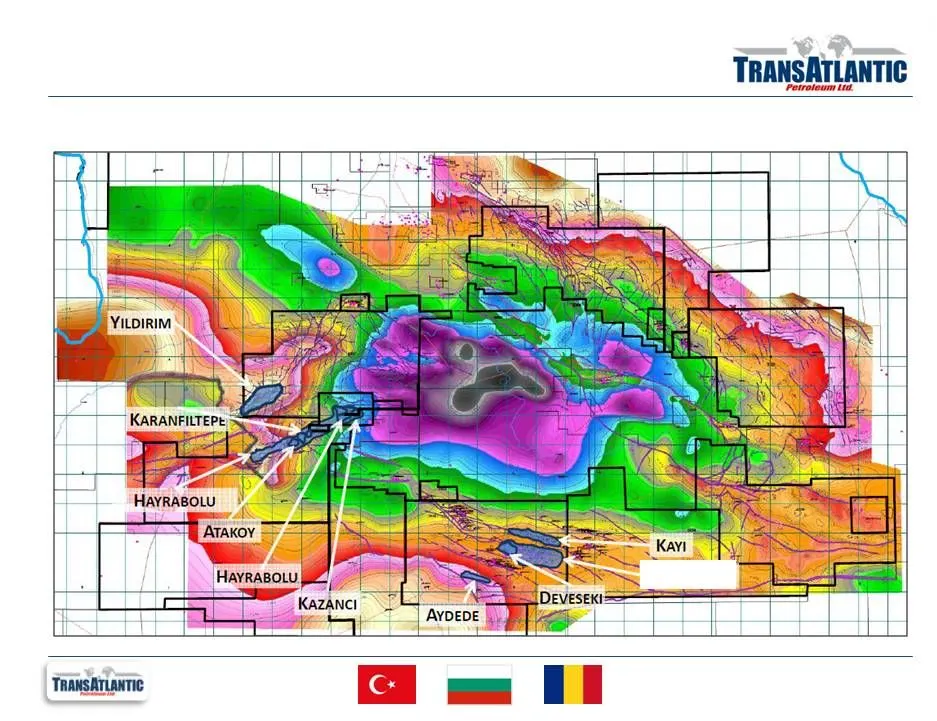
Thrace Basin – Mezardere Formation New basin-wide map provides better understanding of source, kitchen, trap, and pressure dynamics. T EKIRDAG
Slide 22: Development Program Characteristics: Tekirdag Hayrabolu
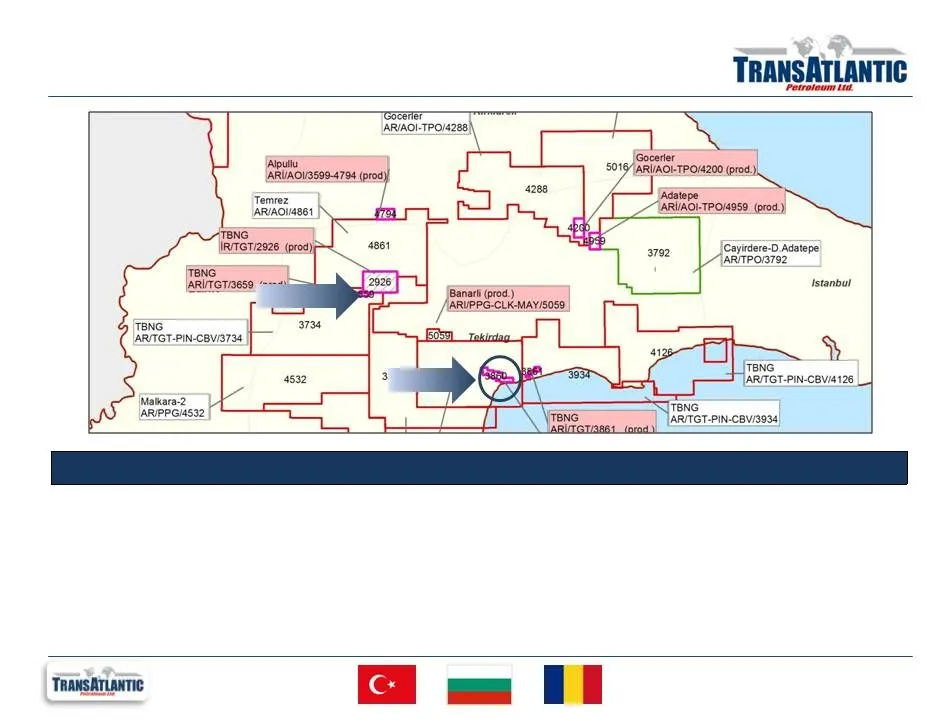
Development Program Characteristics: Tekirdag Hayrabolu Thrace Basin Frac: Tekirdag Development Program • Initial 88-well development program covering approximately 5,000 acres of the Tekirdag Field Area. • Plan 17 wells in Tekirdag area and 8 wells in Hayrabolu during 2013. • Two rig drilling progr
Slide 23: Thrace Basin Frac: Tekirdag Development Program
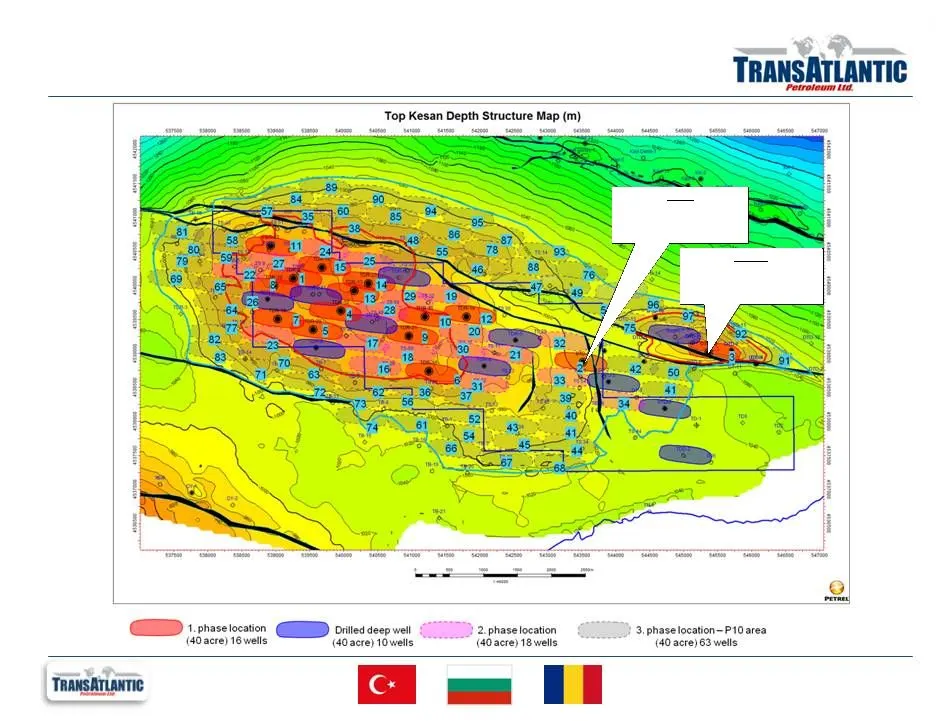
Thrace Basin Frac: Tekirdag Development Program DTD-19 5-stage frac, flowing back with early choked gas rate > 1 MMcf/d BTD-5 4-stage frac, flowing back with early choked gas rate ~ 1 MMcf/d
Slide 24: Thrace Basin Frac: Hayrabolu Trend
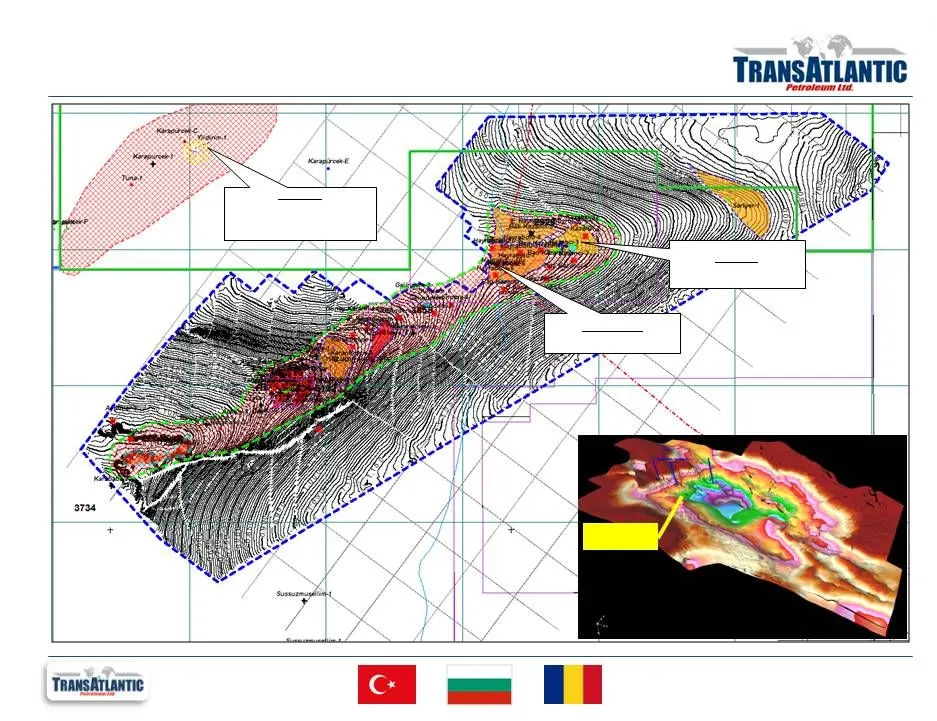
Thrace Basin Frac: Hayrabolu Trend 11,000 prospective acres Yildirim-1 2-stage frac, drilling out plugs. Pre-frac instantaneous flow rate of 1.8MMcf/d Kazanci-5 Deepest zone unsuccessful Hayrabolu-10 Drilling Kazanci-5
Slide 25: EBITDAX Reconciliation
For the three months ended (in millions) Dec 31, 2012 EBITDAX Reconciliation Adjusted EBITDAX from continuing operations $22.0 – $24.0 Subtract: Interest and other, net $1.2 Income tax expense 2.6 Depreciation, depletion, and amortization 11.3-14.3 Accretion of asset retirement obligation 0.1 Explor
Slide 26: Hedge Profile
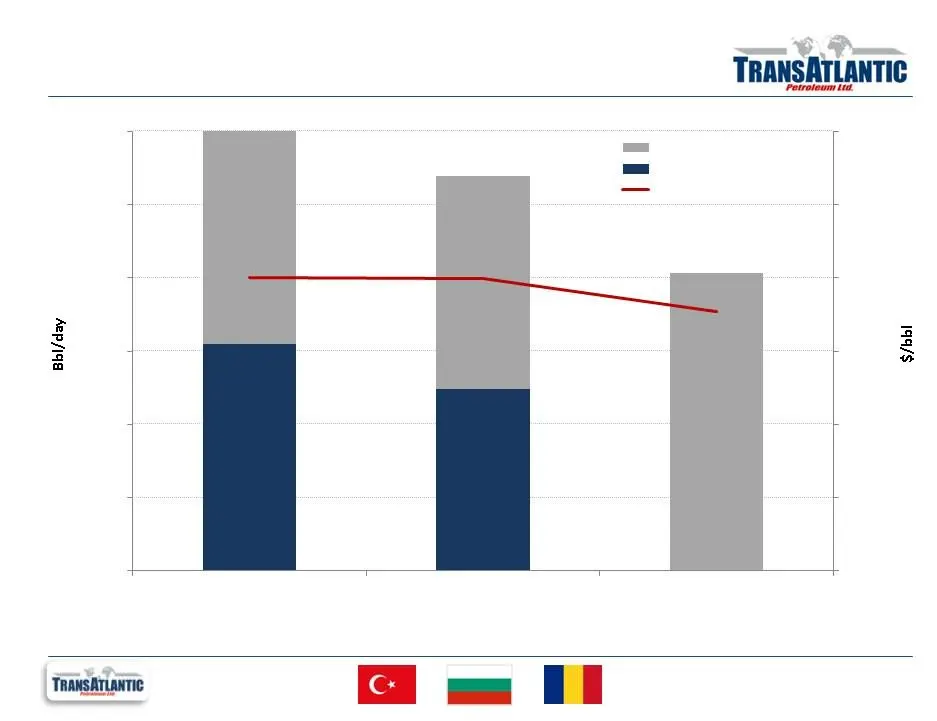
775 622 0 Hedge Profile As of 12/31/2012 1,016 $100.25 $99.63 $88.44 $0 $25 $50 $75 $100 $125 $150 1,000 1,250 1,500 way Collars Collars Floor/Ceiling Mid- point 3-
Slide 27: PV10 Reconciliation
US $ thousands PV10 Reconciliation The PV-10 value of the estimated future net revenue are not intended to represent the current market value of the estimated oil and natural gas reserves we own. Management believes that the presentation of PV-10, while not a financial measure in accordance with U.S
Slide 28: Investor Contact Information
Investor Contact Information Chad W. Potter, CFA VP – Finance / Investor Relations (214) 265-4746 [email protected] Wil F. Saqueton VP – Chief Financial Officer (214) 265-4743 [email protected] Ian Delahunty President (214) 265-4780 [email protected] 16803 Dallas Parkway P.O. Box 2
Source: SEC EDGAR · 8-K filed Mar 19, 2013
More decks from TransAtlantic Petroleum Ltd
 Shareholder Meeting (June 2020)11 slides · Jun 4, 2020
 Corporate Update (March 2020)9 slides · Mar 9, 2020
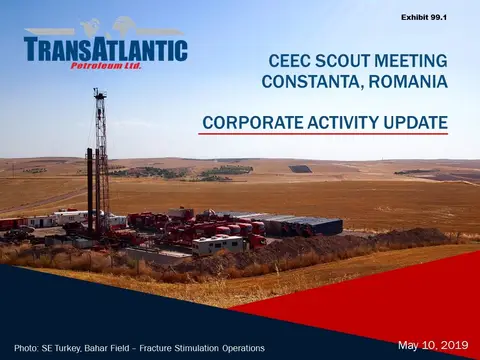 CEEC Scout Meeting, Constanta, Romania (May 2019)14 slides · May 10, 2019
 Technical Presentation (March 2019)10 slides · Mar 26, 2019
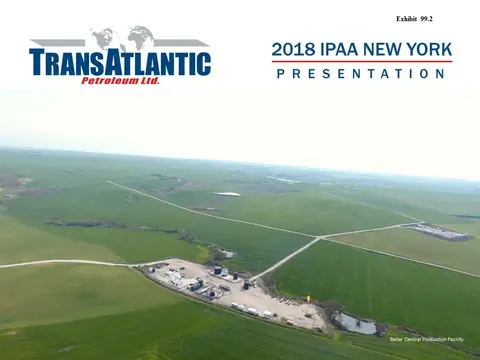 2018 IPAA OGIS New York32 slides · Apr 6, 2018
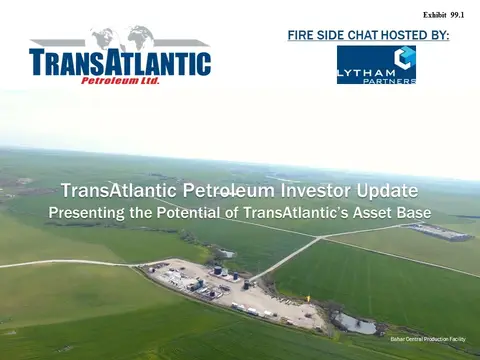 Investor Presentation (April 2018)14 slides · Apr 2, 2018