Evans Bancorp — Sandler O'Neill East Coast Financial Services Conference 2010
26 slides from Evans Bancorp's conference presentation, Nov 10, 2010
Slide 1: Sandler O'Neill East Coast Financial Services Conference
(c) 2009 by Evans Bancorp Sandler O'Neill East Coast Financial Services Conference November 11, 2010 David J. Nasca President & CEO Evans Bancorp, Inc. Gary A. Kajtoch Executive Vice President & CFO NASDAQ: EVBN
Slide 2: Safe Harbor Statement
(c) 2010 by Evans Bancorp Safe Harbor Statement 2 This presentation includes "forward looking statements" within the meaning of the Private Securities Litigation Reform Act of 1995. Such statements include, but are not limited to, statements concerning future business, revenue and earnings. These st
Slide 3: Evans Bancorp, Inc. (NASDAQ: EVBN) key facts
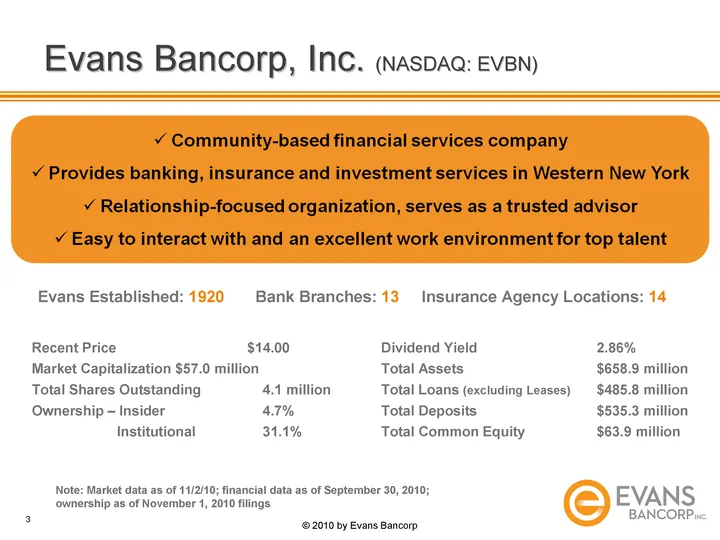
(c) 2010 by Evans Bancorp Recent Price $14.00 Market Capitalization $57.0 million Total Shares Outstanding 4.1 million Ownership - Insider 4.7% Institutional 31.1% 3 Dividend Yield 2.86% Total Assets $658.9 million Total Loans (excluding Leases) $485.8 million Total Deposits $535.3 million Total Com
Slide 4: Opportunity for Growth
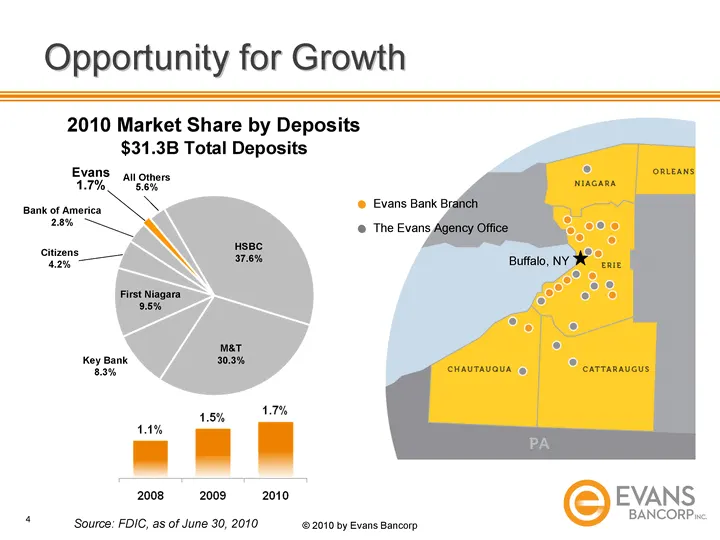
(c) 2010 by Evans Bancorp Source: FDIC, as of June 30, 2010 Opportunity for Growth 4 Buffalo, NY Evans Bank Branch The Evans Agency Office 2010 Market Share by Deposits $31.3B Total Deposits HSBC 37.6% M&T 30.3% Key Bank 8.3% First Niagara 9.5% Evans 1.7% Citizens 4.2% Bank of America 2.8% All Other
Slide 5: Comprehensive Financial Services
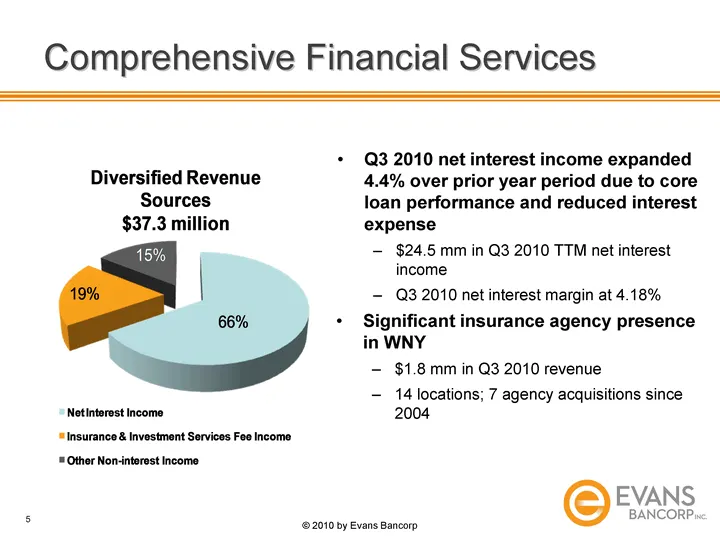
Comprehensive Financial Services Significant insurance agency presence in WNY $1.8 mm in Q3 2010 revenue 14 locations; 7 agency acquisitions since 2004 (c) 2010 by Evans Bancorp 5 Q3 2010 net interest income expanded 4.4% over prior year period due to core loan performance and reduced interest expen
Slide 6: Experienced Management Team
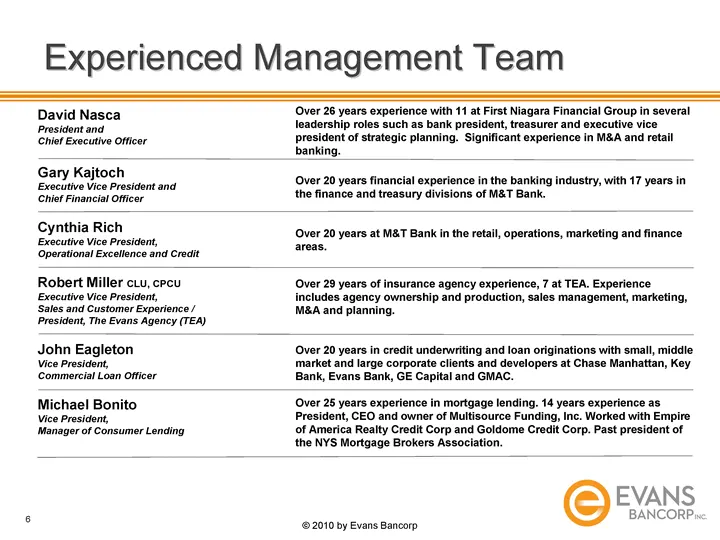
Experienced Management Team (c) 2010 by Evans Bancorp David Nasca President and Chief Executive Officer Gary Kajtoch Executive Vice President and Chief Financial Officer Cynthia Rich Executive Vice President, Operational Excellence and Credit Robert Miller CLU, CPCU Executive Vice President, Sales a
Slide 7: Evans' Strategy for Growth
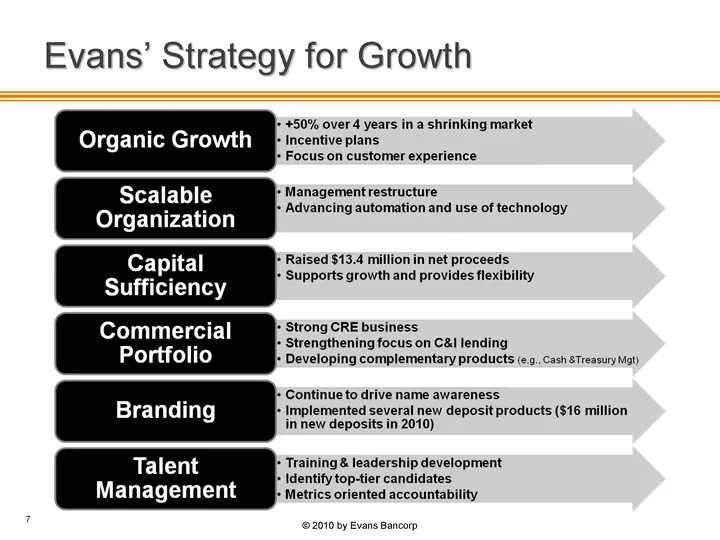
Evans' Strategy for Growth (c) 2010 by Evans Bancorp 7 7
Slide 8: Distribution Strategy
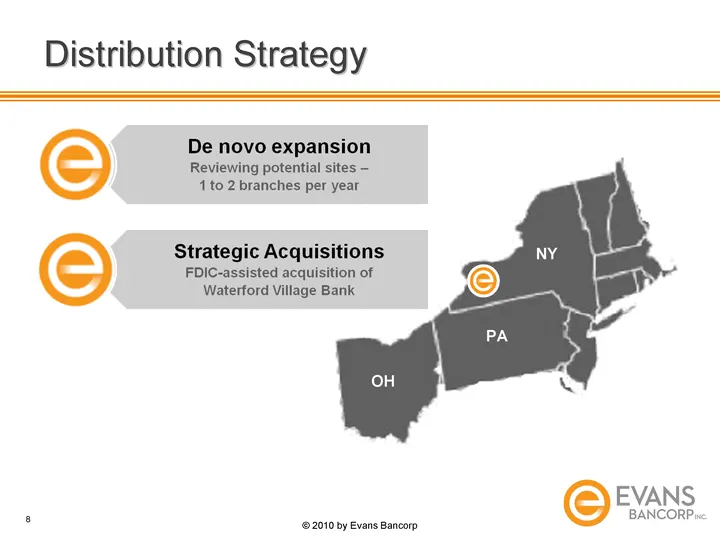
OH PA NY (c) 2010 by Evans Bancorp Distribution Strategy 8 8
Slide 9: Financial Highlights and Results
(c) 2009 by Evans Bancorp Financial Highlights and Results 9
Slide 10: Expanding Asset Base
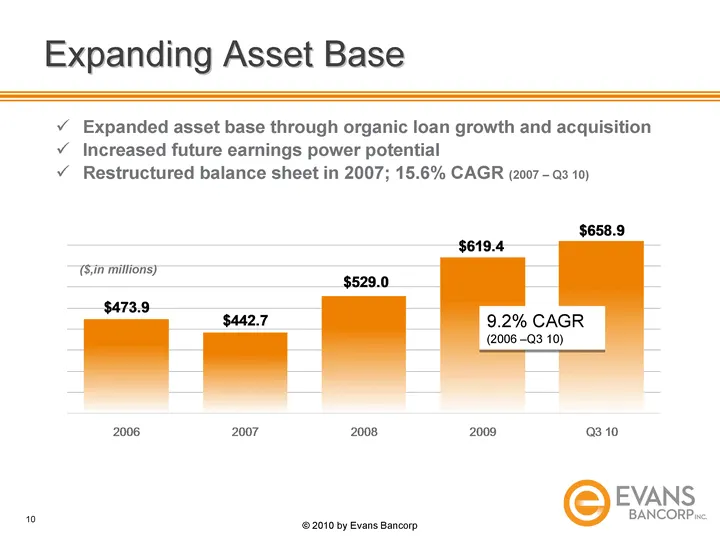
10 (c) 2010 by Evans Bancorp Expanding Asset Base ($,in millions) Expanded asset base through organic loan growth and acquisition Increased future earnings power potential Restructured balance sheet in 2007; 15.6% CAGR (2007 - Q3 10) 9.2% CAGR (2006 -Q3 10)
Slide 11: Core Banking: Loan Growth
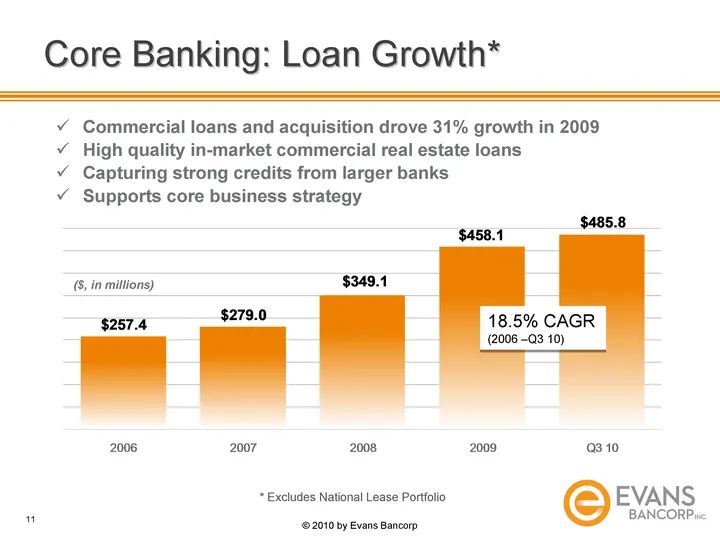
(c) 2010 by Evans Bancorp * Excludes National Lease Portfolio Core Banking: Loan Growth* 11 Commercial loans and acquisition drove 31% growth in 2009 High quality in-market commercial real estate loans Capturing strong credits from larger banks Supports core business strategy ($, in millions) 18.5%
Slide 12: Diverse Loan and Lease Portfolio
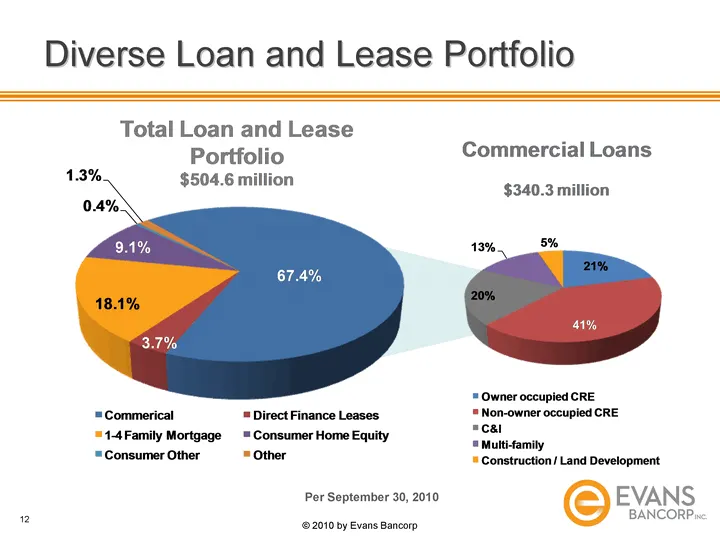
(c) 2010 by Evans Bancorp 12 Per September 30, 2010 Diverse Loan and Lease Portfolio
Slide 13: Asset Quality
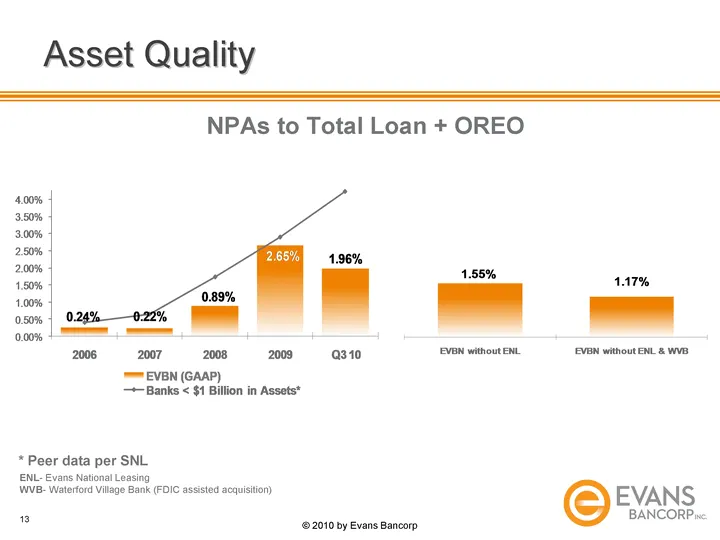
(c) 2010 by Evans Bancorp 13 Asset Quality NPAs to Total Loan + OREO * Peer data per SNL ENL- Evans National Leasing WVB- Waterford Village Bank (FDIC assisted acquisition)
Slide 14: National Leasing Portfolio
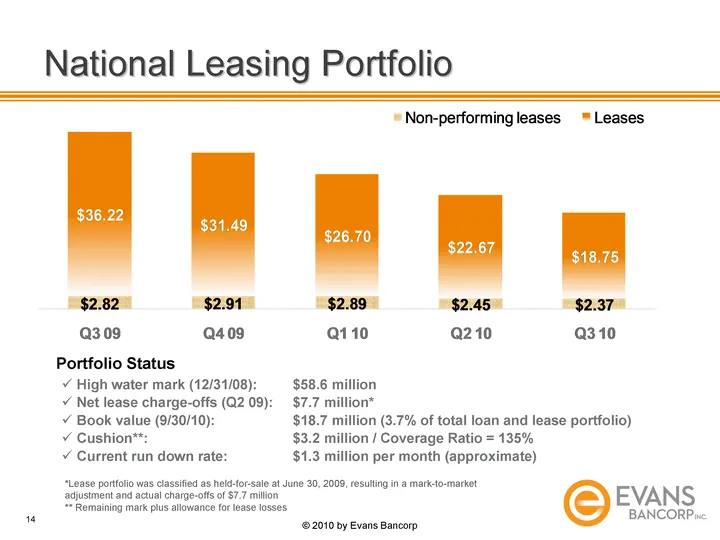
National Leasing Portfolio 14 Portfolio Status High water mark (12/31/08): $58.6 million Net lease charge-offs (Q2 09): $7.7 million* Book value (9/30/10): $18.7 million (3.7% of total loan and lease portfolio) Cushion**: $3.2 million / Coverage Ratio = 135% Current run down rate: $1.3 million per m
Slide 15: Asset Quality: Allowance for Loan Loss / Non-Accruals
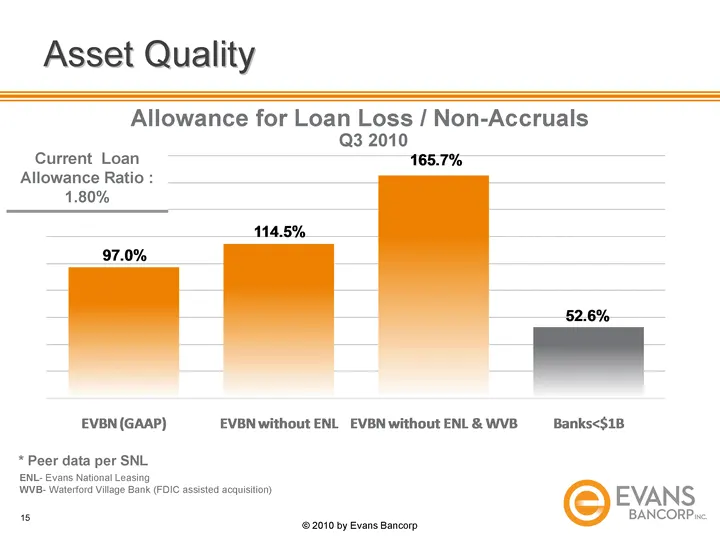
(c) 2010 by Evans Bancorp 15 Asset Quality Allowance for Loan Loss / Non-Accruals Q3 2010 Current Loan Allowance Ratio : 1.80% * Peer data per SNL ENL- Evans National Leasing WVB- Waterford Village Bank (FDIC assisted acquisition)
Slide 16: Non-Performing Loans by Portfolio
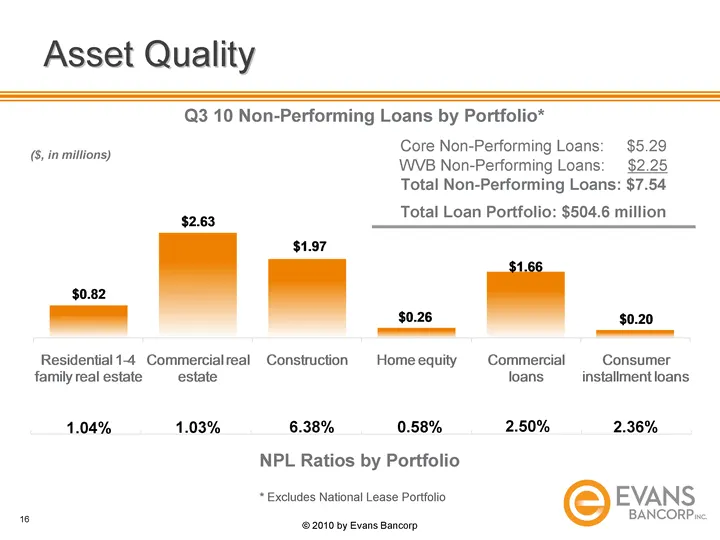
(c) 2010 by Evans Bancorp 16 Q3 10 Non-Performing Loans by Portfolio* Asset Quality ($, in millions) * Excludes National Lease Portfolio NPL Ratios by Portfolio 1.04% 1.03% 6.38% 0.58% 2.50% 2.36% Core Non-Performing Loans: $5.29 WVB Non-Performing Loans: $2.25 Total Non-Performing Loans: $7.54 Tota
Slide 17: Low Cost Core Deposits
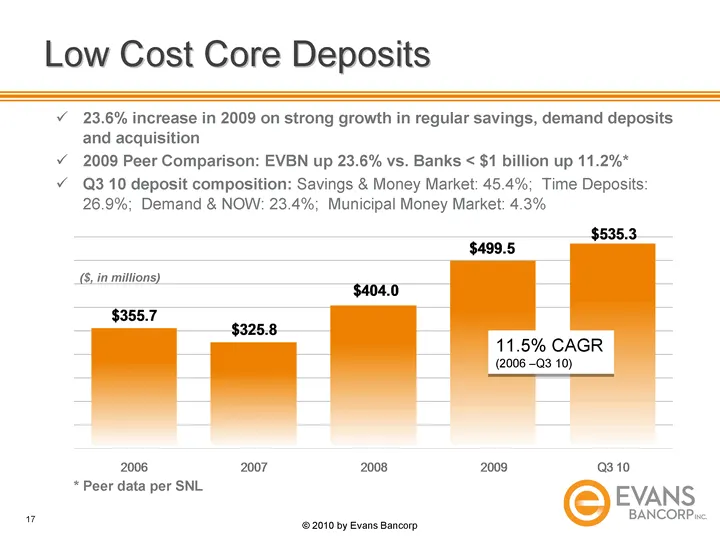
(c) 2010 by Evans Bancorp 17 Low Cost Core Deposits ($, in millions) 11.5% CAGR (2006 -Q3 10) 23.6% increase in 2009 on strong growth in regular savings, demand deposits and acquisition 2009 Peer Comparison: EVBN up 23.6% vs. Banks < $1 billion up 11.2%* Q3 10 deposit composition: Savings & Money Ma
Slide 18: Strong Margins and Revenue Growth
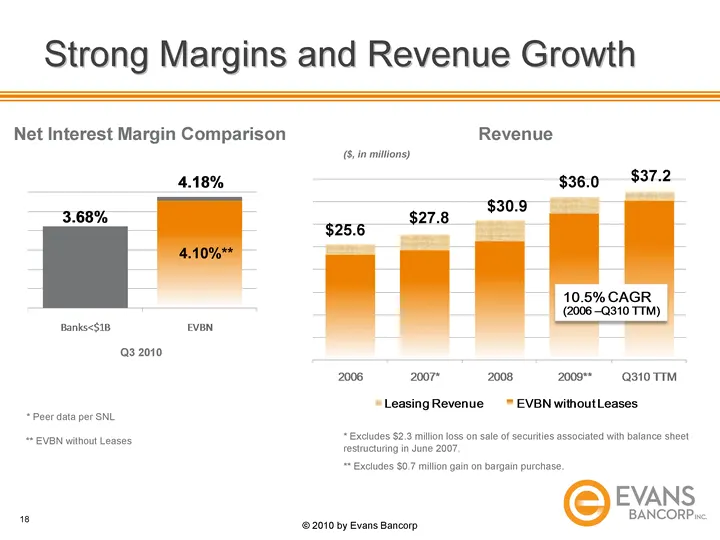
(c) 2010 by Evans Bancorp * Excludes $2.3 million loss on sale of securities associated with balance sheet restructuring in June 2007. 18 ** EVBN without Leases ** Excludes $0.7 million gain on bargain purchase. Strong Margins and Revenue Growth Net Interest Margin Comparison Revenue $36.0 $30.9 $27
Slide 19: Non-Interest Income
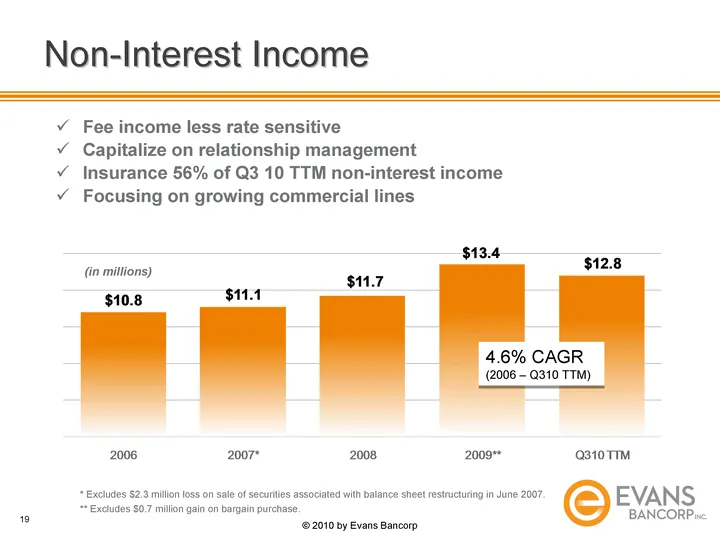
(c) 2010 by Evans Bancorp 19 Fee income less rate sensitive Capitalize on relationship management Insurance 56% of Q3 10 TTM non-interest income Focusing on growing commercial lines 4.6% CAGR (2006 - Q310 TTM) Non-Interest Income (in millions) * Excludes $2.3 million loss on sale of securities assoc
Slide 20: Bottom-line Results
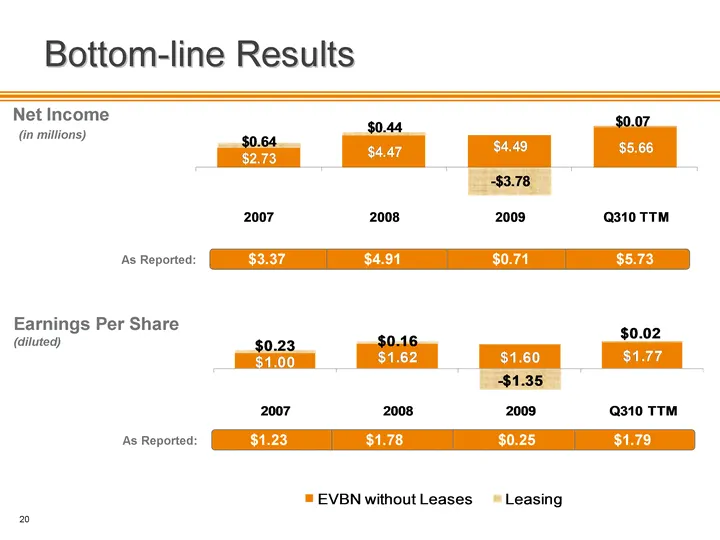
20 Bottom-line Results (in millions) Net Income Earnings Per Share (diluted) As Reported: $3.37 $4.91 $0.71 $5.73 $1.23 $1.78 $0.25 $1.79 As Reported:
Slide 21: Third Quarter 2010 - Core Business Strength
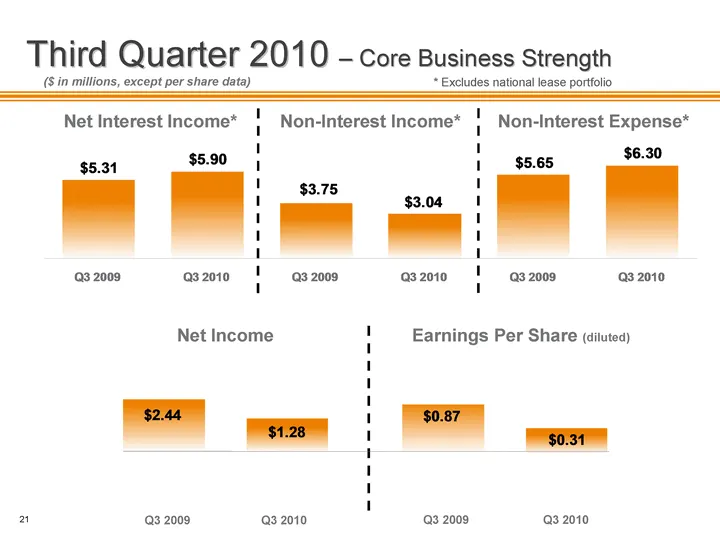
* Excludes national lease portfolio 21 Third Quarter 2010 - Core Business Strength ($ in millions, except per share data) Net Interest Income* Non-Interest Income* Non-Interest Expense* Net Income Earnings Per Share (diluted) Q3 2009 Q3 2010 Q3 2009 Q3 2010
Slide 22: Solid Capital Base
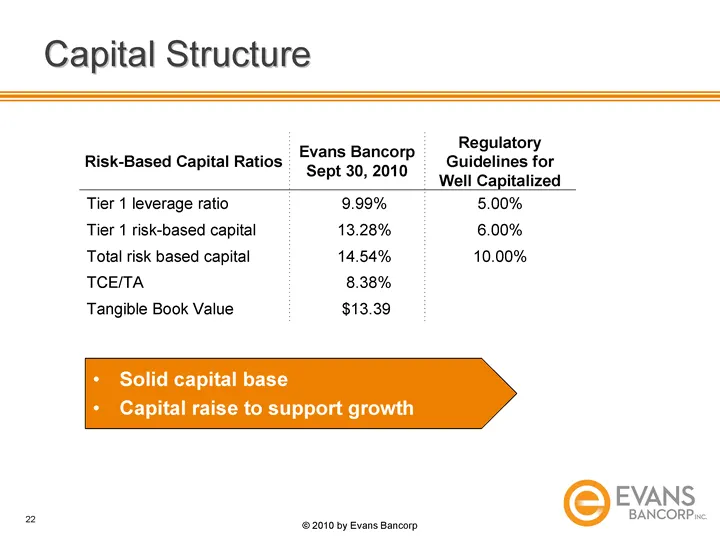
Solid capital base Capital raise to support growth (c) 2010 by Evans Bancorp Risk-Based Capital Ratios Evans Bancorp Sept 30, 2010 Regulatory Guidelines for Well Capitalized Tier 1 leverage ratio 9.99% 5.00% Tier 1 risk-based capital 13.28% 6.00% Total risk based capital 14.54% 10.00% TCE/TA 8.38% T
Slide 23: Driving Growth Managing Risk
(c) 2009 by Evans Bancorp Driving Growth 23 Managing Risk
Slide 24: Three-to-Five Year Growth Goals
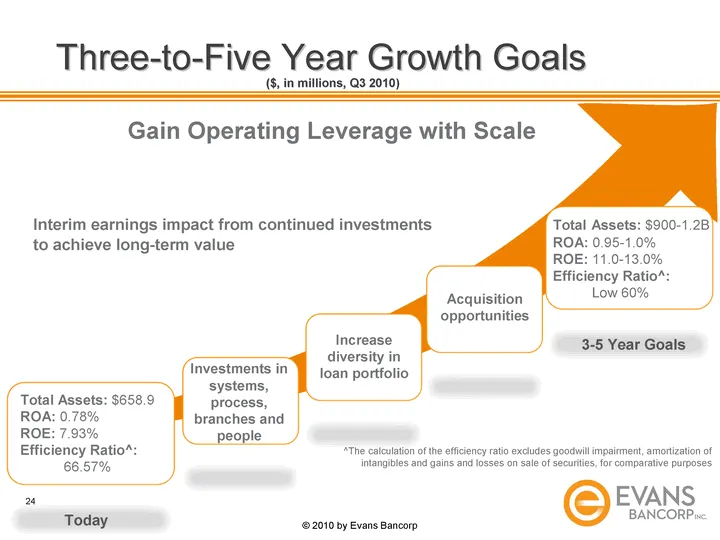
(c) 2010 by Evans Bancorp 24 Three-to-Five Year Growth Goals Gain Operating Leverage with Scale Total Assets: $658.9 ROA: 0.78% ROE: 7.93% Efficiency Ratio^: Low 66.57% ^The calculation of the efficiency ratio excludes goodwill impairment, amortization of intangibles and gains and losses on sale of
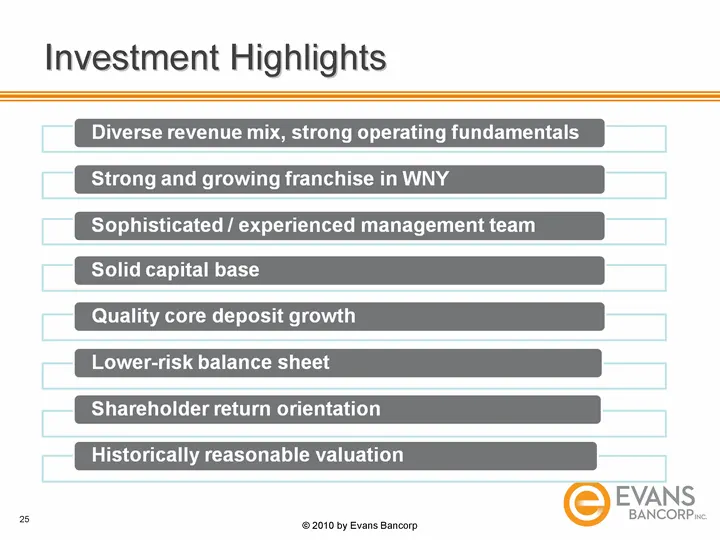
Slide 25: Investment Highlights
(c) 2010 by Evans Bancorp Investment Highlights 25
Slide 26: Evans Bancorp, Inc.
(c) 2009 by Evans Bancorp Evans Bancorp, Inc. Sandler O'Neill East Coast Financial Services Conference November 11, 2010
Source: SEC EDGAR · 8-K filed Nov 10, 2010
More decks from Evans Bancorp Inc
 Piper Sandler & Co East Coast Financial Services Conference 202324 slides · Nov 15, 2023
 Investor Presentation (August 2023)24 slides · Aug 8, 2023
 HOVDE Financial Services Conference 202226 slides · Nov 2, 2022
 Raymond James Conference 202225 slides · Sep 7, 2022
 Investor Presentation (June 2022)25 slides · Jun 7, 2022
 Q4 2021 Earnings Presentation9 slides · Feb 3, 2022