Bridge Capital — Shareholder Meeting (June 2007)
44 slides from Bridge Capital's shareholder meeting presentation, Jun 7, 2007
Slide 1: 7th Annual Shareholders Meeting
th 7 Annual Shareholders Meeting June 7, 2007 Daniel P. Myers Allan C. Kramer, M.D. President Chairman Chief Executive Officer
Slide 2: Forward Looking Statements
Forward Looking Statements Certain matters discussed herein constitute forward-looking statements within the meaning of the Private Securities Litigation Reform Act of 1995, and are subject to the safe harbors created by that Act. Forward-looking statements describe future plans, strategies, and exp

Slide 3: Chairman's Presentation
CHAIRMAN’S PRESENTATION Allan C. Kramer, M.D. Chairman
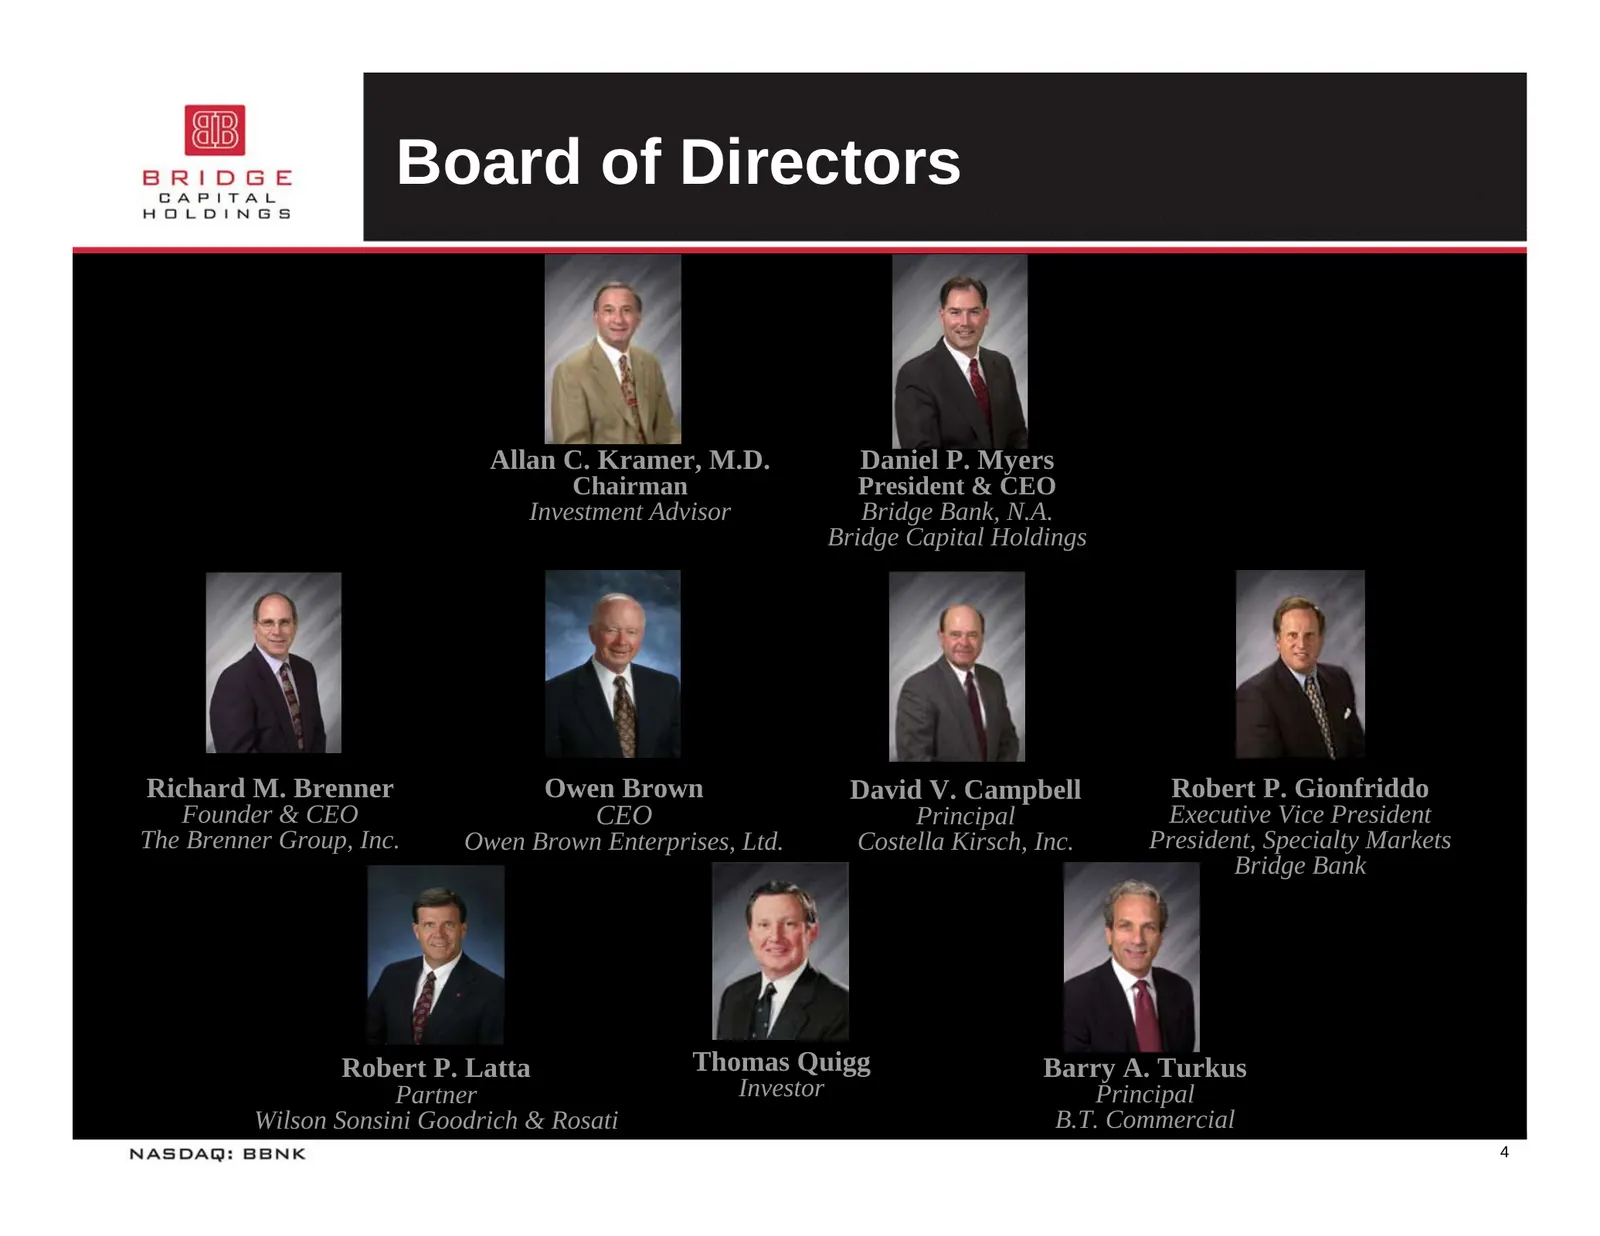
Slide 4: Board of Directors
Board of Directors Allan C. Kramer, M.D. Daniel P. Myers Chairman President & CEO Investment Advisor Bridge Bank, N.A. Bridge Capital Holdings Richard M. Brenner Owen Brown David V. Campbell Robert P. Gionfriddo Founder & CEO CEO Principal Executive Vice President The Brenner Group, Inc. Owen Brown
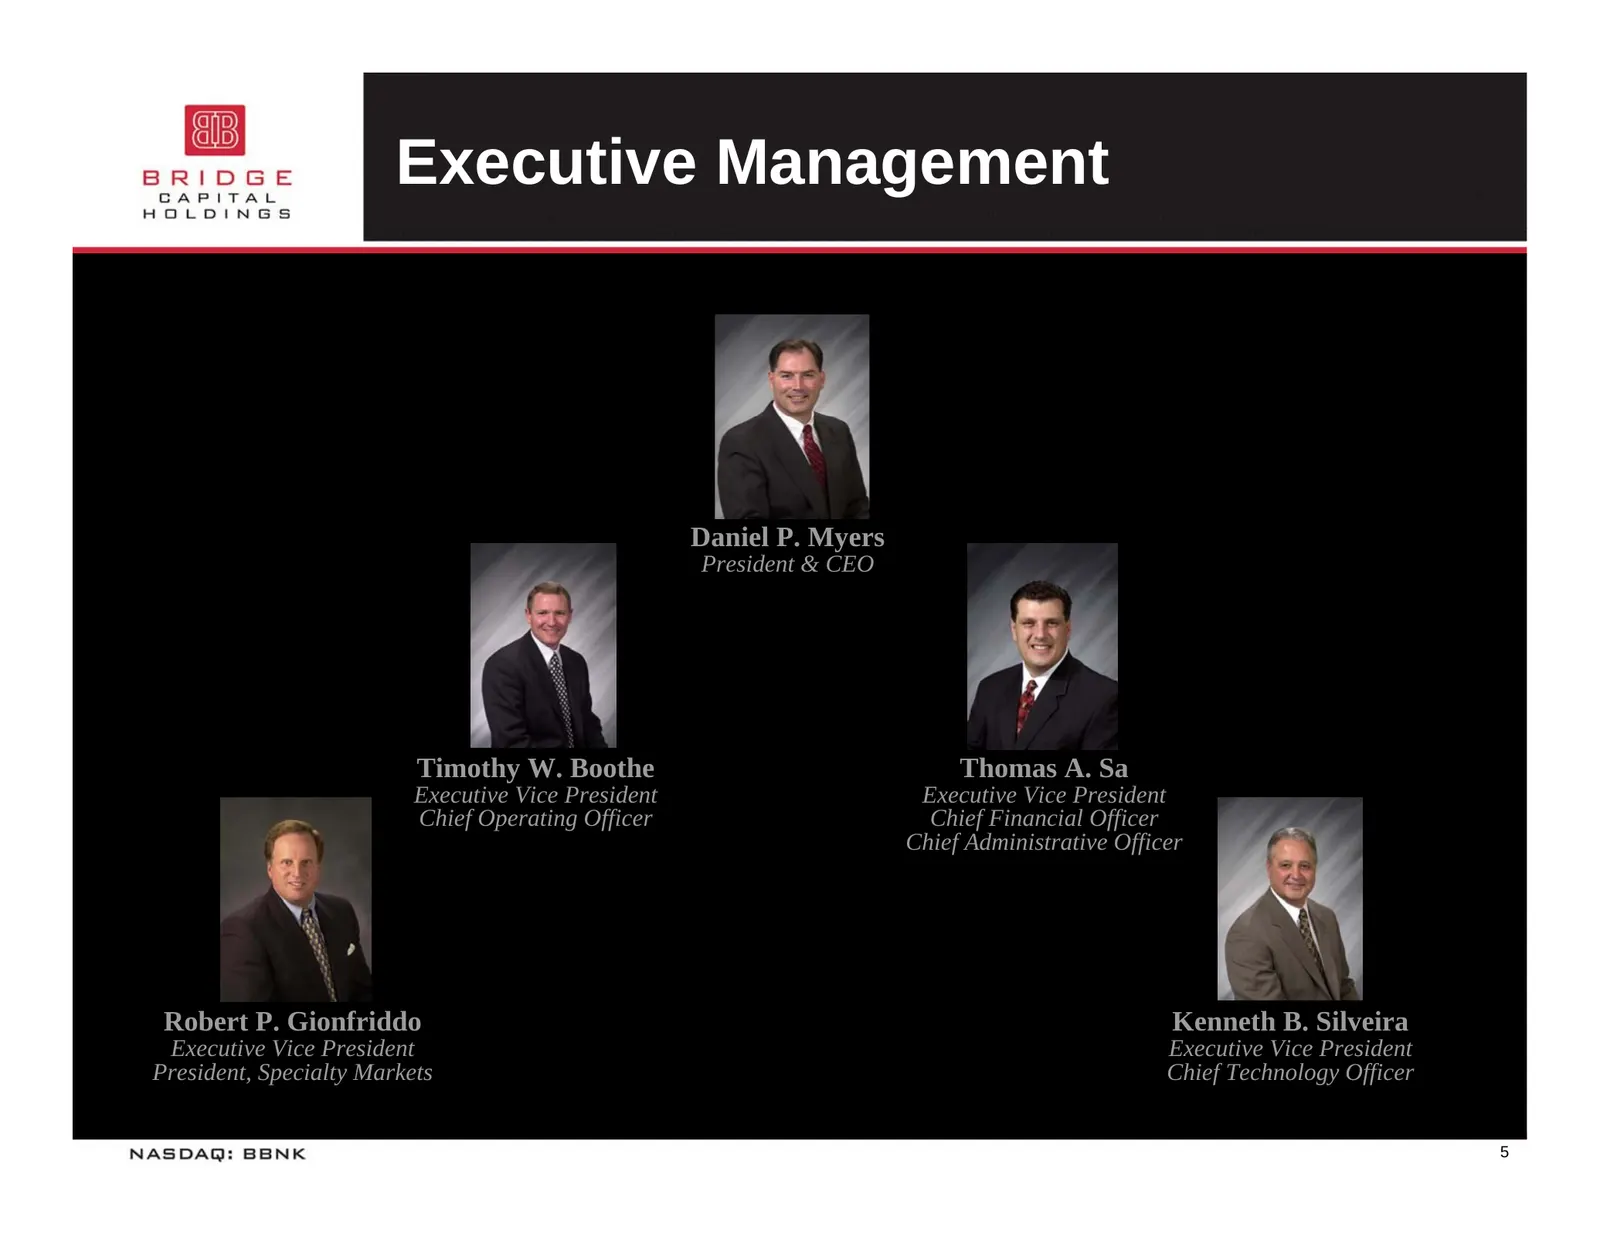
Slide 5: Executive Management
Executive Management Daniel P. Myers President & CEO Timothy W. Boothe Thomas A. Sa Executive Vice President Executive Vice President Chief Operating Officer Chief Financial Officer Chief Administrative Officer Robert P. Gionfriddo Kenneth B. Silveira Executive Vice President Executive Vice Presiden
Slide 6: Balance Sheet Growth
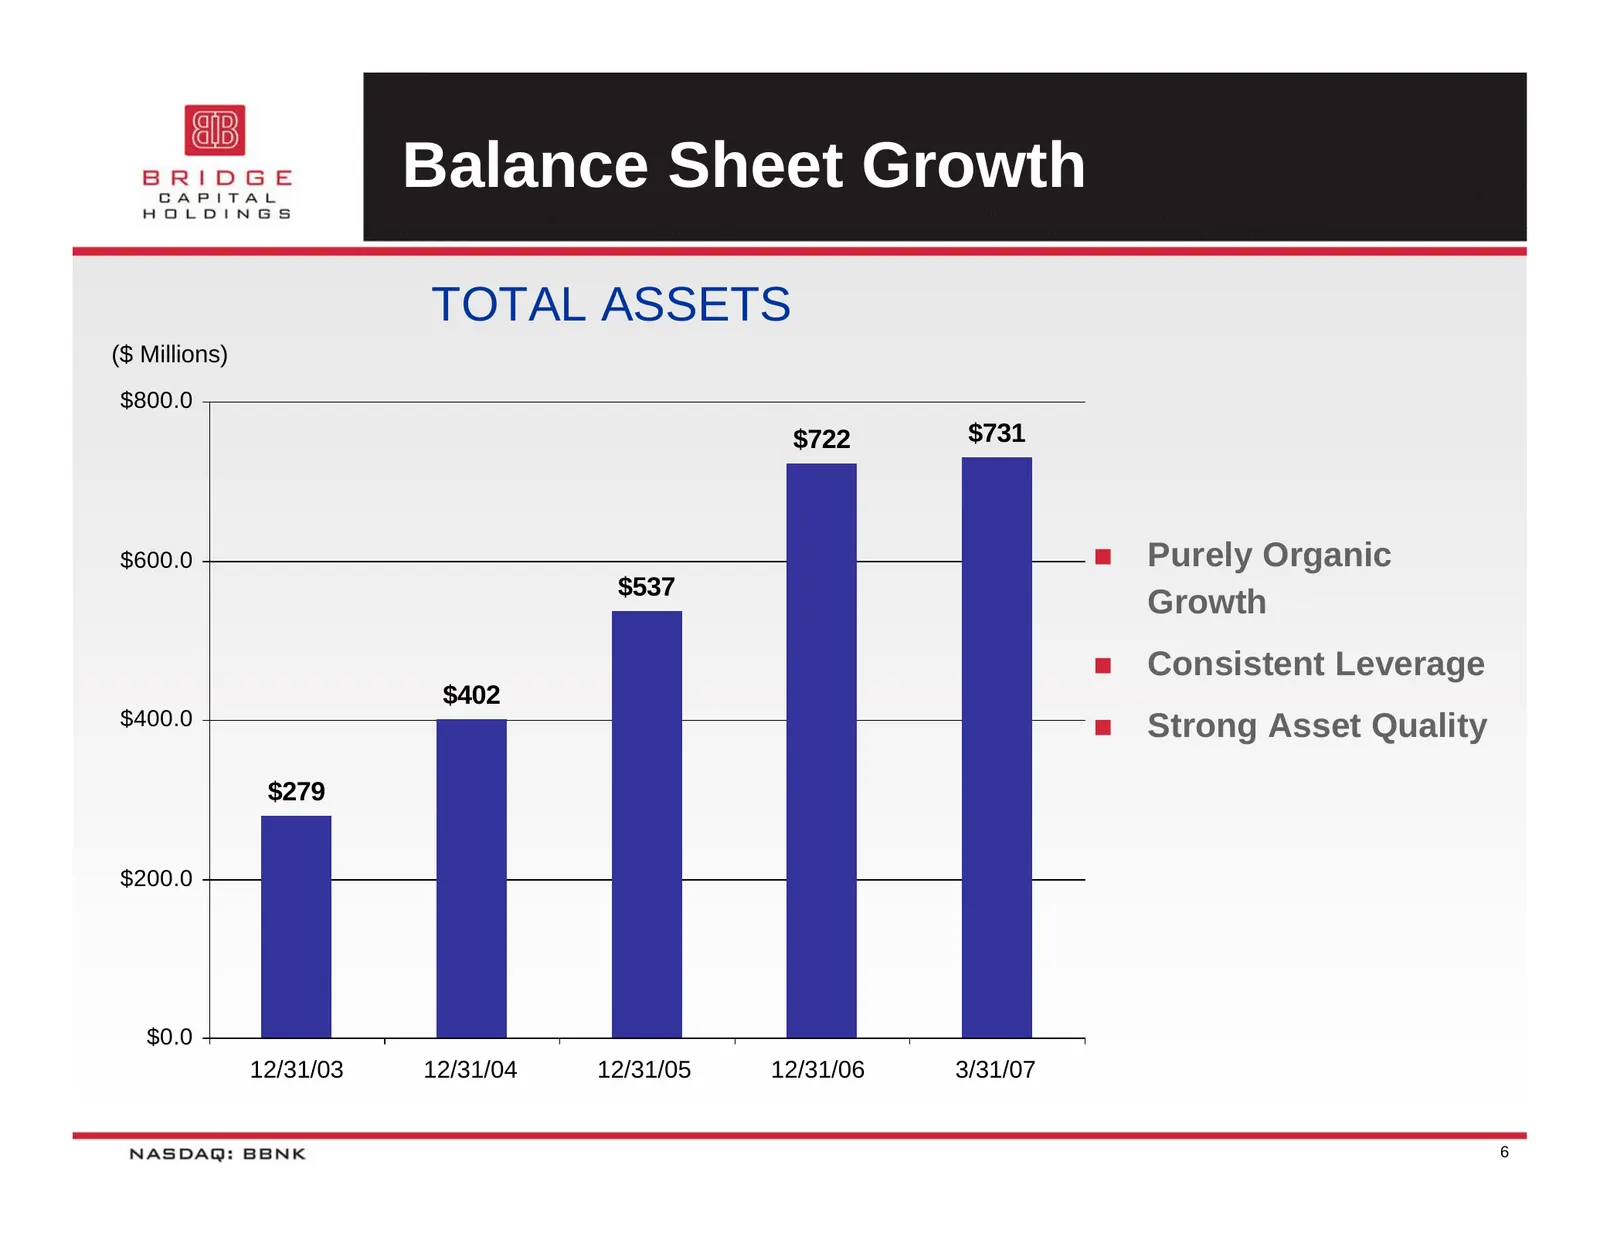
Balance Sheet Growth TOTAL ASSETS ($ Millions) $800.0 $722 $731 $600.0 Purely Organic $537 Growth Consistent Leverage $402 $400.0 Strong Asset Quality $279 $200.0 $0.0 12/31/03 12/31/04 12/31/05 12/31/06 3/31/07 6
Slide 7: Profitability: Net Income & EPS
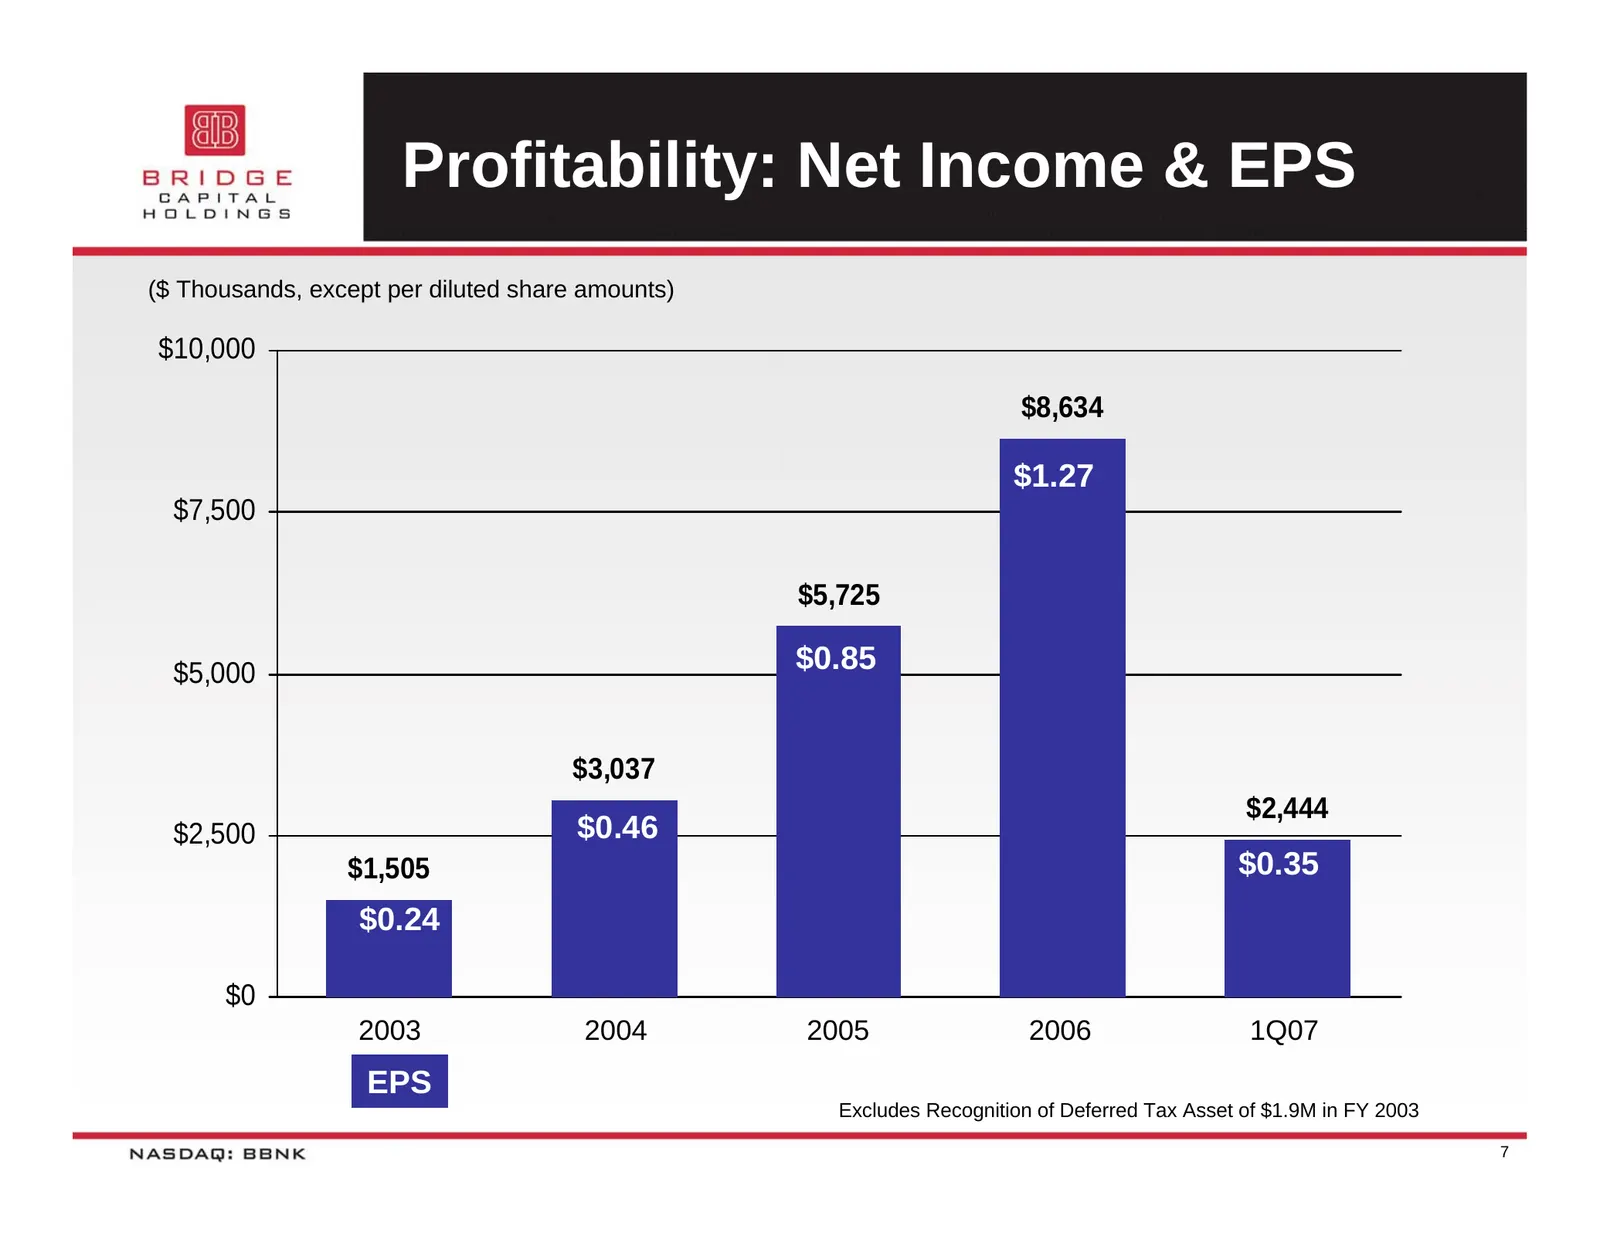
Profitability: Net Income & EPS ($ Thousands, except per diluted share amounts) $10,000 $8,634 $1.27 $7,500 $5,725 $5,000 $0.85 $3,037 $2,444 $2,500 $0.46 $1,505 $0.35 $0.24 $0 2003 2004 2005 2006 1Q07 EPS Excludes Recognition of Deferred Tax Asset of $1.9M in FY 2003 7
Slide 8: Increasing Returns: ROE
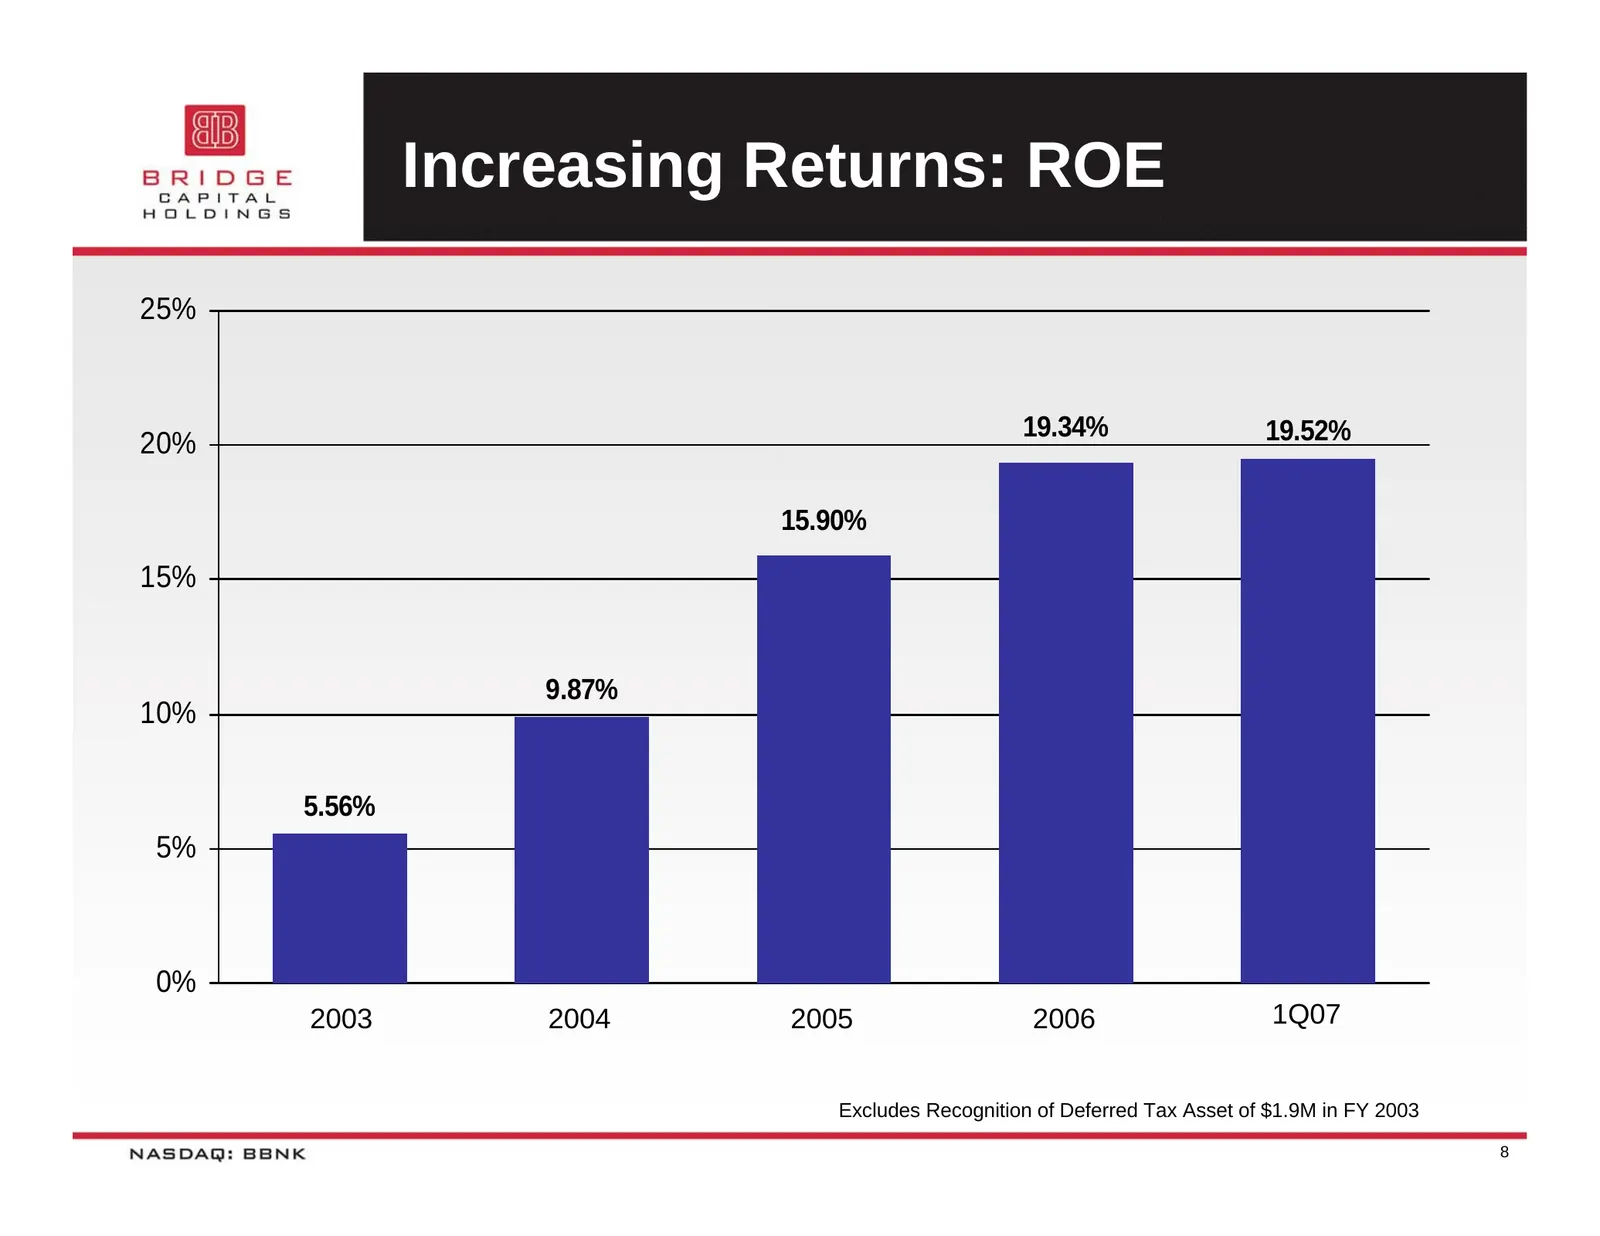
Increasing Returns: ROE 25% 19.34% 19.52% 20% 15.90% 15% 9.87% 10% 5.56% 5% 0% 2003 2004 2005 2006 1Q07 Excludes Recognition of Deferred Tax Asset of $1.9M in FY 2003 8
Slide 9: BBNK (NASDAQ-Global Market)
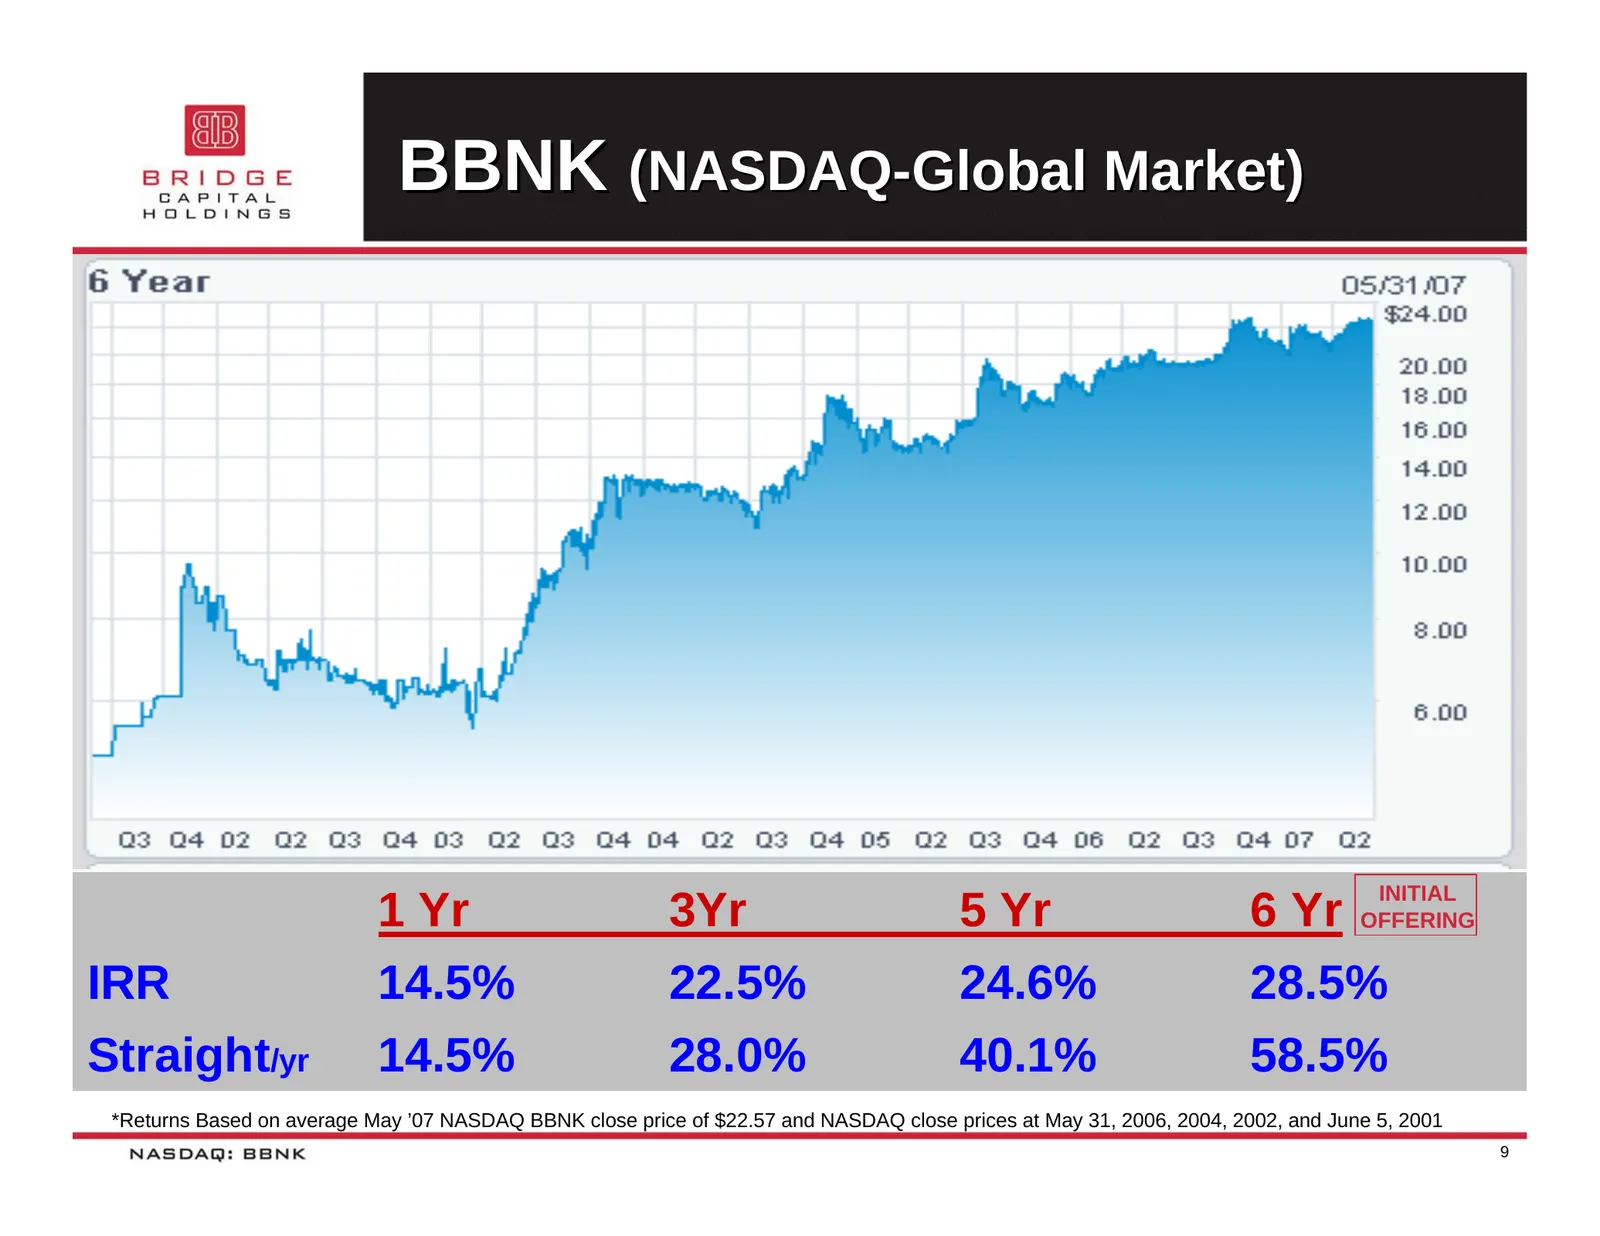
BBNK (NASDAQ-Global Market) INITIAL 1 Yr 3Yr 5 Yr 6 Yr OFFERING IRR 14.5% 22.5% 24.6% 28.5% Straight/yr 14.5% 28.0% 40.1% 58.5% *Returns Based on average May ’07 NASDAQ BBNK close price of $22.57 and NASDAQ close prices at May 31, 2006, 2004, 2002, and June 5, 2001 9
Slide 10: Shareholder Briefing
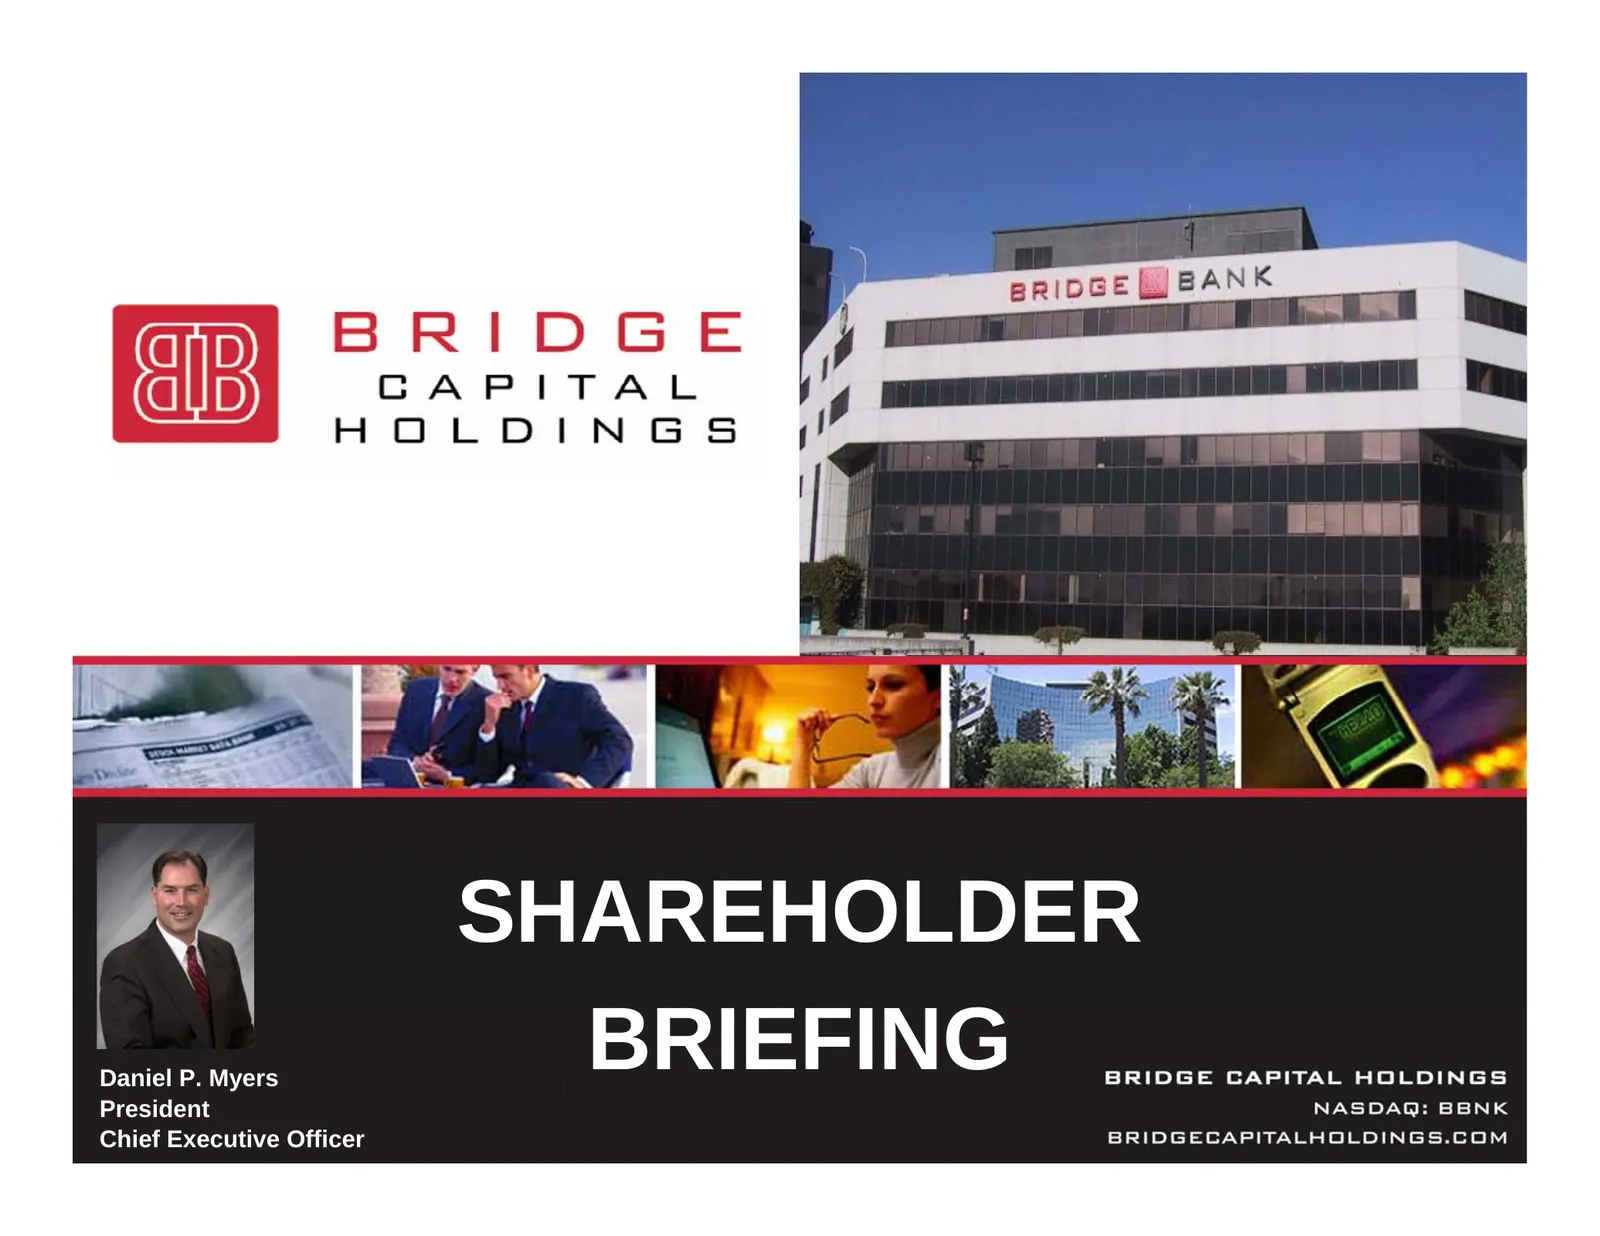
SHAREHOLDER Daniel P. Myers BRIEFING President Chief Executive Officer
Slide 11: Bridge Bank
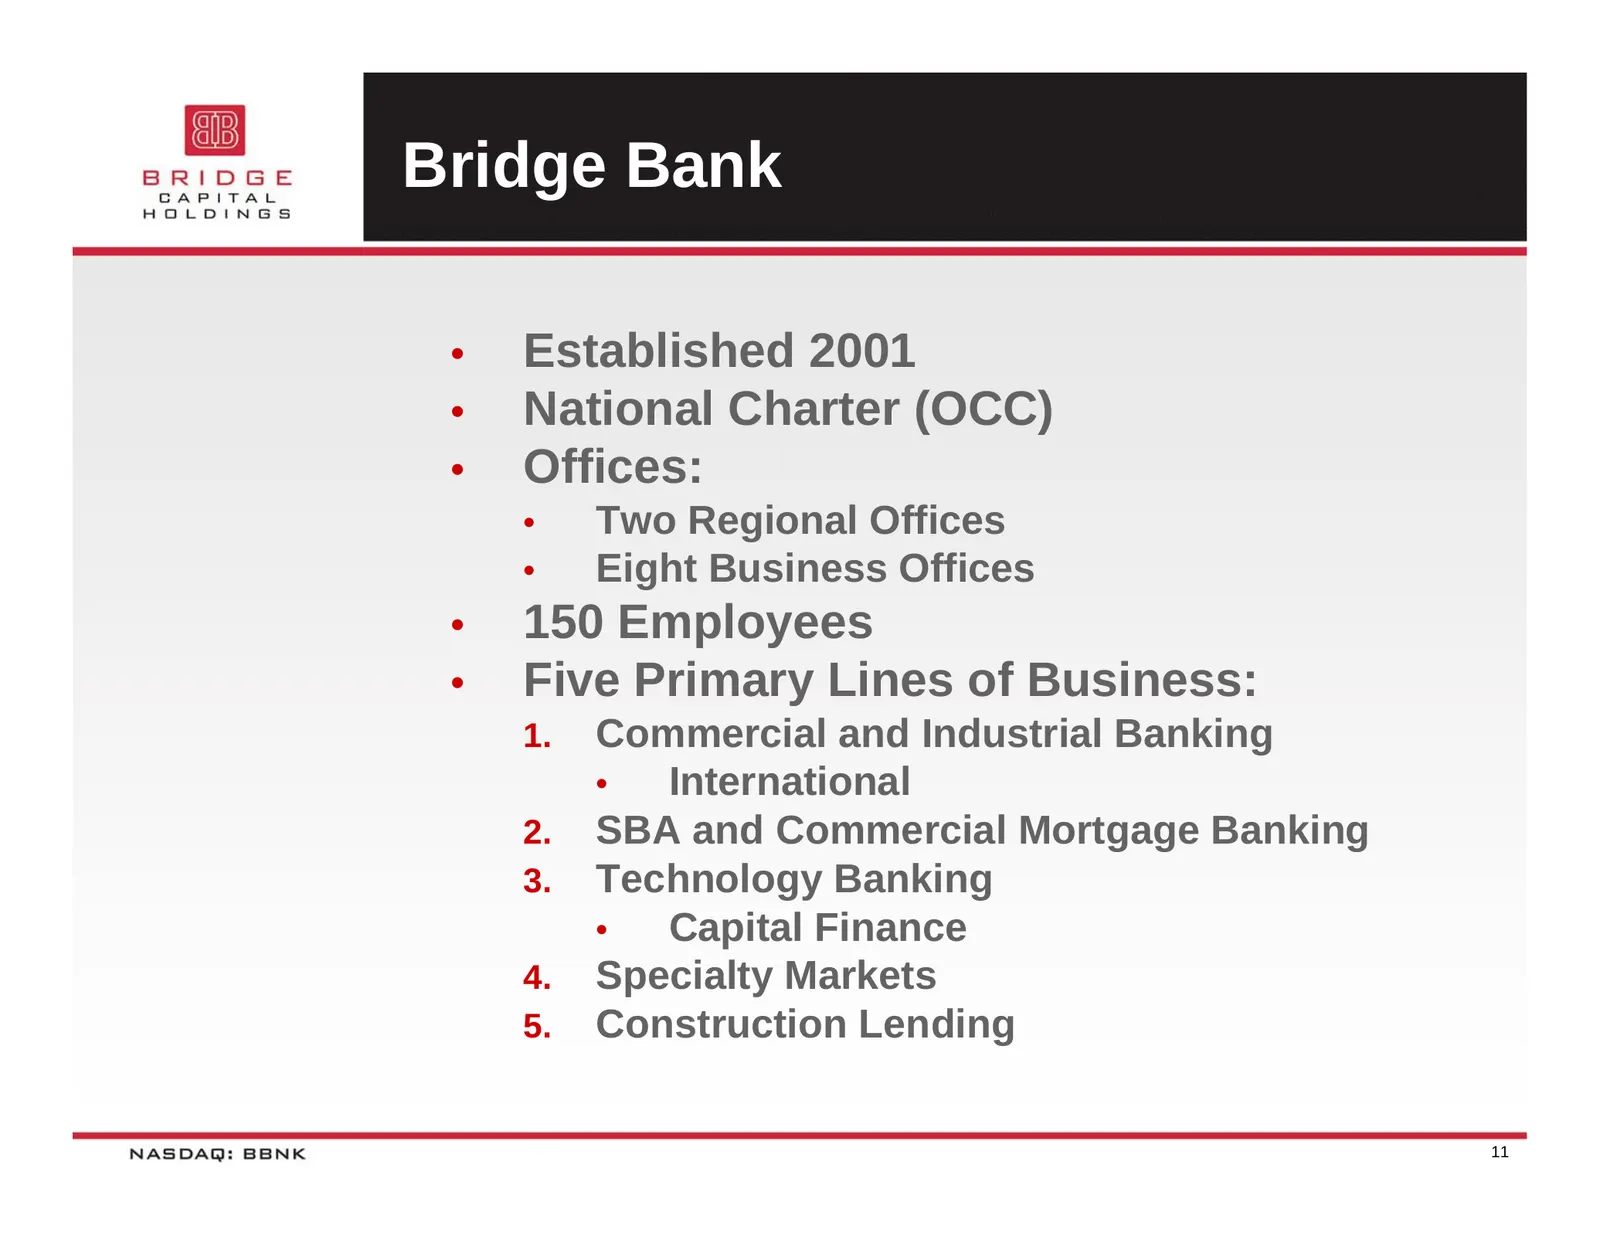
Bridge Bank • Established 2001 • National Charter (OCC) • Offices: • Two Regional Offices • Eight Business Offices • 150 Employees • Five Primary Lines of Business: 1. Commercial and Industrial Banking • International 2. SBA and Commercial Mortgage Banking 3. Technology Banking • Capital Finance 4.
Slide 12: Our Model = Results
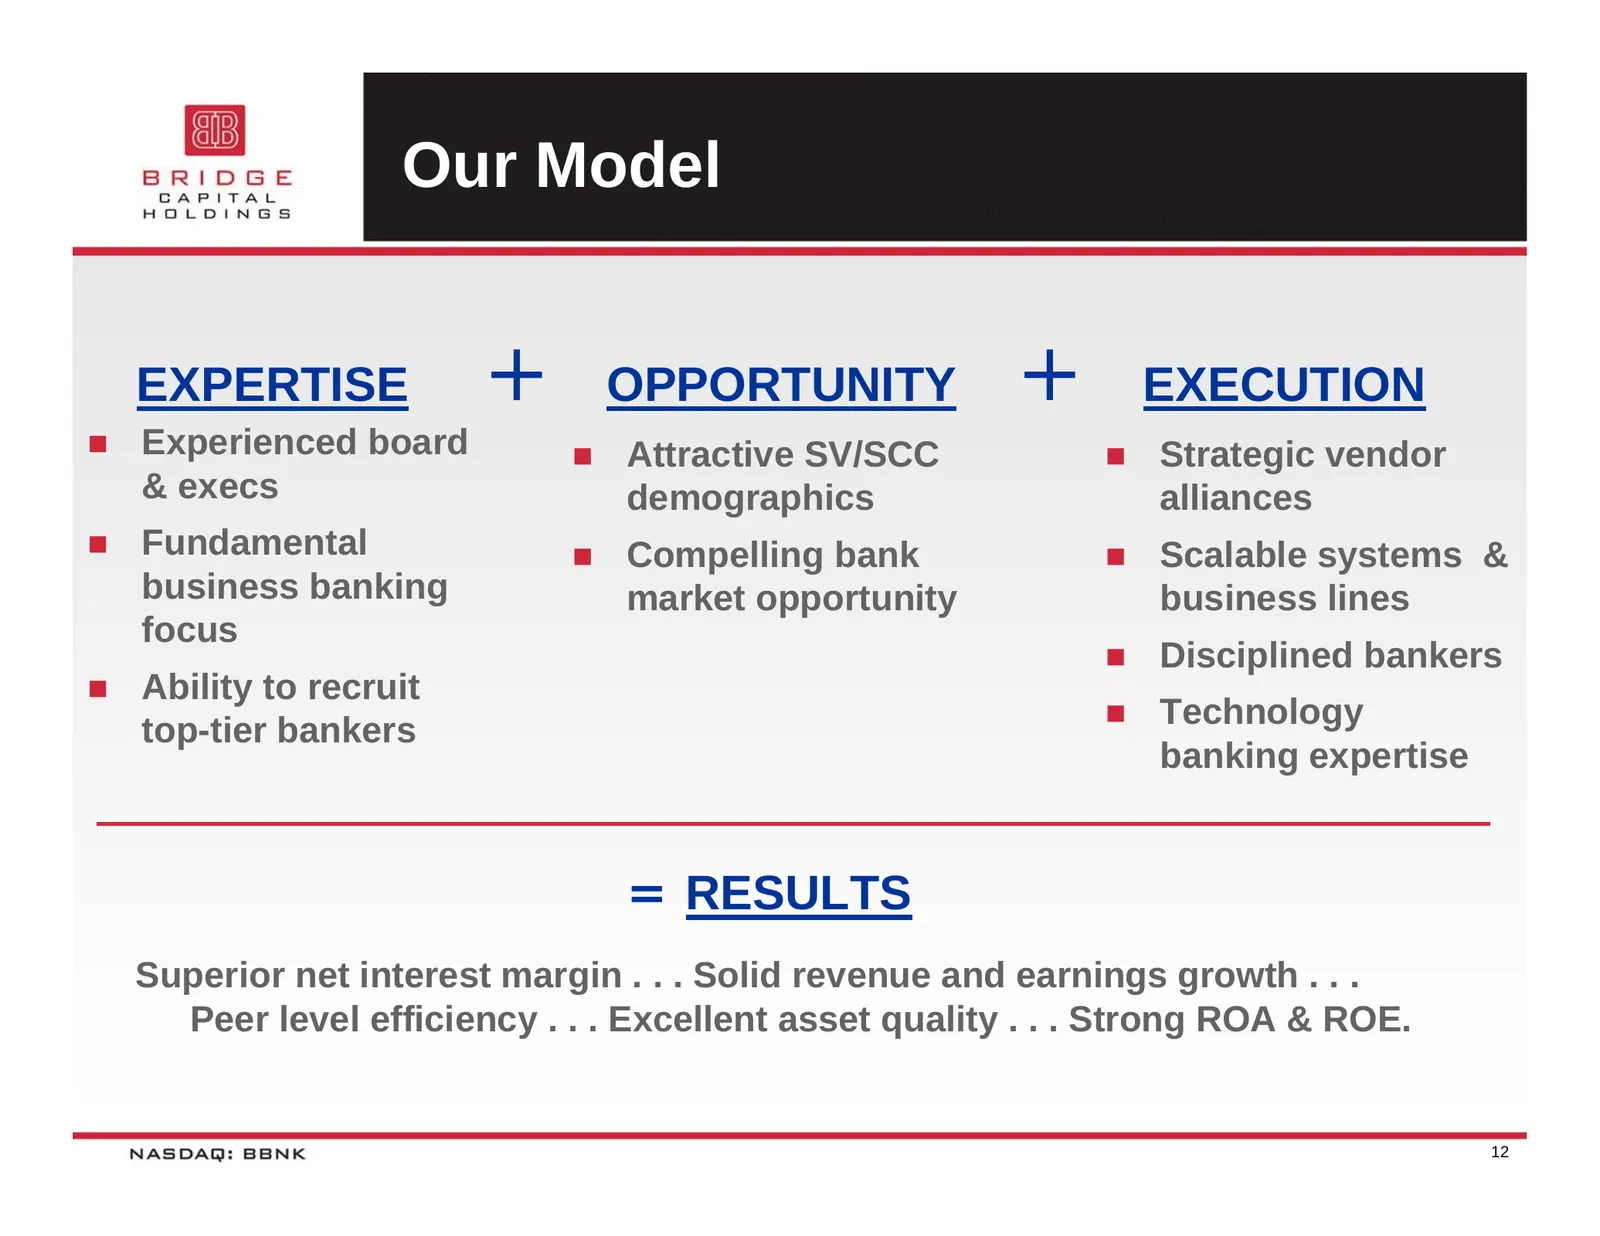
Our Model EXPERTISE + OPPORTUNITY + EXECUTION Experienced board Attractive SV/SCC Strategic vendor & execs demographics alliances Fundamental Compelling bank Scalable systems & business banking market opportunity business lines focus Disciplined bankers Ability to recruit Technolog
Slide 13: Professional Business Bank of Choice
Our Vision A business banking franchise that is the Professional Business Bank of Choice for small and middle-market businesses and emerging technology companies in Silicon Valley, California, and the Nation 13
Slide 14: Unique Value Proposition
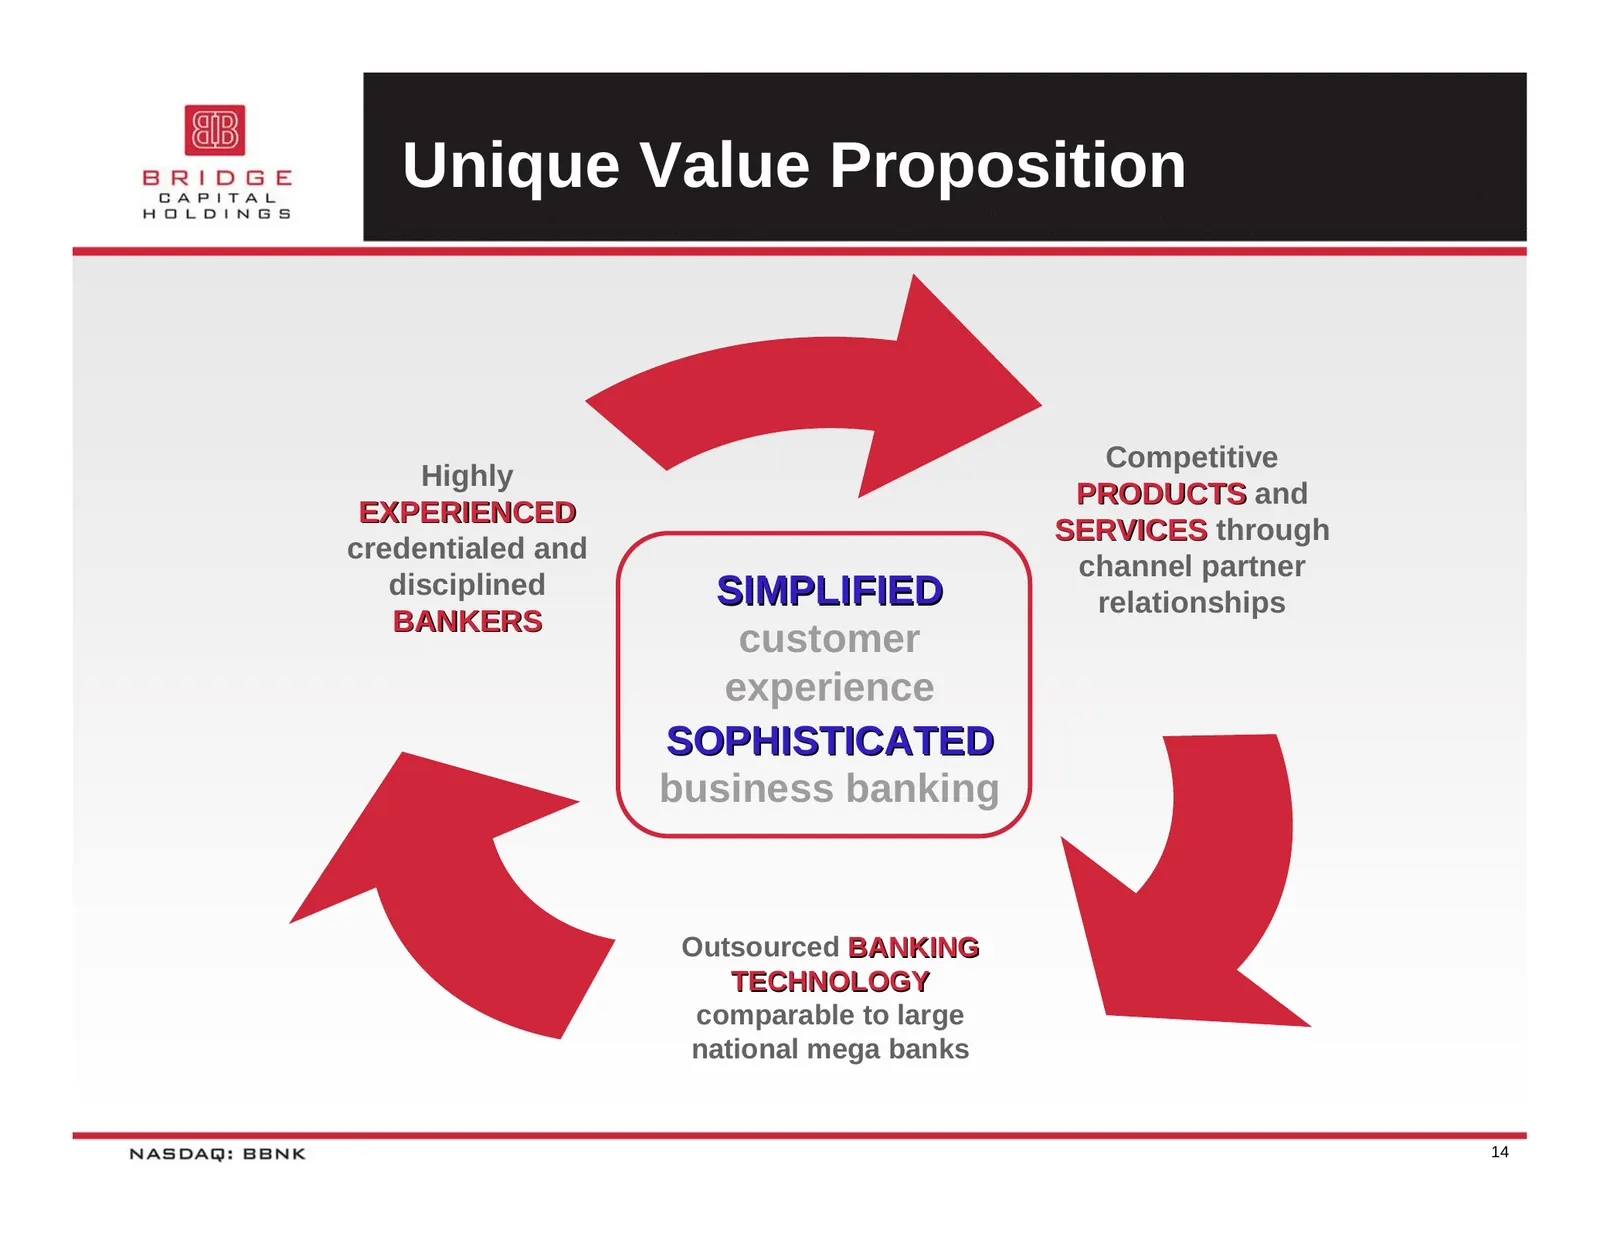
Unique Value Proposition Competitive Highly PRODUCTS and EXPERIENCED SERVICES through credentialed and channel partner disciplined SIMPLIFIED relationships BANKERS customer experience SOPHISTICATED business banking Outsourced BANKING TECHNOLOGY comparable to large national mega banks 14
Slide 15: Senior Officers
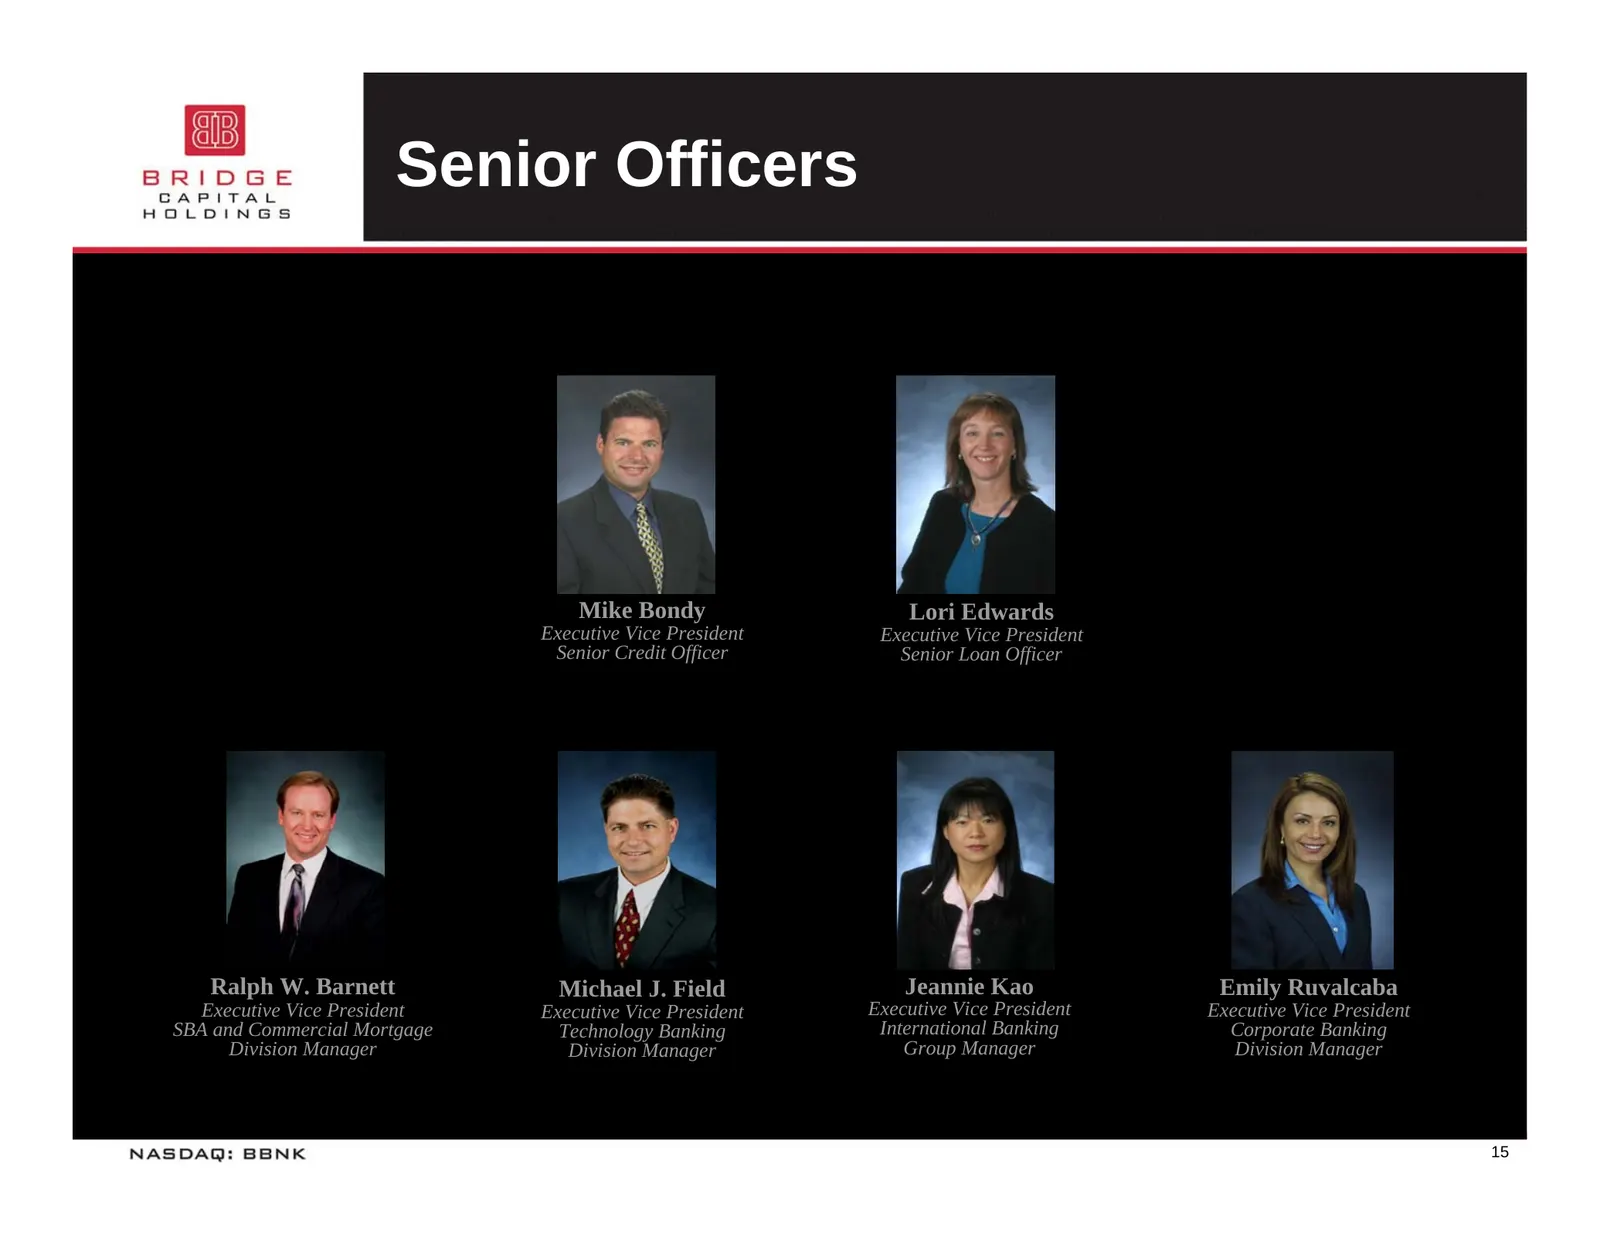
Senior Officers Mike Bondy Lori Edwards Executive Vice President Executive Vice President Senior Credit Officer Senior Loan Officer Ralph W. Barnett Michael J. Field Jeannie Kao Emily Ruvalcaba Executive Vice President Executive Vice President Executive Vice President Executive Vice President SBA an
Slide 16: Market Dynamics
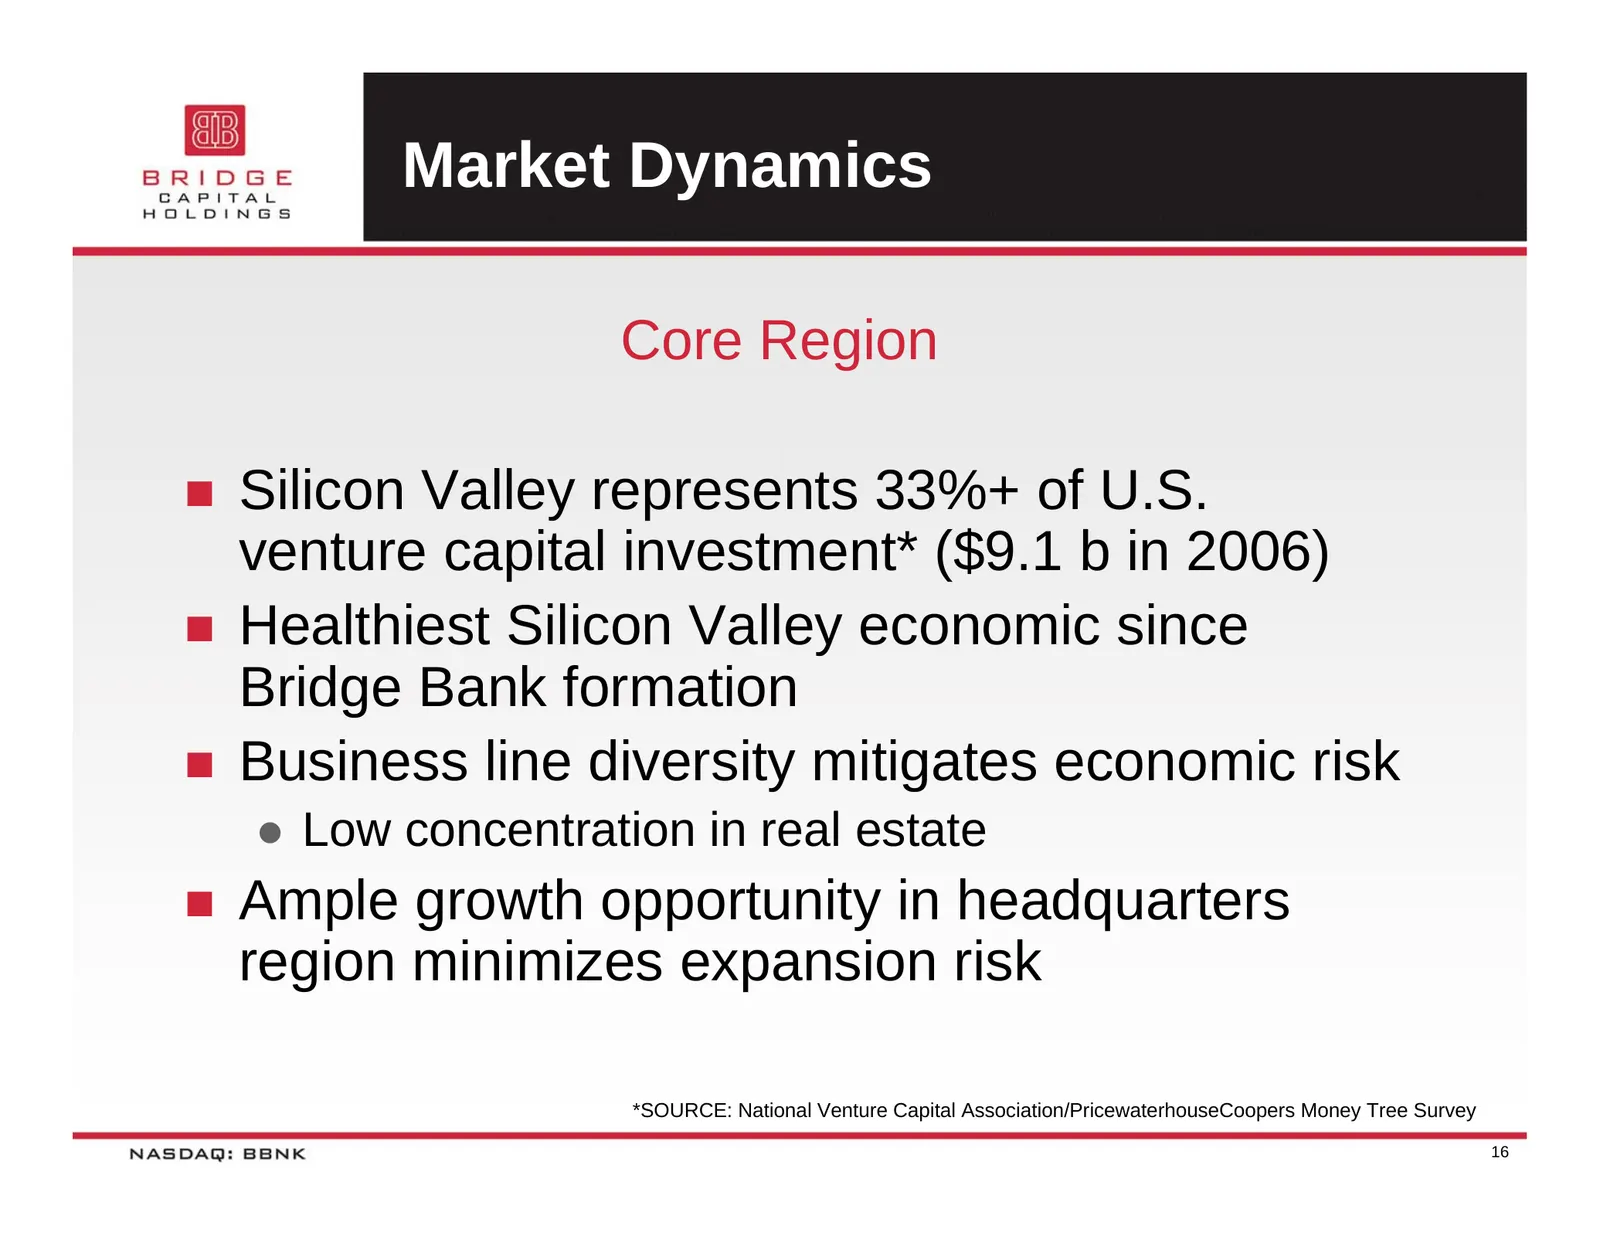
Market Dynamics Core Region Silicon Valley represents 33%+ of U.S. venture capital investment* ($9.1 b in 2006) Healthiest Silicon Valley economic since Bridge Bank formation Business line diversity mitigates economic risk z Low concentration in real estate Ample growth opportunity in headqu
Slide 17: Opportunistic Growth
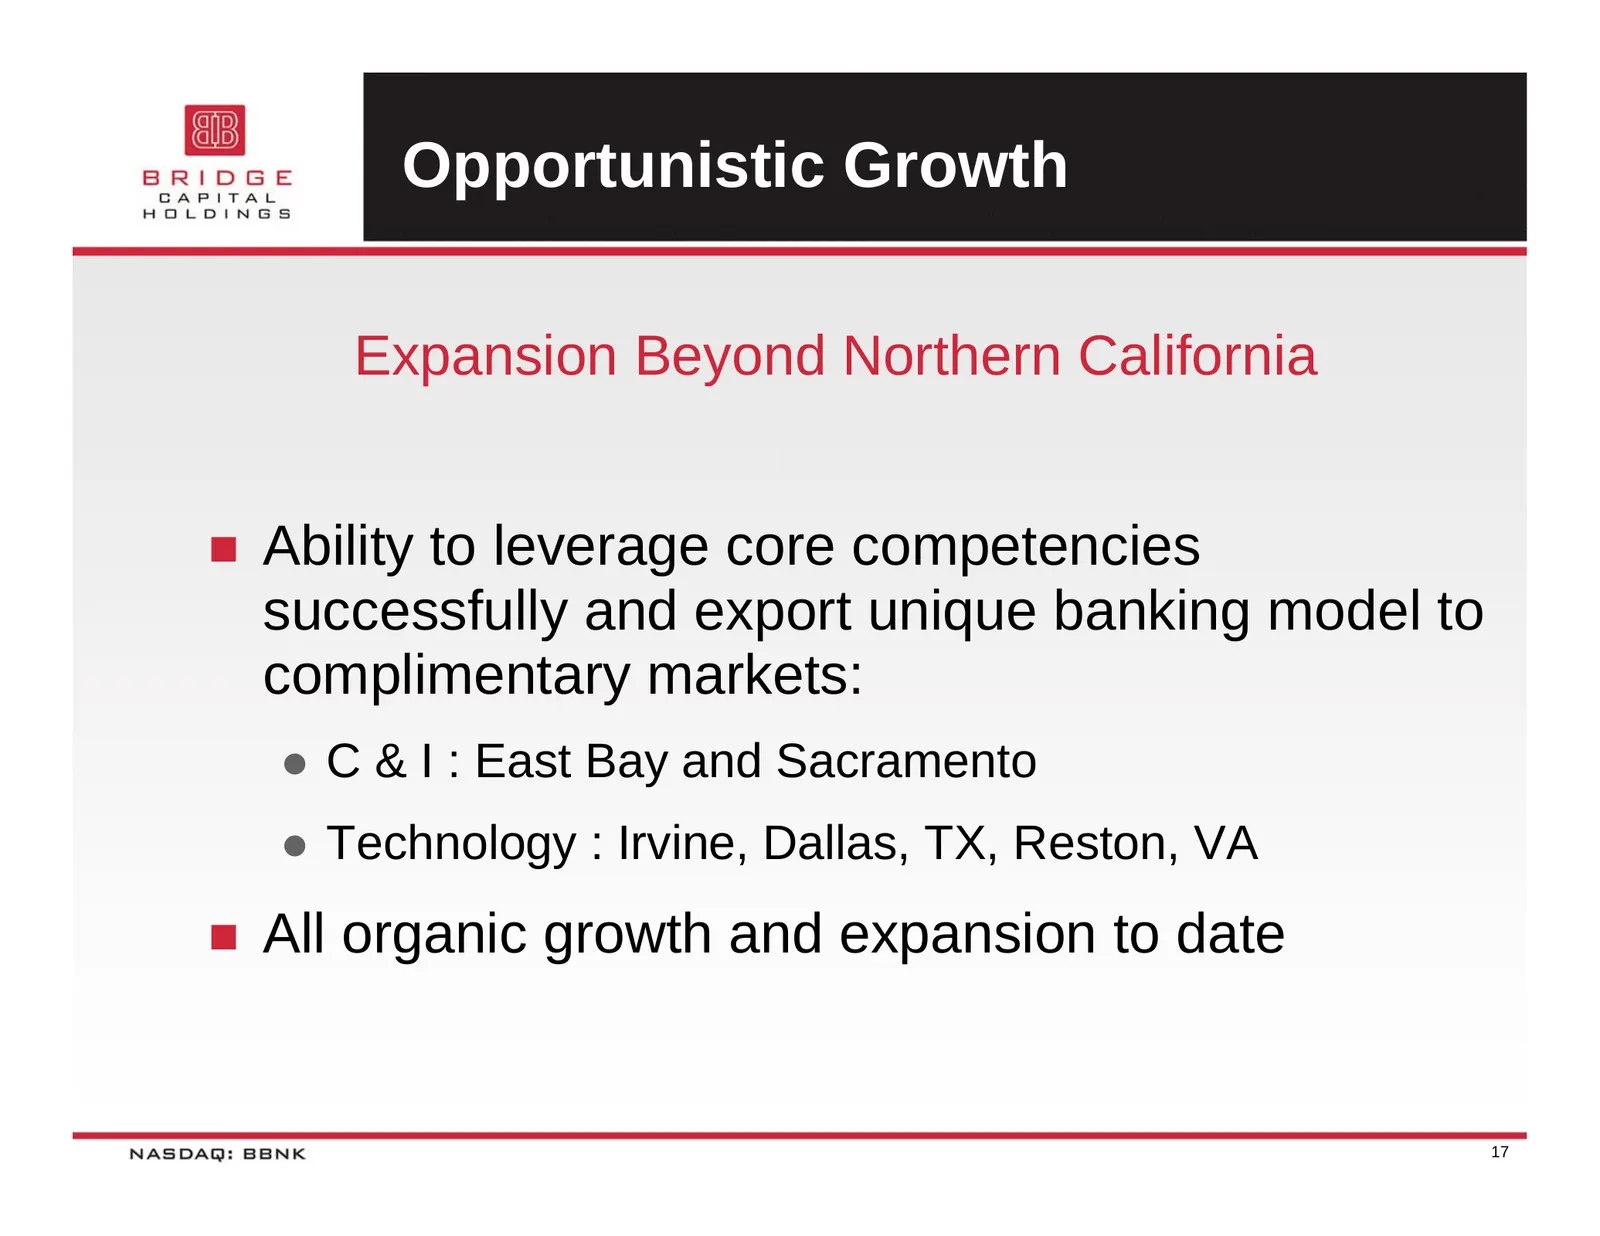
Opportunistic Growth Expansion Beyond Northern California Ability to leverage core competencies successfully and export unique banking model to complimentary markets: z C & I : East Bay and Sacramento z Technology : Irvine, Dallas, TX, Reston, VA All organic growth and expansion to date 17
Slide 18: Geographic Markets
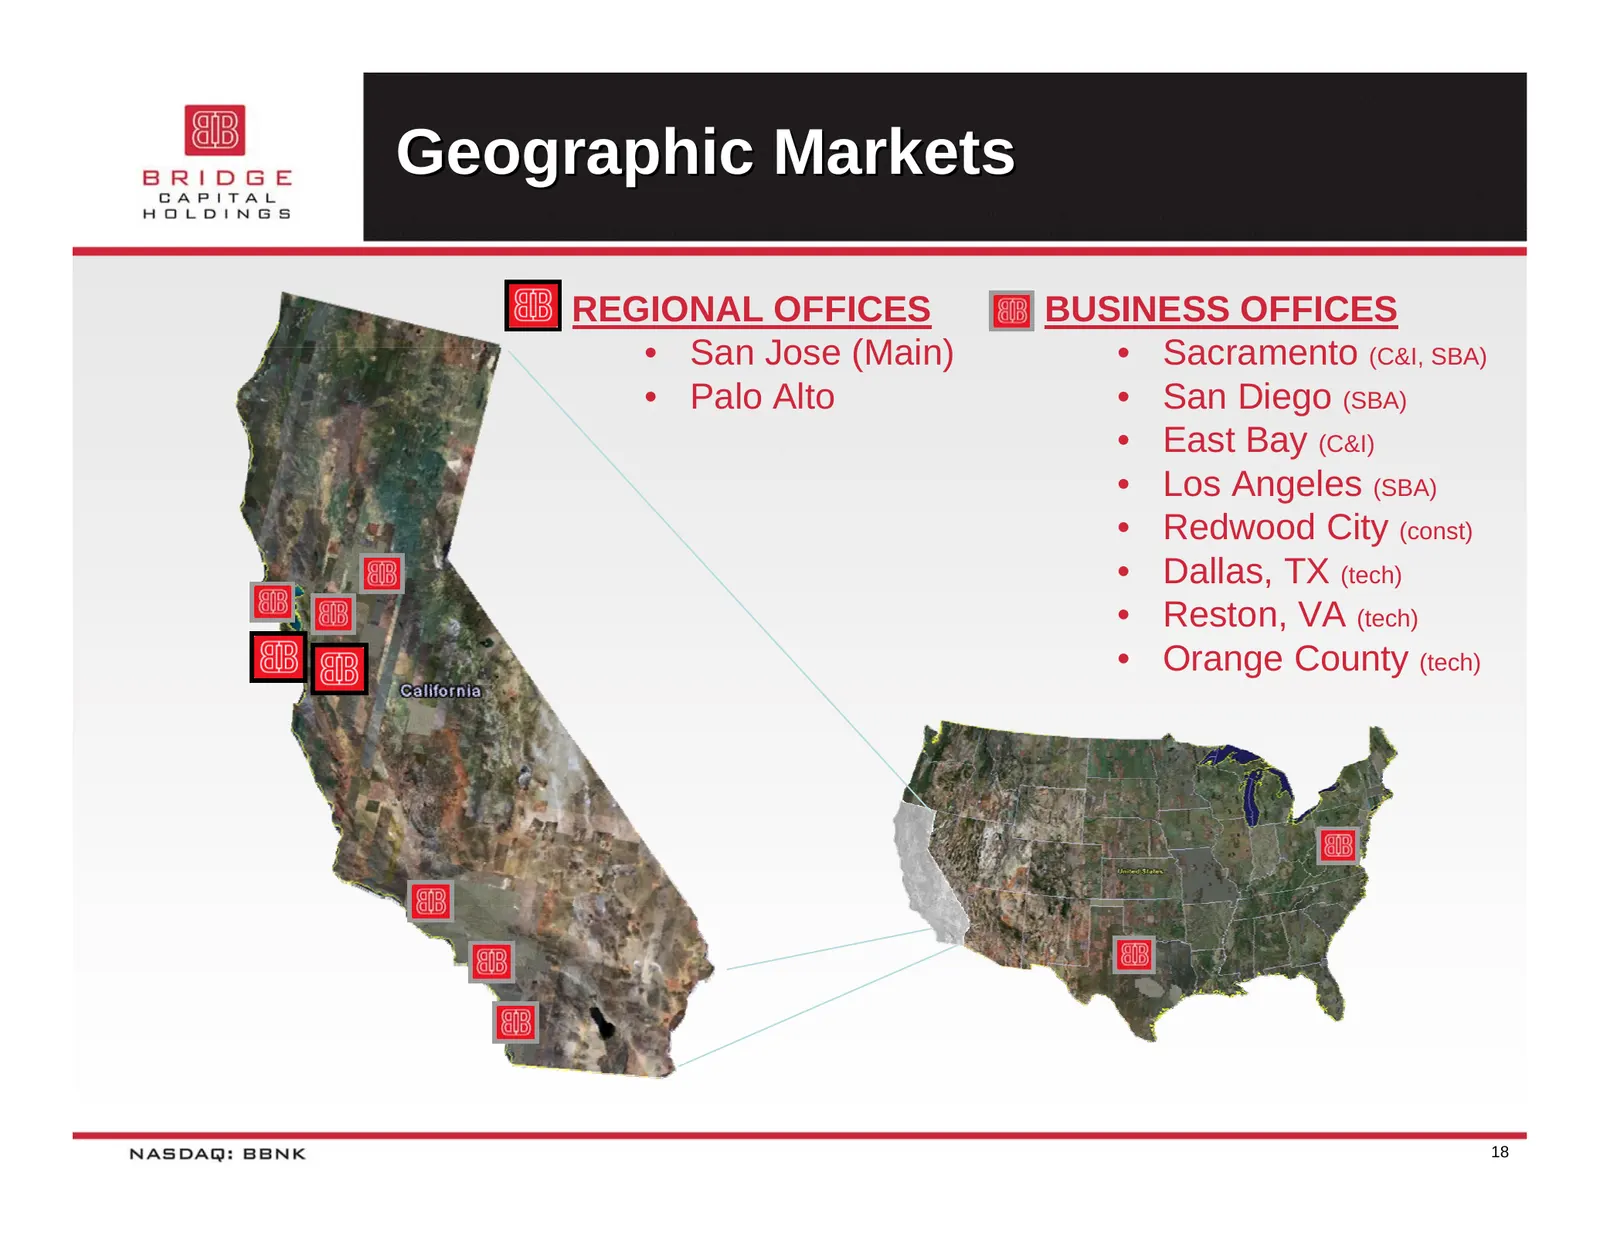
Geographic Markets REGIONAL OFFICES BUSINESS OFFICES • San Jose (Main) • Sacramento (C&I, SBA) • Palo Alto • San Diego (SBA) • East Bay (C&I) • Los Angeles (SBA) • Redwood City (const) • Dallas, TX (tech) • Reston, VA (tech) • Orange County (tech) 18
Slide 19: Financial Results
FINANCIAL RESULTS NASDAQ: BBNK
Slide 20: Balance Sheet Growth
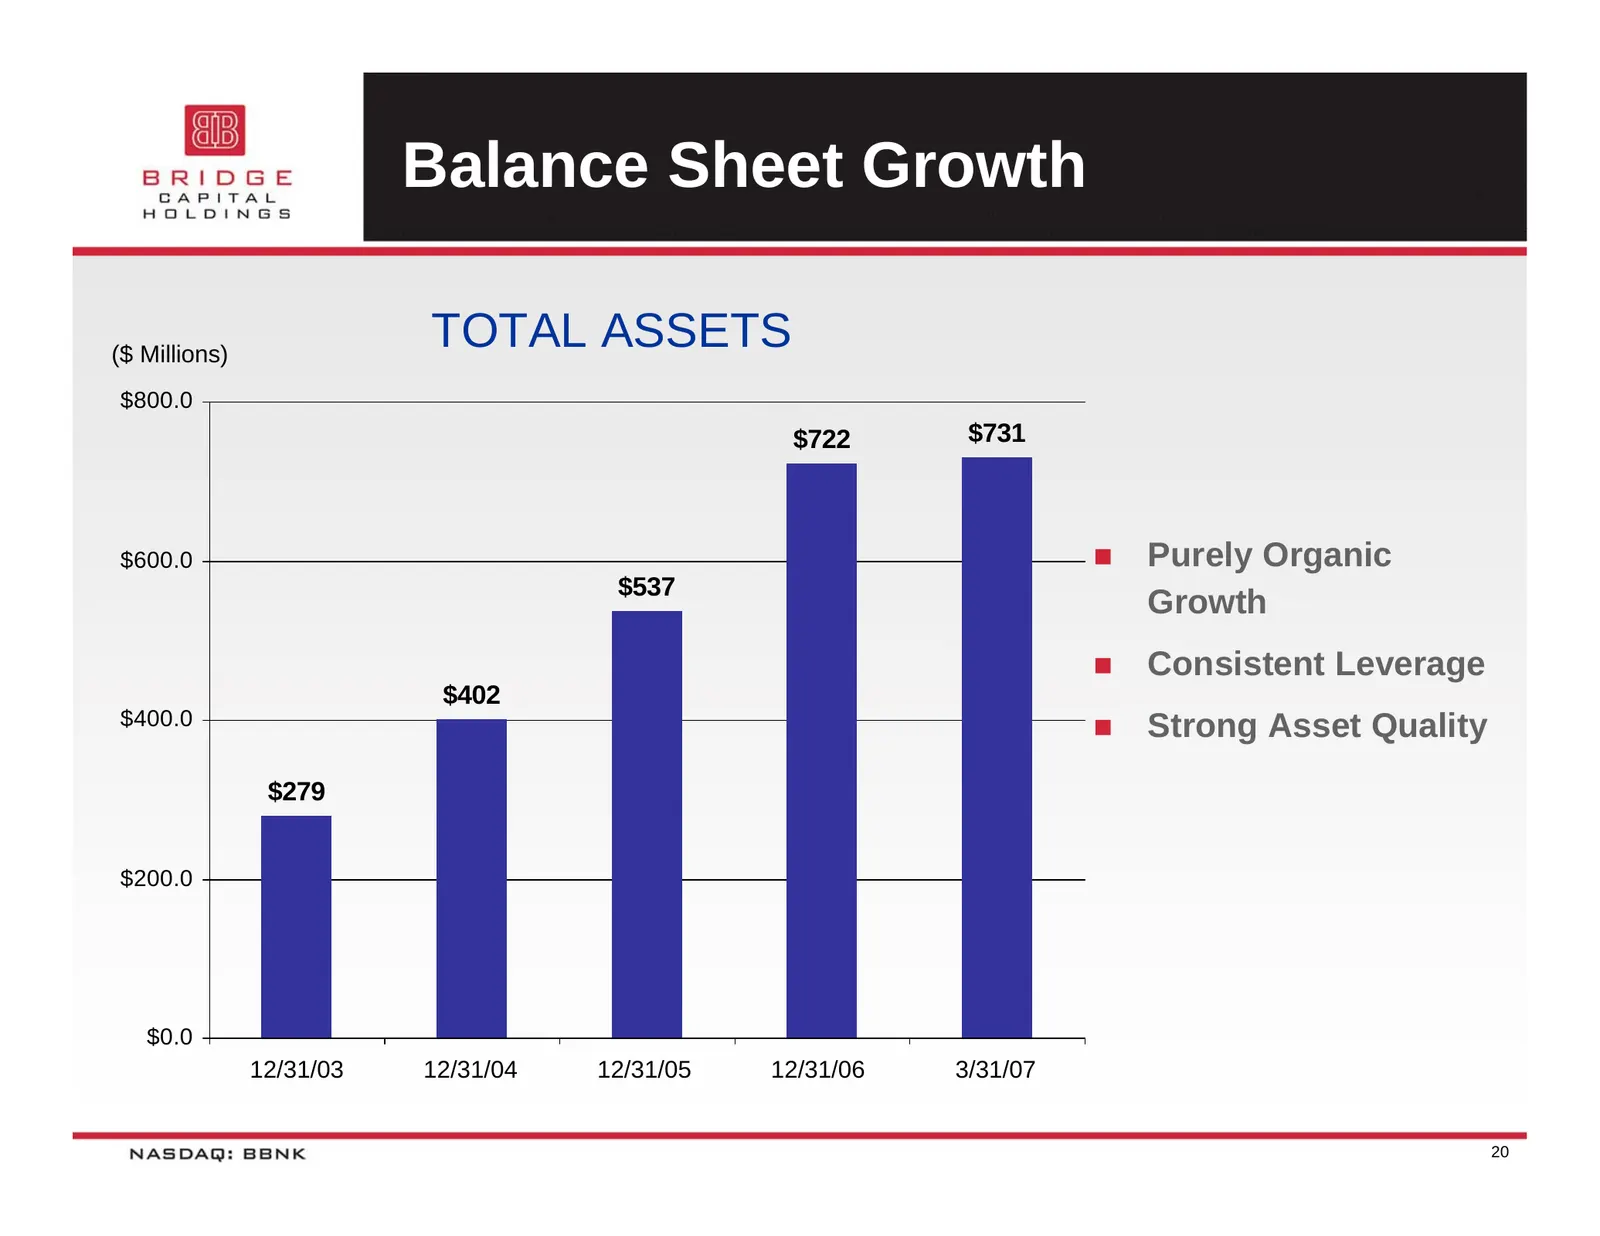
Balance Sheet Growth ($ Millions) TOTAL ASSETS $800.0 $722 $731 $600.0 Purely Organic $537 Growth Consistent Leverage $402 $400.0 Strong Asset Quality $279 $200.0 $0.0 12/31/03 12/31/04 12/31/05 12/31/06 3/31/07 20
Slide 21: Focus on Core Funding Sources
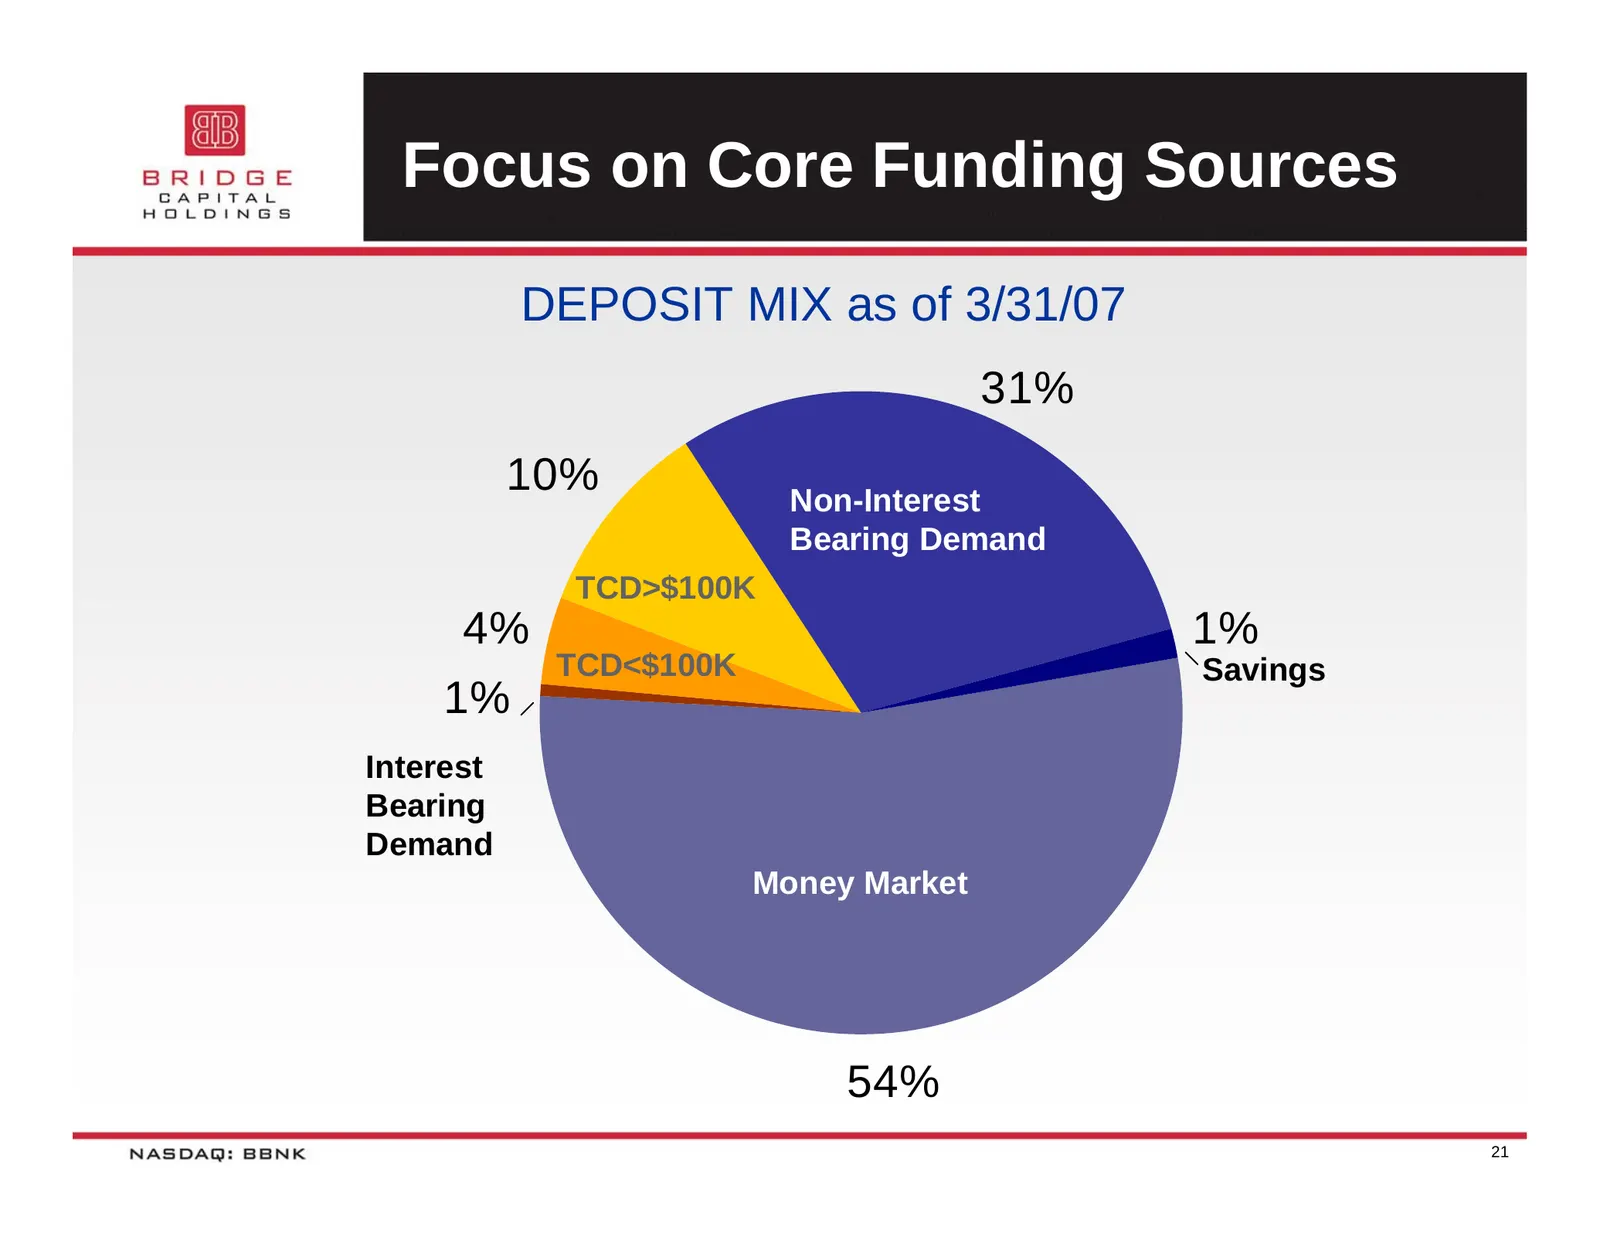
Focus on Core Funding Sources DEPOSIT MIX as of 3/31/07 31% 10% Non-Interest Bearing Demand TCD>$100K 4% 1% TCD<$100K Savings 1% Interest Bearing Demand Money Market 54% 21
Slide 22: Diversification of Lending Activity
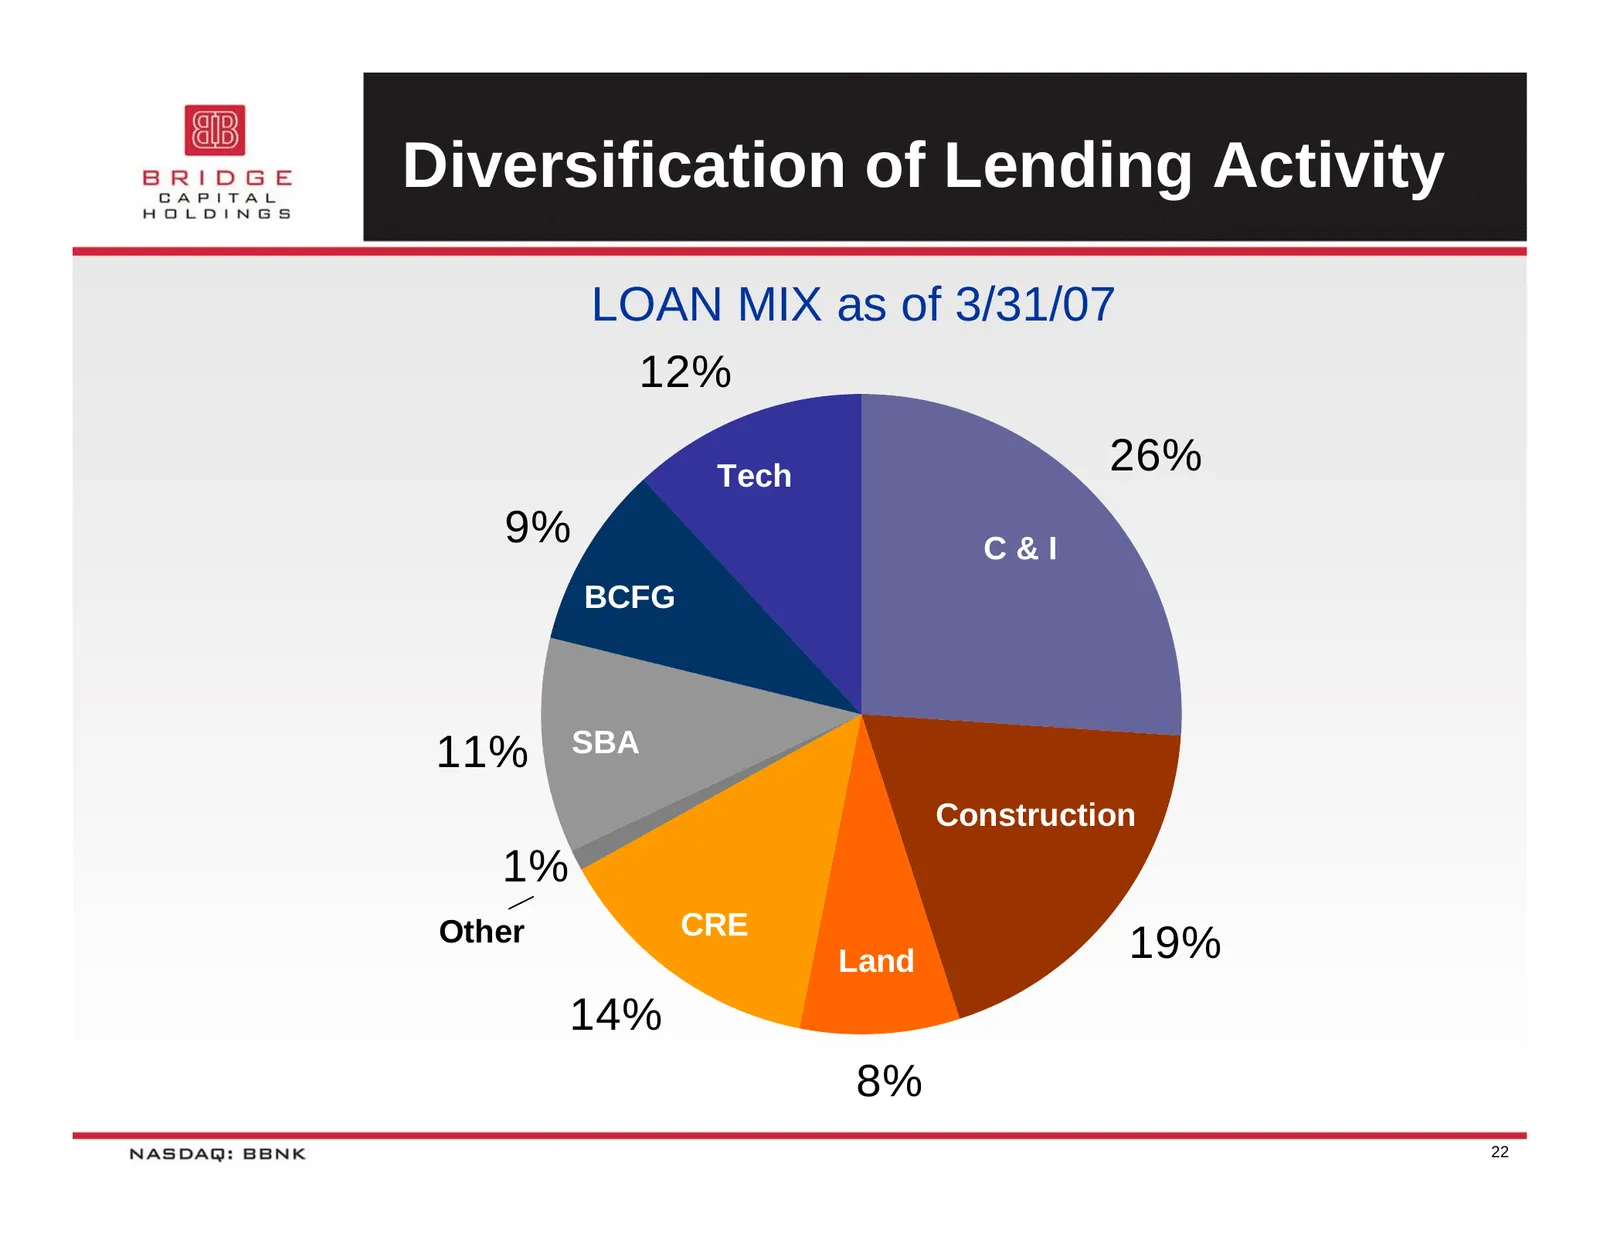
Diversification of Lending Activity LOAN MIX as of 3/31/07 12% Tech 26% 9% C&I BCFG 11% SBA Construction 1% Other CRE Land 19% 14% 8% 22
Slide 23: 3rd Highest % of C&I Loans
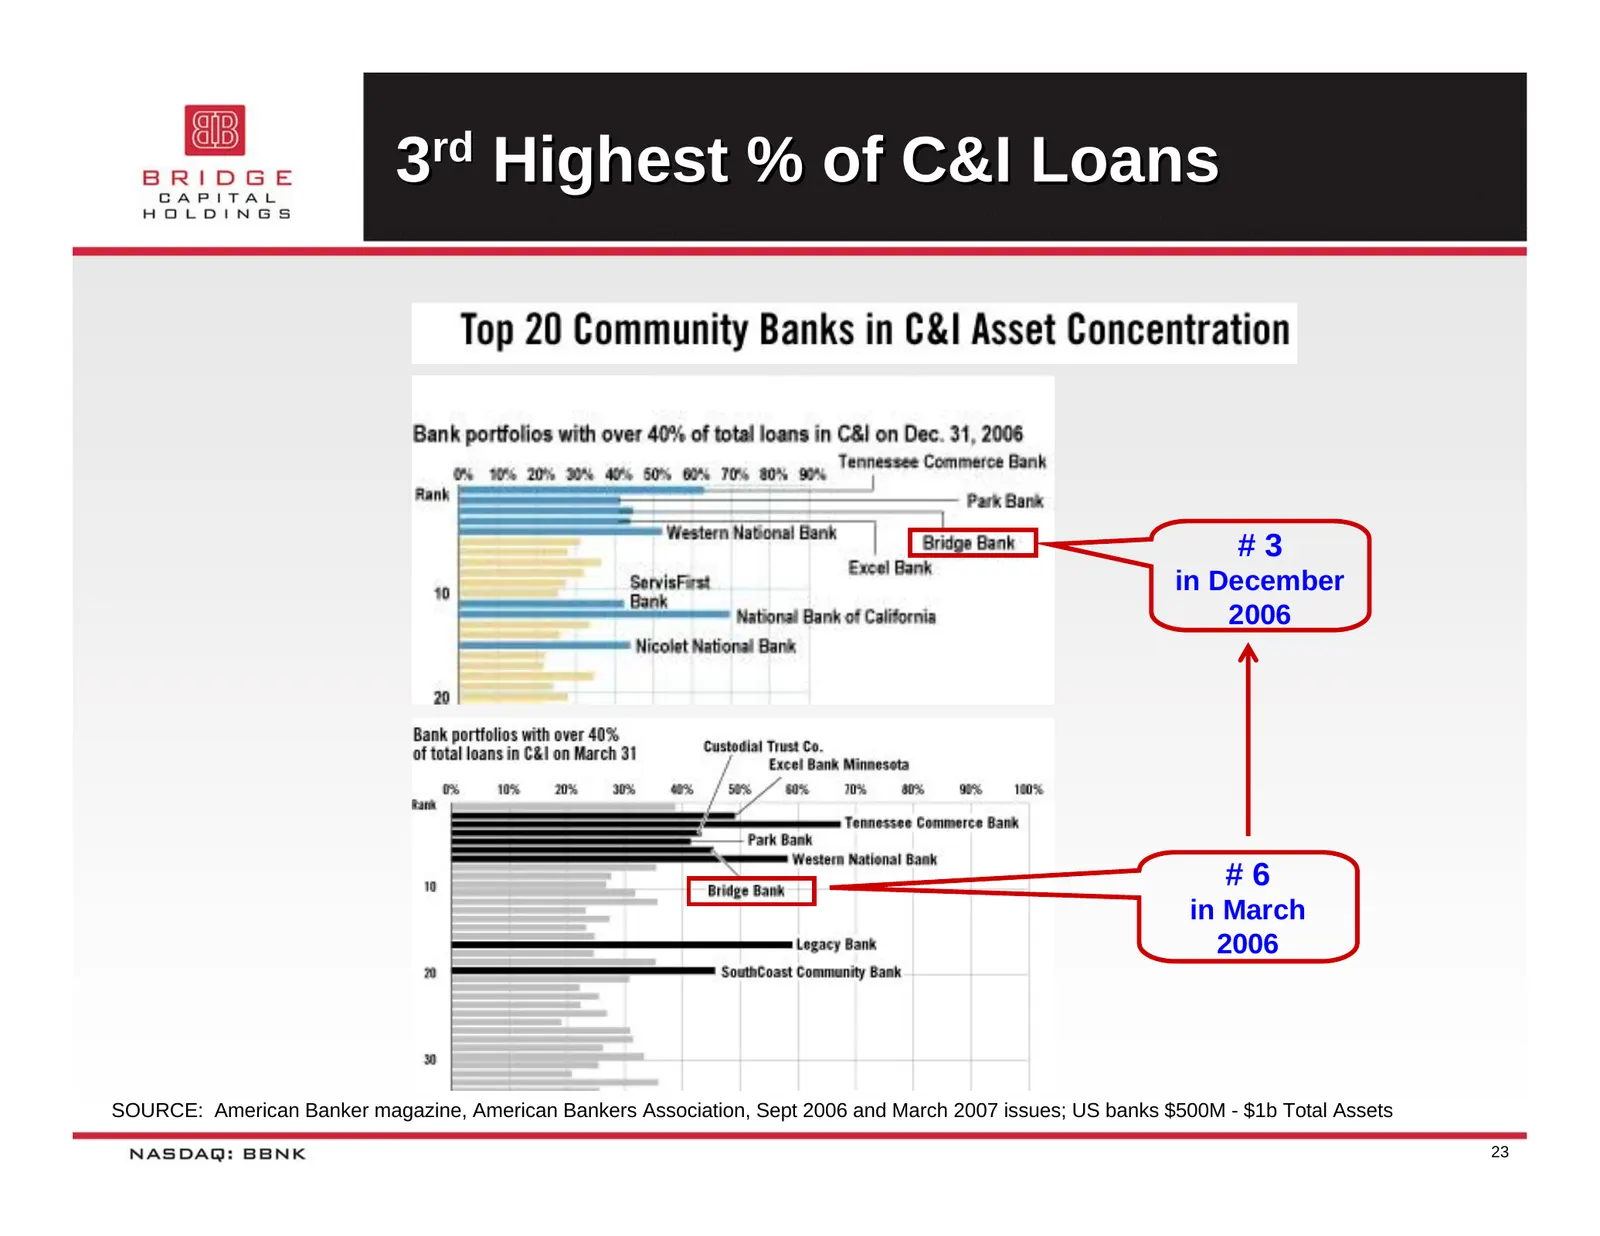
3rd Highest % of C&I Loans #3 in December 2006 #6 in March 2006 SOURCE: American Banker magazine, American Bankers Association, Sept 2006 and March 2007 issues; US banks $500M - $1b Total Assets 23
Slide 24: Asset Quality
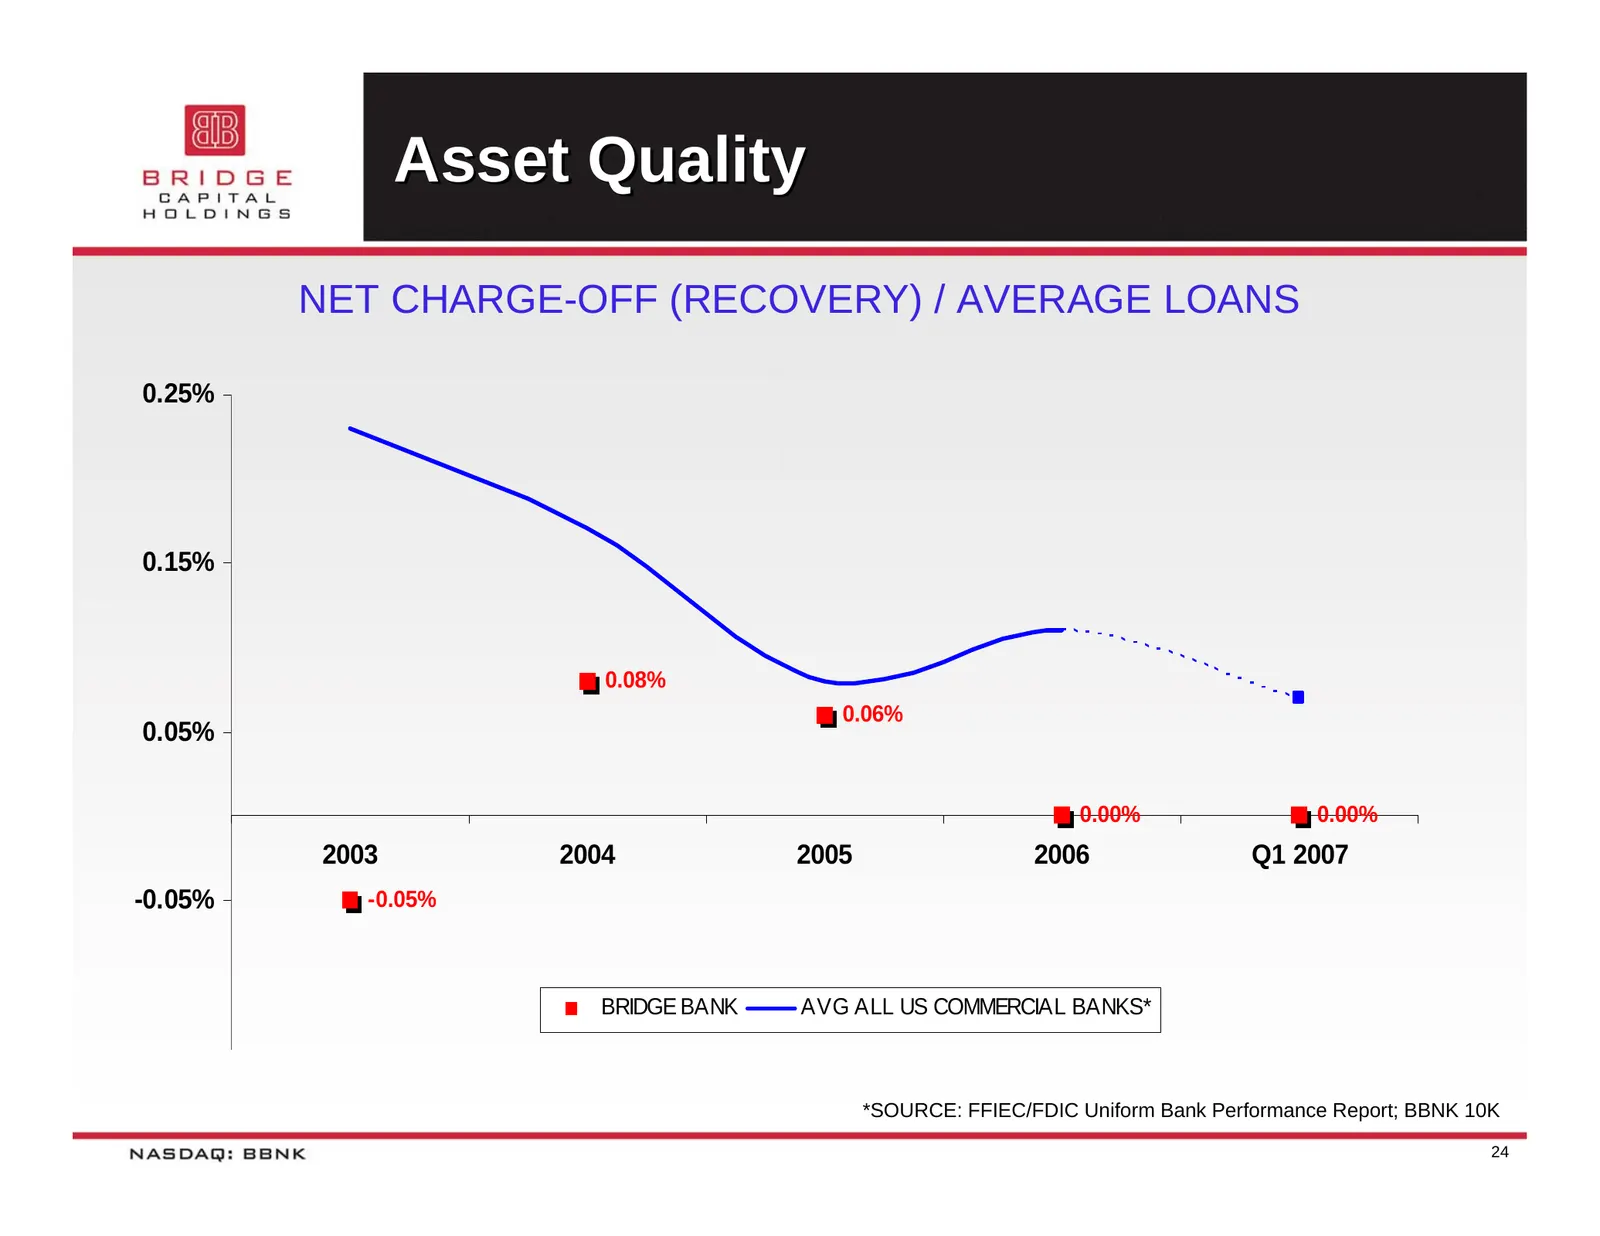
Asset Quality NET CHARGE-OFF (RECOVERY) / AVERAGE LOANS 0.25% 0.15% 0.08% 0.06% 0.05% 0.00% 0.00% 2003 2004 2005 2006 Q1 2007 -0.05% -0.05% BRIDGE BANK AVG ALL US COMMERCIAL BANKS* *SOURCE: FFIEC/FDIC Uniform Bank Performance Report; BBNK 10K 24
Slide 25: Favorable Comparables: Net Interest Margin
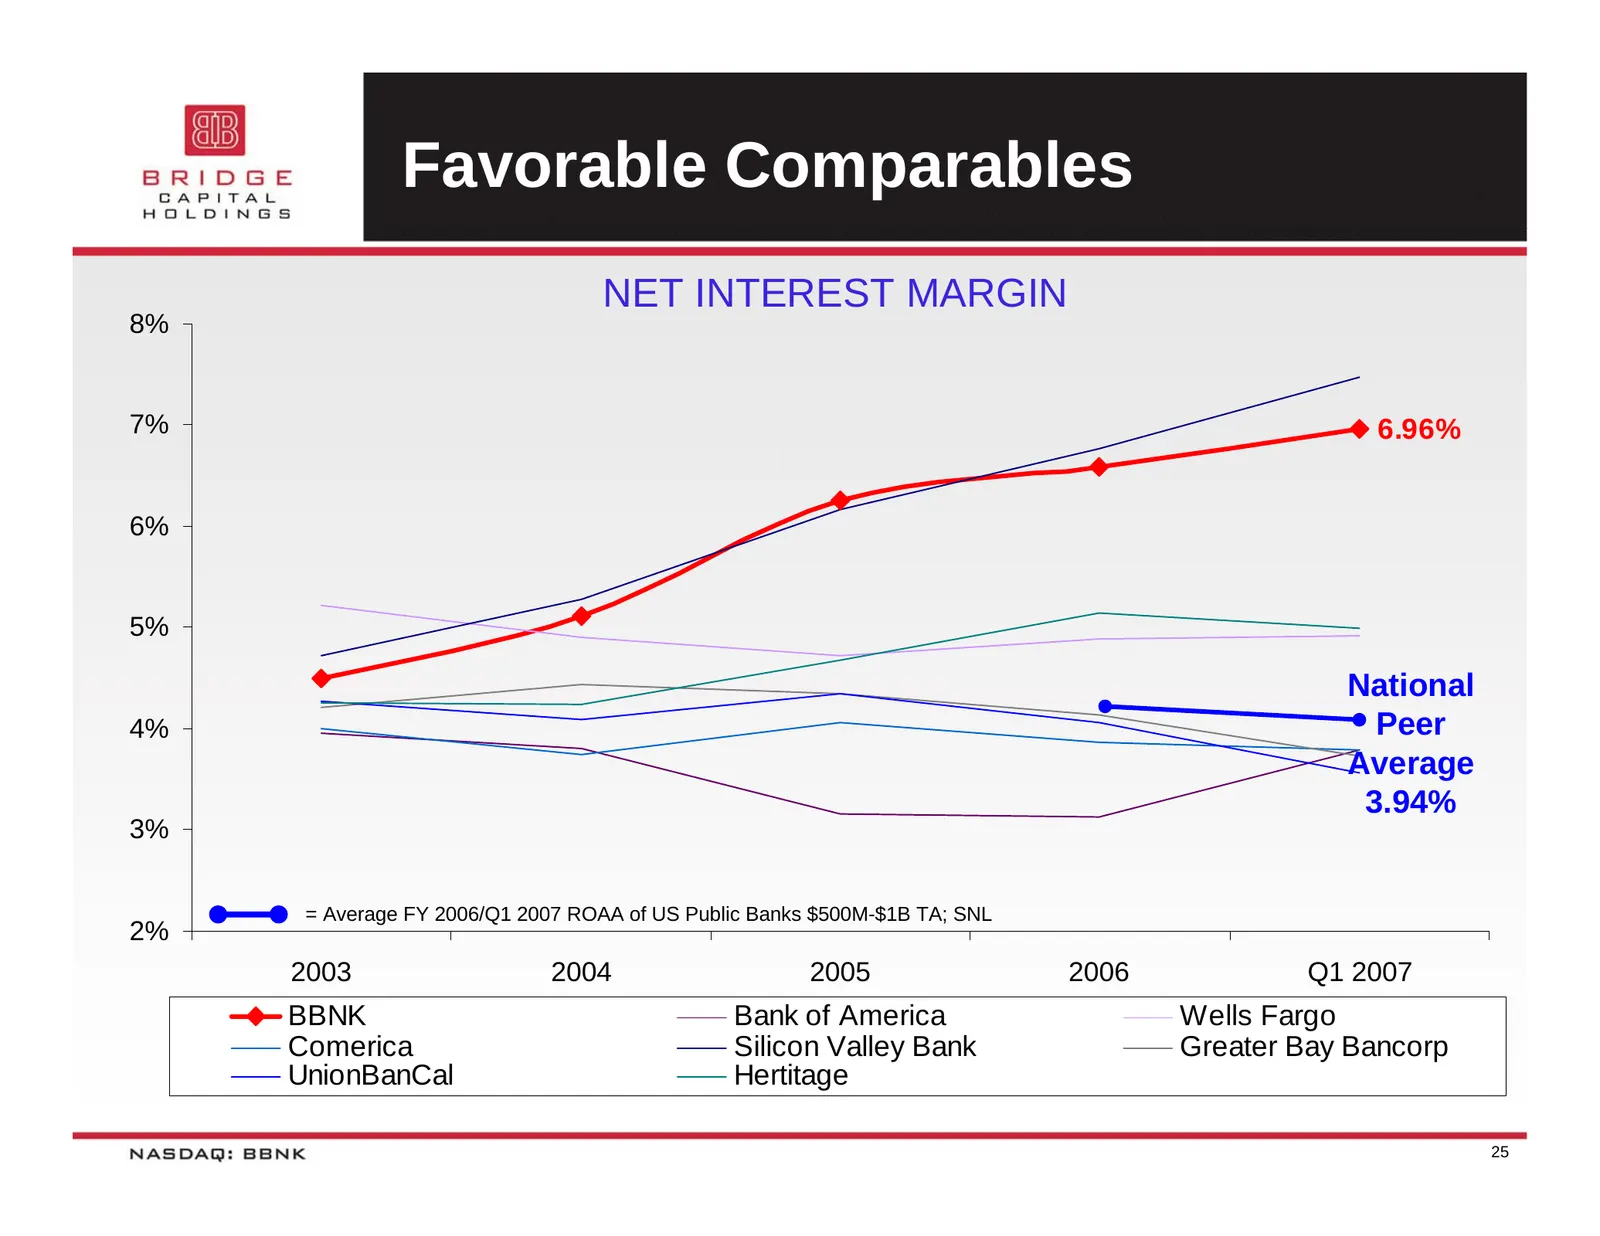
Favorable Comparables NET INTEREST MARGIN 8% 7% 6.96% 6% 5% National 4% Peer Average 3.94% 3% = Average FY 2006/Q1 2007 ROAA of US Public Banks $500M-$1B TA; SNL 2% 2003 2004 2005 2006 Q1 2007 BBNK Bank of America Wells Fargo Comerica Silicon Valley Bank Greater Bay Bancorp UnionBanCal Hertitage 25
Slide 26: Revenue Growth
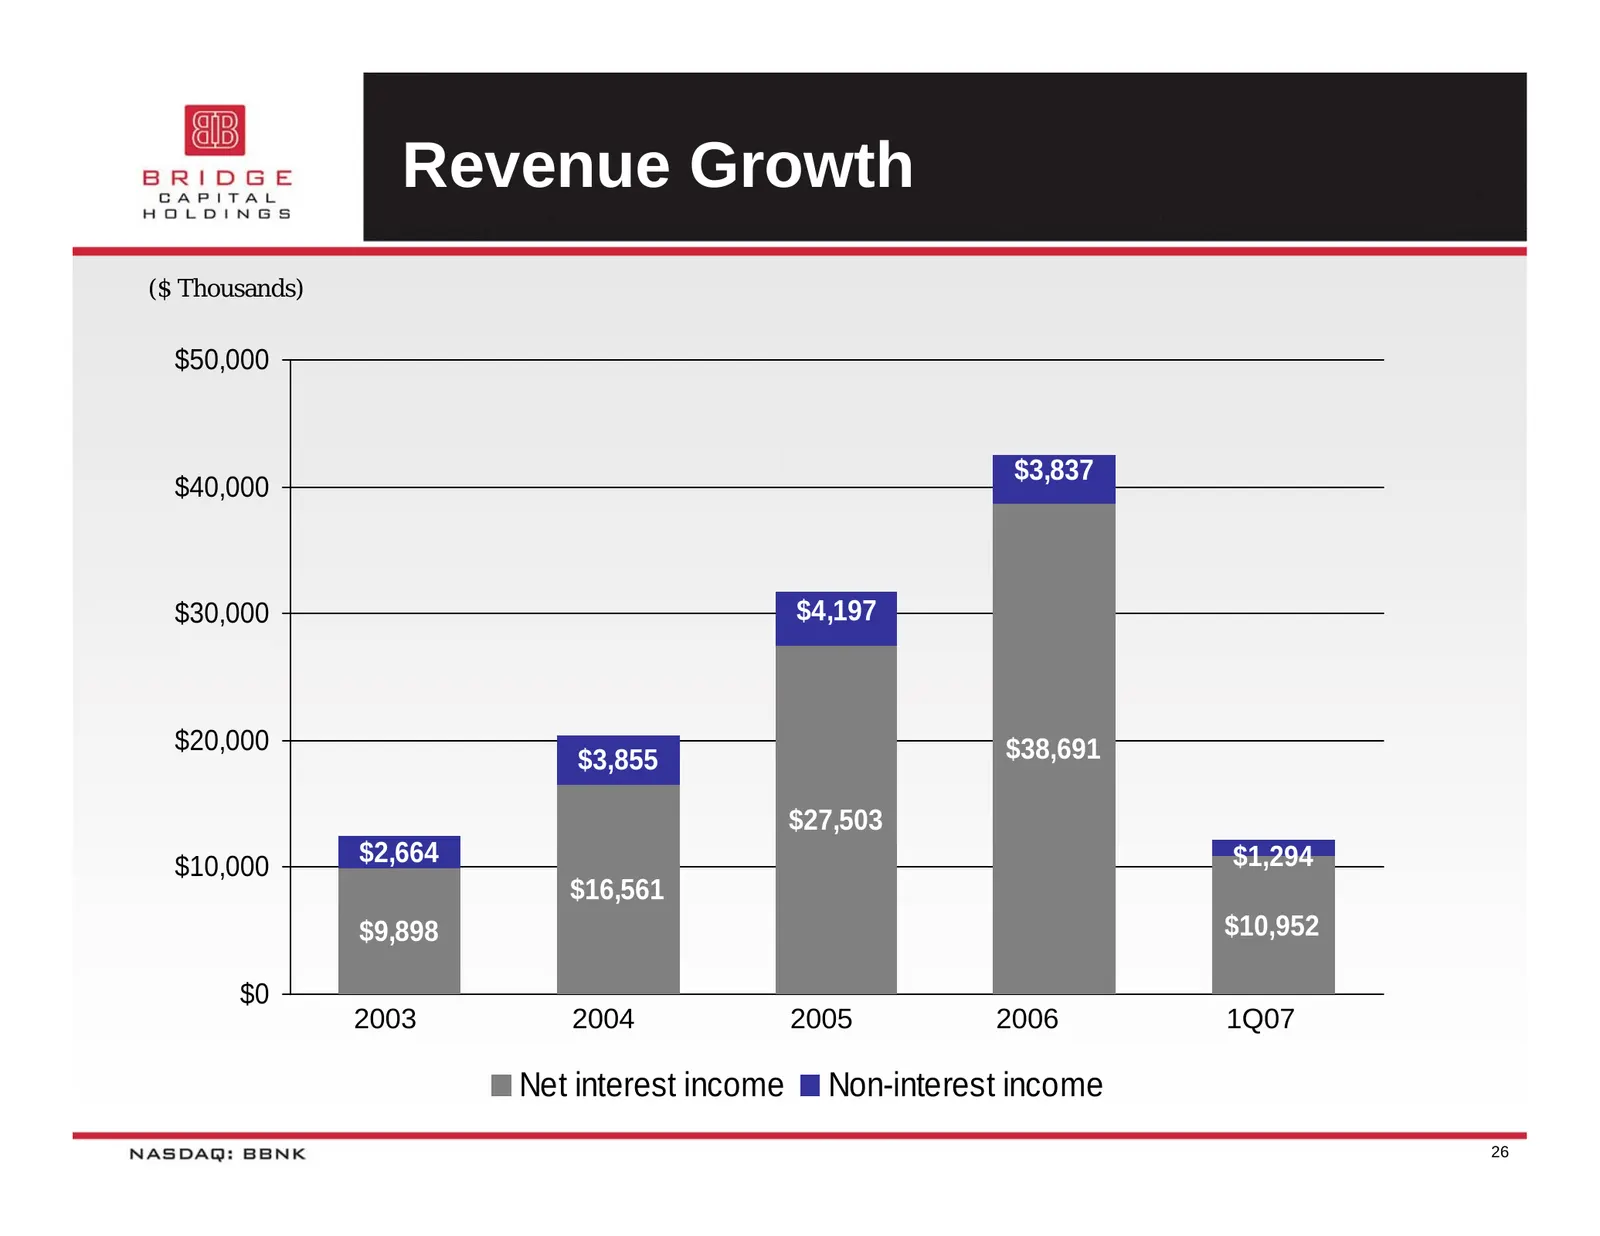
Revenue Growth ($ Thousands) $50,000 $3,837 $40,000 $30,000 $4,197 $20,000 $38,691 $3,855 $27,503 $10,000 $2,664 $1,294 $16,561 $9,898 $10,952 $0 2003 2004 2005 2006 1Q07 Net interest income Non-interest income 26
Slide 27: Diversified Revenue Sources
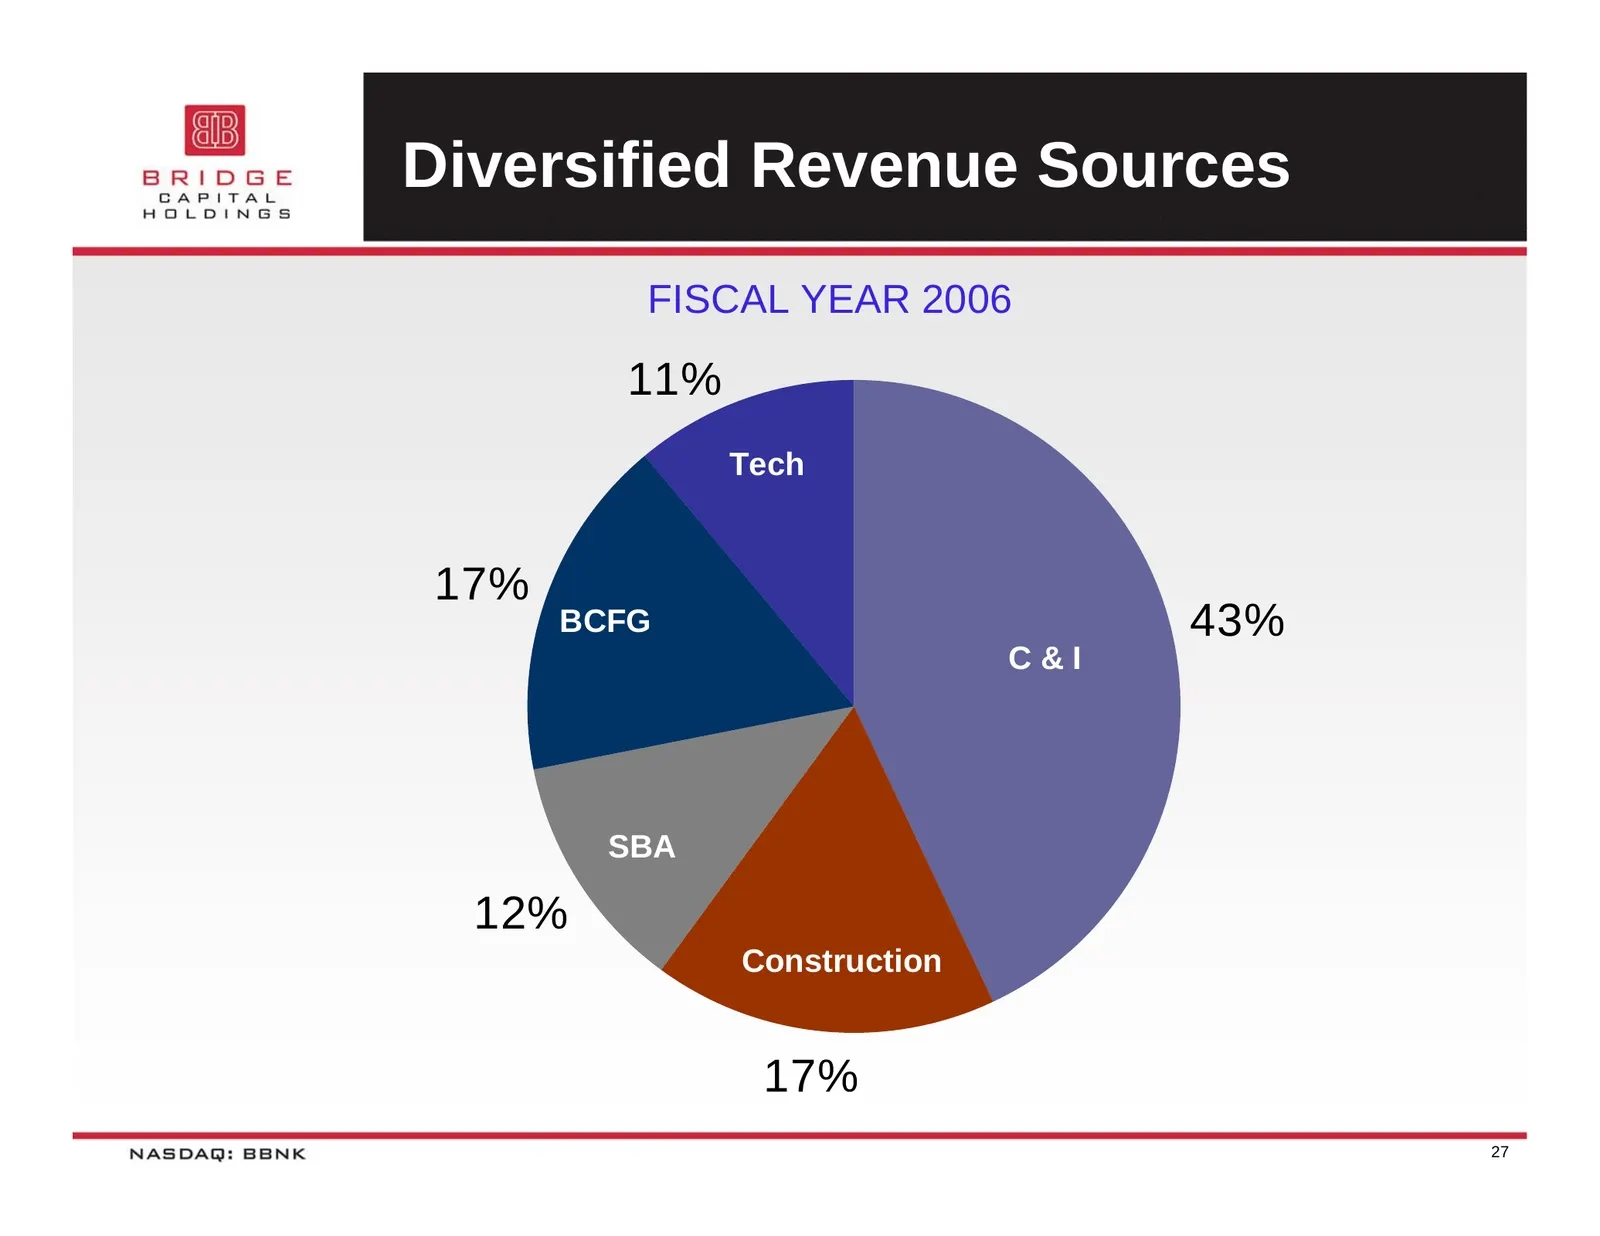
Diversified Revenue Sources FISCAL YEAR 2006 11% Tech 17% BCFG 43% C&I SBA 12% Construction 17% 27
Slide 28: Favorable Comparables: Efficiency Ratio
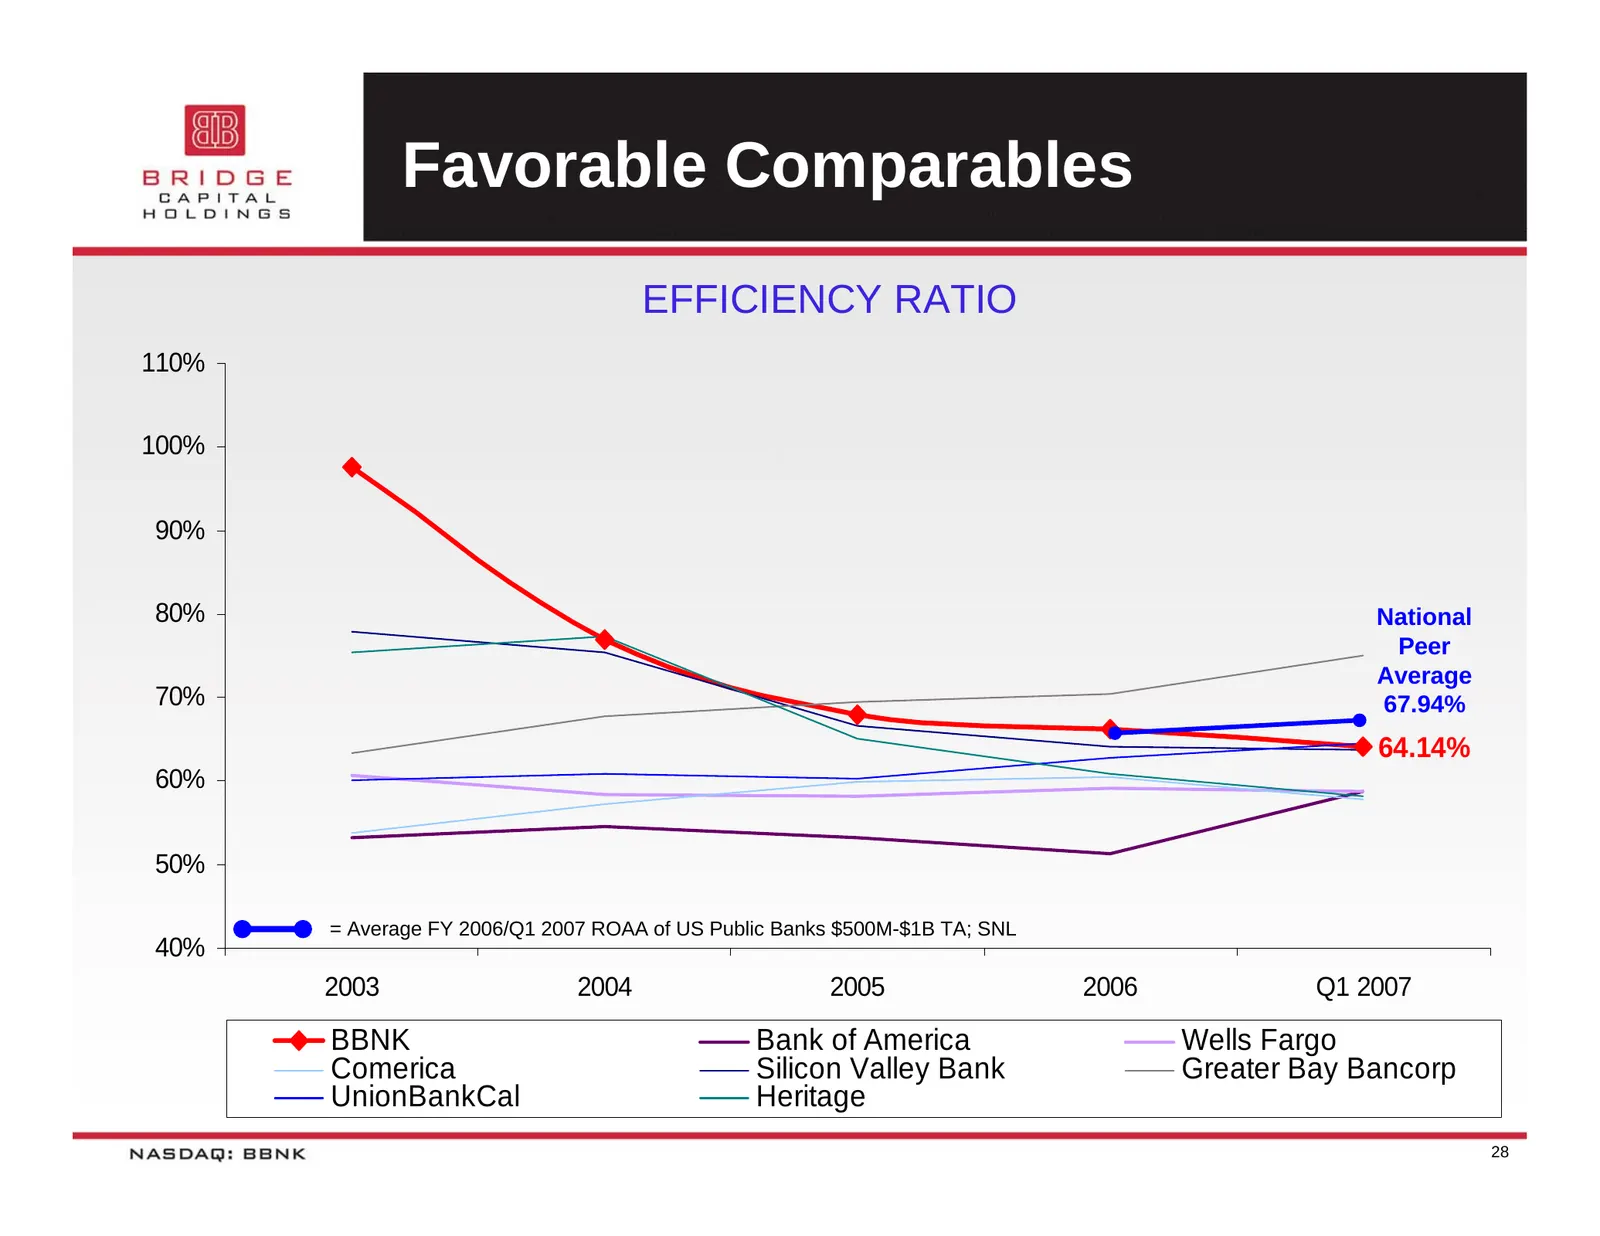
Favorable Comparables EFFICIENCY RATIO 110% 100% 90% 80% National Peer Average 70% 67.94% 64.14% 60% 50% = Average FY 2006/Q1 2007 ROAA of US Public Banks $500M-$1B TA; SNL 40% 2003 2004 2005 2006 Q1 2007 BBNK Bank of America Wells Fargo Comerica Silicon Valley Bank Greater Bay Bancorp UnionBankCal
Slide 29: Increasing Returns: ROA
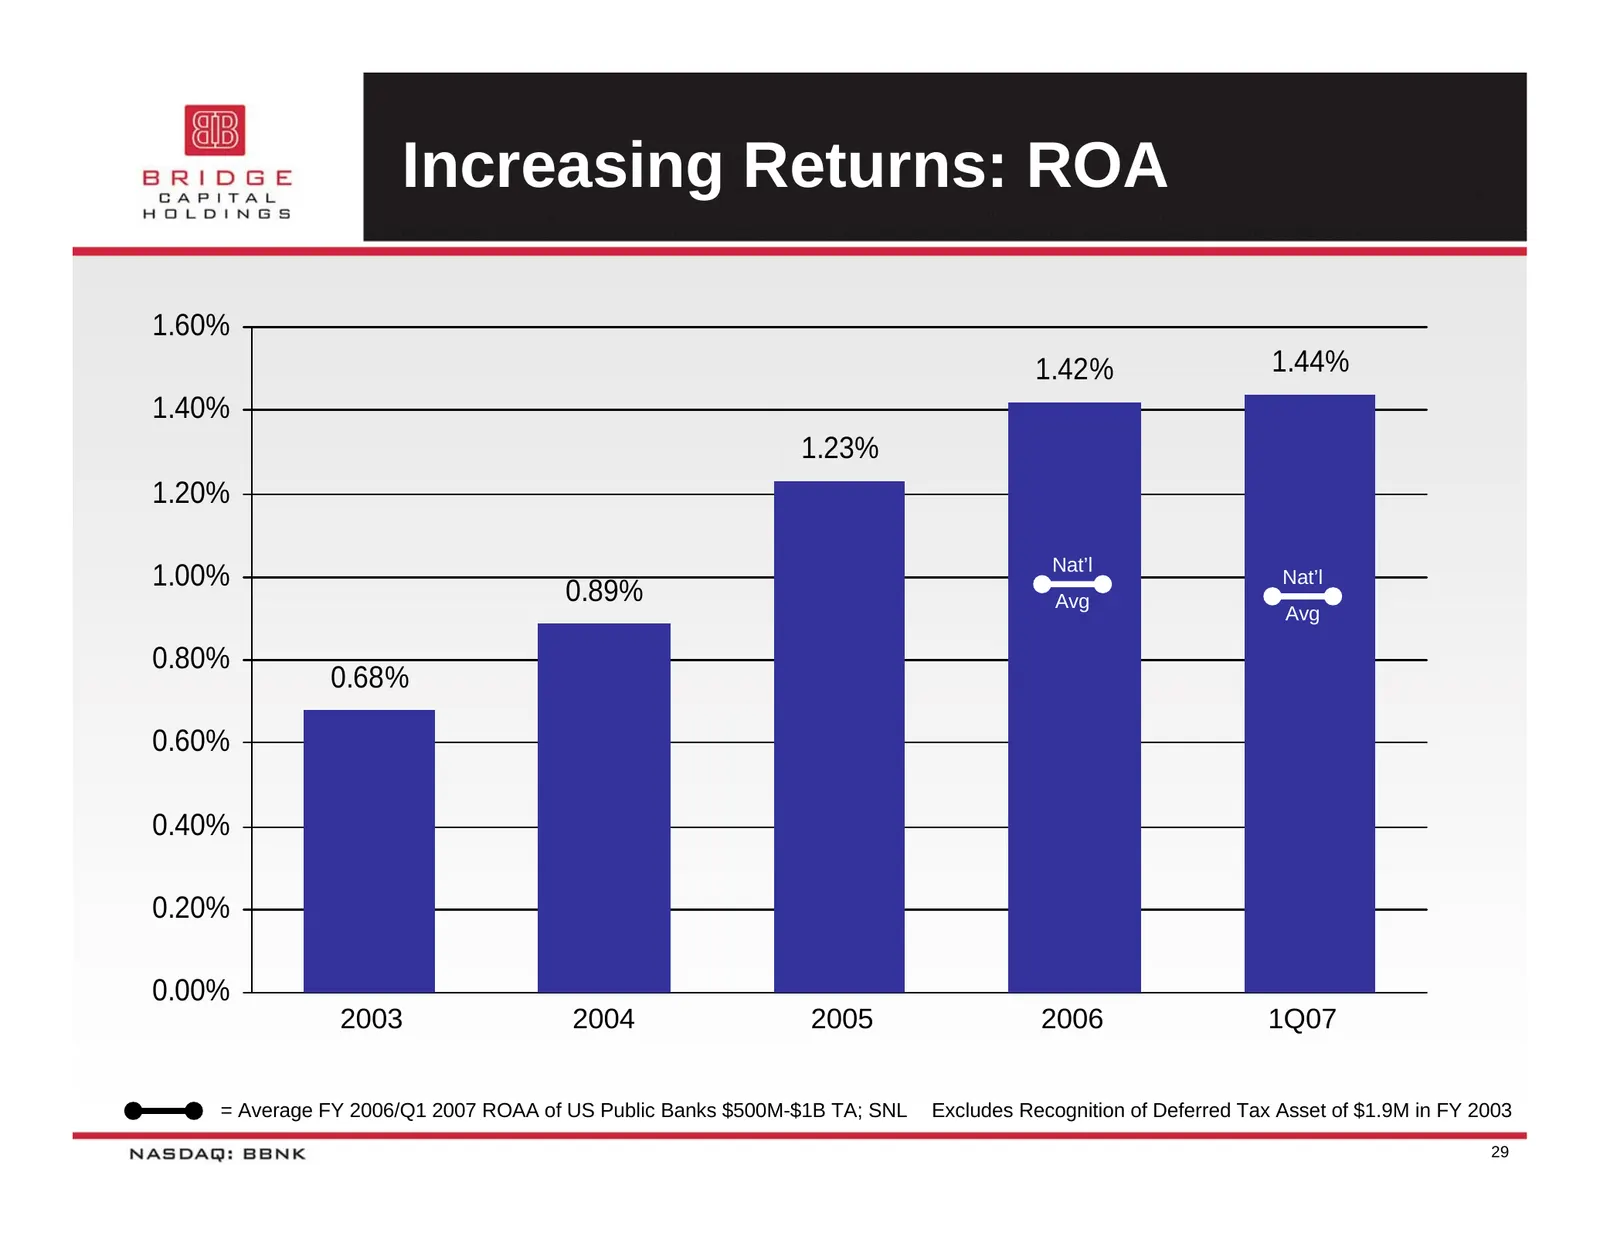
Increasing Returns: ROA 1.60% 1.42% 1.44% 1.40% 1.23% 1.20% Nat’l 1.00% Nat’l 0.89% Avg Avg 0.80% 0.68% 0.60% 0.40% 0.20% 0.00% 2003 2004 2005 2006 1Q07 = Average FY 2006/Q1 2007 ROAA of US Public Banks $500M-$1B TA; SNL Excludes Recognition of Deferred Tax Asset of $1.9M in FY 2003 29
Slide 30: Profitability: Net Income & EPS
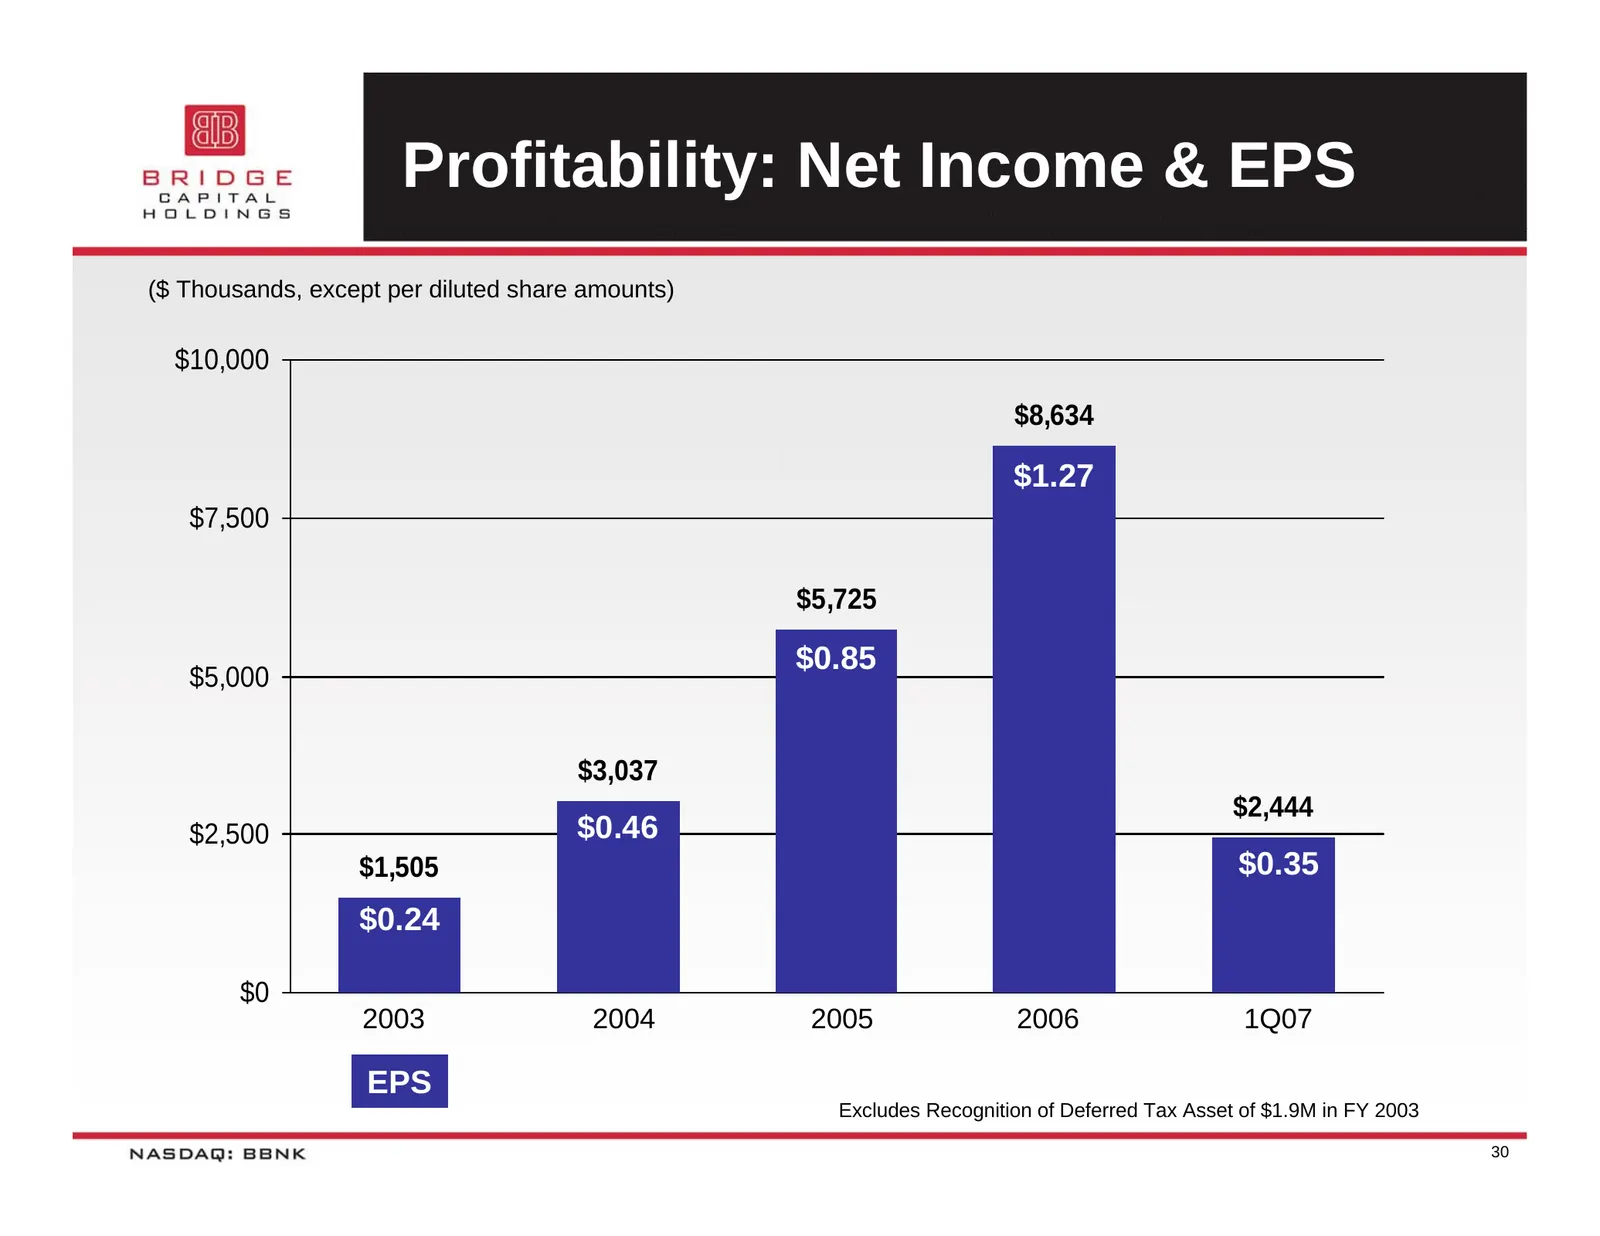
Profitability: Net Income & EPS ($ Thousands, except per diluted share amounts) $10,000 $8,634 $1.27 $7,500 $5,725 $0.85 $5,000 $3,037 $2,444 $2,500 $0.46 $1,505 $0.35 $0.24 $0 2003 2004 2005 2006 1Q07 EPS Excludes Recognition of Deferred Tax Asset of $1.9M in FY 2003 30
Slide 31: Increasing Returns: ROE
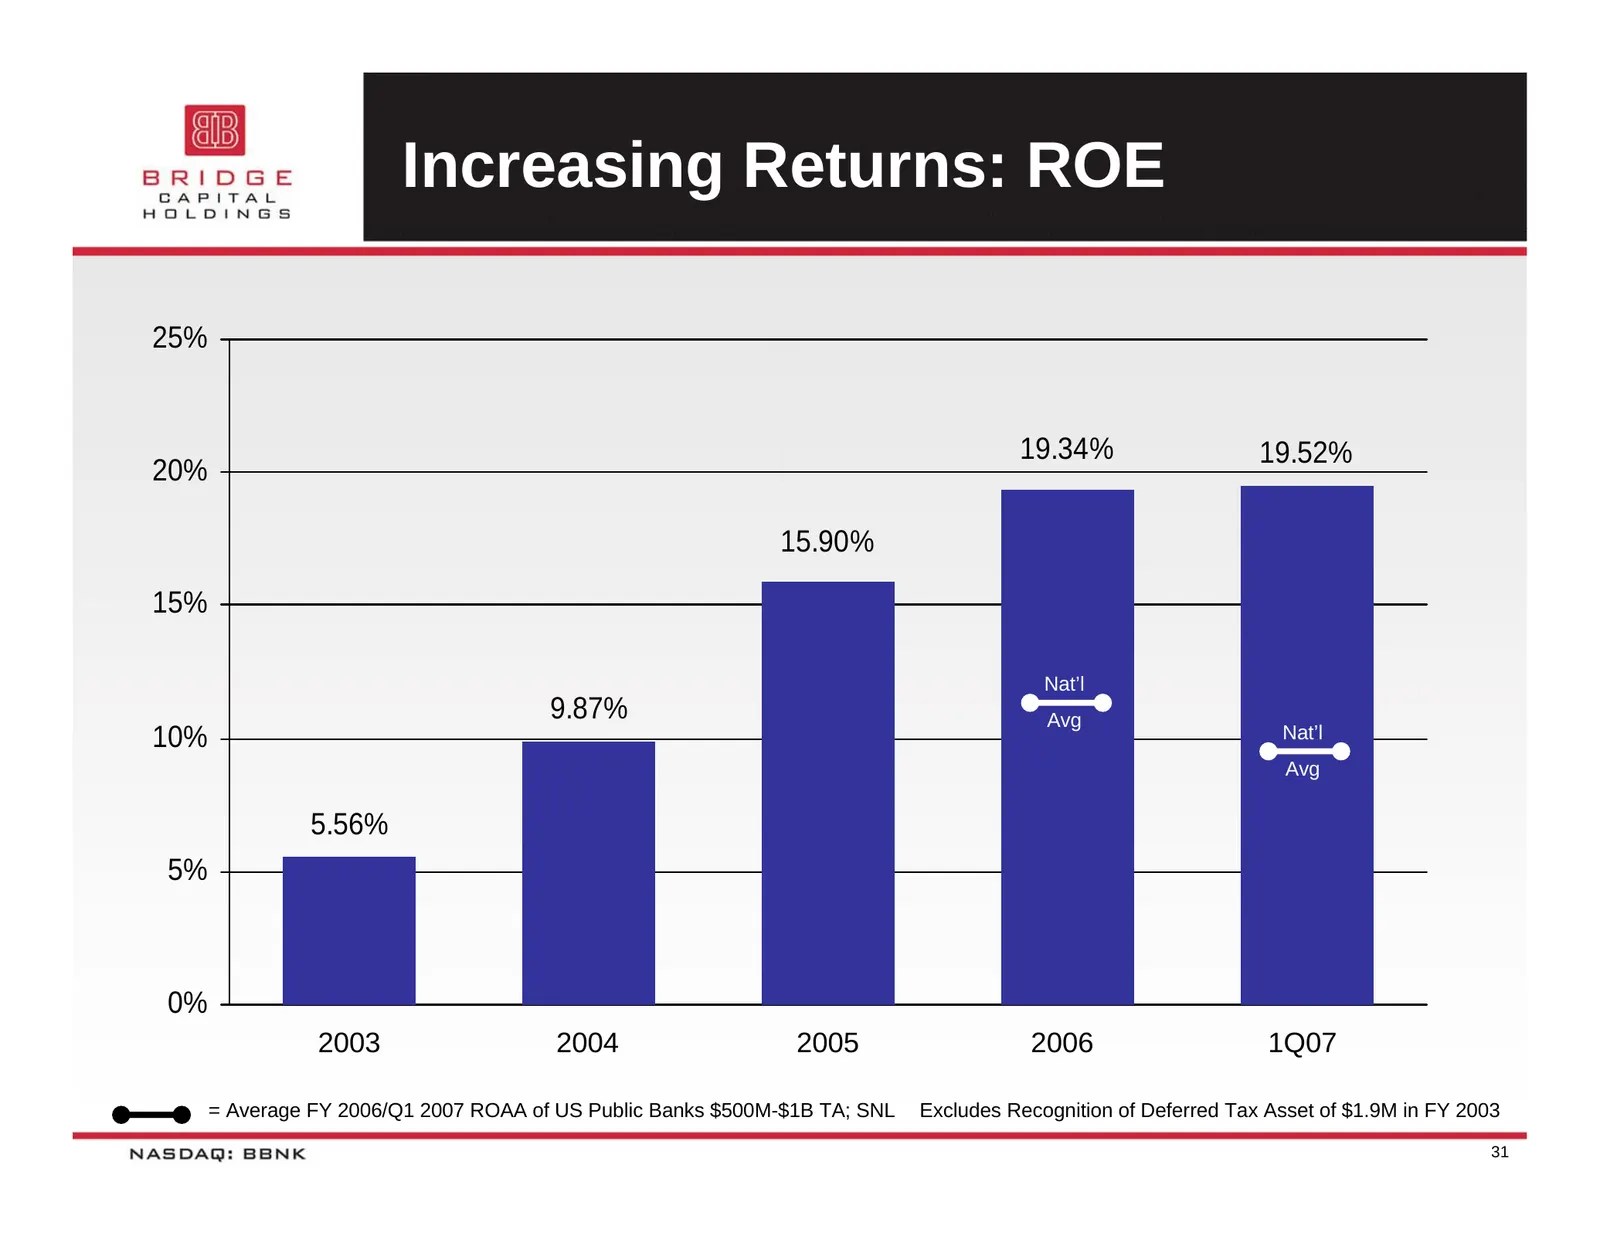
Increasing Returns: ROE 25% 19.34% 19.52% 20% 15.90% 15% Nat’l 9.87% Avg 10% Nat’l Avg 5.56% 5% 0% 2003 2004 2005 2006 1Q07 = Average FY 2006/Q1 2007 ROAA of US Public Banks $500M-$1B TA; SNL Excludes Recognition of Deferred Tax Asset of $1.9M in FY 2003 31
Slide 32: Bridge Bank Strength
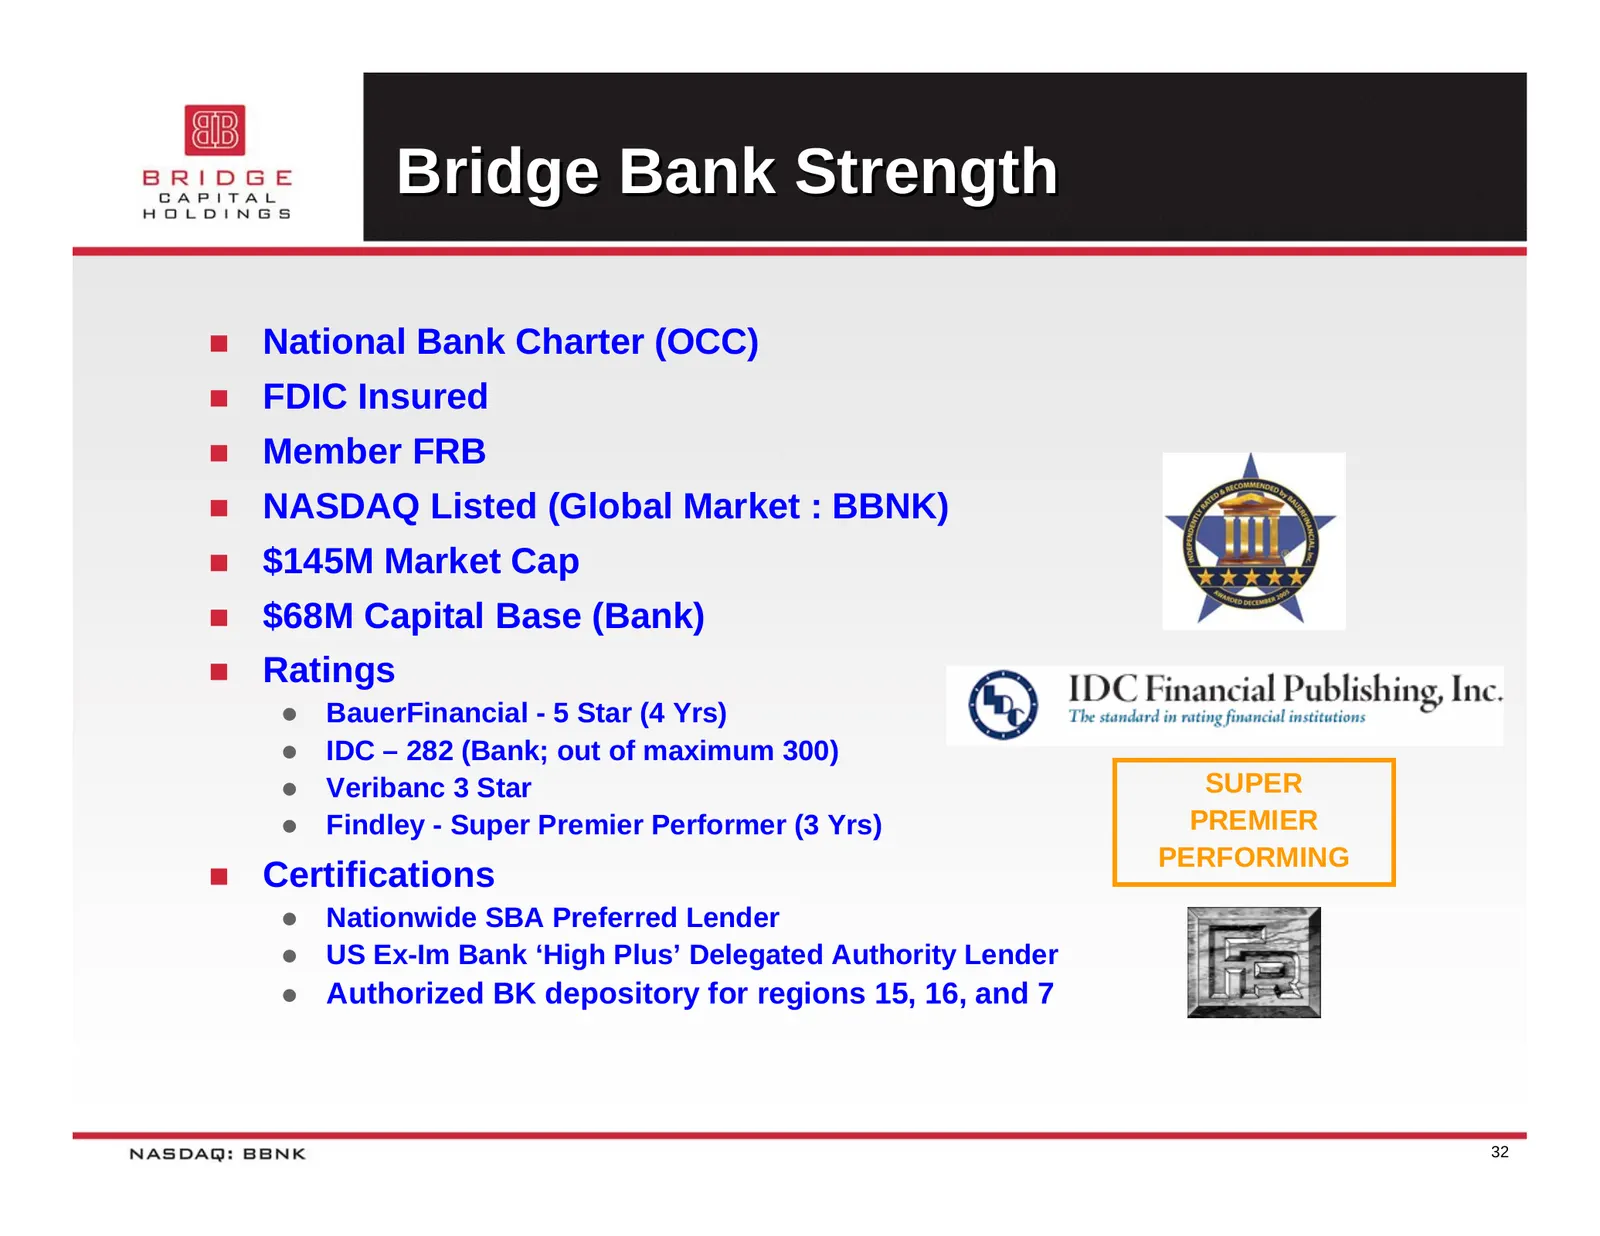
Bridge Bank Strength National Bank Charter (OCC) FDIC Insured Member FRB NASDAQ Listed (Global Market : BBNK) $145M Market Cap $68M Capital Base (Bank) Ratings z BauerFinancial - 5 Star (4 Yrs) z IDC – 282 (Bank; out of maximum 300) z Veribanc 3 Star SUPER z Findley - Super Premier Per
Slide 33: Equity Performance
EQUITY PERFORMANCE NASDAQ: BBNK
Slide 34: Financial and Trading Snapshot
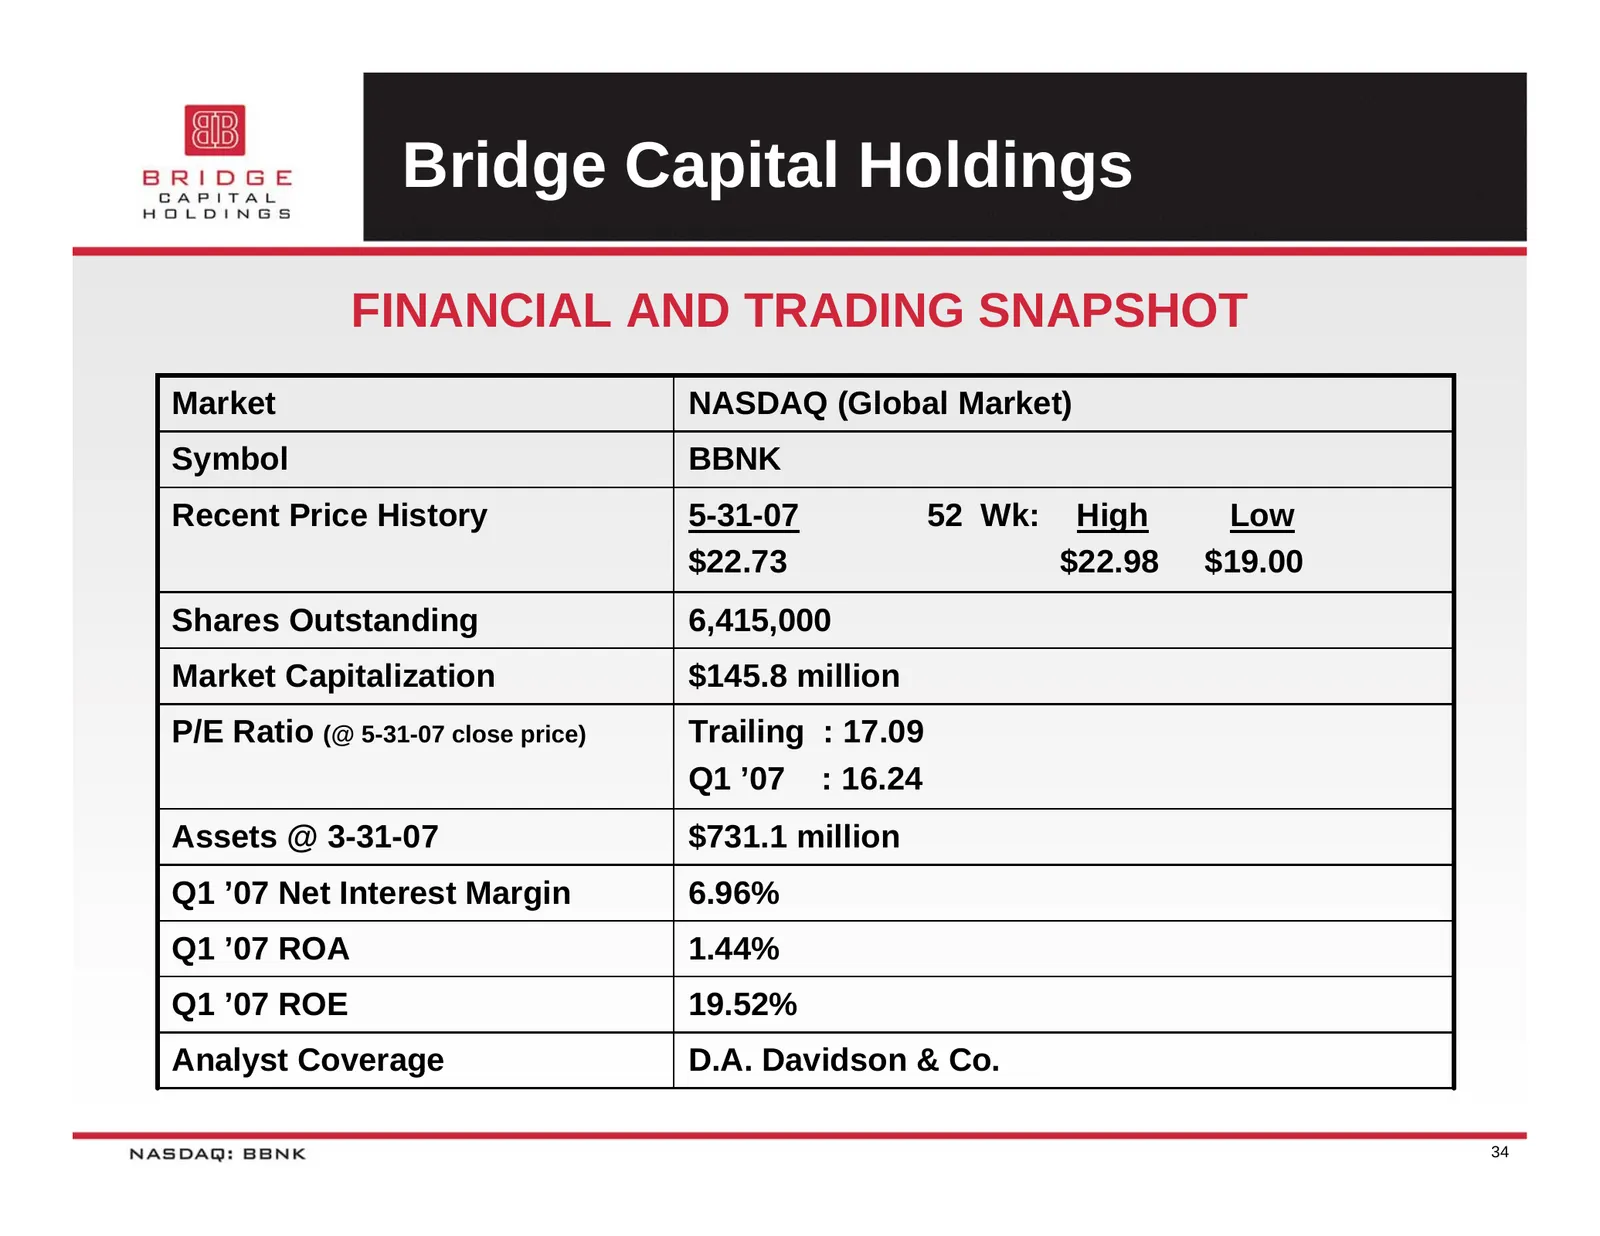
Bridge Capital Holdings FINANCIAL AND TRADING SNAPSHOT Market NASDAQ (Global Market) Symbol BBNK Recent Price History 5-31-07 52 Wk: High Low $22.73 $22.98 $19.00 Shares Outstanding 6,415,000 Market Capitalization $145.8 million P/E Ratio (@ 5-31-07 close price) Trailing : 17.09 Q1 ’07 : 16.24 Asset
Slide 35: Comparative BBNK Performance
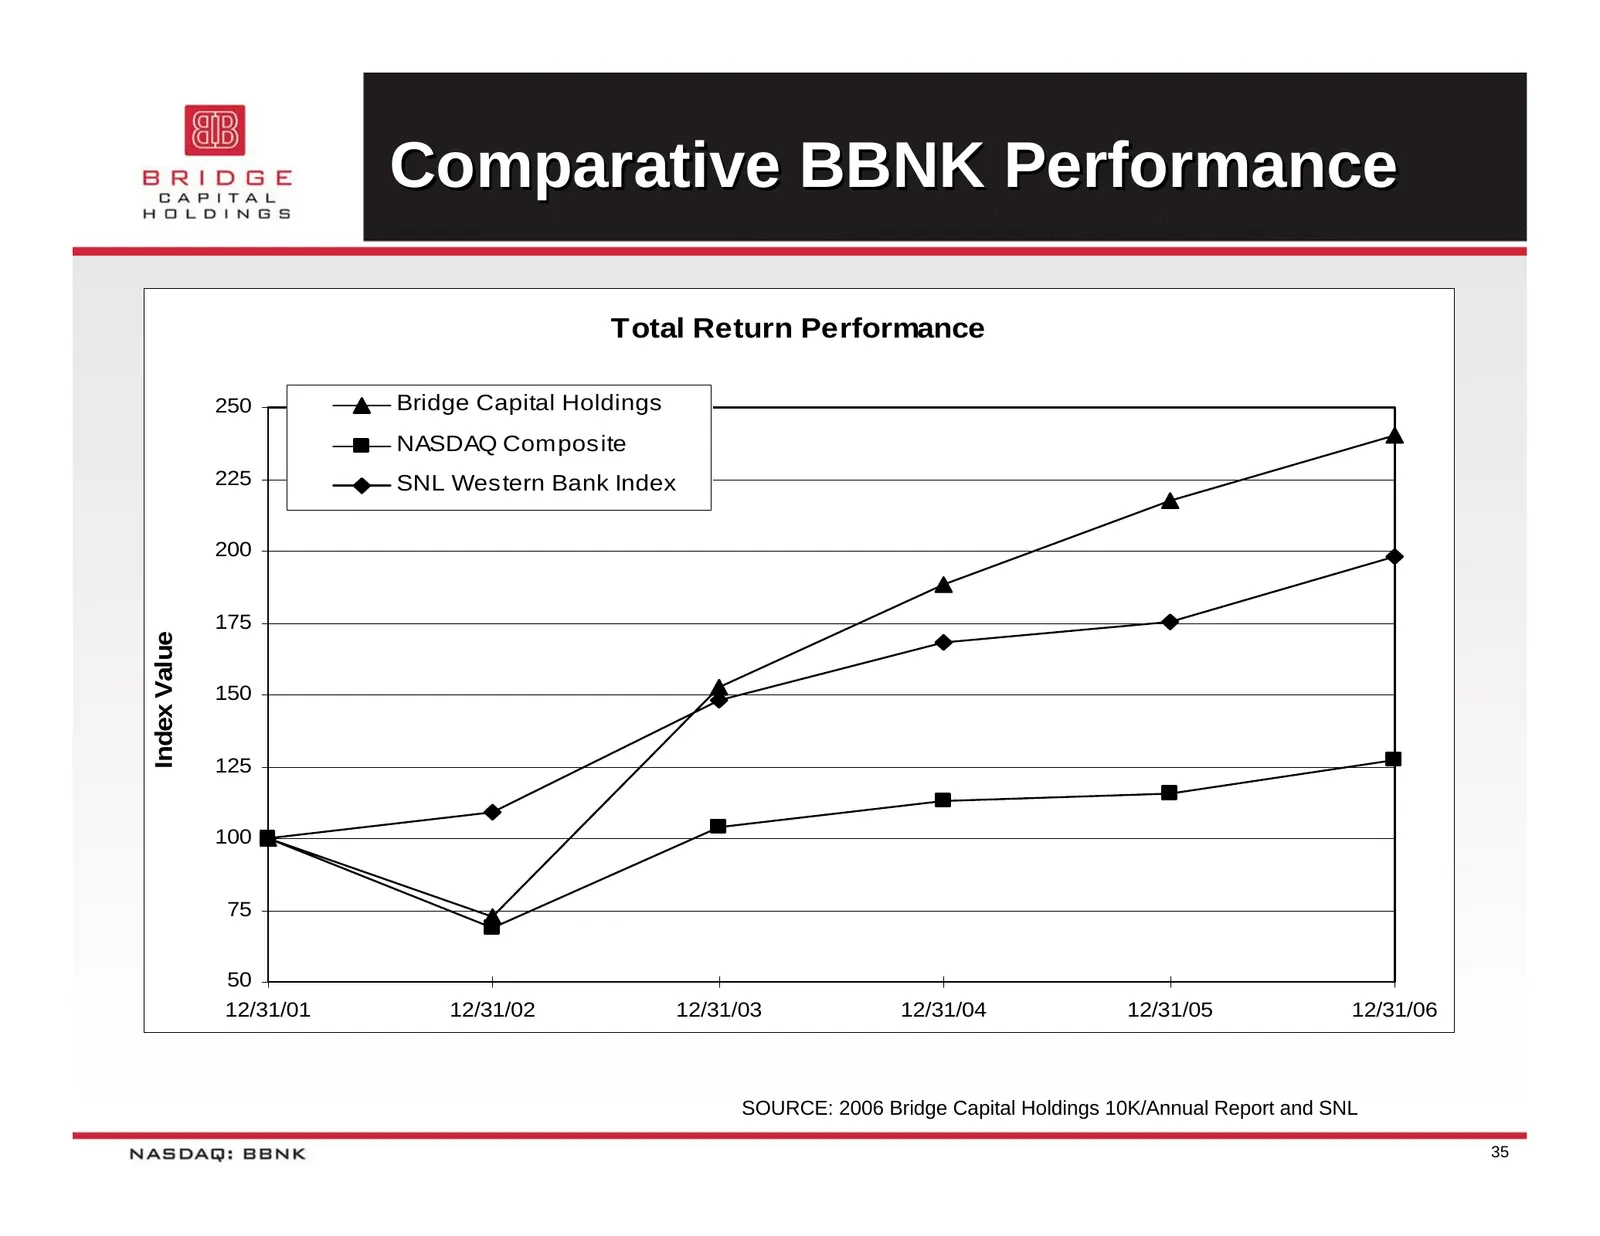
Comparative BBNK Performance Total Return Performance 250 Bridge Capital Holdings NASDAQ Composite 225 SNL Western Bank Index 200 175 Index Value 150 125 100 75 50 12/31/01 12/31/02 12/31/03 12/31/04 12/31/05 12/31/06 SOURCE: 2006 Bridge Capital Holdings 10K/Annual Report and SNL 35
Slide 36: BBNK (NASDAQ-Global Market)
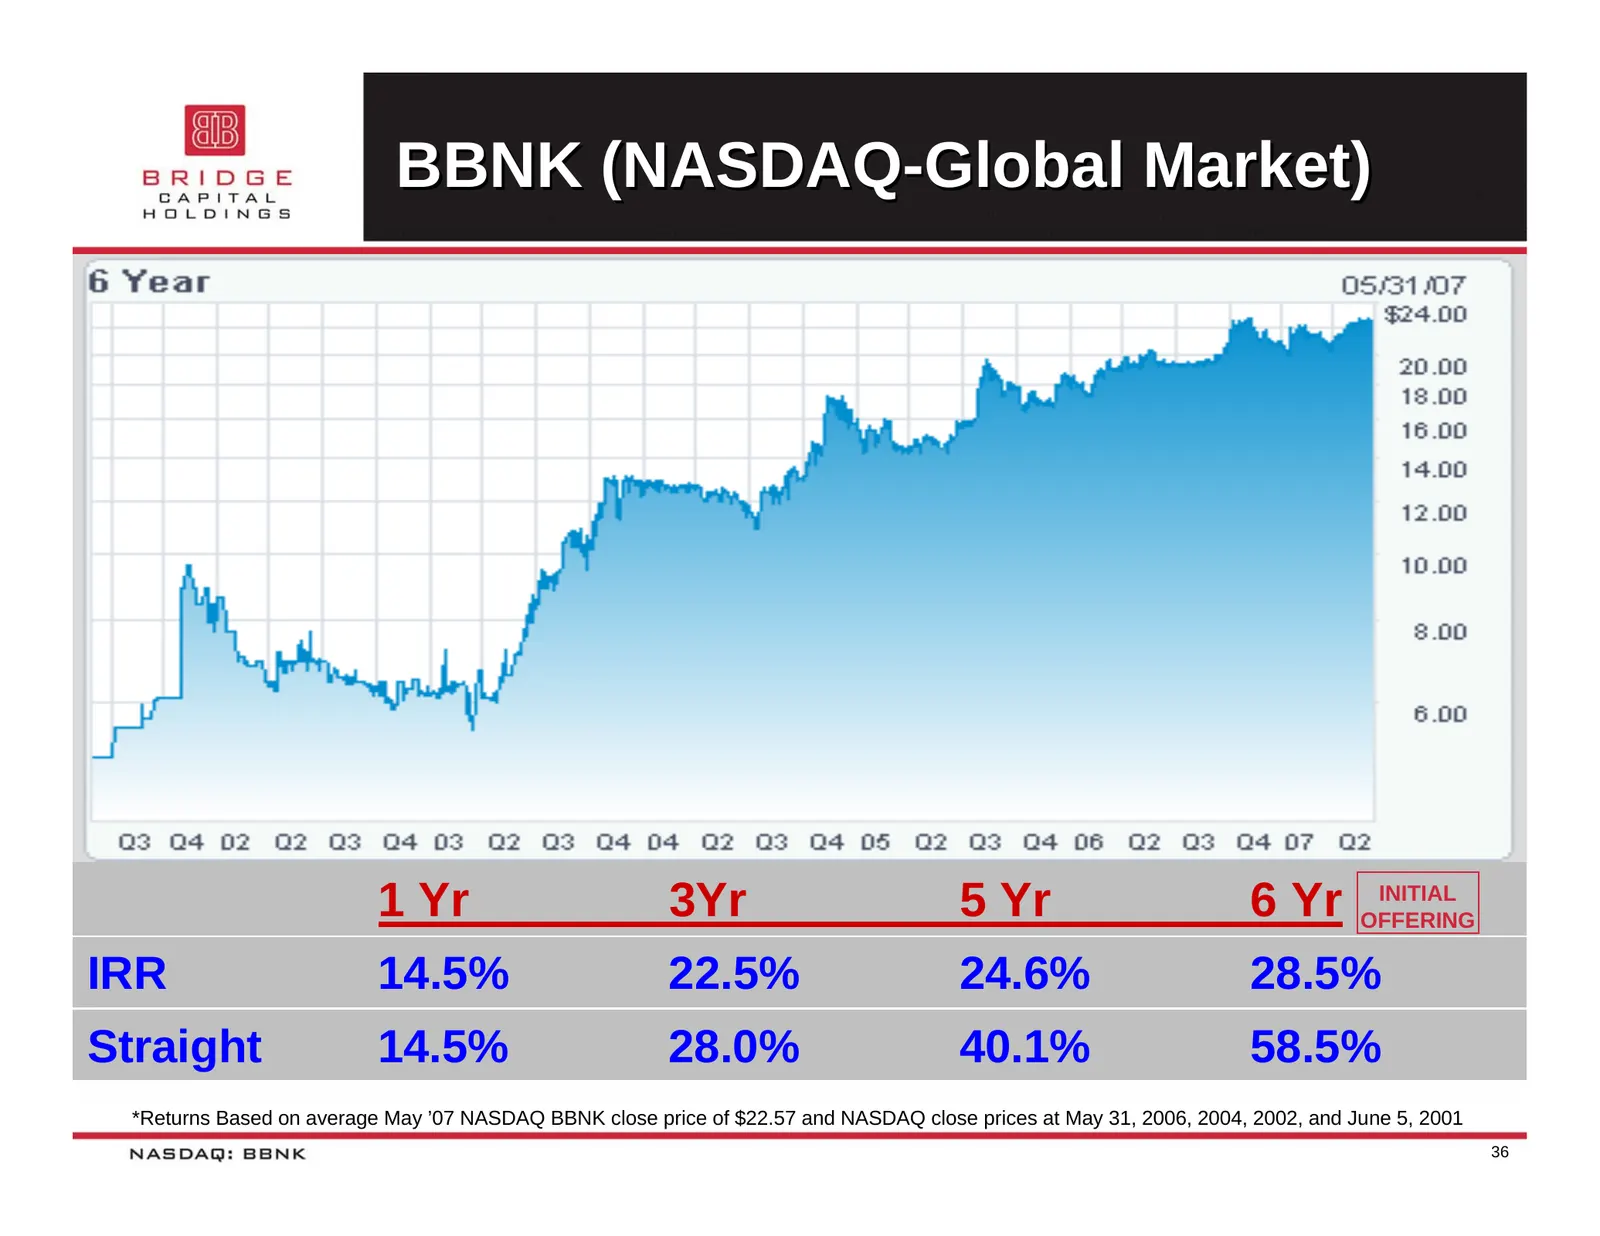
BBNK (NASDAQ-Global Market) 1 Yr 3Yr 5 Yr 6 Yr OFFERING INITIAL IRR 14.5% 22.5% 24.6% 28.5% Straight 14.5% 28.0% 40.1% 58.5% *Returns Based on average May ’07 NASDAQ BBNK close price of $22.57 and NASDAQ close prices at May 31, 2006, 2004, 2002, and June 5, 2001 36
Slide 37: Comparative BBNK Performance
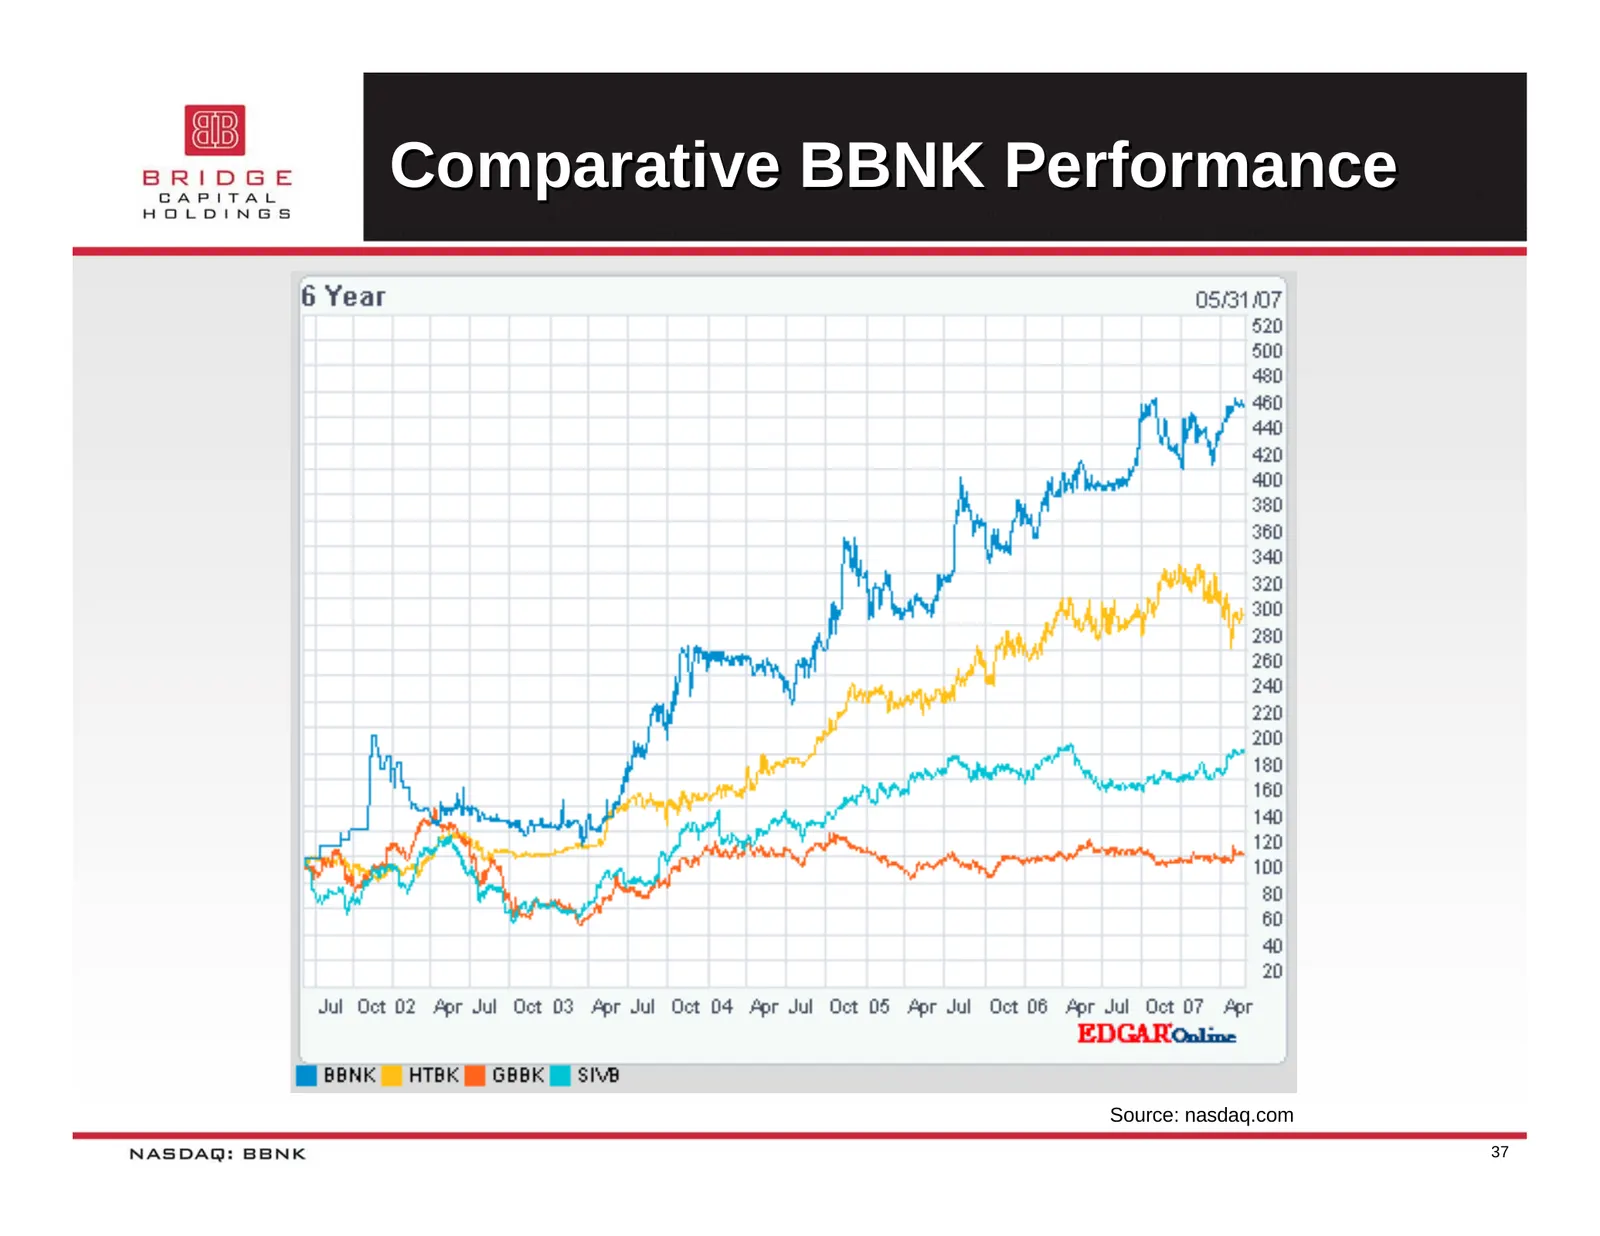
Comparative BBNK Performance Source: nasdaq.com 37
Slide 38: BBNK Trading Volume / #
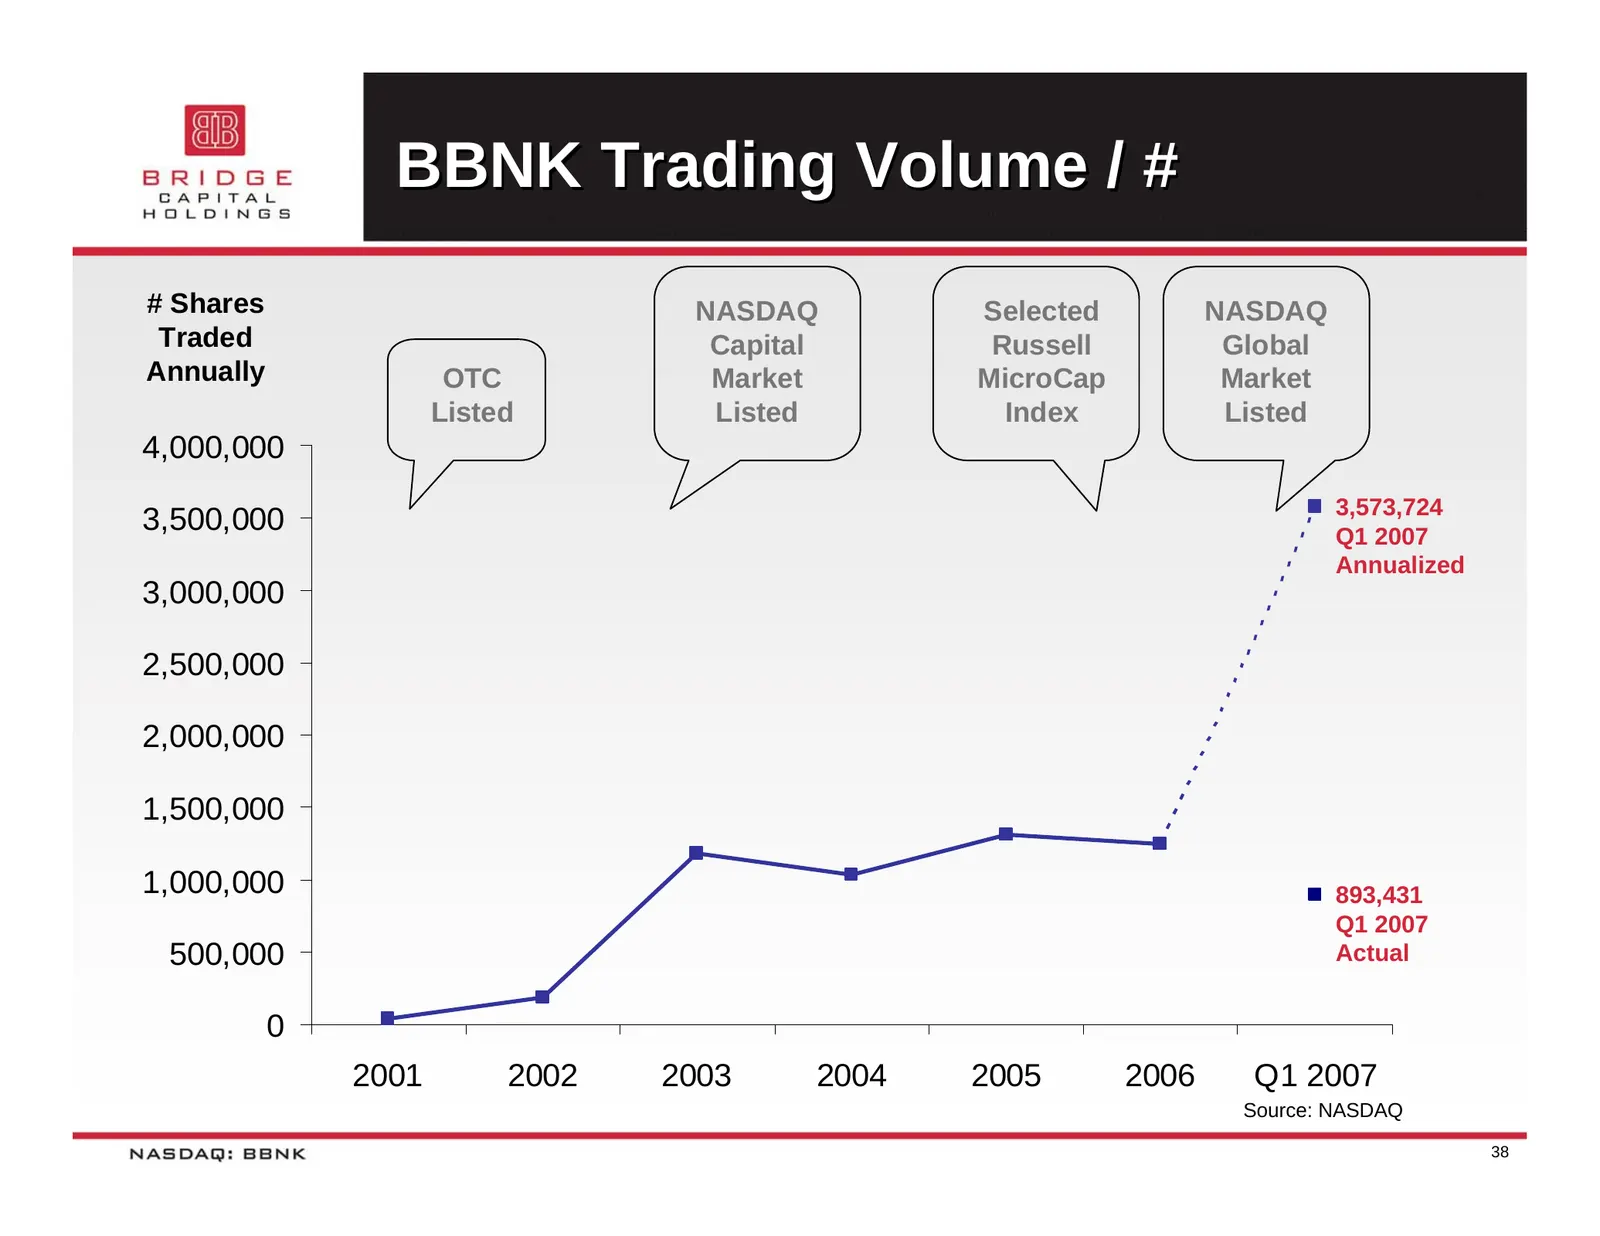
BBNK Trading Volume / # # Shares NASDAQ Selected NASDAQ Traded Capital Russell Global Annually OTC Market MicroCap Market Listed Listed Index Listed 4,000,000 3,573,724 3,500,000 Q1 2007 Annualized 3,000,000 2,500,000 2,000,000 1,500,000 1,000,000 893,431 Q1 2007 500,000 Actual 0 2001 2002 2003 2004
Slide 39: BBNK Trading Volume / %
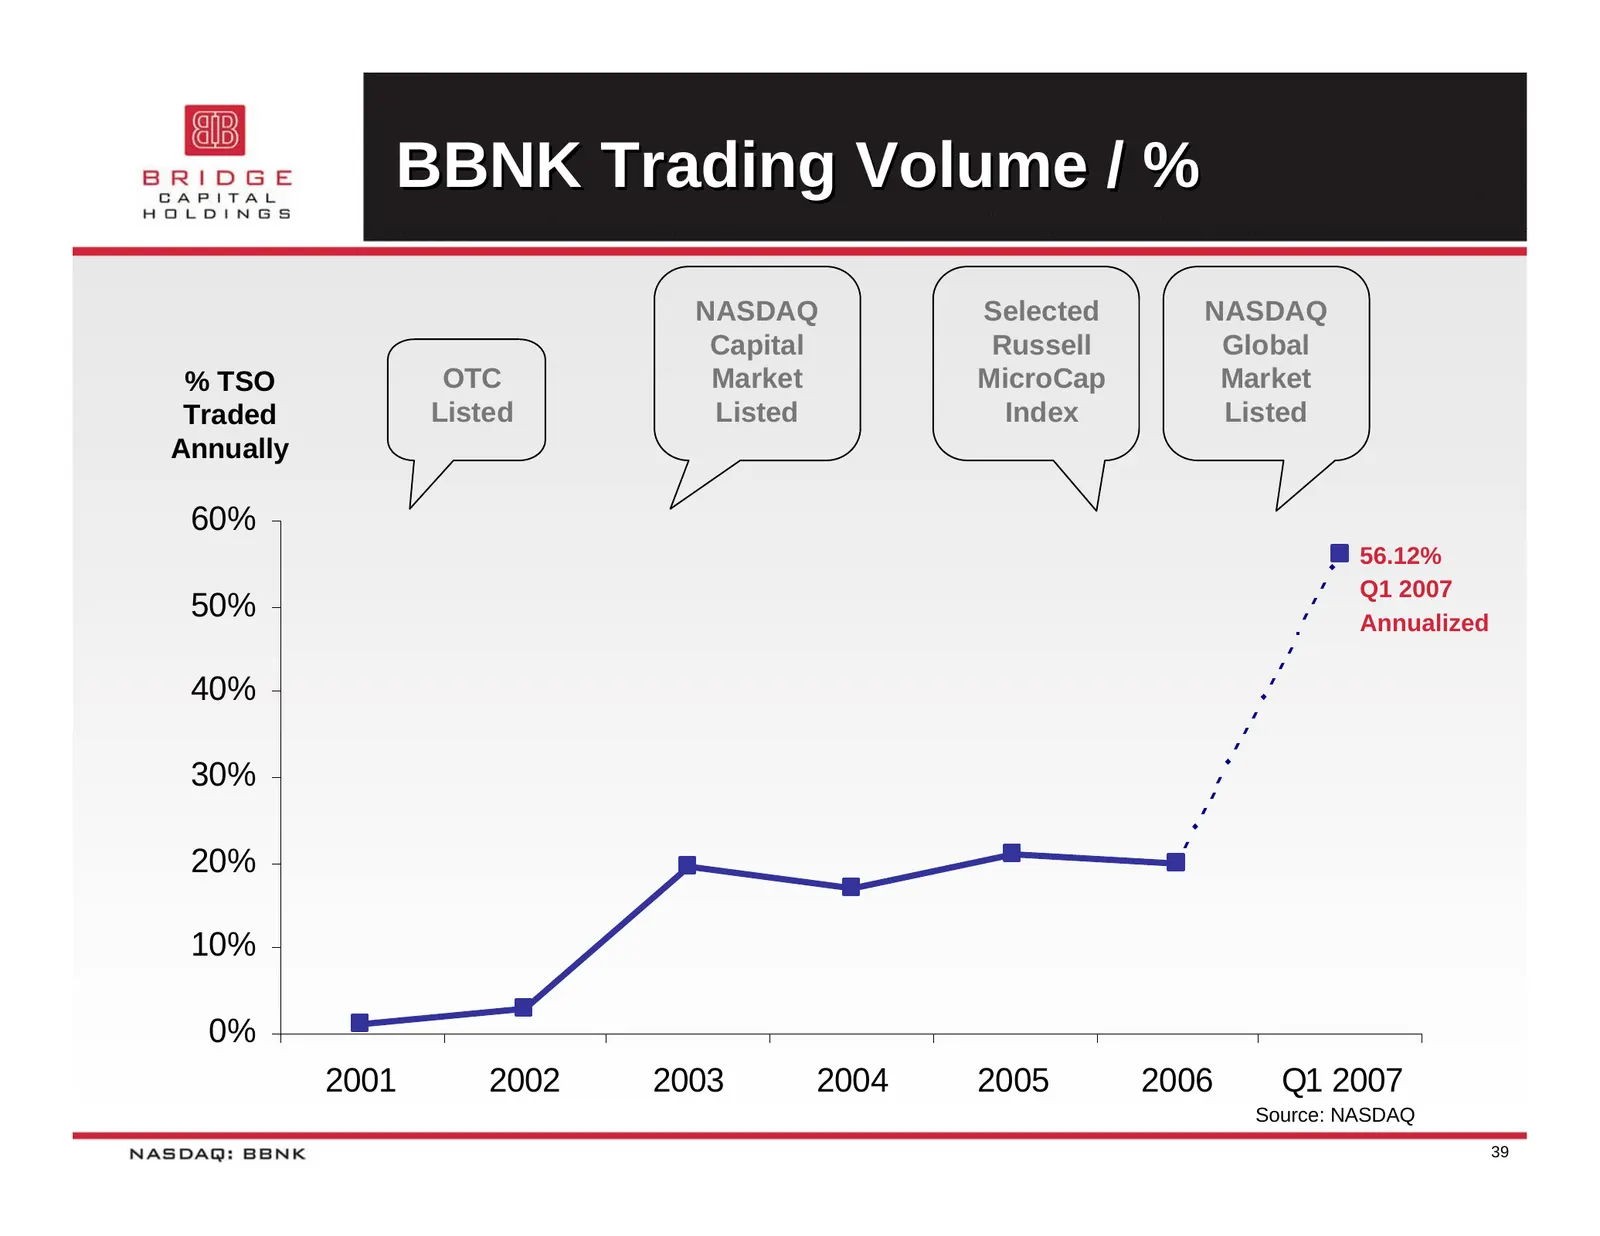
BBNK Trading Volume / % NASDAQ Selected NASDAQ Capital Russell Global % TSO OTC Market MicroCap Market Traded Listed Listed Index Listed Annually 60% 56.12% Q1 2007 50% Annualized 40% 30% 20% 10% 0% 2001 2002 2003 2004 2005 2006 Q1 2007 Source: NASDAQ 39
Slide 40: Looking Ahead
CAPITAL HOLDINGS LOOKING AHEAD NASDAQ: BBNK
Slide 41: Our Focus
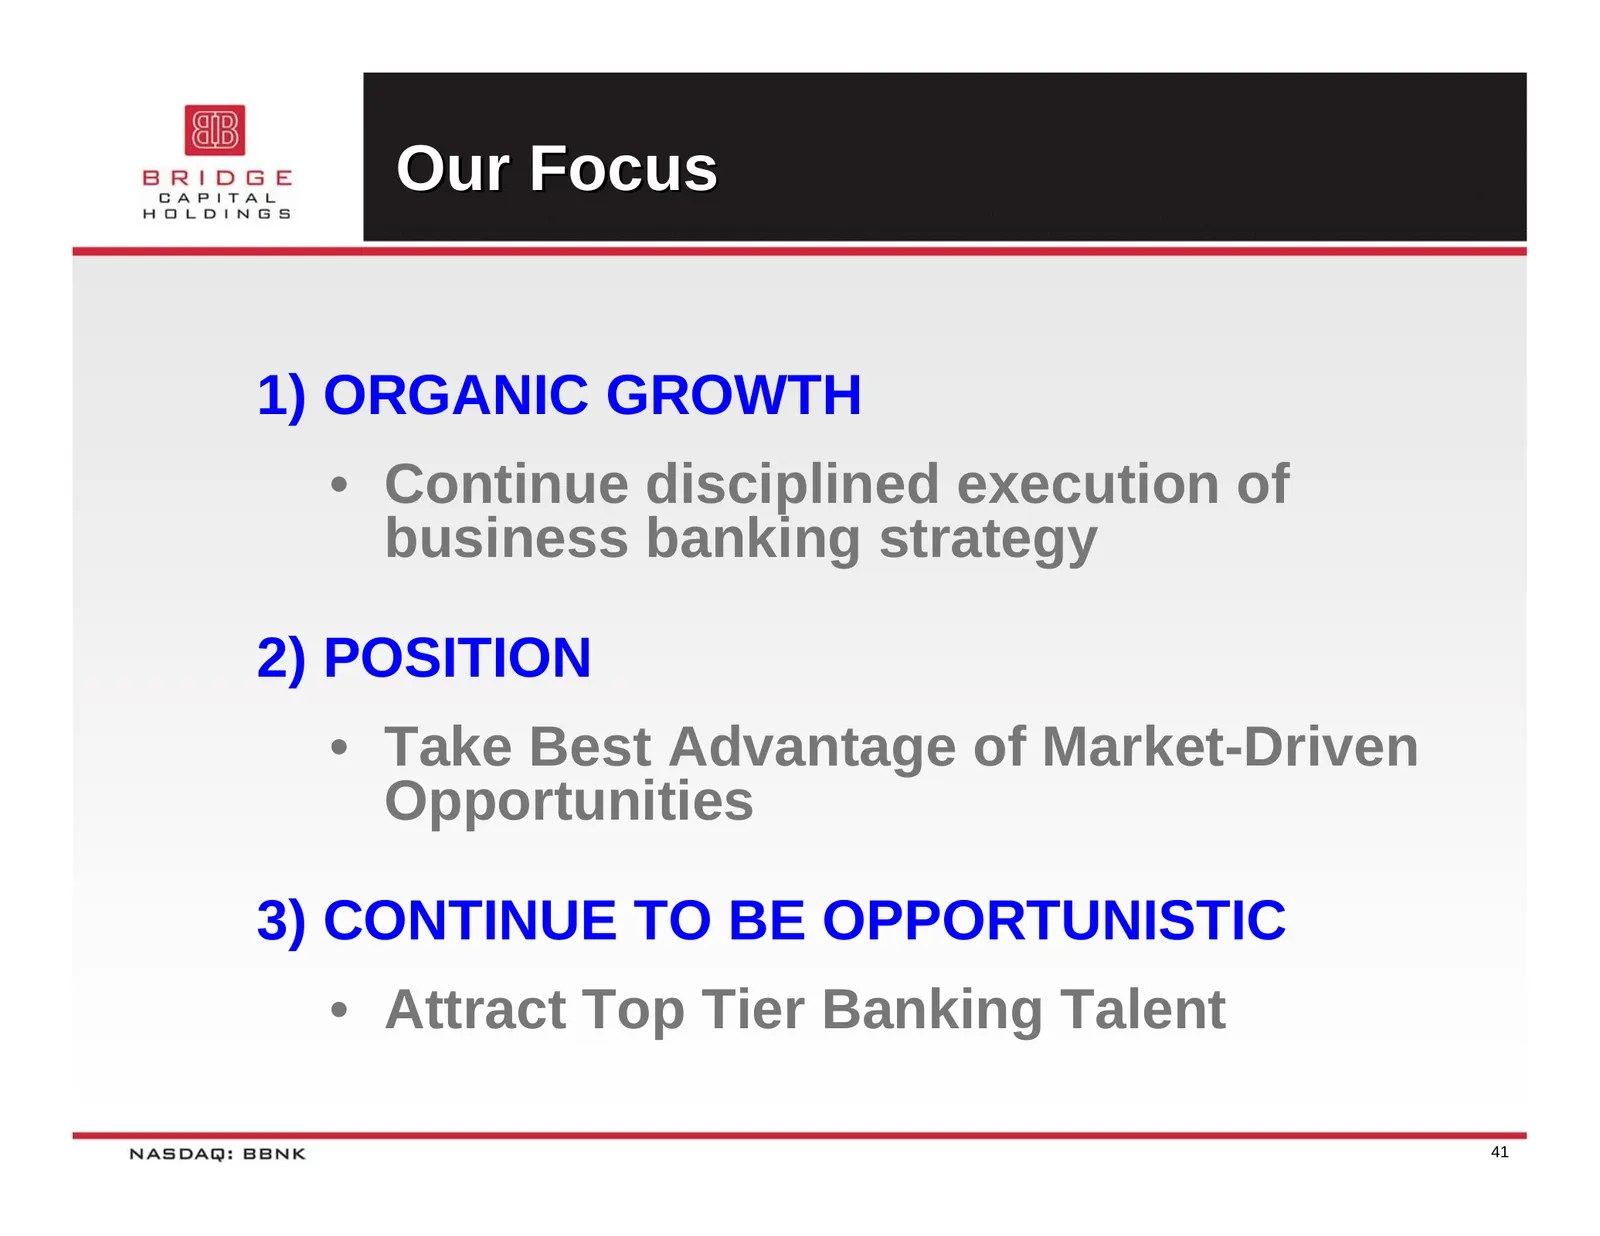
Our Focus 1) ORGANIC GROWTH • Continue disciplined execution of business banking strategy 2) POSITION • Take Best Advantage of Market-Driven Opportunities 3) CONTINUE TO BE OPPORTUNISTIC • Attract Top Tier Banking Talent 41
Slide 42: Significant Market Opportunity
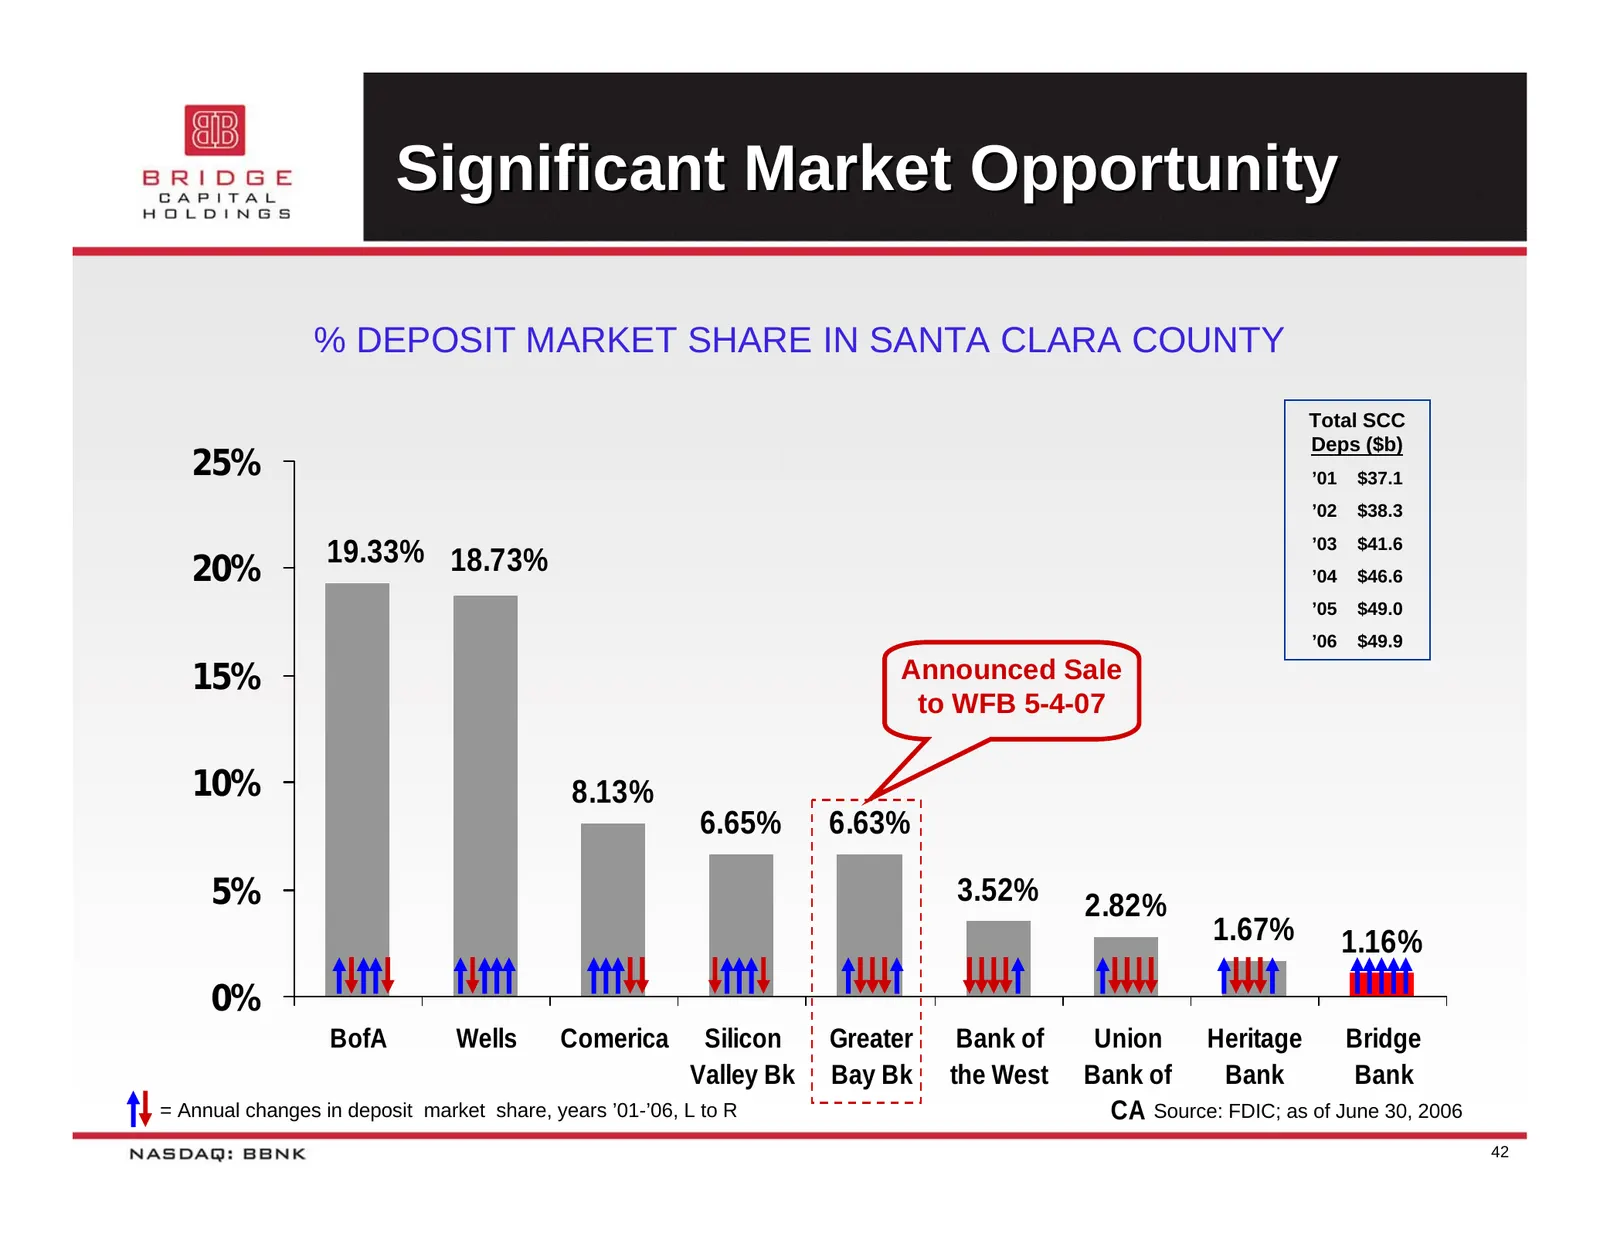
Significant Market Opportunity % DEPOSIT MARKET SHARE IN SANTA CLARA COUNTY Total SCC Deps ($b) 25% ’01 $37.1 ’02 $38.3 ’03 $41.6 19.33% 18.73% 20% ’04 $46.6 ’05 $49.0 ’06 $49.9 15% Announced Sale to WFB 5-4-07 10% 8.13% 6.65% 6.63% 5% 3.52% 2.82% 1.67% 1.16% 0% BofA Wells Comerica Silicon Greater B
Slide 43: Why Invest in BBNK?
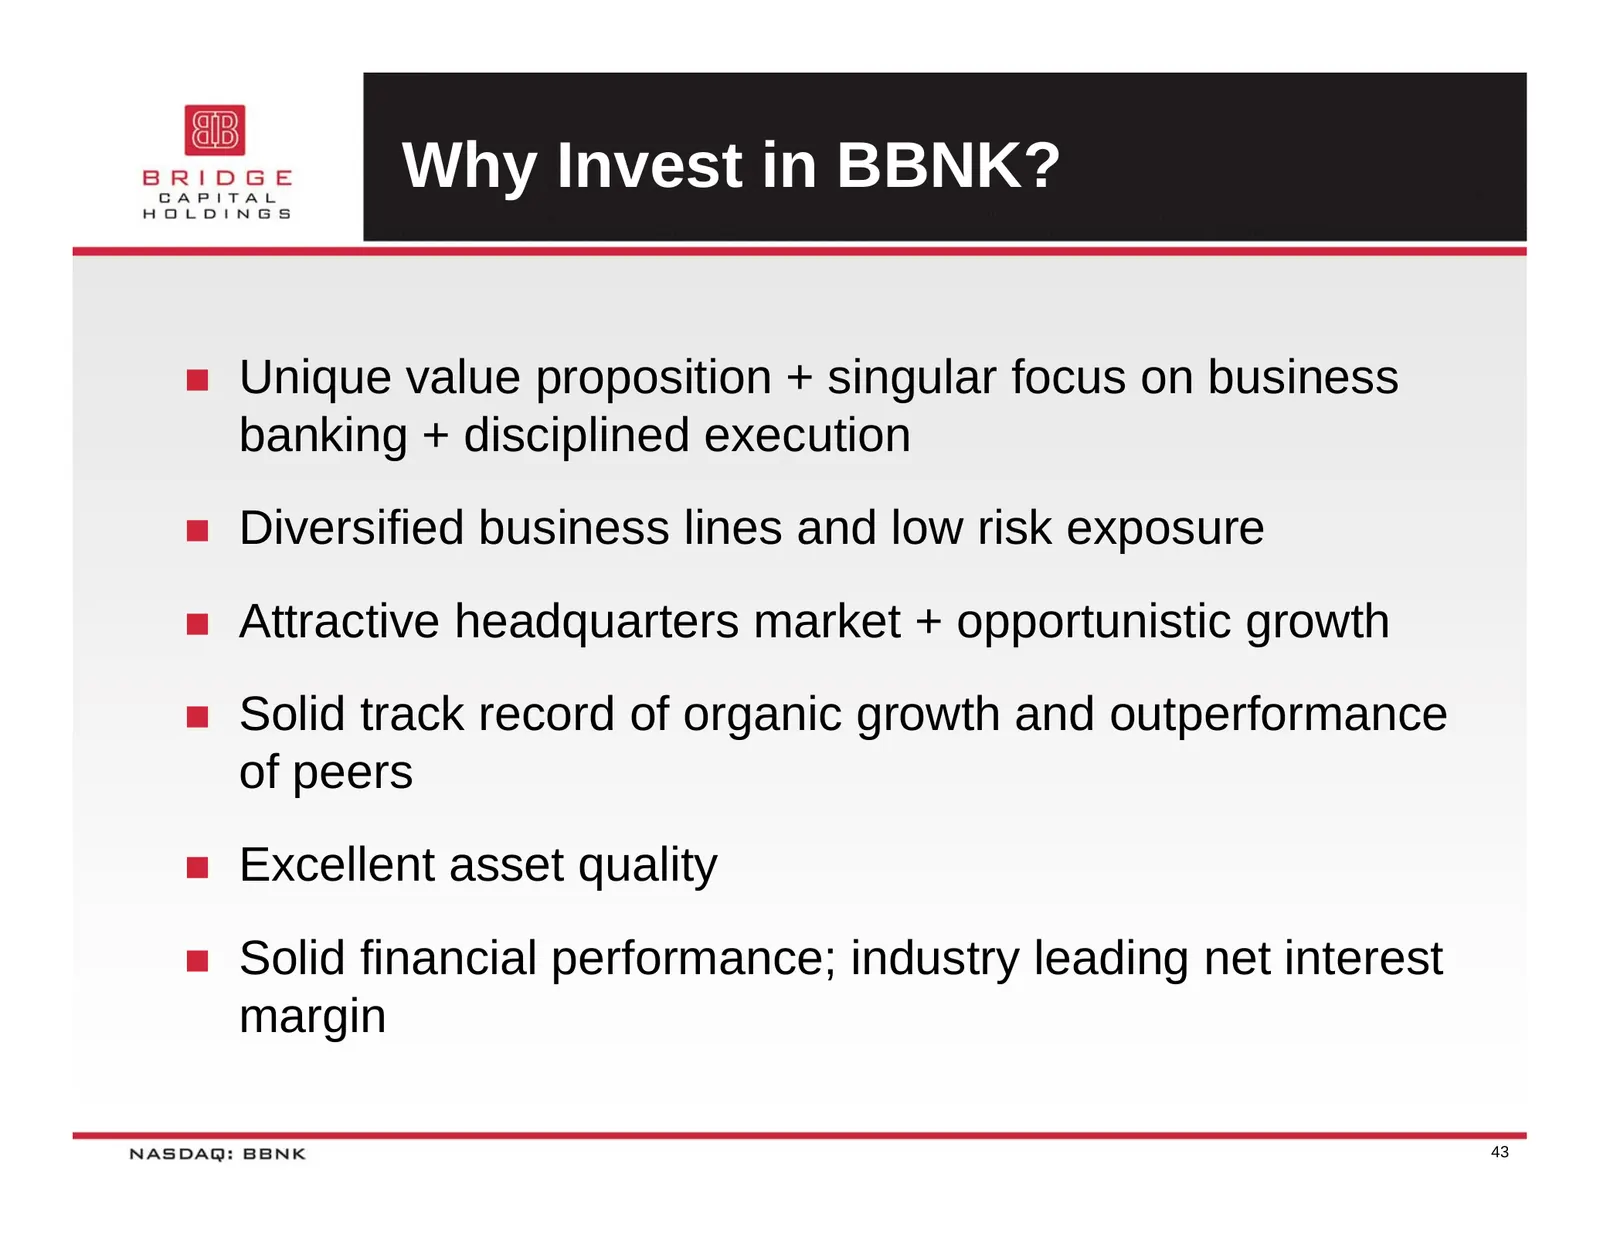
Why Invest in BBNK? Unique value proposition + singular focus on business banking + disciplined execution Diversified business lines and low risk exposure Attractive headquarters market + opportunistic growth Solid track record of organic growth and outperformance of peers Excellent asset
Slide 44: Thank You
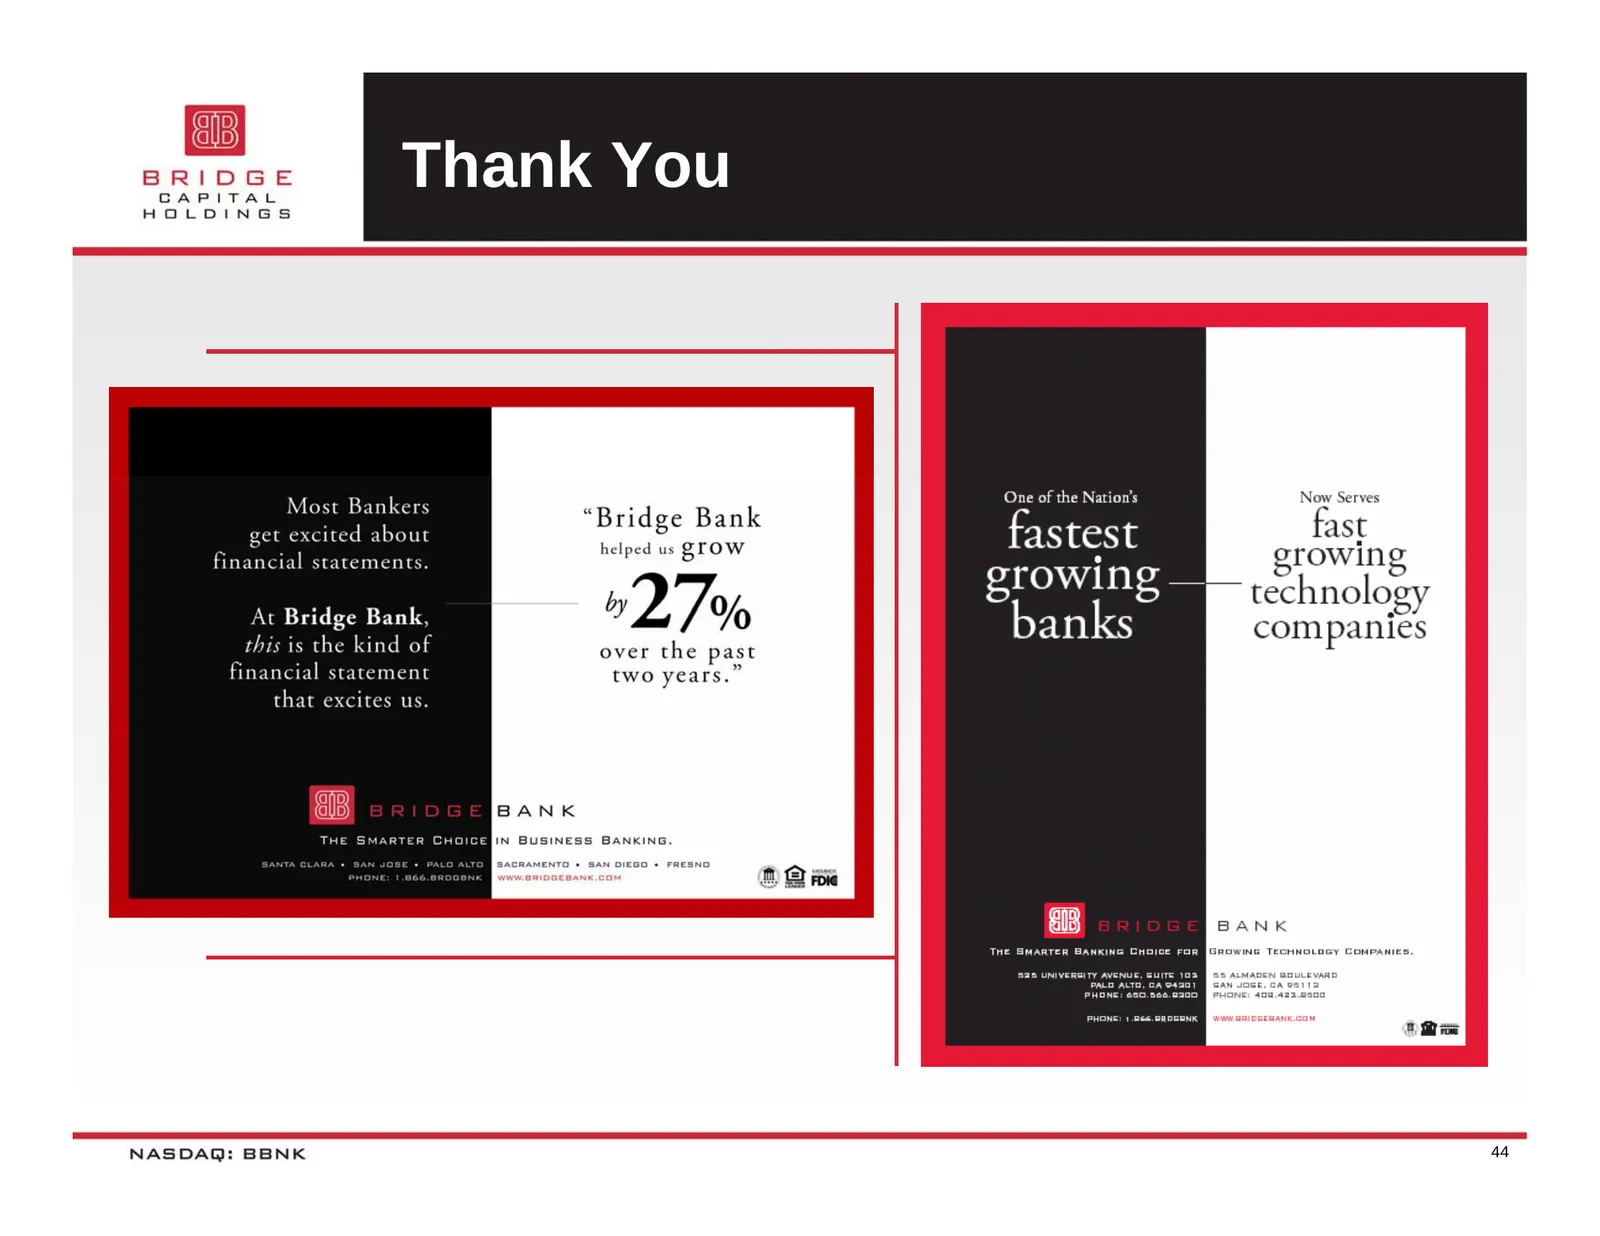
Thank You Most Bankers “Bridge Bank helped us STOW wD 7% over the past two years.” get excited about financial statements. At Bridge Bank, this is the kind of financial statement that excites us. Bee eet iN BUSINESS BANKING. NASDAQ: BBNK One of the Nation’s “E Serves ast : jalan growing § aes — tech
Source: SEC EDGAR · 8-K filed Jun 7, 2007
More decks from Bridge Capital Holdings
 Merger or Acquisition (March 2015)11 slides · Mar 9, 2015
 Q4 2014 Earnings Presentation22 slides · Feb 4, 2015
 Q2 2014 Earnings Presentation23 slides · Jul 29, 2014
 Shareholder Meeting (May 2014)19 slides · May 28, 2014
 Q1 2014 Earnings Presentation23 slides · May 13, 2014
 Q4 2013 Earnings Presentation24 slides · Feb 5, 2014