State Bank Financial Corporation
State Bank Financial — Bank Director Growth Conference 2013
8 slides from State Bank Financial's conference presentation, Apr 23, 2013
Slide 1: Bank Director Growth Conference
Bank Director Growth Conference Dan Speight – Vice Chairman and COO April 30, 2013
Slide 2: Cautionary Note Regarding Forward-Looking Statements
2 Cautionary Note Regarding Forward-Looking Statements Certain statements contained in this earnings deck that are not statements of historical fact may constitute forward-looking statements. These forward-looking statements, which are based on certain assumptions and describe our future plans, stra
Slide 3: State Bank Financial Corporation Profile
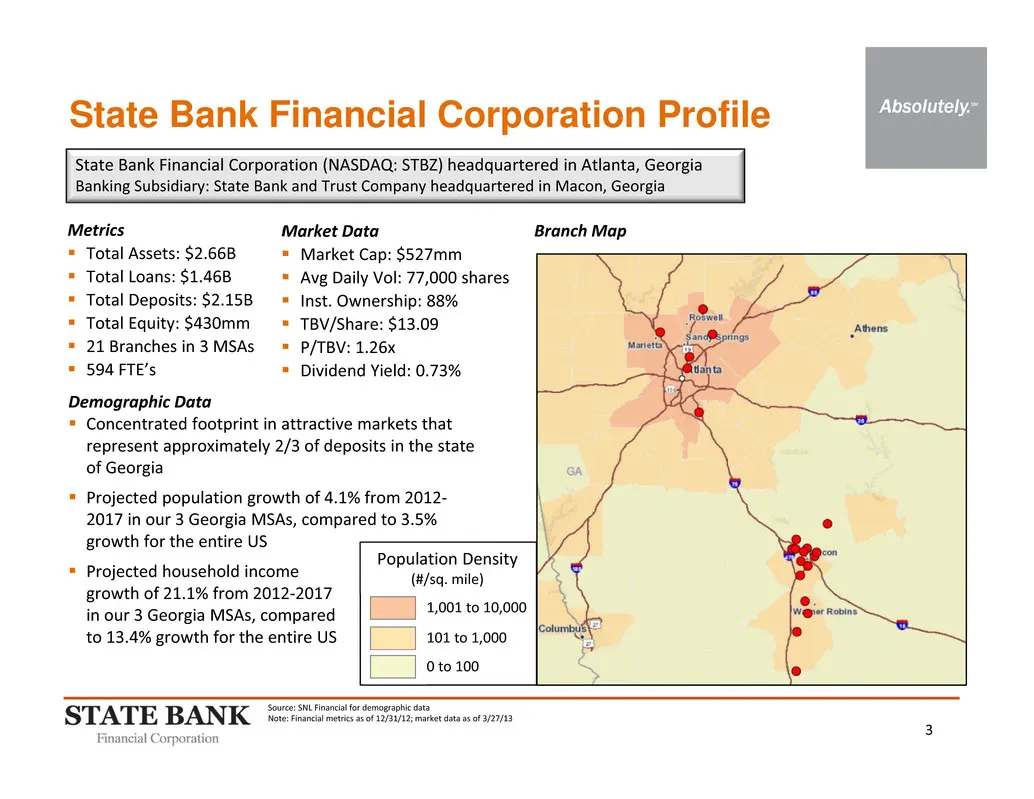
3 State Bank Financial Corporation (NASDAQ: STBZ) headquartered in Atlanta, Georgia Banking Subsidiary: State Bank and Trust Company headquartered in Macon, Georgia State Bank Financial Corporation Profile Market Data Market Cap: $527mm Avg Daily Vol: 77,000 shares Inst. Ownership: 88% TBV/S
Slide 4: Continues with Successfully Replacing Covered Assets
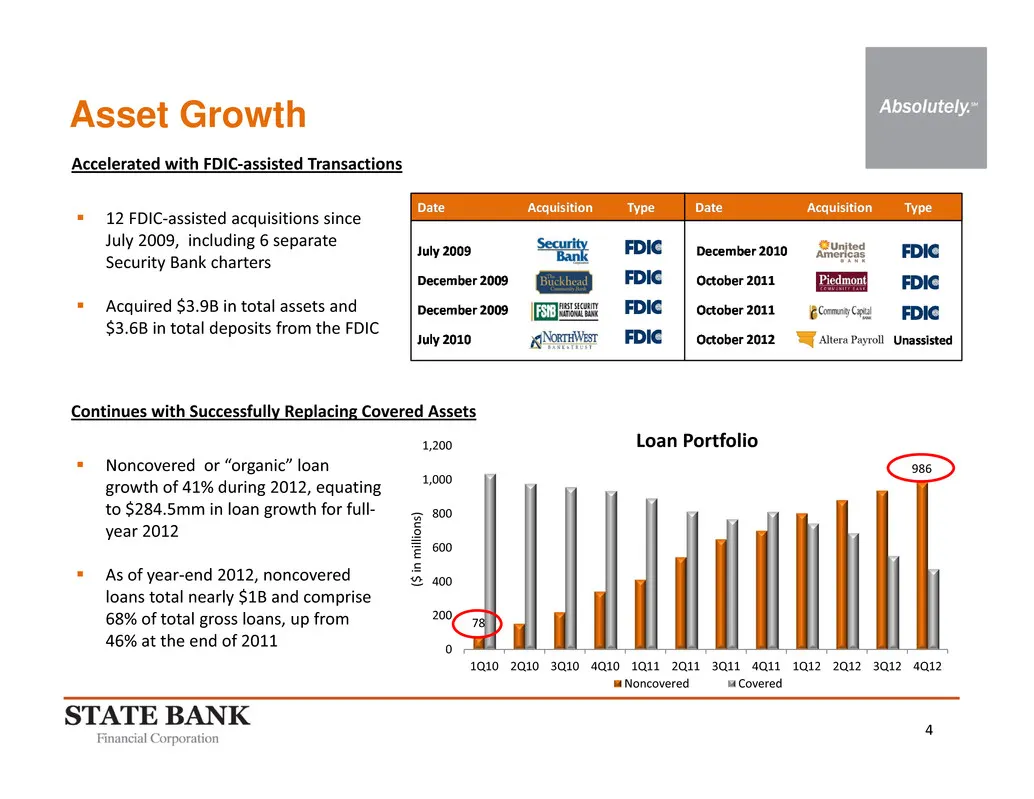
4 78 986 0 200 400 600 800 1,000 1,200 1Q10 2Q10 3Q10 4Q10 1Q11 2Q11 3Q11 4Q11 1Q12 2Q12 3Q12 4Q12 Loan Portfolio Noncovered Covered Asset Growth Noncovered or “organic” loan growth of 41% during 2012, equating to $284.5mm in loan growth for full‐ year 2012 As of year‐end 2012, noncovered loans
Slide 5: Funding Improvement Driven by NIB Deposit Growth
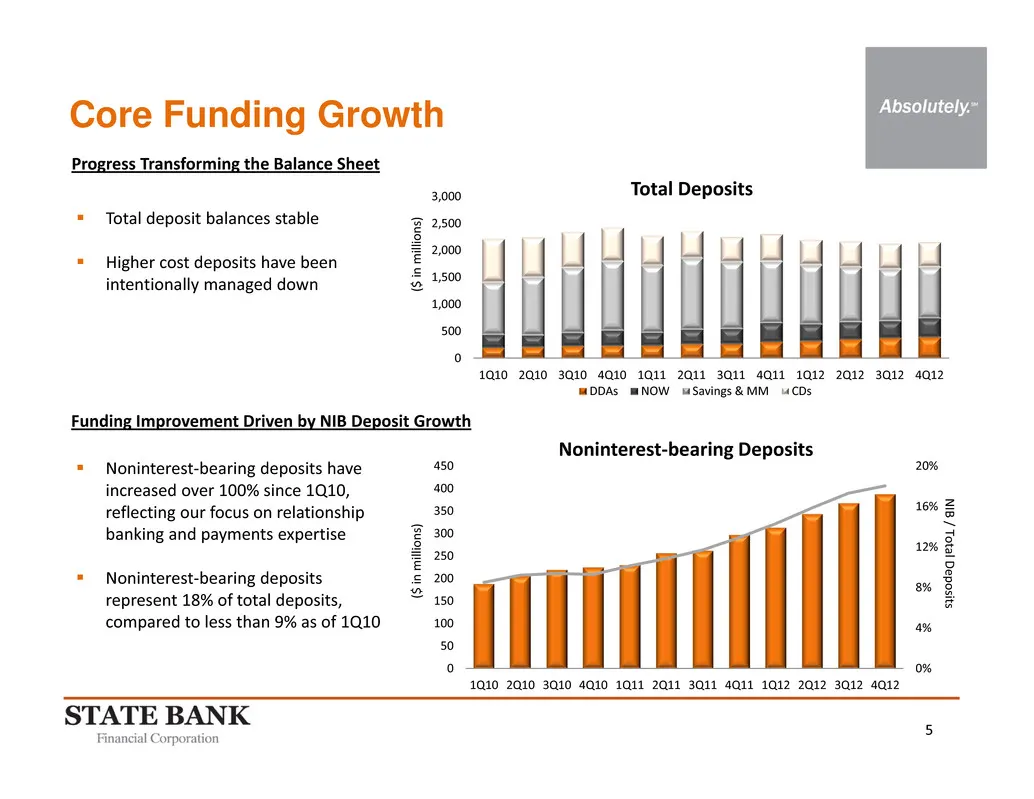
5 Core Funding Growth Noninterest‐bearing deposits have increased over 100% since 1Q10, reflecting our focus on relationship banking and payments expertise Noninterest‐bearing deposits represent 18% of total deposits, compared to less than 9% as of 1Q10 ( $ i n m i l l i o n s ) Total deposit
Slide 6: Excess Capital to Fund Growth Opportunities
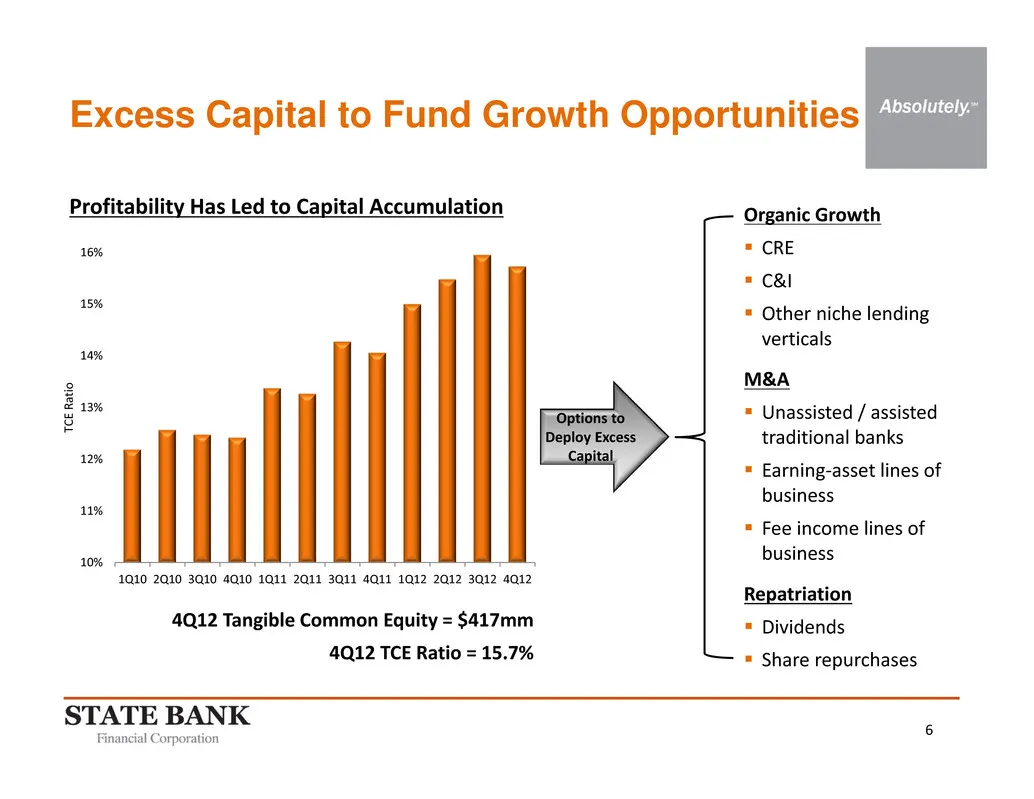
6 Excess Capital to Fund Growth Opportunities Organic Growth CRE C&I Other niche lending verticals M&A Unassisted / assisted traditional banks Earning‐asset lines of business Fee income lines of business Repatriation Dividends Share repurchases Profitability Has Led to Capital Accumu
Slide 7: Growth Objectives Balanced with Commitment to Credit Conservatism
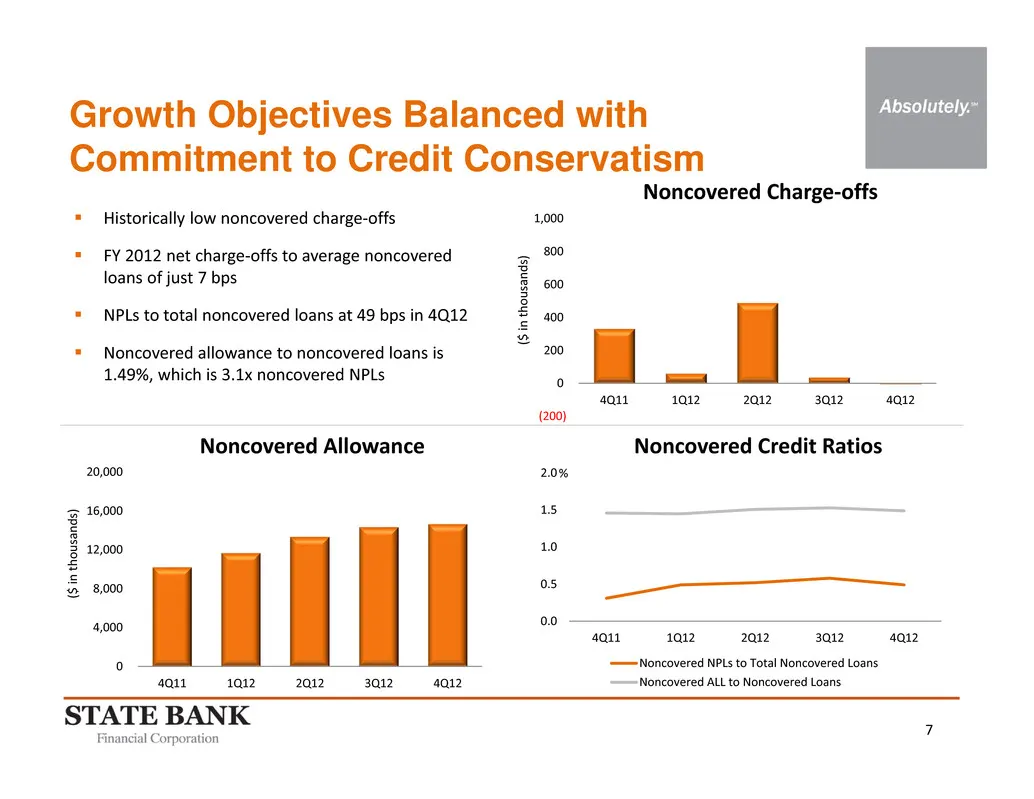
7 Growth Objectives Balanced with Commitment to Credit Conservatism Historically low noncovered charge‐offs FY 2012 net charge‐offs to average noncovered loans of just 7 bps NPLs to total noncovered loans at 49 bps in 4Q12 Noncovered allowance to noncovered loans is 1.49%, which is 3.1x nonc
Slide 8: Well Positioned for Growth
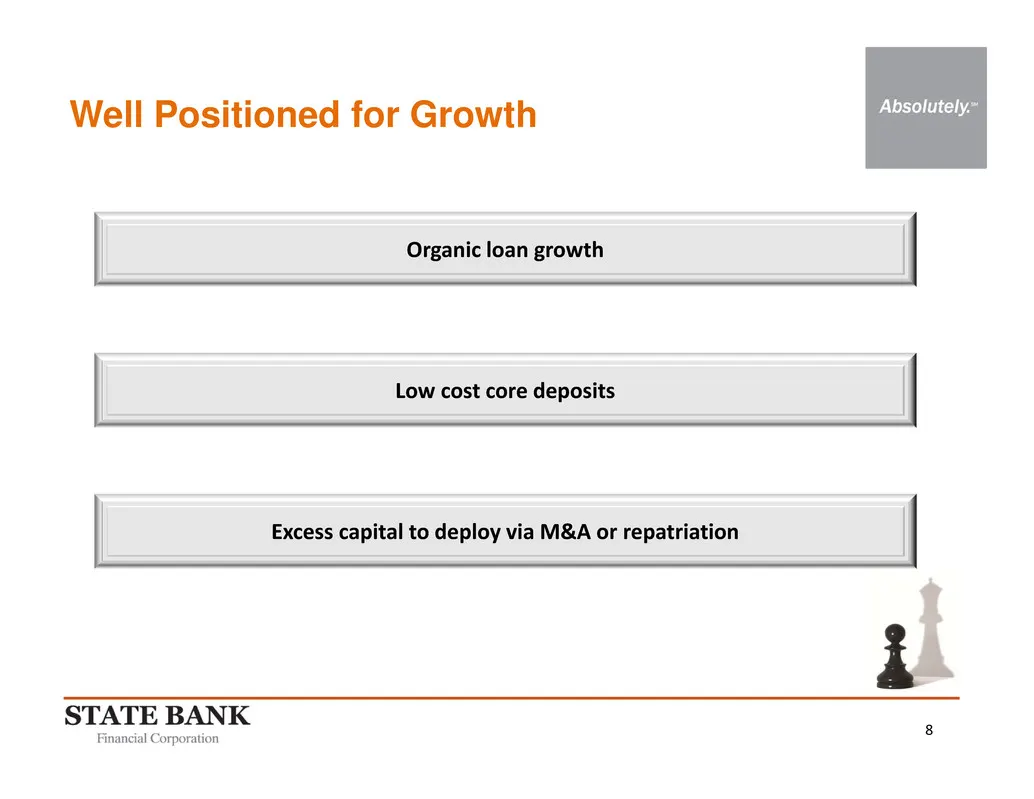
8 Well Positioned for Growth Organic loan growth Low cost core deposits Excess capital to deploy via M&A or repatriation
Source: SEC EDGAR · 8-K filed Apr 23, 2013
More decks from State Bank Financial Corporation
 Merger or Acquisition (May 2018)20 slides · May 14, 2018
 Investor Presentation (May 2018)18 slides · May 7, 2018
 Q1 2018 Earnings Presentation11 slides · Apr 26, 2018
 Q4 2017 Earnings Presentation14 slides · Jan 25, 2018
 Investor Presentation (December 2017)18 slides · Dec 11, 2017
 Q3 2017 Earnings Presentation12 slides · Oct 26, 2017