Jones Lang LaSalle Income Property Trust, Inc. · NASDAQ:ZIPTAX
Jones Lang LaSalle Income Property Trust — JLL Income Property Trust — Investor Presentation (October 2023)
29 slides from Jones Lang LaSalle Income Property Trust's investor presentation, Oct 13, 2023

Slide 1: Investor Presentation 3Q 2023
Investor Presentation 3Q 2023 This sales and advertising literature is neither an offer to sell nor a solicitation of an offer to buy securities. An offering is made only by the prospectus. This literature must be read in conjunction with the prospectus in order to fully understand all of the implic
Slide 2: Risk Factors
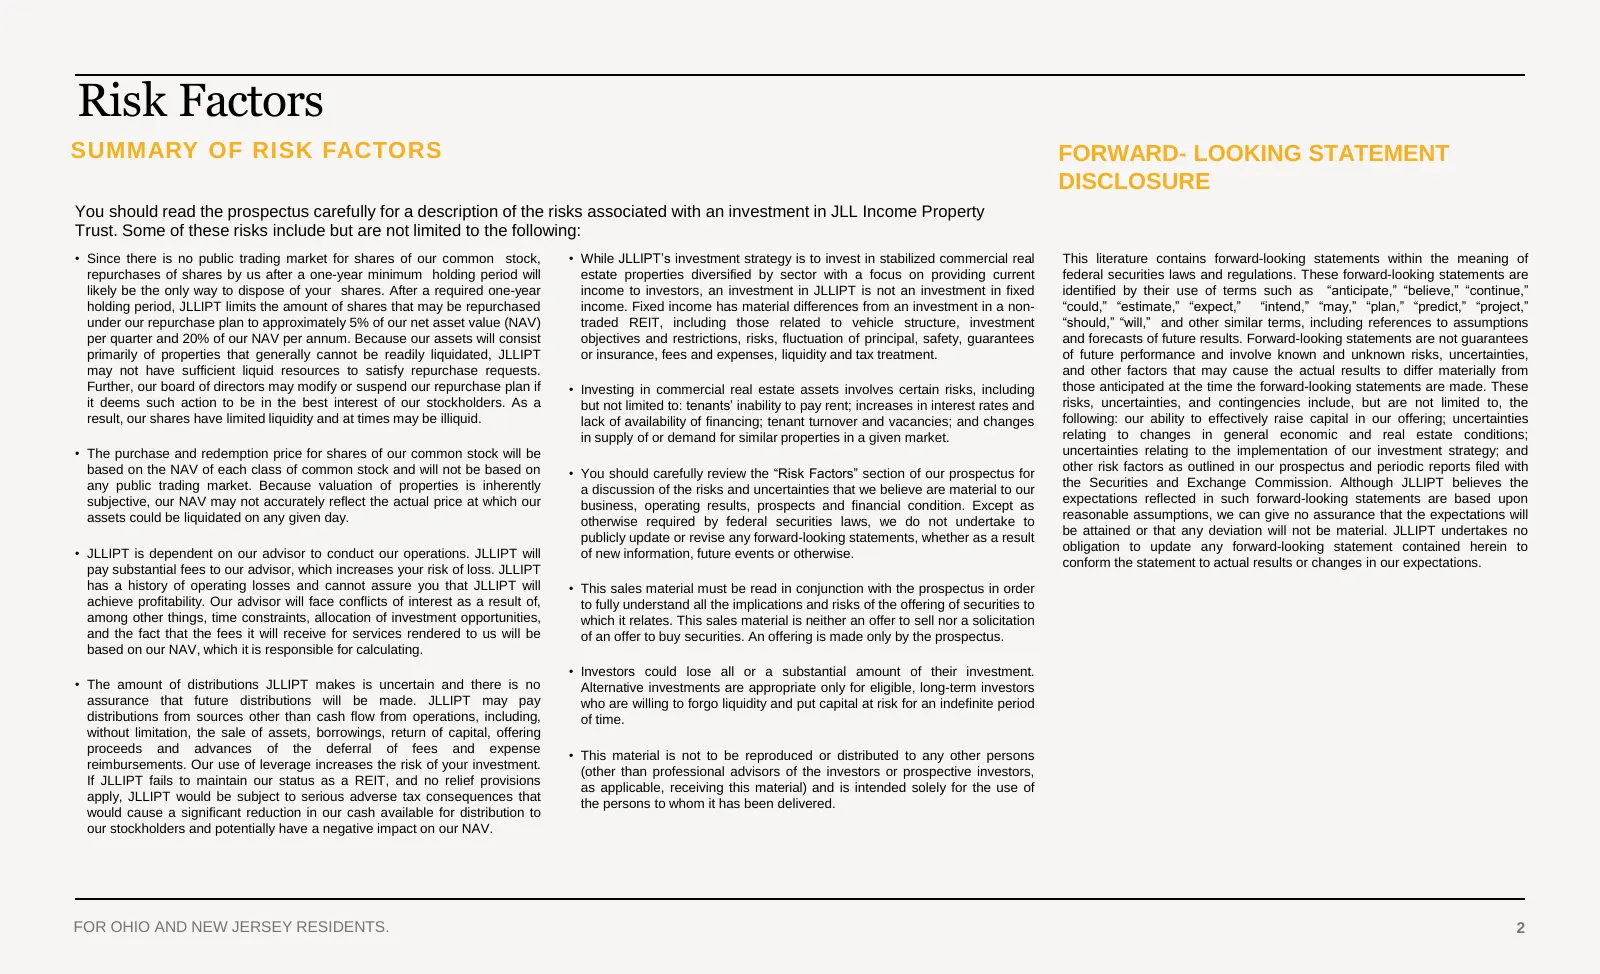
Risk Factors SUMMARY OF RISK FACTORS FORWARD- LOOKING STATEMENT DISCLOSURE You should read the prospectus carefully for a description of the risks associated with an investment in JLL Income Property Trust. Some of these risks include but are not limited to the following: • Since there is no public
Slide 3: JLL Platform
JLL Platform Section 1 JLL Platform Section 2 Core Real Estate Section 3 Portfolio Overview Section 4 Appendix Note: Property shown on this slide is included in the JLL Income Property Trust portfolio. FOR OHIO AND NEW JERSEY RESIDENTS.
Slide 4: Capabilities
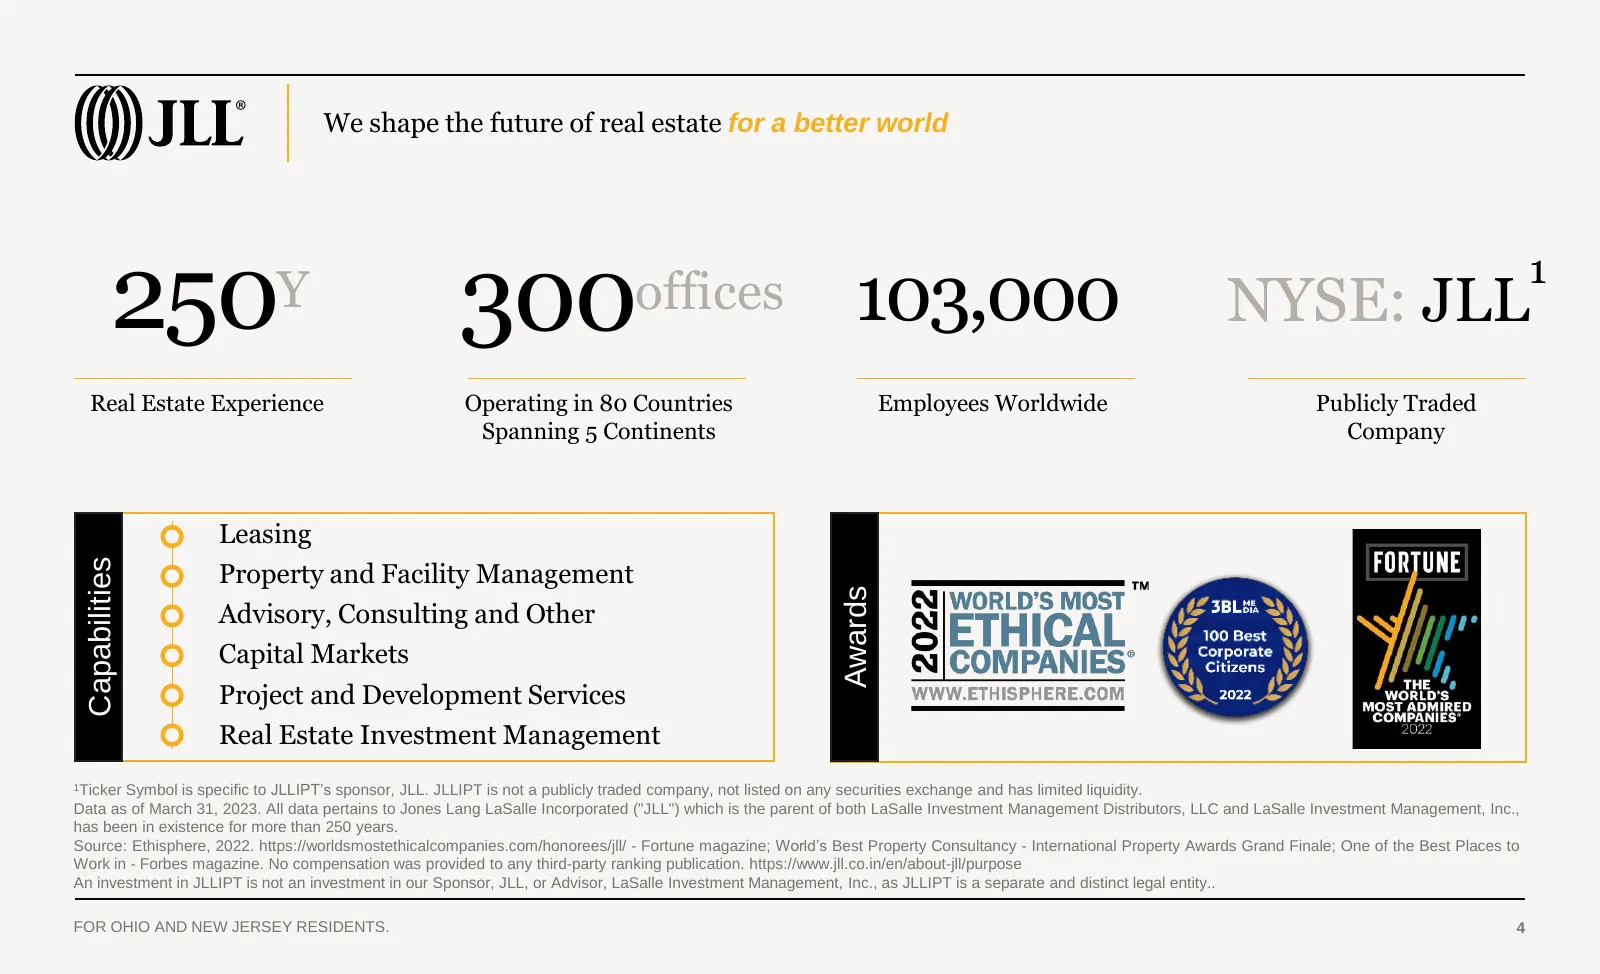
We shape the future of real estate for a better world 250 Y 300offices 103,000 NYSE: JLL 1 Real Estate Experience Operating in 80 Countries Employees Worldwide Publicly Traded Spanning 5 Continents Company Leasing Capabilities Property and Facility Management Awards Advisory, Consulting and Other Ca
Slide 5: Total AUM $77.7B Core Real Estate
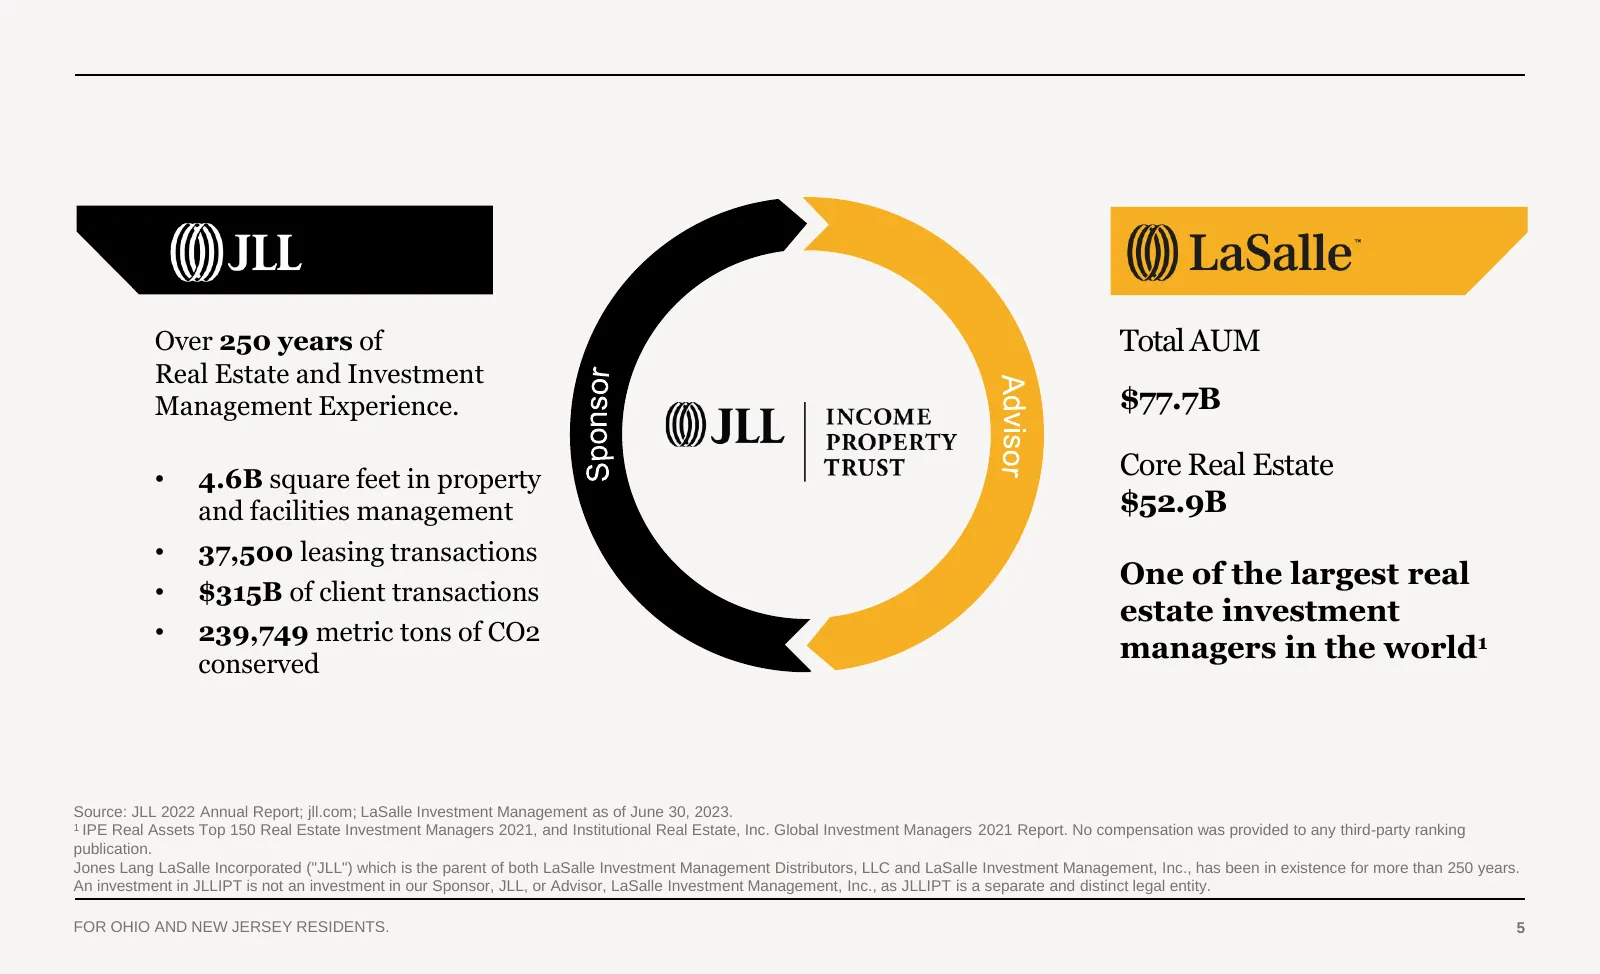
Over 250 years of Total AUM Real Estate and Investment Management Experience. $77.7B • 4.6B square feet in property Core Real Estate and facilities management $52.9B • 37,500 leasing transactions One of the largest real • $315B of client transactions estate investment • 239,749 metric tons of CO2 co
Slide 6: Core Real Estate
Core Real Estate Section 1 JLL Platform Section 2 Core Real Estate Section 3 Portfolio Overview Section 4 Appendix Note: Property shown on this slide is included in the JLL Income Property Trust portfolio. FOR OHIO AND NEW JERSEY RESIDENTS.
Slide 7: Commercial real estate is a major asset class
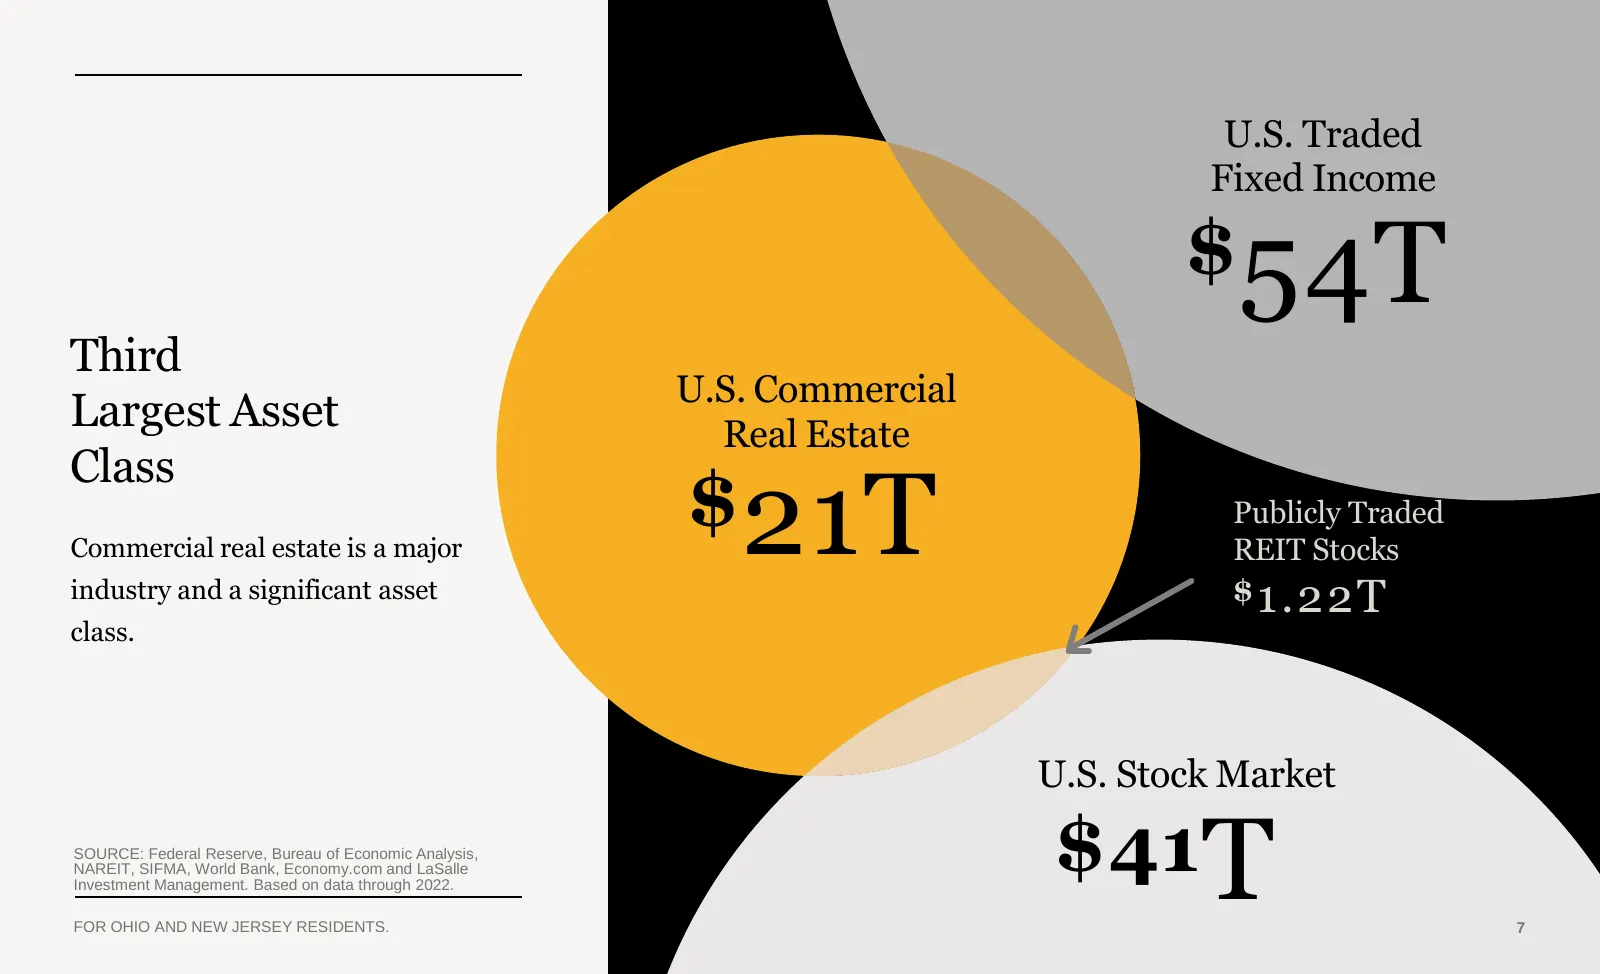
U.S. Traded Fixed Income $ 54T Third U.S. Commercial Largest Asset Real Estate Class Commercial real estate is a major $ 21T Publicly Traded REIT Stocks industry and a significant asset $ 1.22T class. U.S. Stock Market SOURCE: Federal Reserve, Bureau of Economic Analysis, NAREIT, SIFMA, World Bank,
Slide 8: Real Estate Investment Styles
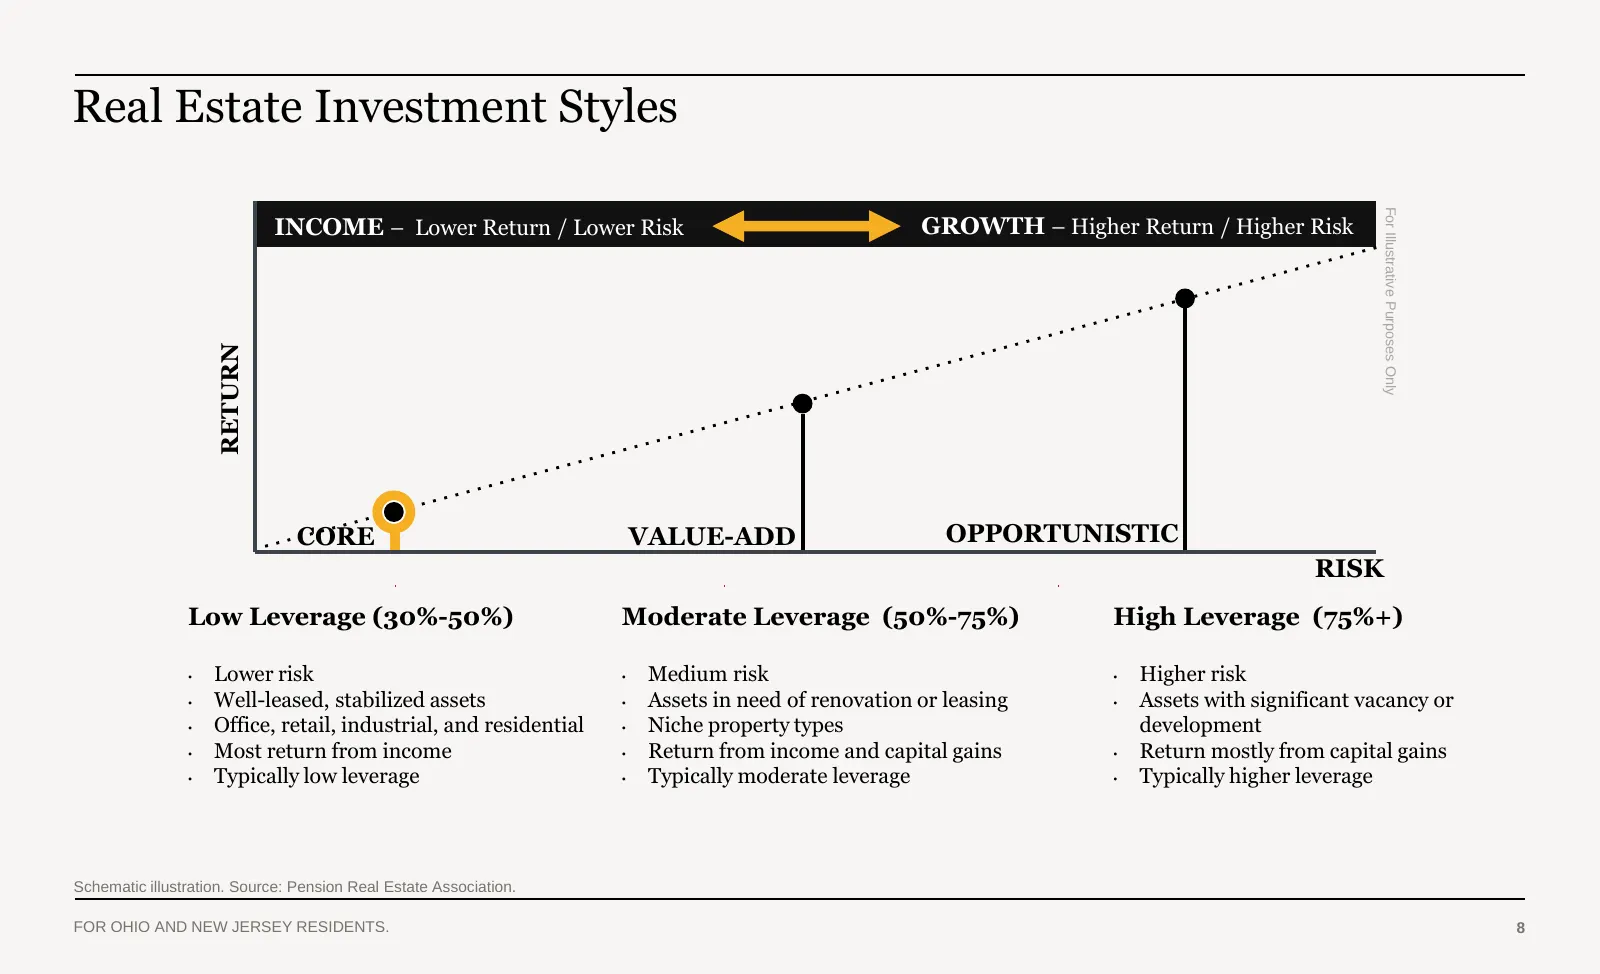
Real Estate Investment Styles For Illustrative Purposes Only RETURN INCOME – Lower Return / Lower Risk GROWTH – Higher Return / Higher Risk CORE VALUE-ADD OPPORTUNISTIC RISK Low Leverage (30%-50%) Moderate Leverage (50%-75%) High Leverage (75%+) • Lower risk • Medium risk • Higher risk • Well-leased
Slide 9: Portfolio Overview
Portfolio Overview Section 1 JLL Platform Section 2 Core Real Estate Section 3 Portfolio Overview Section 4 Appendix Note: Property shown on this slide is included in the JLL Income Property Trust portfolio. FOR OHIO AND NEW JERSEY RESIDENTS.
Slide 10: Investment Objectives and Strategy
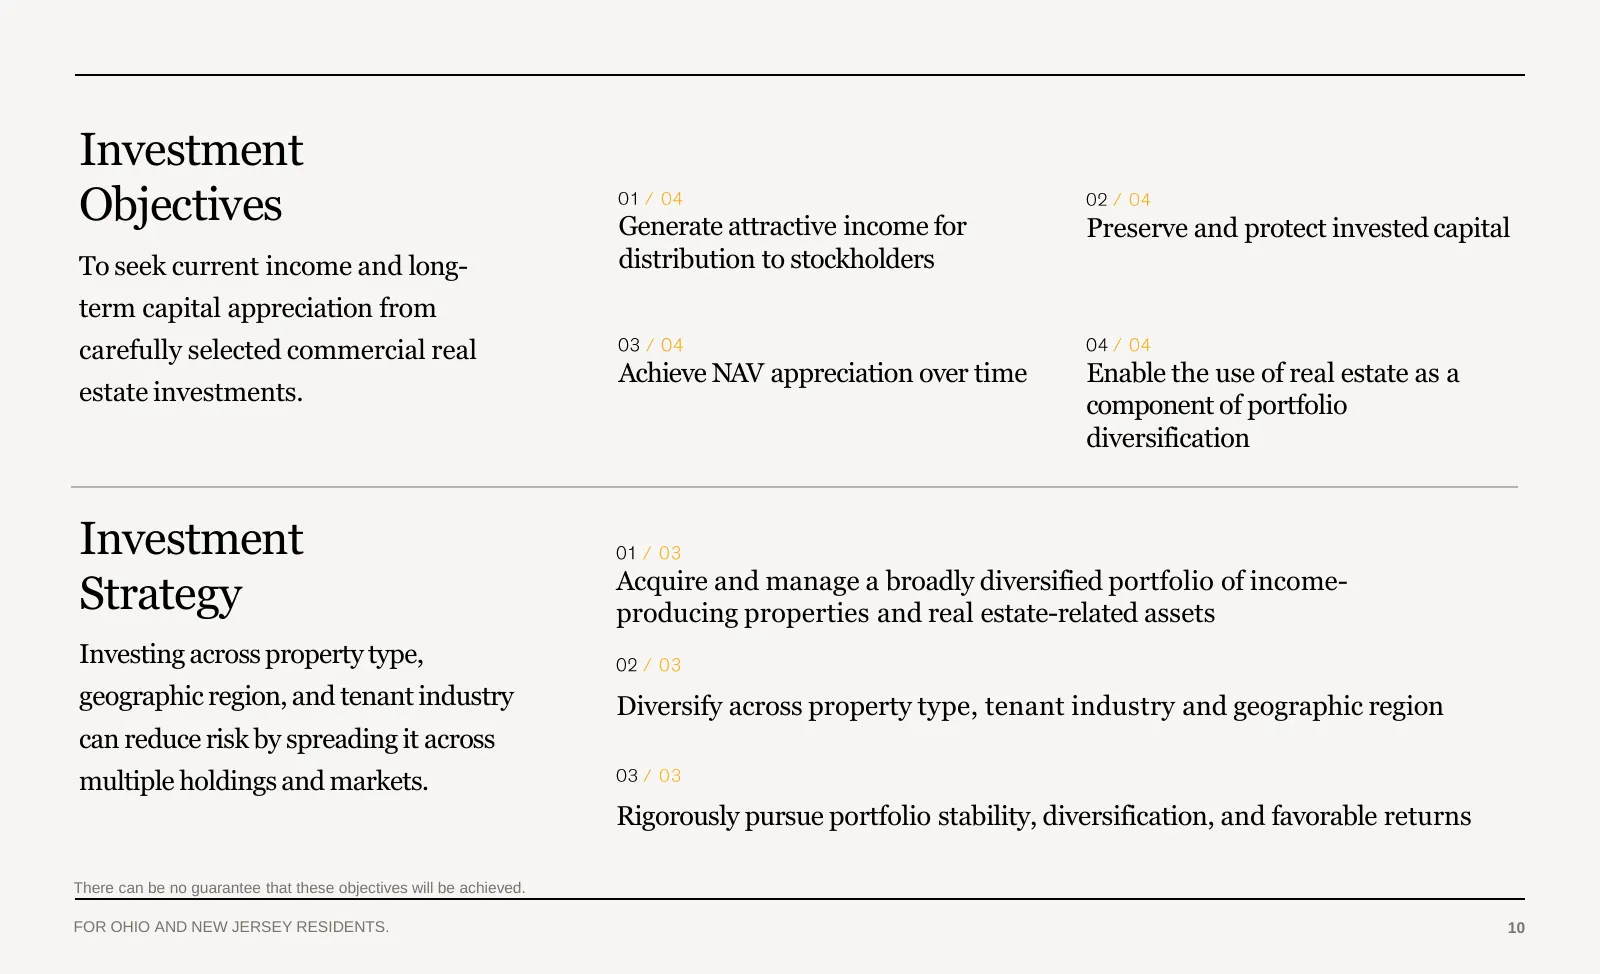
Investment Objectives Generate attractive income for Preserve and protect invested capital To seek current income and long- distribution to stockholders term capital appreciation from carefully selected commercial real Achieve NAV appreciation over time Enable the use of real estate as a estate inve
Slide 11: Portfolio Overview
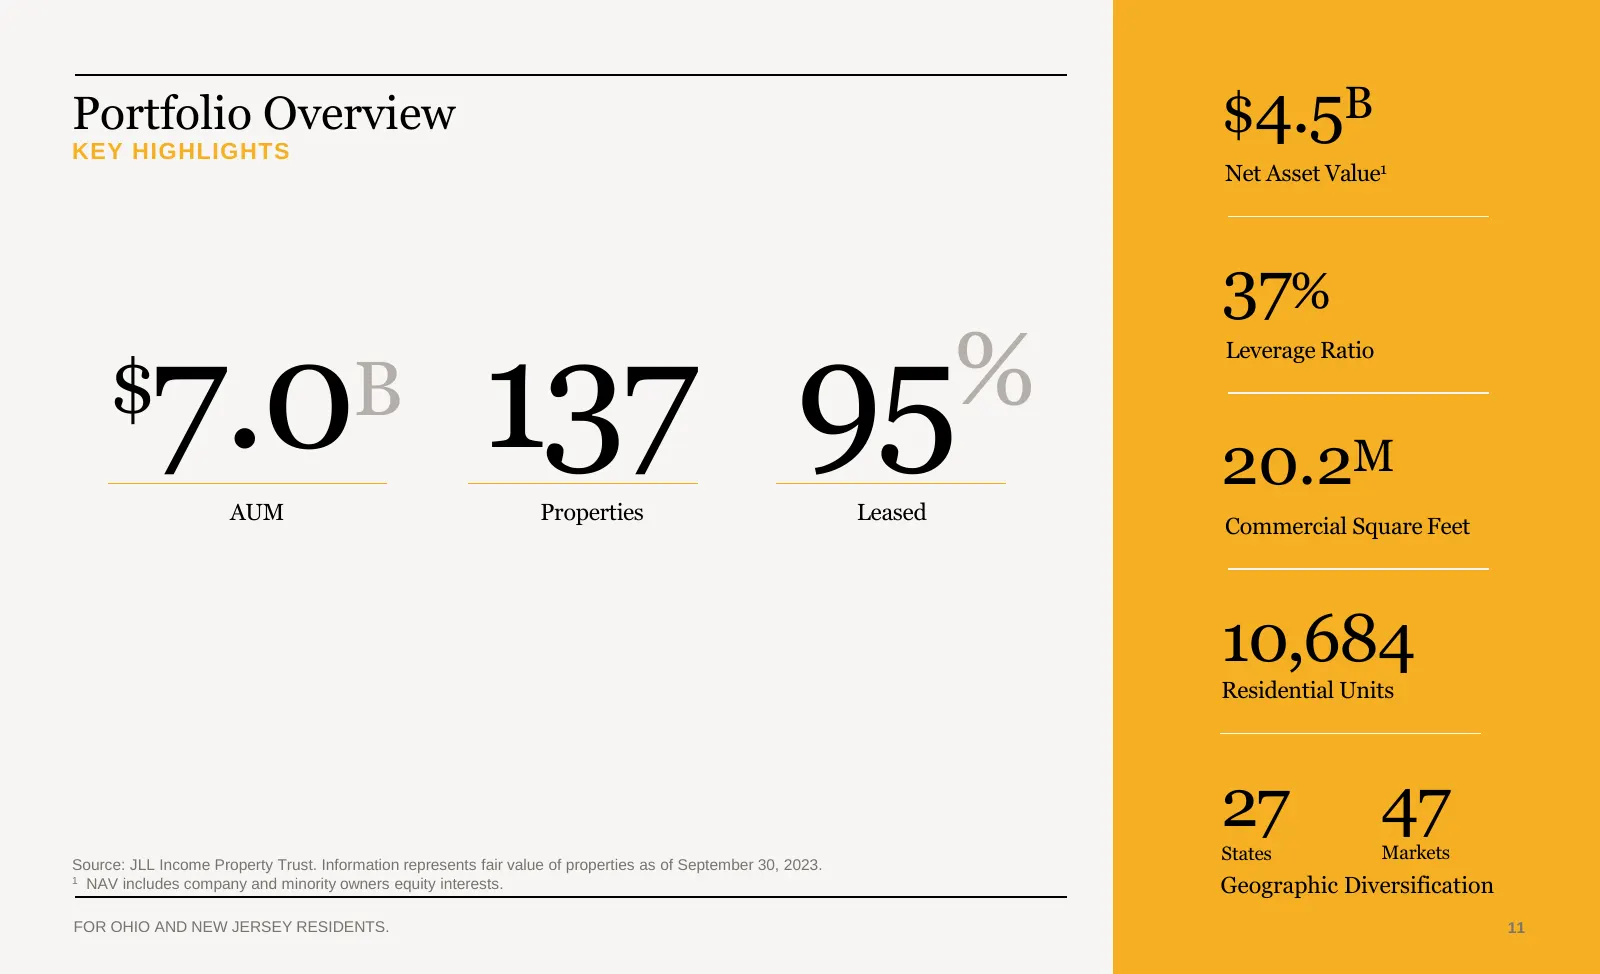
Portfolio Overview KEY HIGHLIGHTS $4.5B Net Asset Value1 37% 7.0 137 95% Leverage Ratio $ B 20.2M AUM Properties Leased Commercial Square Feet 10,684 Residential Units 27 47 States Markets Source: JLL Income Property Trust. Information represents fair value of properties as of September 30, 2023. 1
Slide 12: Current Portfolio
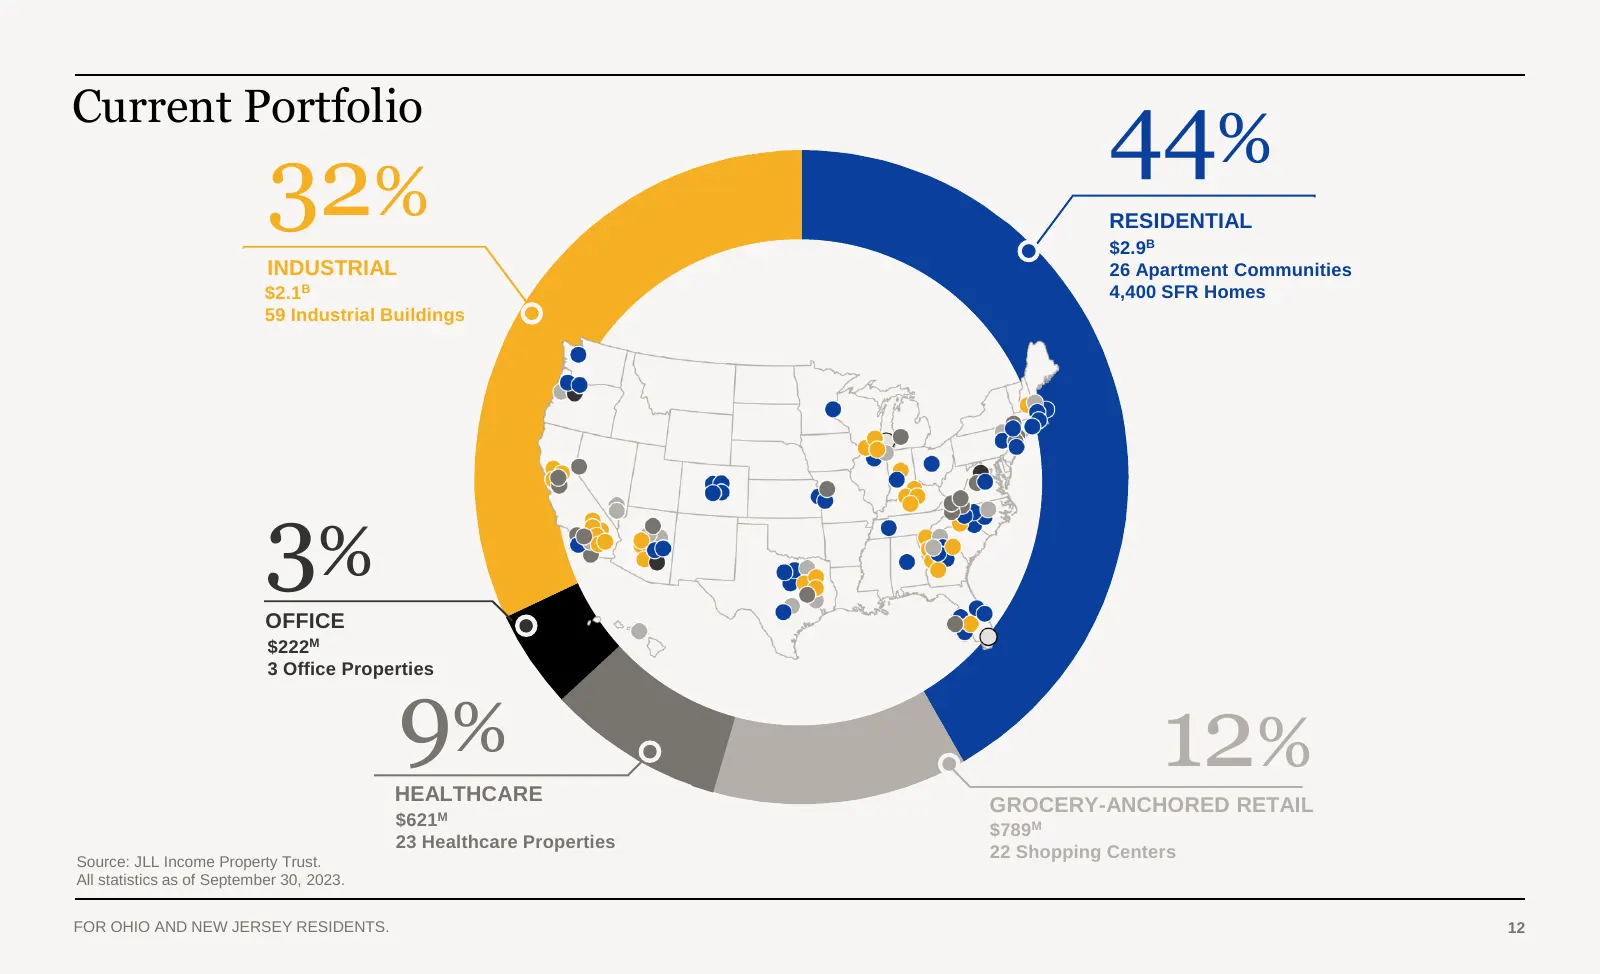
Current Portfolio 44% 32% RESIDENTIAL $2.9B INDUSTRIAL 26 Apartment Communities $2.1B 4,400 SFR Homes 59 Industrial Buildings 3% OFFICE $222M 3 Office Properties 9% 12% HEALTHCARE GROCERY-ANCHORED RETAIL $621M $789M 23 Healthcare Properties Source: JLL Income Property Trust. 22 Shopping Centers All
Slide 13: Active Management of Portfolio Diversification
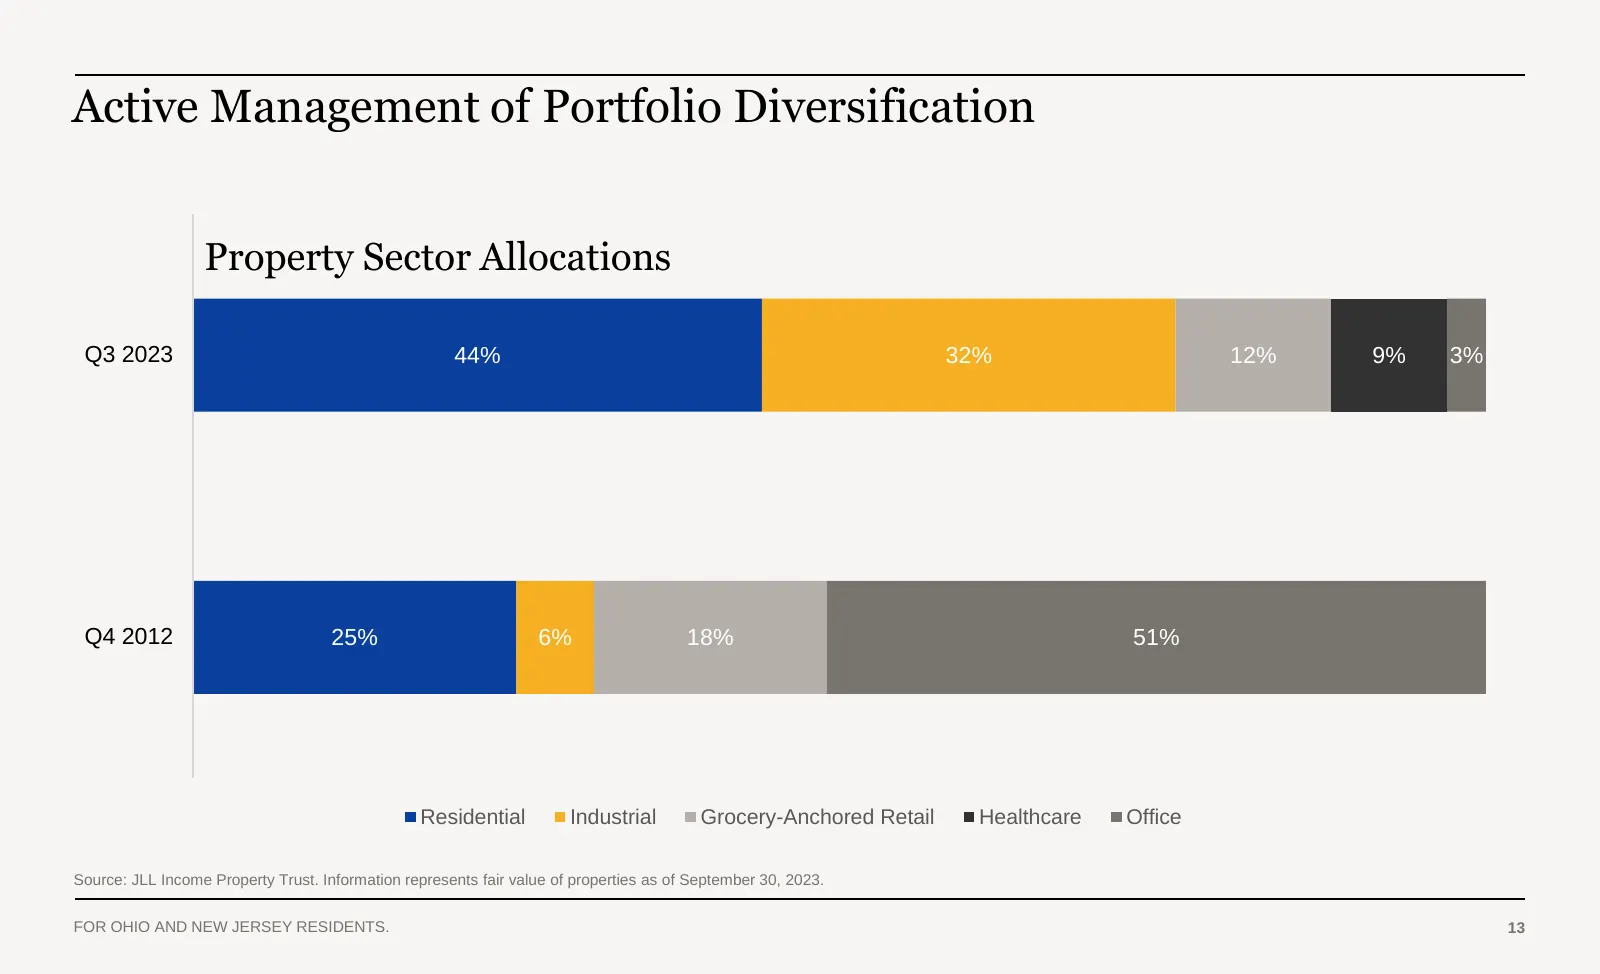
Active Management of Portfolio Diversification Property Sector Allocations Q3 2023 44% 32% 12% 9% 3% Q4 2012 25% 6% 18% 51% Residential Industrial Grocery-Anchored Retail Healthcare Office Source: JLL Income Property Trust. Information represents fair value of properties as of September 30, 2023. FO
Slide 14: Residential
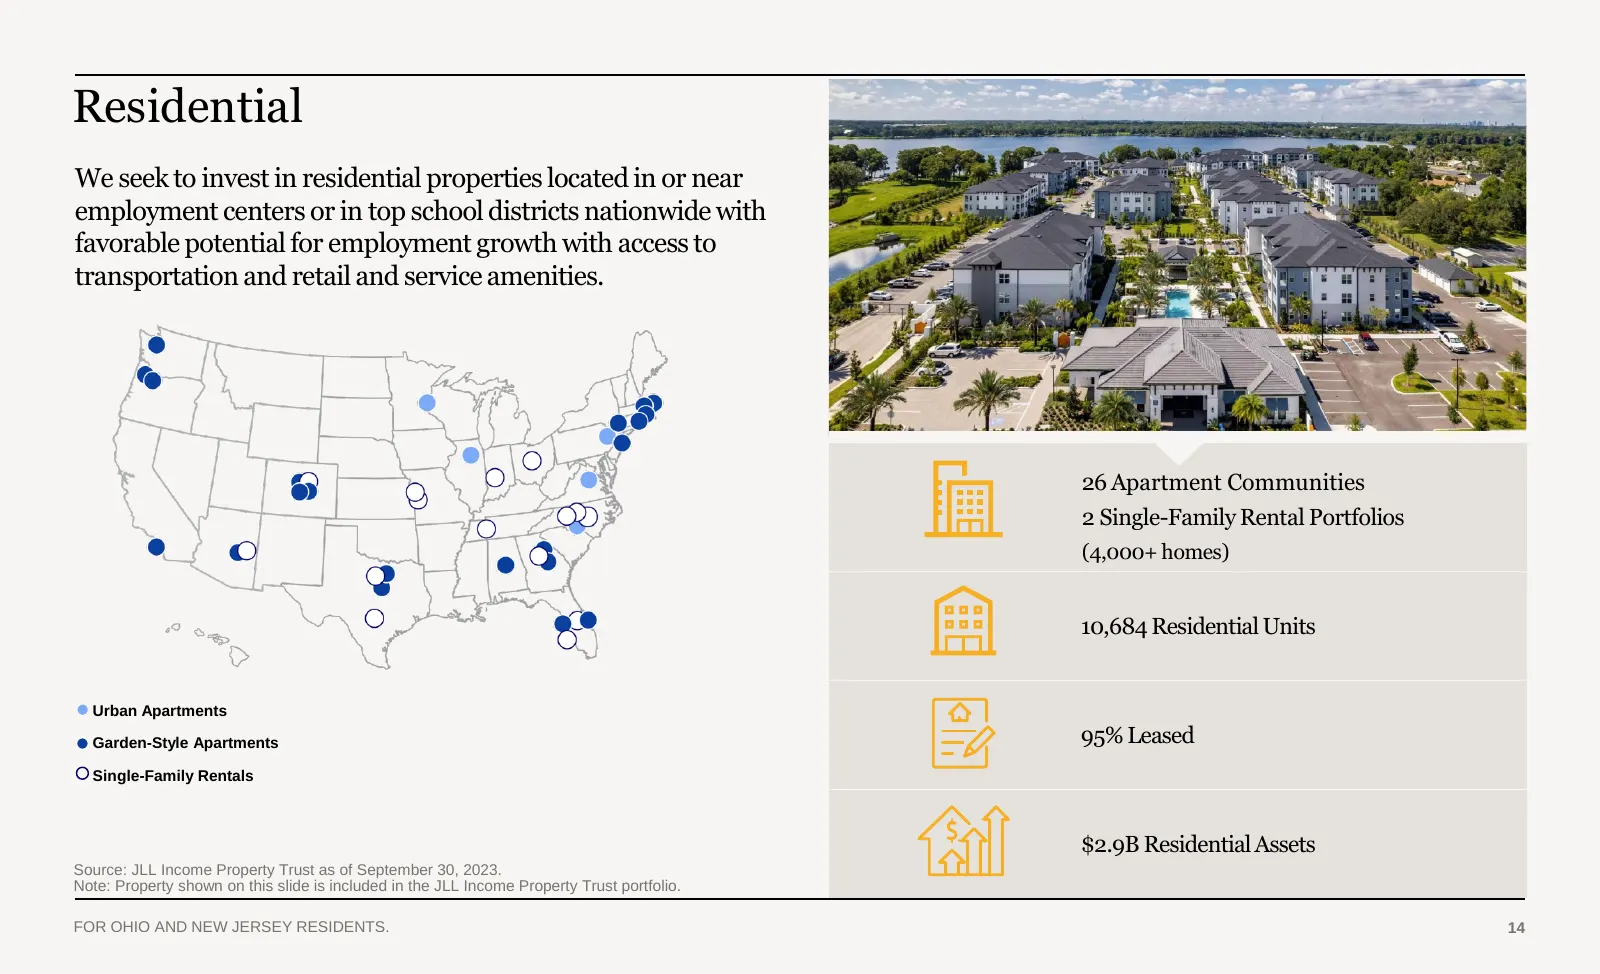
Residential We seek to invest in residential properties located in or near employment centers or in top school districts nationwide with favorable potential for employment growth with access to transportation and retail and service amenities. 26 Apartment Communities 2 Single-Family Rental Portfolio
Slide 15: Industrial
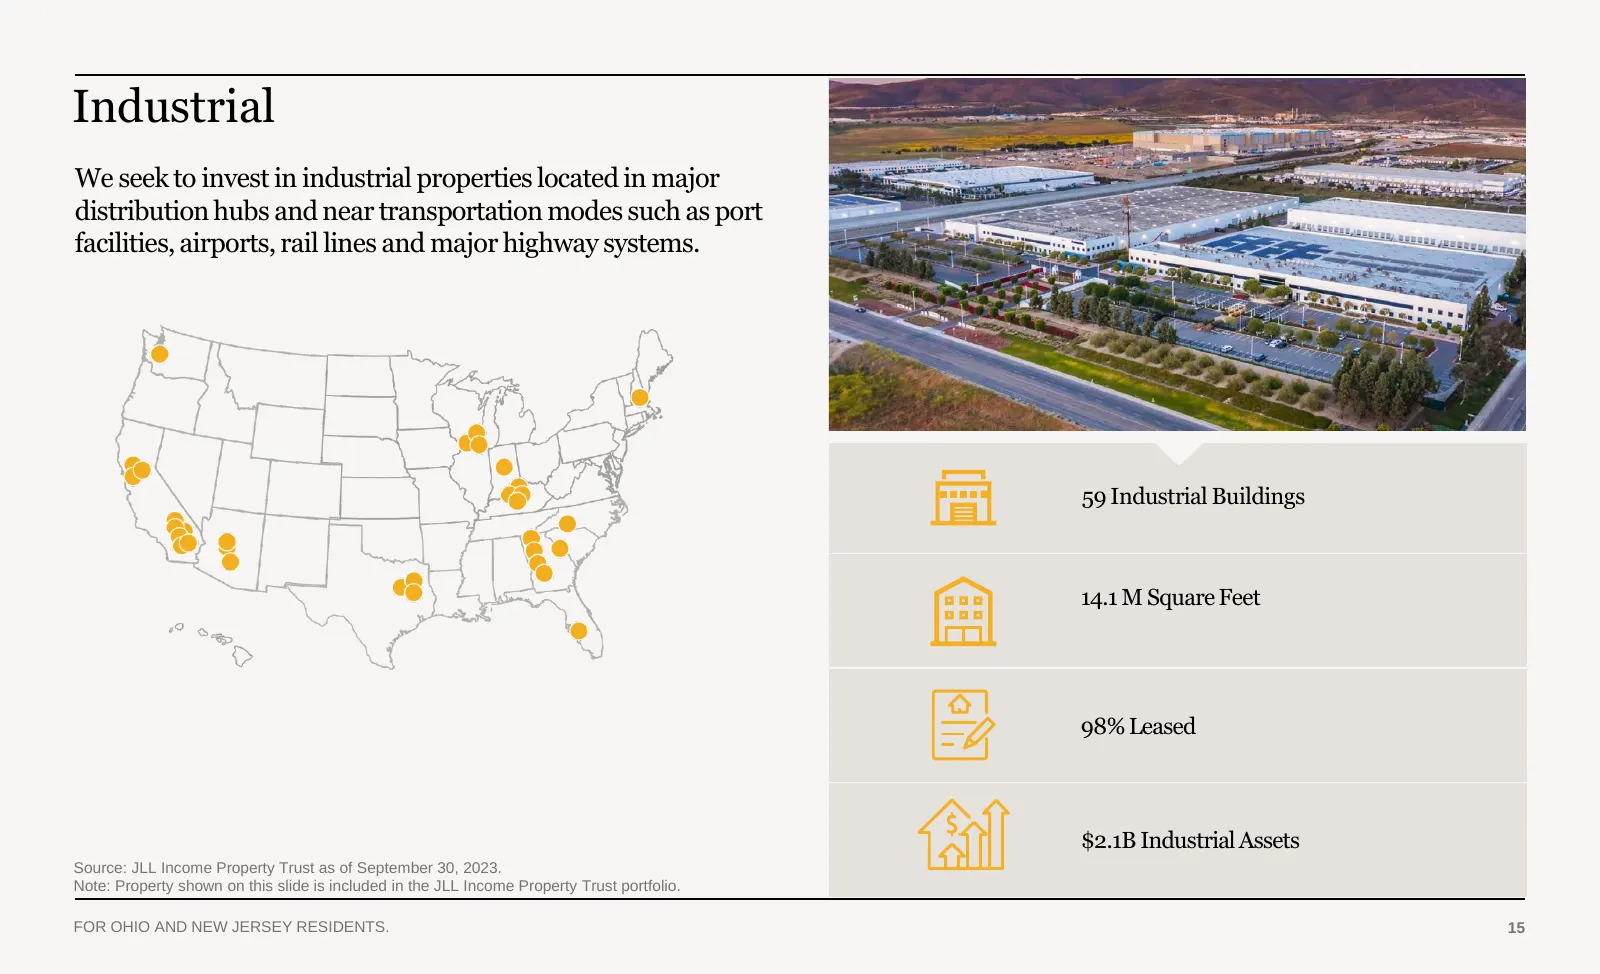
Industrial We seek to invest in industrial properties located in major distribution hubs and near transportation modes such as port facilities, airports, rail lines and major highway systems. 59 Industrial Buildings 14.1 M Square Feet 98% Leased $2.1B Industrial Assets Source: JLL Income Property Tr
Slide 16: Grocery-Anchored Retail
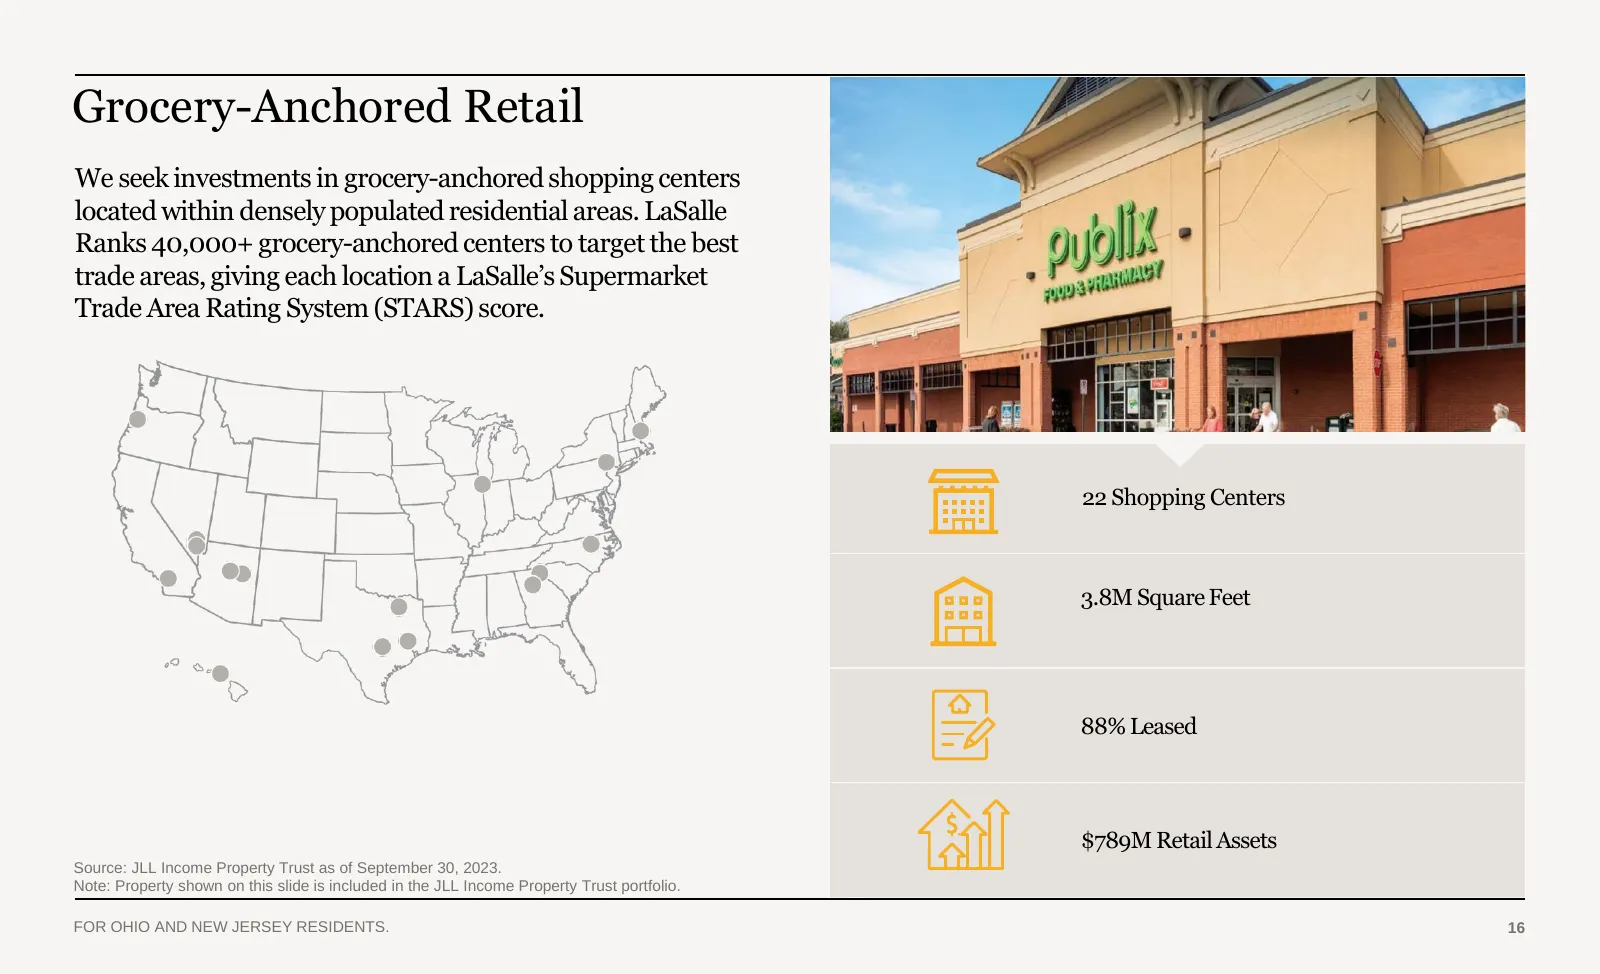
Grocery-Anchored Retail We seek investments in grocery-anchored shopping centers located within densely populated residential areas. LaSalle Ranks 40,000+ grocery-anchored centers to target the best trade areas, giving each location a LaSalle’s Supermarket Trade Area Rating System (STARS) score. 22

Slide 17: Healthcare
Healthcare We view the healthcare industry as having significant demographic tailwinds. We seek to invest in medical office and life science assets with significant tenant investments which we believe increases renewal probabilities over time. 18 Medical Office Buildings 5 Life Sciences Buildings 1.
Slide 18: ESG Integration Through Active Asset Management
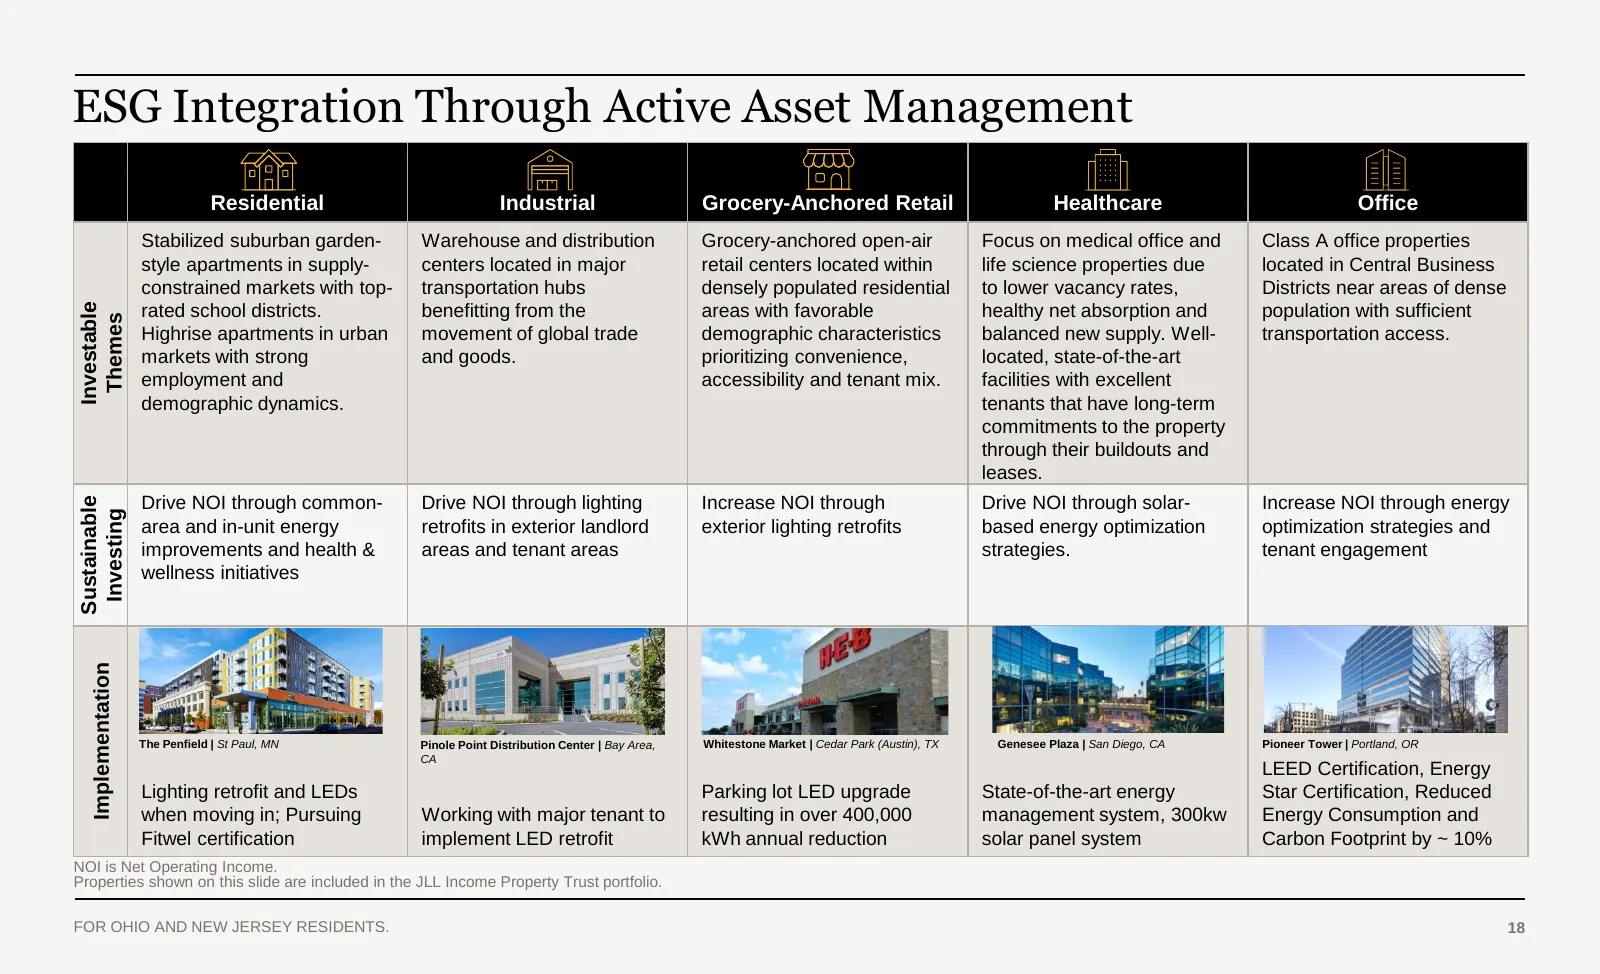
ESG Integration Through Active Asset Management Residential Industrial Grocery-Anchored Retail Healthcare Office Stabilized suburban garden- Warehouse and distribution Grocery-anchored open-air Focus on medical office and Class A office properties style apartments in supply- centers located in major
Slide 19: Awards and Recognition
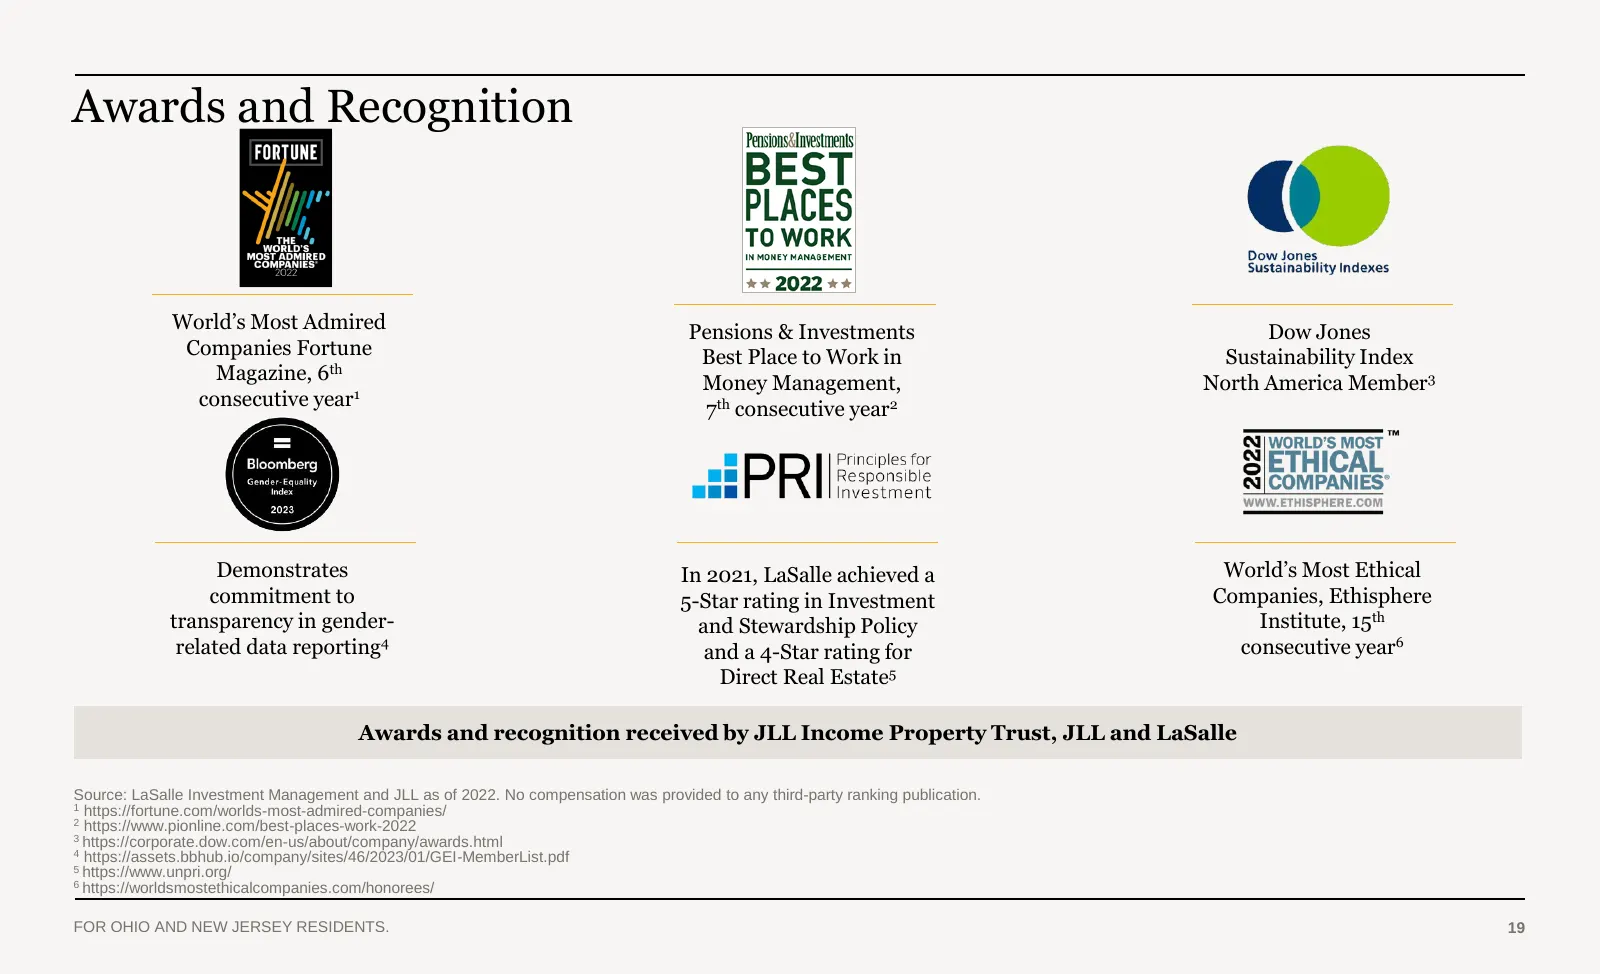
Awards and Recognition World’s Most Admired Pensions & Investments Dow Jones Companies Fortune Best Place to Work in Sustainability Index Magazine, 6th Money Management, North America Member3 consecutive year1 7th consecutive year2 Demonstrates In 2021, LaSalle achieved a World’s Most Ethical commit
Slide 20: Investment Performance
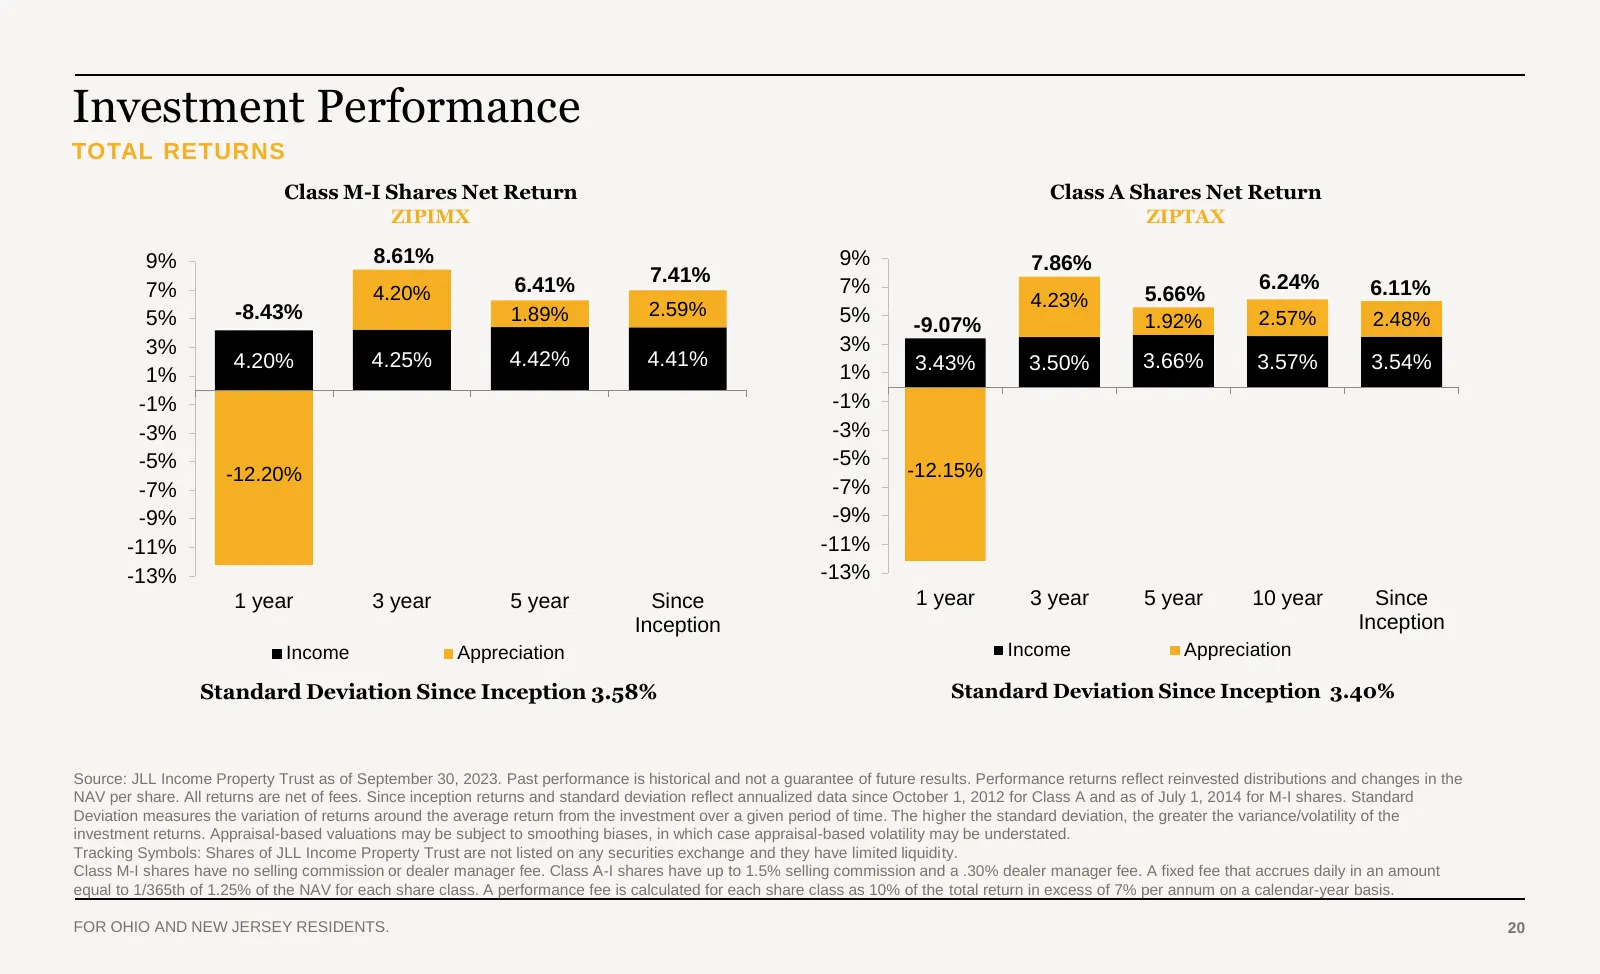
Investment Performance TOTAL RETURNS Class M-I Shares Net Return Class A Shares Net Return ZIPIMX ZIPTAX 9% 8.61% 9% 7.86% 6.41% 7.41% 6.24% 7% 4.20% 7% 5.66% 6.11% 2.59% 4.23% 5% -8.43% 1.89% 5% 1.92% 2.57% 2.48% -9.07% 3% 3% 4.20% 4.25% 4.42% 4.41% 3.43% 3.50% 3.66% 3.57% 3.54% 1% 1% -1% -1% -3% -
Slide 21: Distribution per Share (Quarterly)
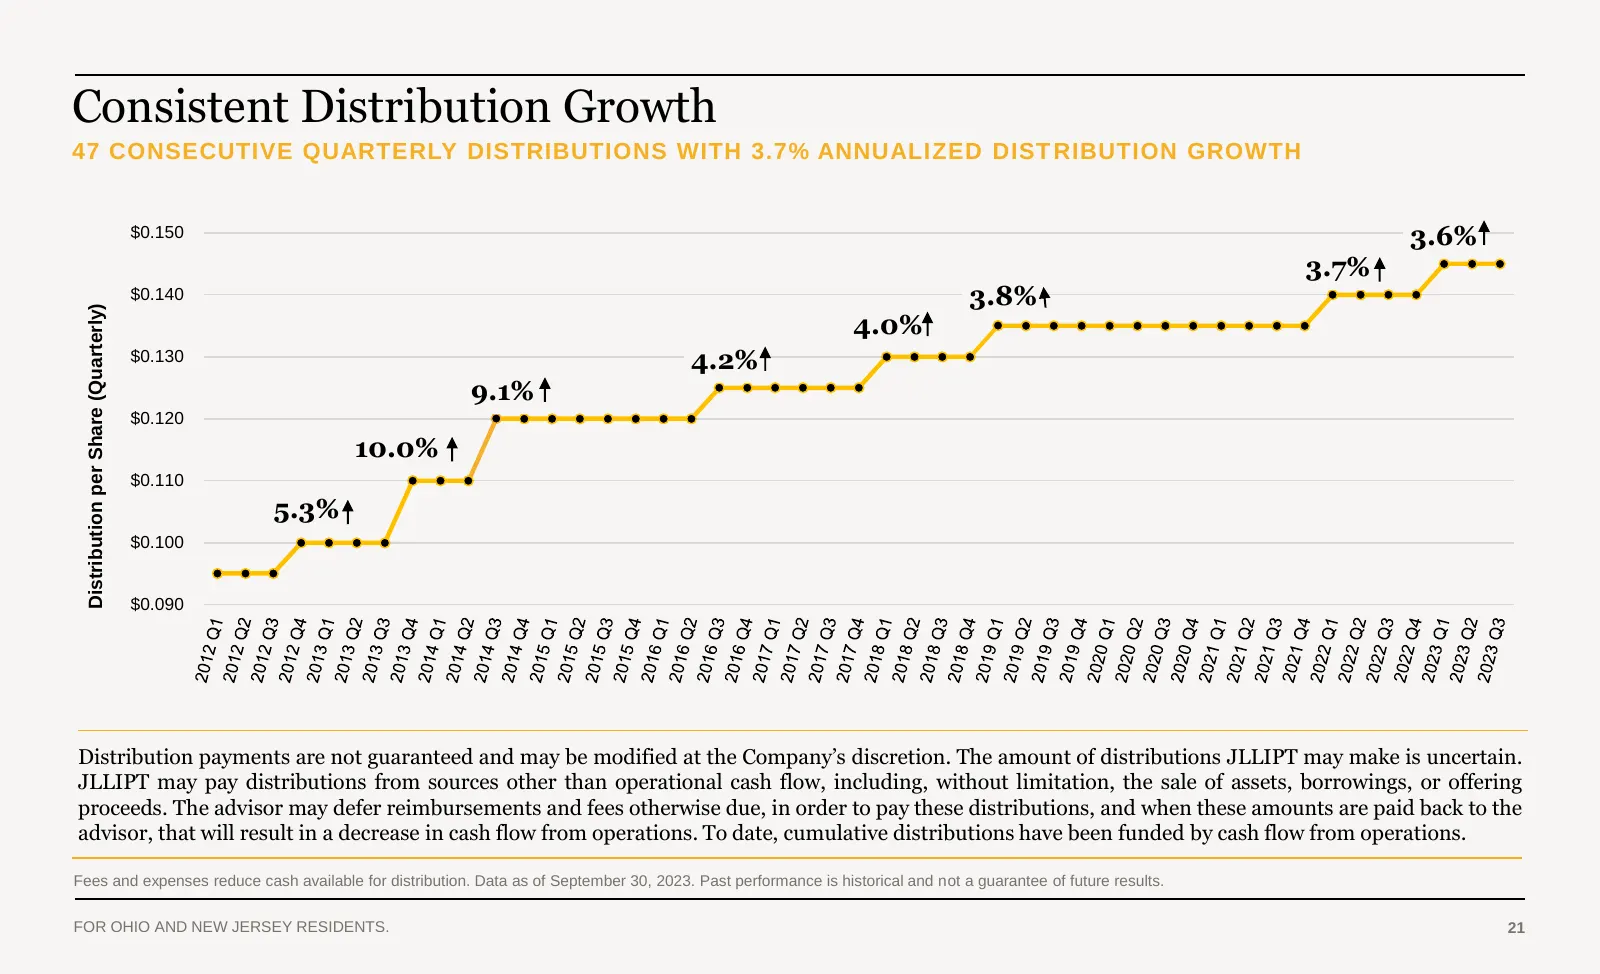
Consistent Distribution Growth 47 CONSECUTIVE QUARTERLY DISTRIBUTIONS WITH 3.7% ANNUALIZED DIST RIBUTION GROWTH $0.150 3.6% 3.7% $0.140 3.8% Distribution per Share (Quarterly) 4.0% $0.130 4.2% 9.1% $0.120 10.0% $0.110 5.3% $0.100 $0.090 Distribution payments are not guaranteed and may be modified at
Slide 22: Key Differentiators
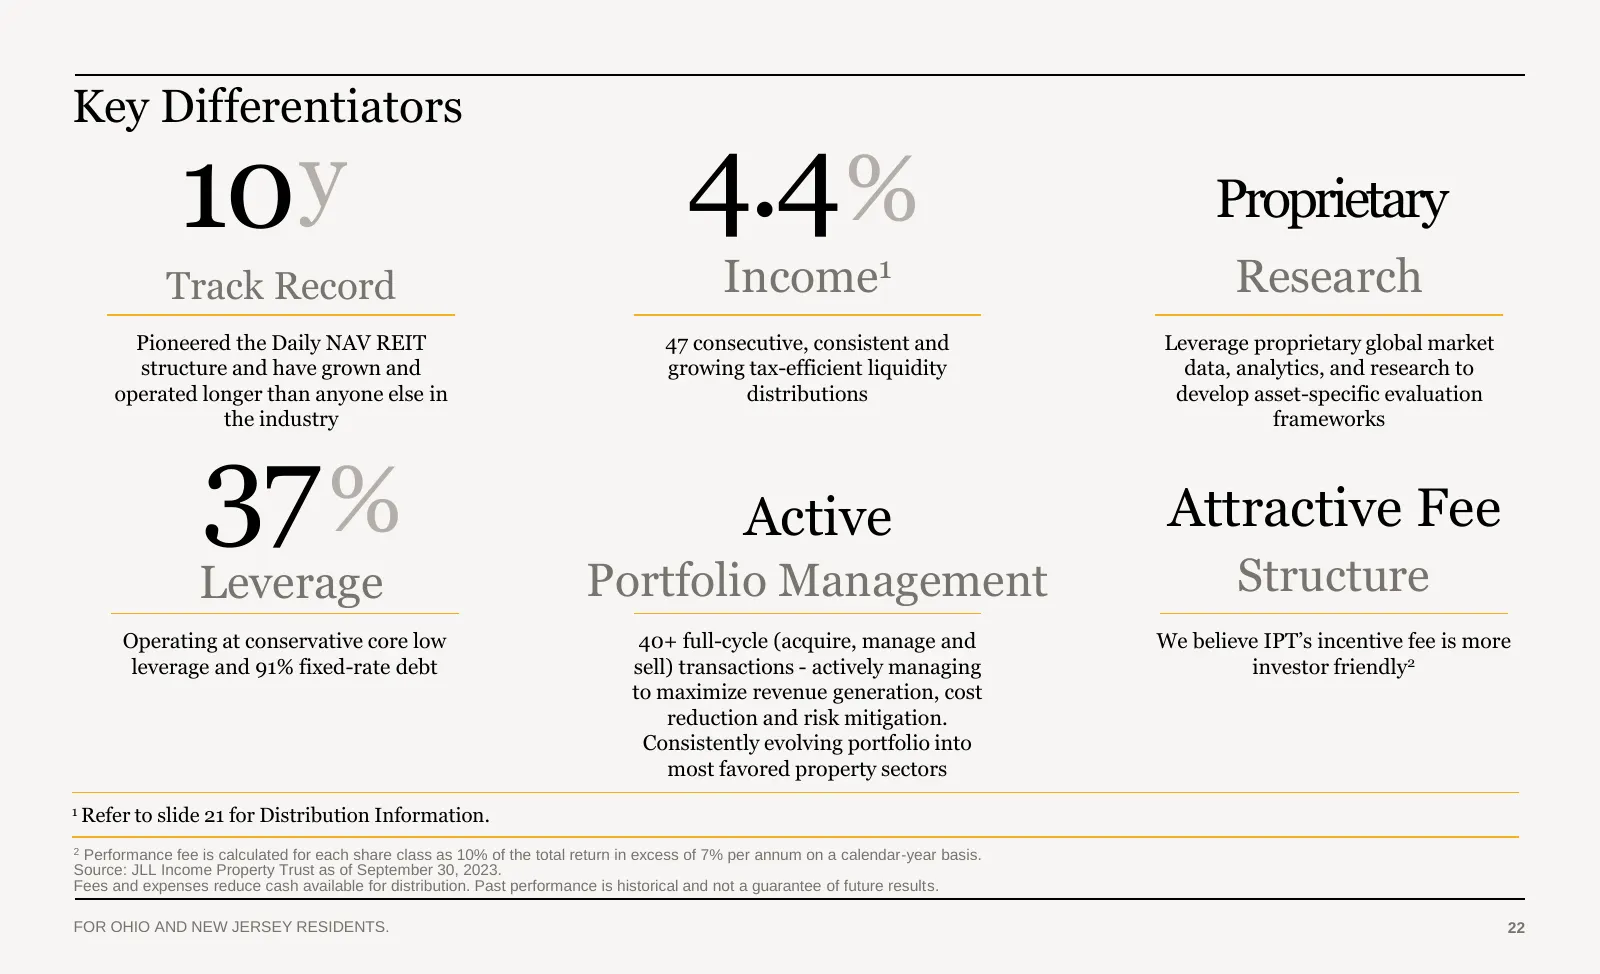
Key Differentiators 10y 4.4% Proprietary Track Record Income1 Research Pioneered the Daily NAV REIT 47 consecutive, consistent and Leverage proprietary global market structure and have grown and growing tax-efficient liquidity data, analytics, and research to operated longer than anyone else in dist
Slide 23: Appendix
Appendix Section 1 JLL Platform Section 2 Core Real Estate Section 3 Portfolio Overview Section 4 Appendix Note: Property shown on this slide is included in the JLL Income Property Trust portfolio. FOR OHIO AND NEW JERSEY RESIDENTS.
Slide 24: Rigorous and Independent Valuation Process
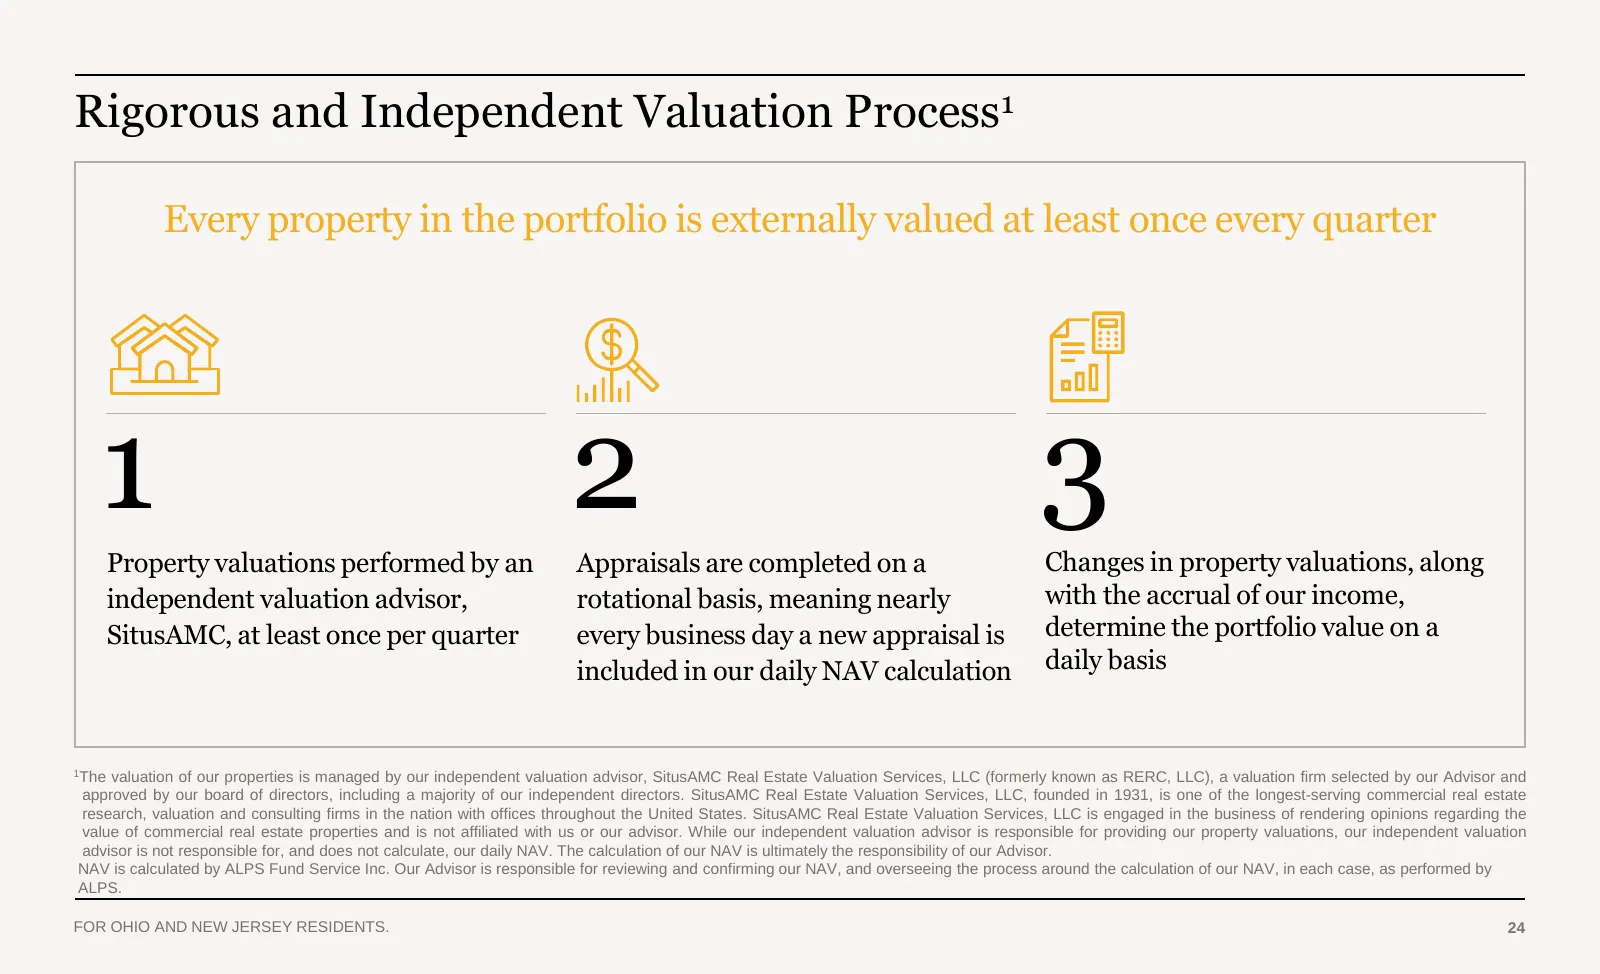
Rigorous and Independent Valuation Process1 Every property in the portfolio is externally valued at least once every quarter 1Property valuations performed by an 2Appraisals are completed on a 3 Changes in property valuations, along independent valuation advisor, rotational basis, meaning nearly wit
Slide 25: Change in NAV
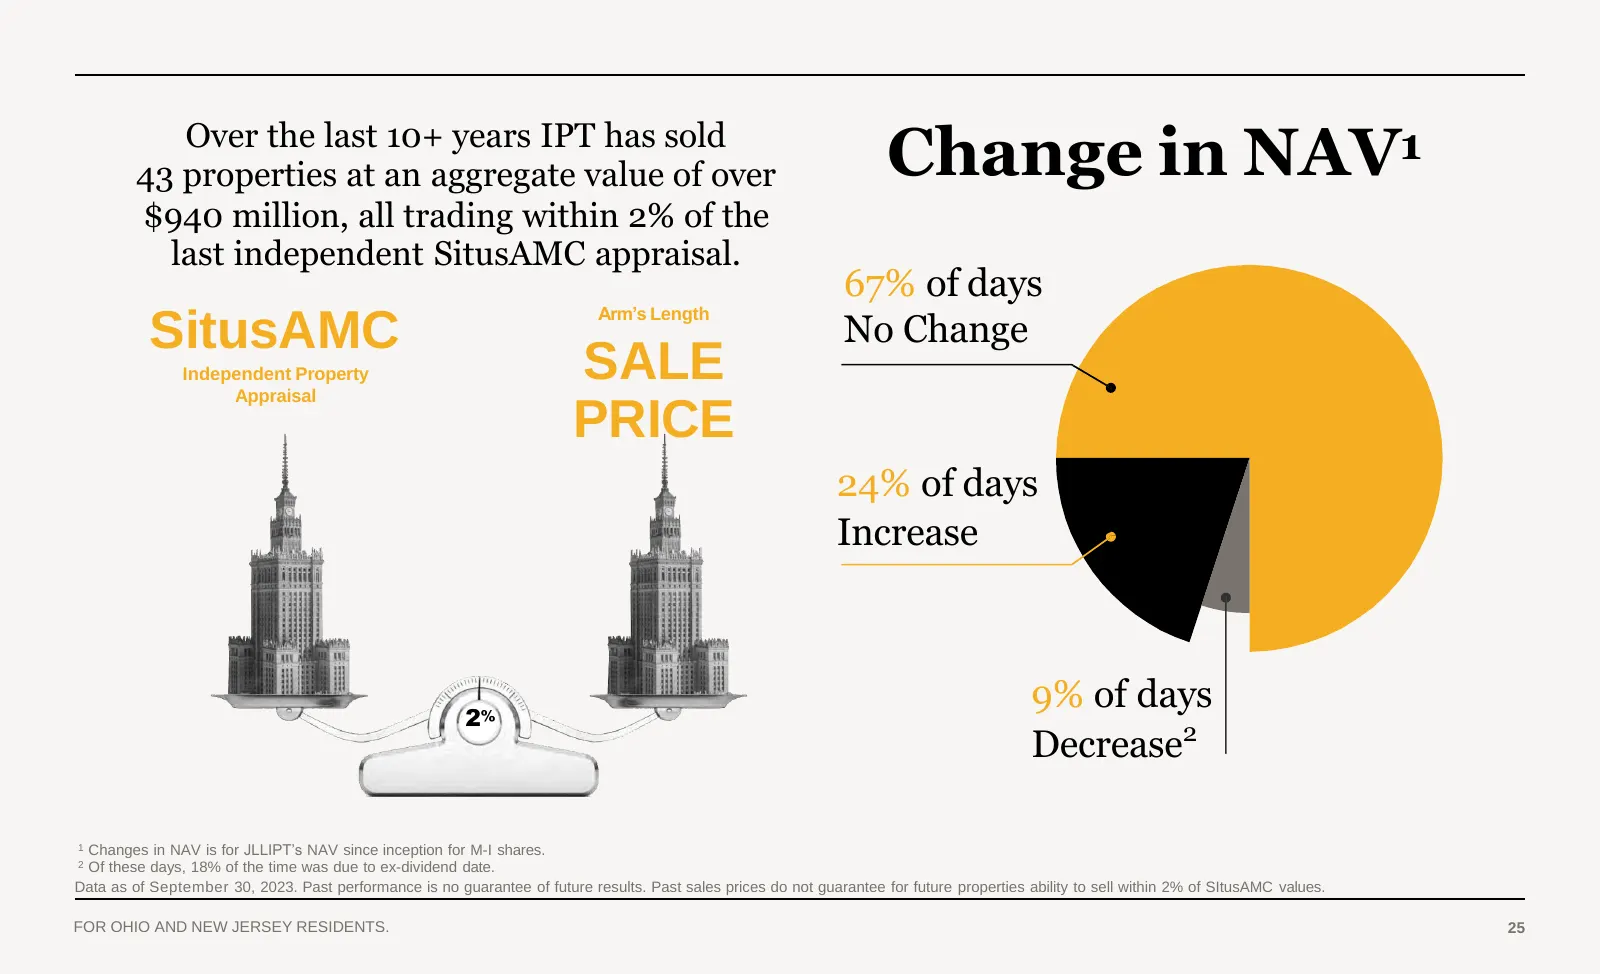
Over the last 10+ years IPT has sold 43 properties at an aggregate value of over Change in NAV1 $940 million, all trading within 2% of the last independent SitusAMC appraisal. 67% of days Arm’s Length SitusAMC No Change Independent Property Appraisal SALE PRICE 24% of days Increase 9% of days 2% Dec
Slide 26: Summary of Offering
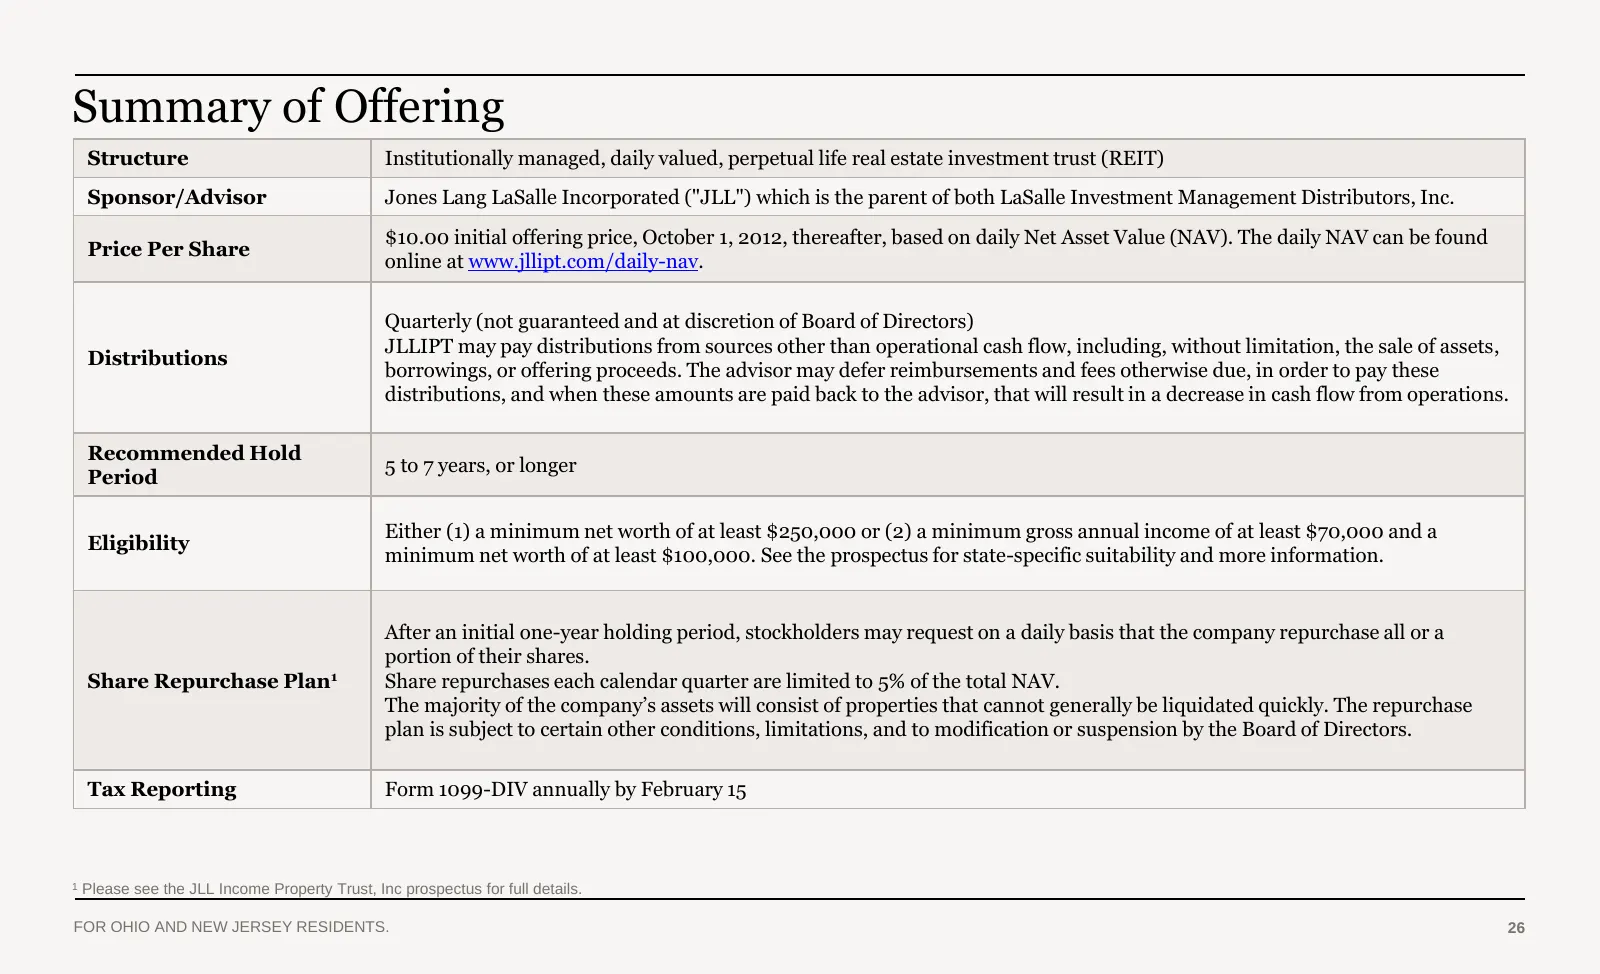
Summary of Offering Structure Institutionally managed, daily valued, perpetual life real estate investment trust (REIT) Sponsor/Advisor Jones Lang LaSalle Incorporated ("JLL") which is the parent of both LaSalle Investment Management Distributors, Inc. $10.00 initial offering price, October 1, 2012,
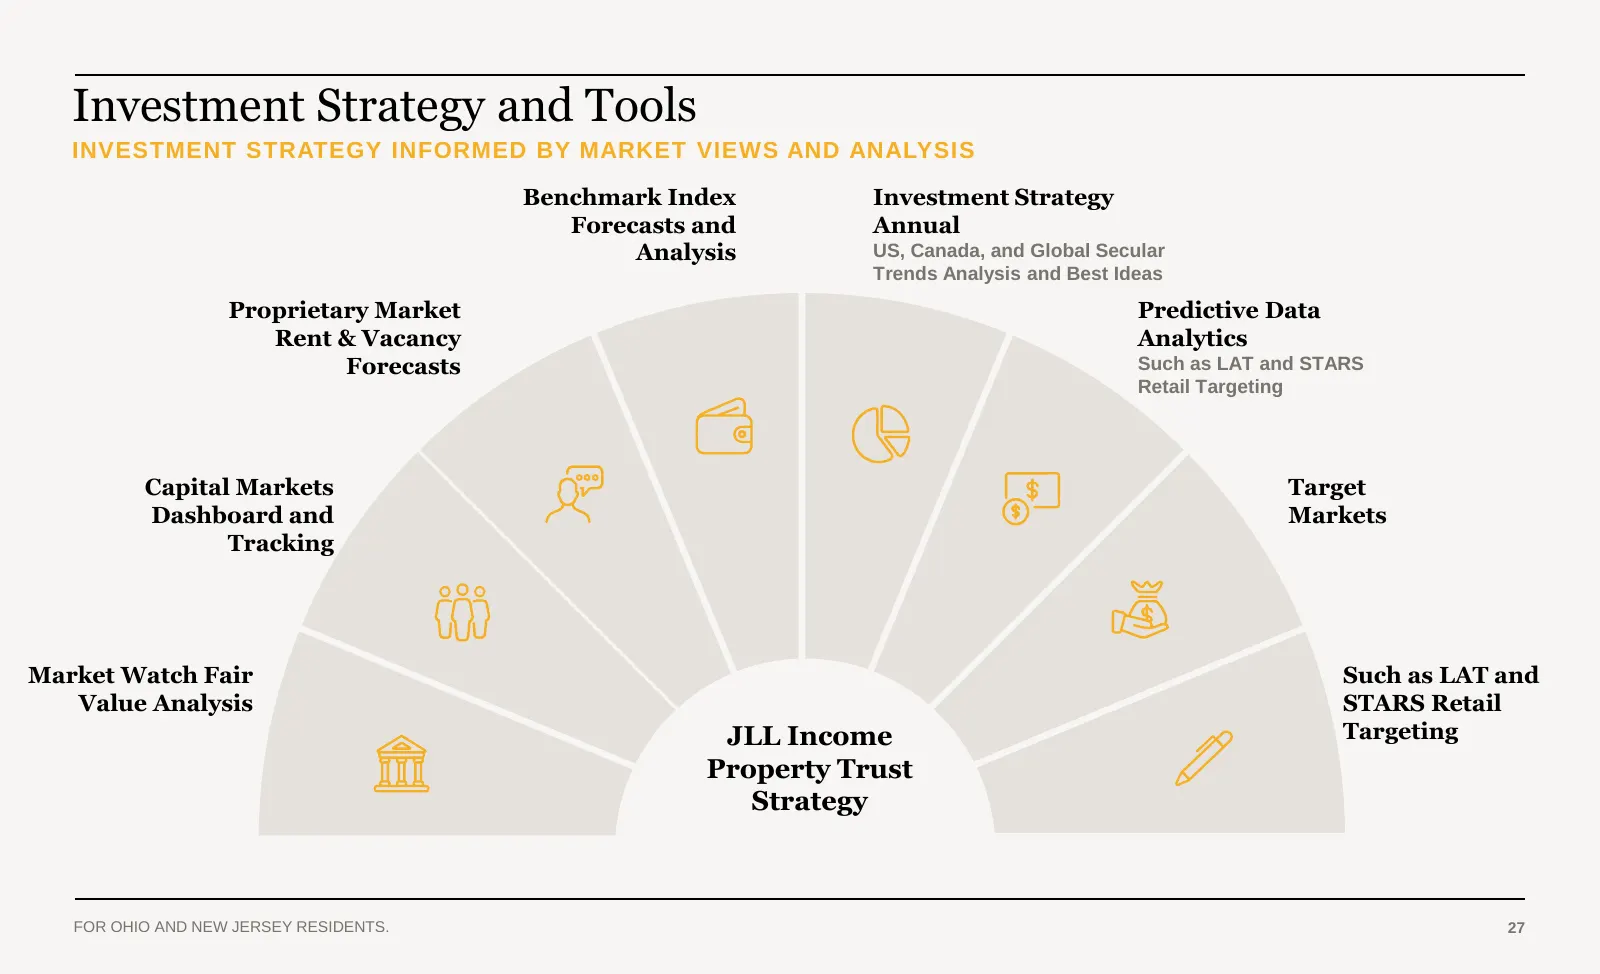
Slide 27: Investment Strategy and Tools
Investment Strategy and Tools INVESTMENT STRATEGY INFORMED BY MARKET VIEWS AND ANALYSIS Benchmark Index Investment Strategy Forecasts and Annual Analysis US, Canada, and Global Secular Trends Analysis and Best Ideas Proprietary Market Predictive Data Rent & Vacancy Analytics Forecasts Such as LAT an
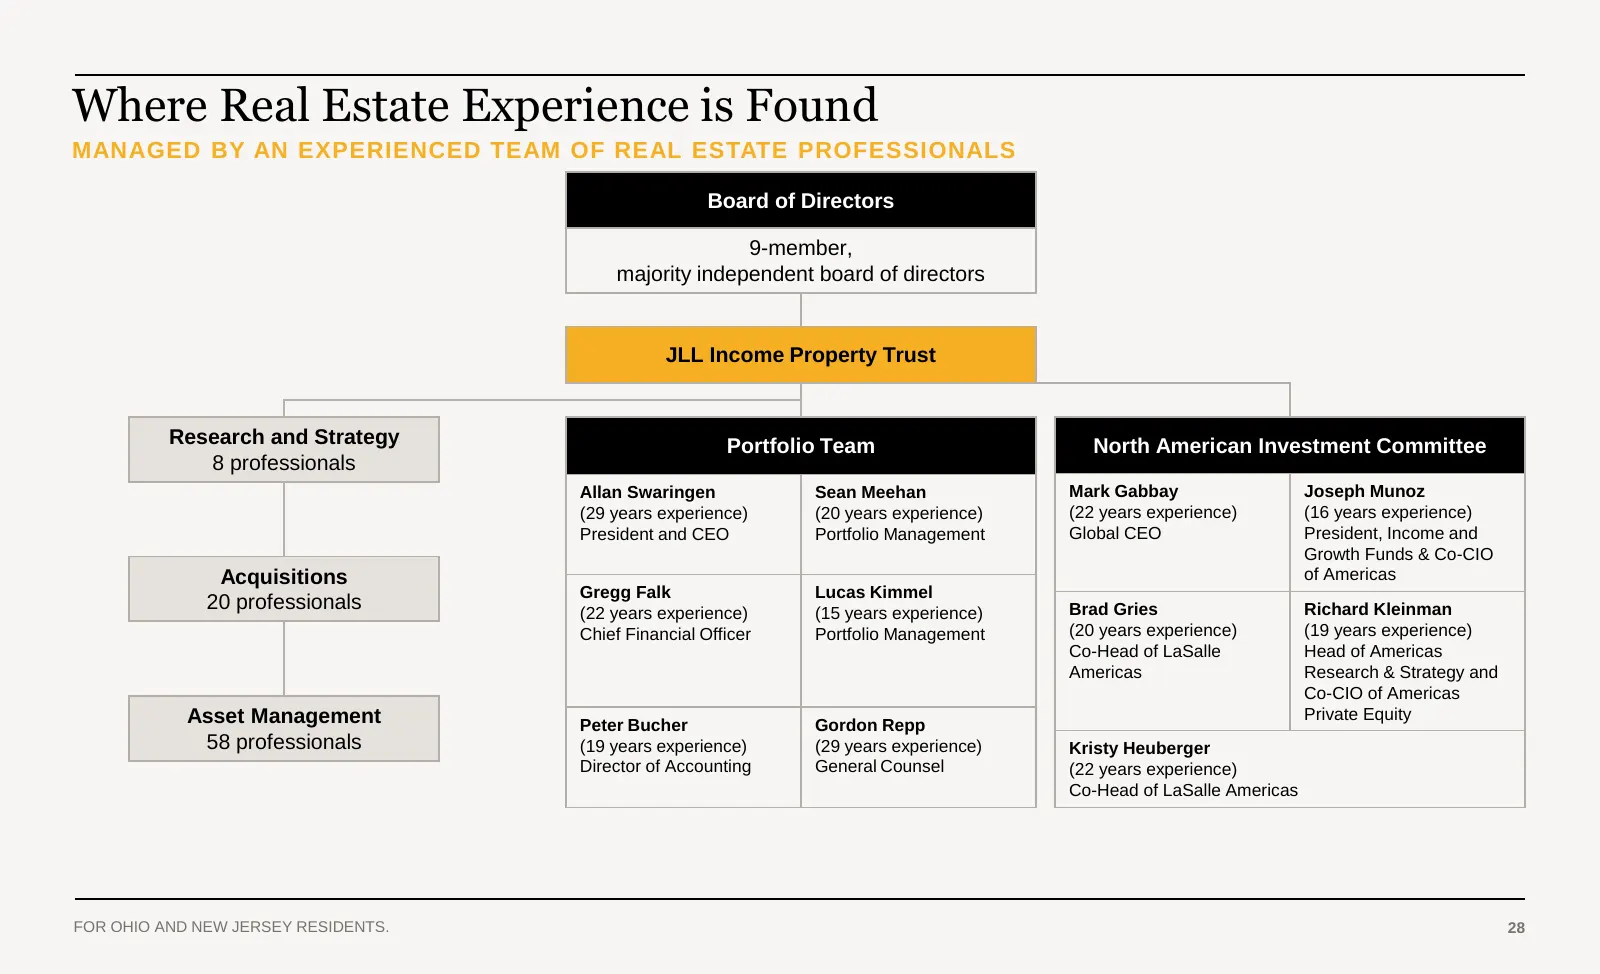
Slide 28: Where Real Estate Experience is Found
Where Real Estate Experience is Found MANAGED BY AN EXPERIENCED TEAM OF REAL ESTATE PROFESSIONALS Board of Directors 9-member, majority independent board of directors JLL Income Property Trust Research and Strategy Portfolio Team North American Investment Committee 8 professionals Allan Swaringen Se
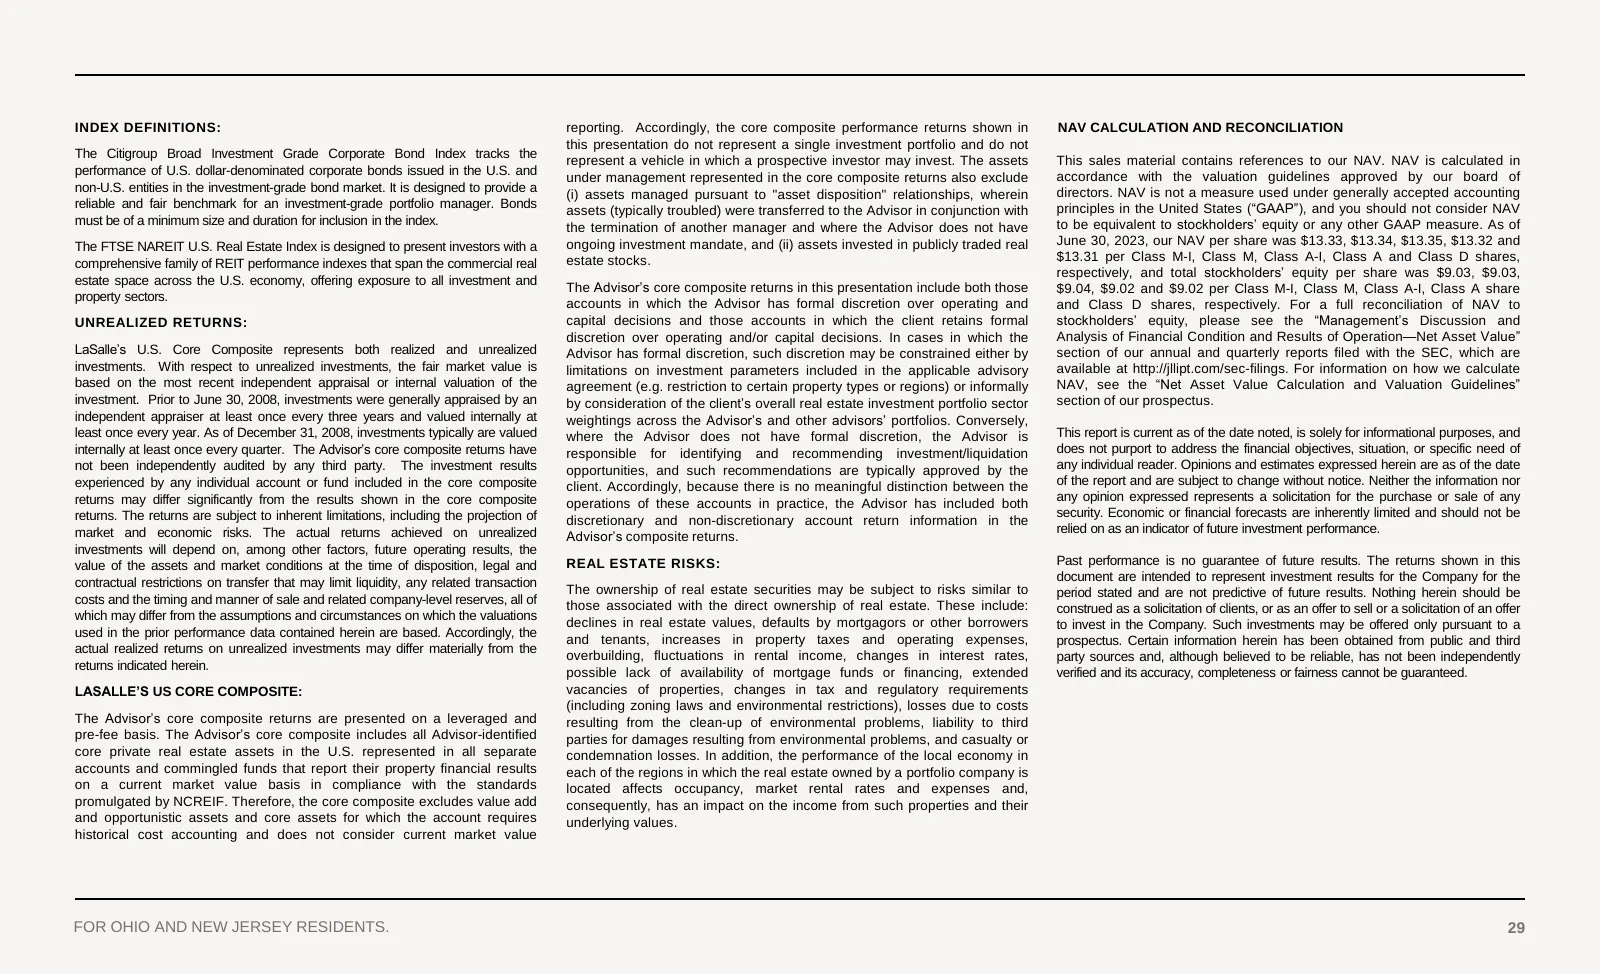
Slide 29: Index Definitions and NAV Calculation
INDEX DEFINITIONS: reporting. Accordingly, the core composite performance returns shown in NAV CALCULATION AND RECONCILIATION this presentation do not represent a single investment portfolio and do not The Citigroup Broad Investment Grade Corporate Bond Index tracks the represent a vehicle in which
Source: Internet Archive copy of s3.us-east-1.amazonaws.com
More decks from Jones Lang LaSalle Income Property Trust, Inc.
 Q2 2025 Earnings Presentation30 slides · August 2025
 Investor Presentation (August 2025)34 slides · August 2025
 Investor Presentation (April 2024)34 slides · April 2024
 Investor Presentation (April 2024)29 slides · April 2024
 Investor Presentation (January 2024)34 slides · January 2024
 Investor Presentation (October 2023)34 slides · October 2023