PDC Energy — Petroleum Development — C.K. Cooper & Company 3rd Annual Small-Cap Oil & Gas Conference (February 2007)
10 slides from PDC Energy's conference presentation, Feb 20, 2007
Slide 1: C.K. Cooper & Company 3rd Annual Small-Cap Oil & Gas Conference
C.K. Cooper & Company 3rd Annual Small-Cap Oil & Gas Conference Palm Desert, CA February 22 & 23, 2007 NASDAQ GSM:PETD
Slide 2: Presenters
Presenters Thomas Riley, P.E., President Rick McCullough, Chief Financial Officer and Treasurer This presentation contains predictions, estimates and other forward-looking statements within the meaning of Section 27A of the Securities Act of 1933 and Section 21E of the Securities Exchange Act of 193
Slide 3: Forward-Looking Statements
Forward-Looking Statements This information contains predictions, estimates and other forward-looking statements within the Contact Information: meaning of Section 27A of the Securities Act of 1933 and Section 21E of the Securities Exchange Investor Relations Act of 1934. Although the Company believ
Slide 4: What we are going to talk about
What we are going to talk about History and Overview 2006 and 2007 Operating Overview 2007 Drilling, Production & Reserves 2006 and 2007 Financial Guidance This presentation contains predictions, estimates and other forward-looking statements within the meaning of Section 27A of the Securities Act o
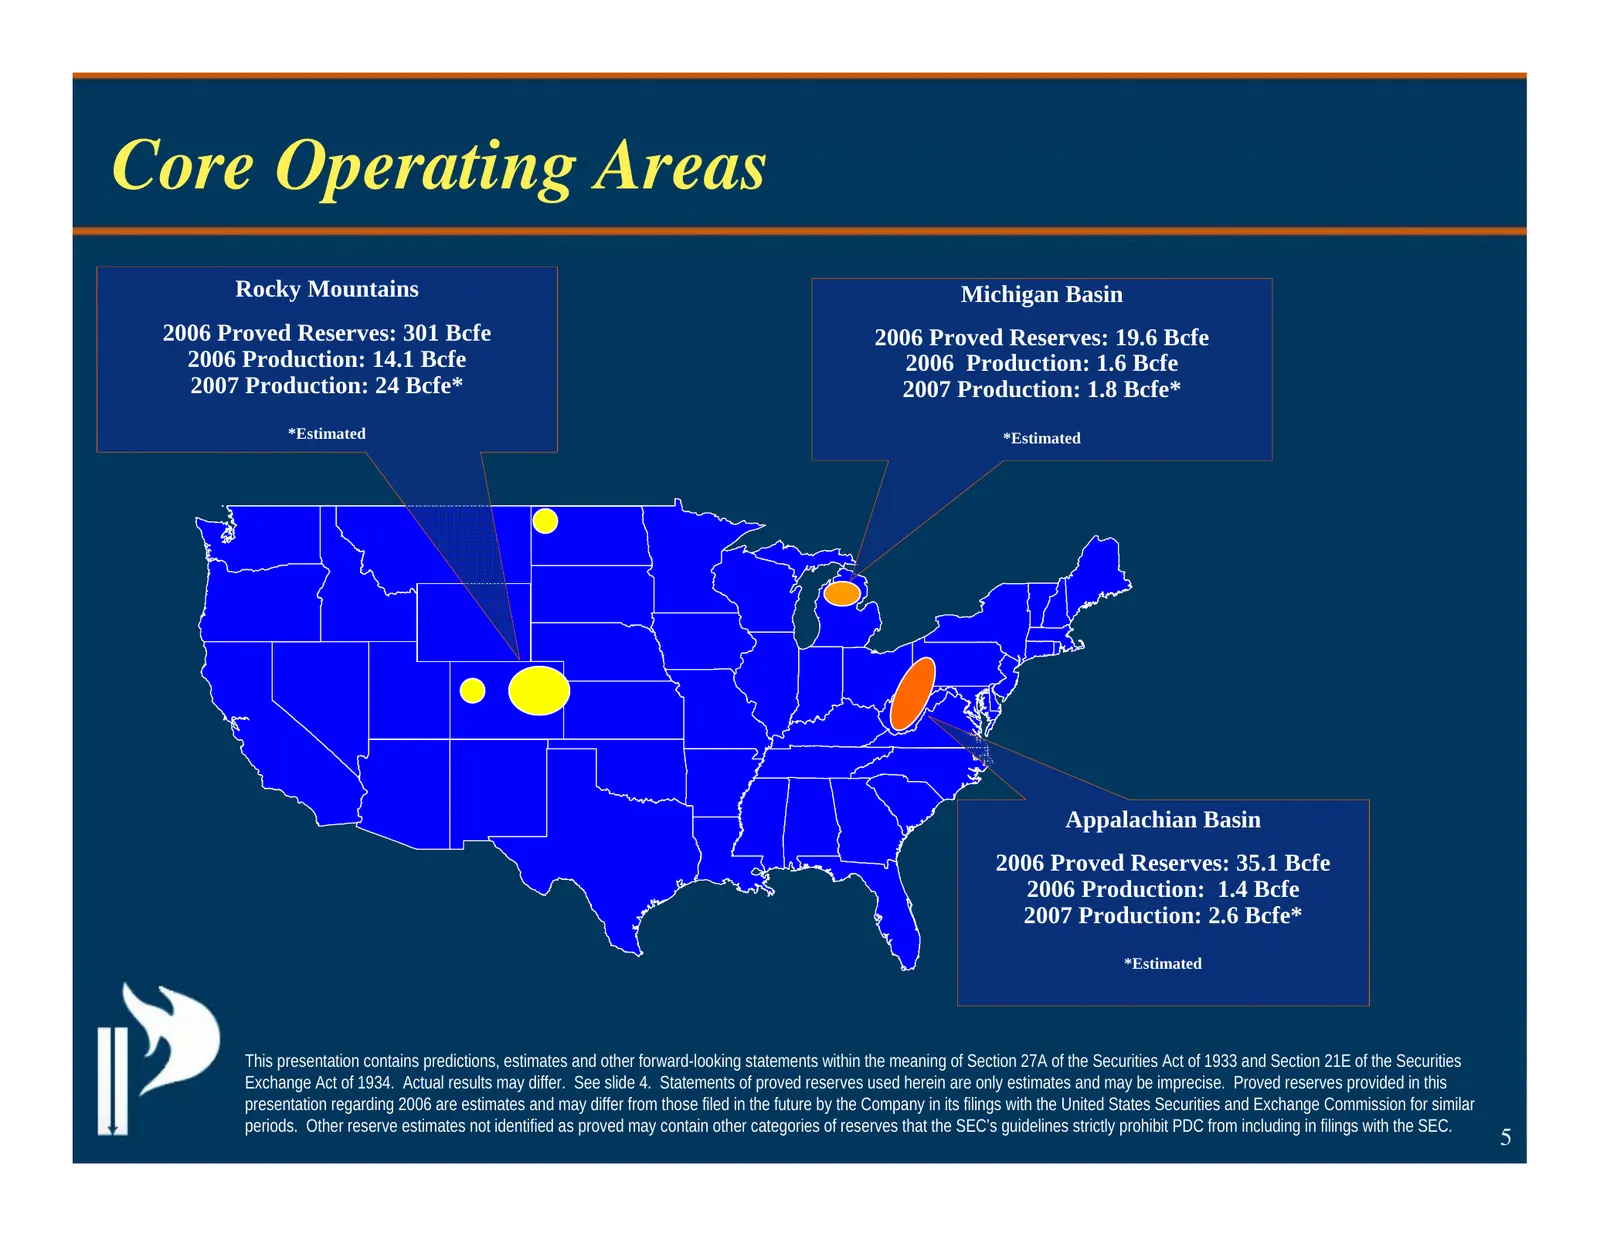
Slide 5: Core Operating Areas
Core Operating Areas Rocky Mountains Michigan Basin 2006 Proved Reserves: 301 Bcfe 2006 Proved Reserves: 19.6 Bcfe 2006 Production: 14.1 Bcfe 2006 Production: 1.6 Bcfe 2007 Production: 24 Bcfe* 2007 Production: 1.8 Bcfe* *Estimated *Estimated Appalachian Basin 2006 Proved Reserves: 35.1 Bcfe 2006 Pr
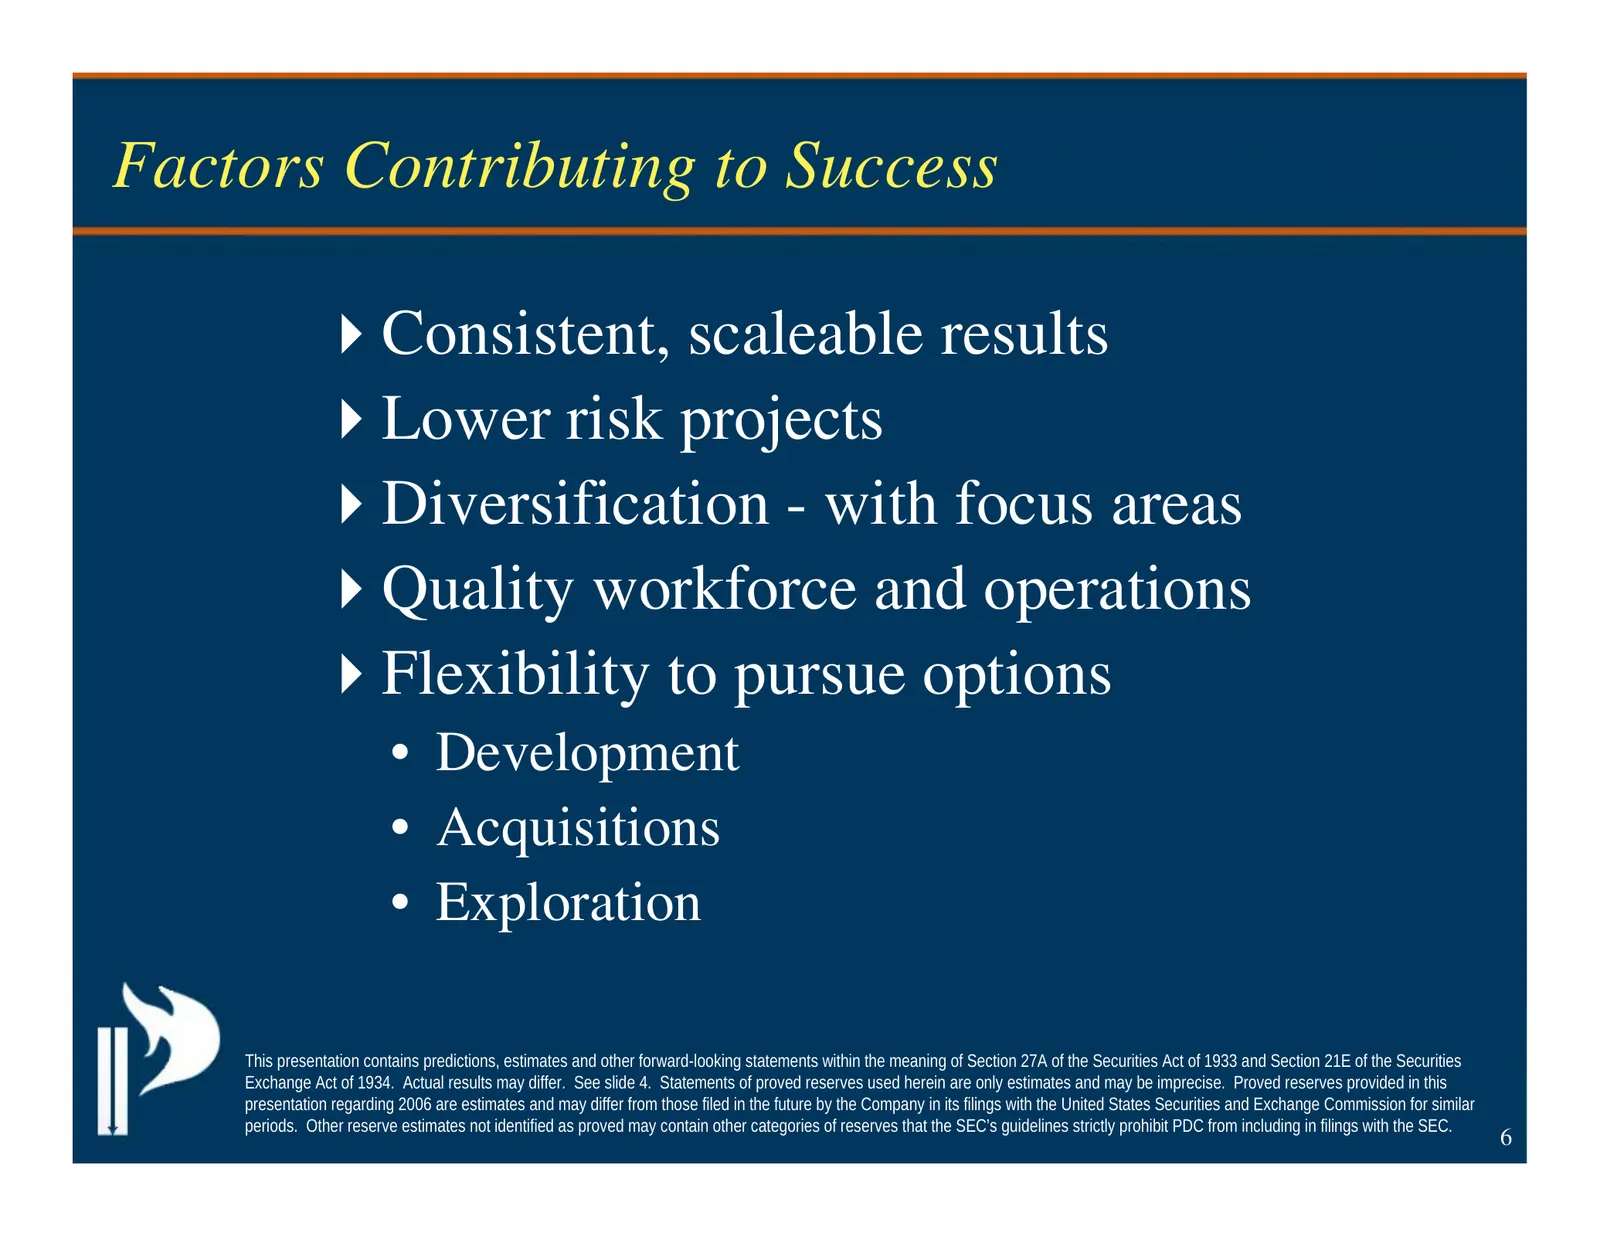
Slide 6: Factors Contributing to Success
Factors Contributing to Success Consistent, scaleable results Lower risk projects Diversification - with focus areas Quality workforce and operations Flexibility to pursue options • Development • Acquisitions • Exploration This presentation contains predictions, estimates and other forward-looking s
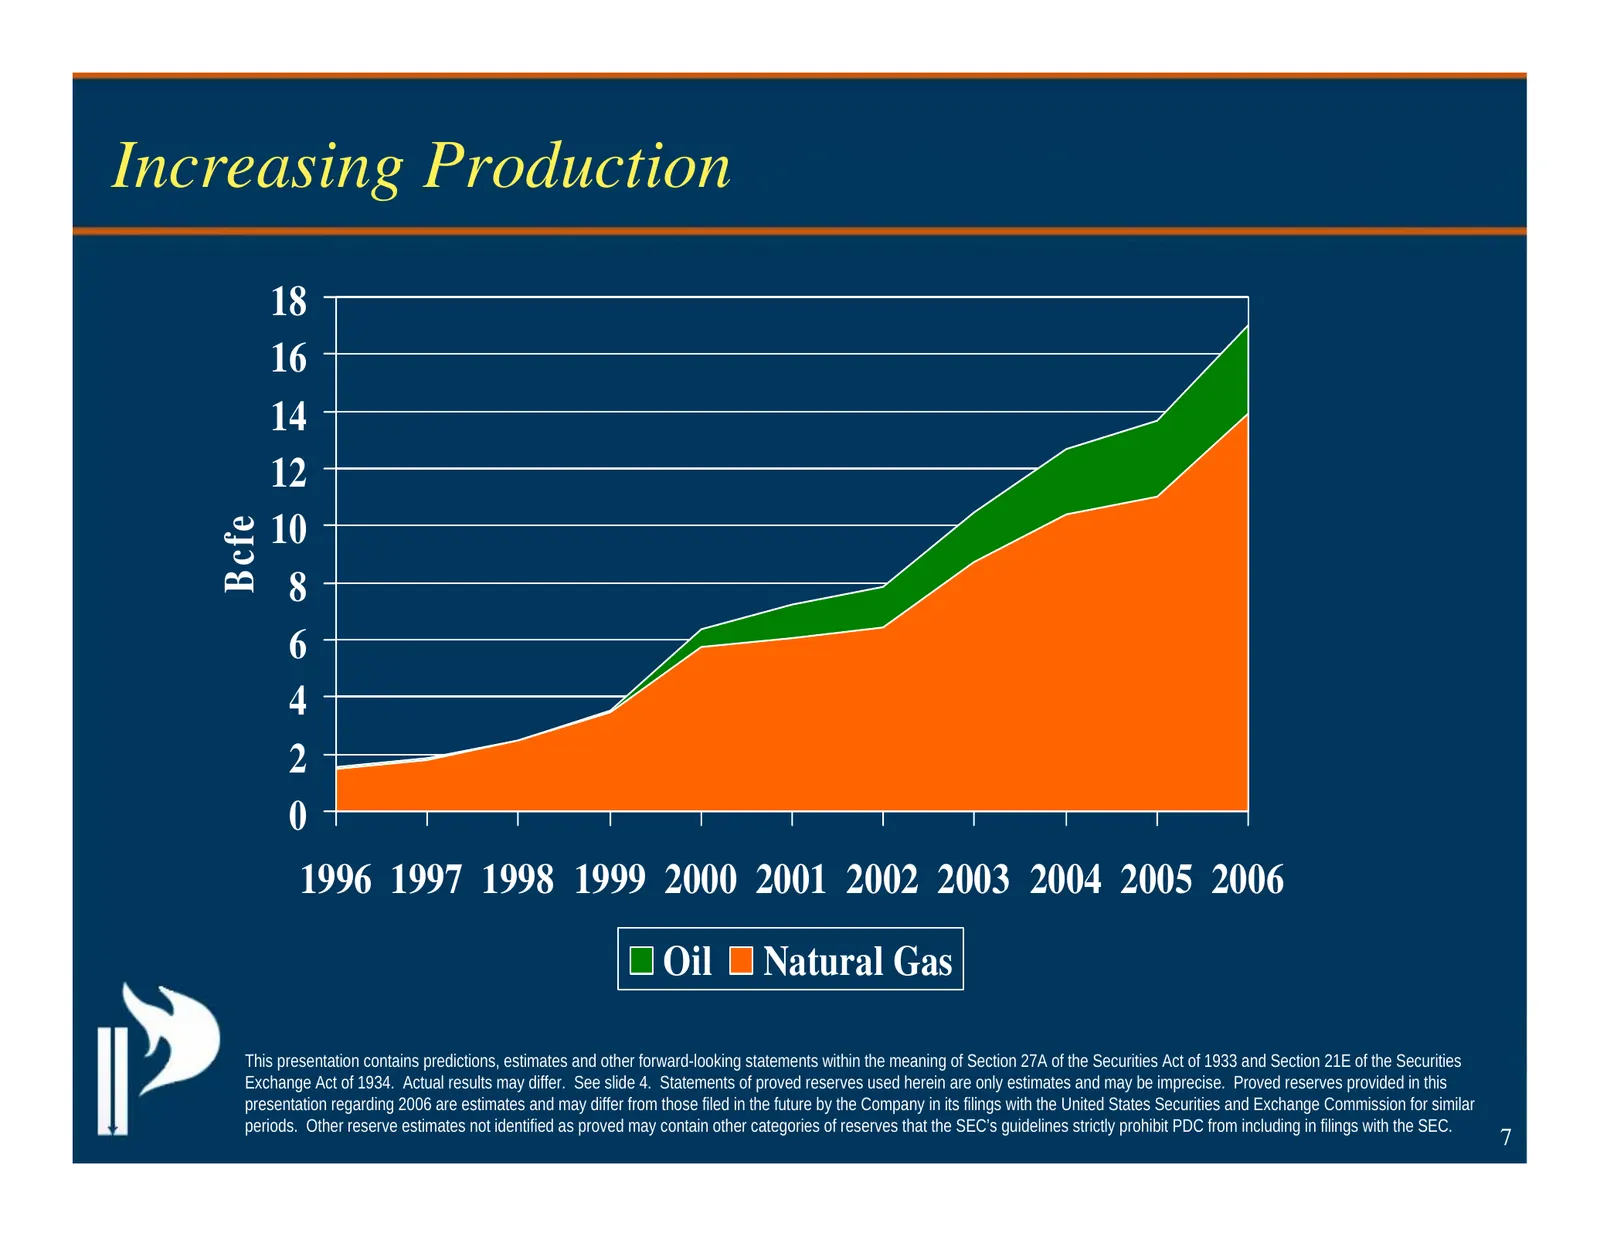
Slide 7: Increasing Production
Increasing Production 18 16 14 12 10 B cfe 8 6 4 2 0 1996 1997 1998 1999 2000 2001 2002 2003 2004 2005 2006 Oil Natural Gas This presentation contains predictions, estimates and other forward-looking statements within the meaning of Section 27A of the Securities Act of 1933 and Section 21E of the Se
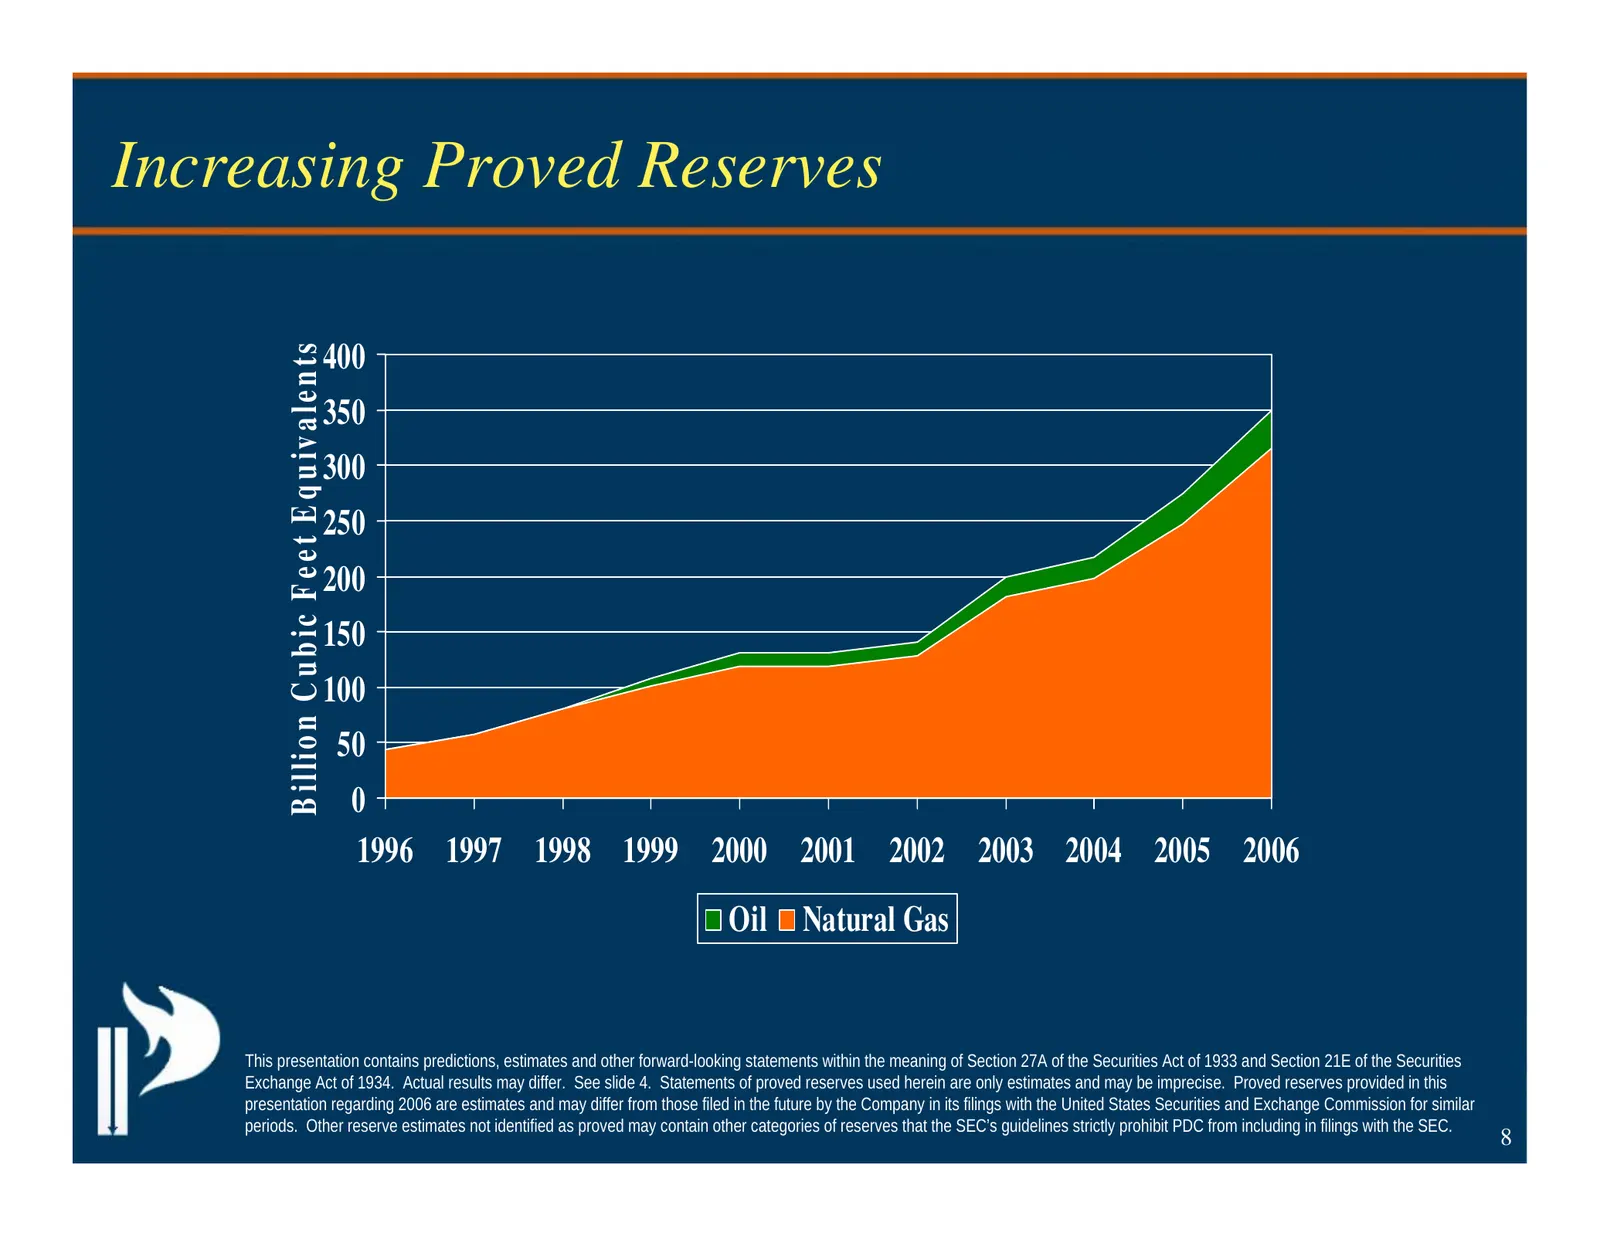
Slide 8: Increasing Proved Reserves
Increasing Proved Reserves 400 B illio n C u b ic F e e t E q u iv a le n ts 350 300 250 200 150 100 50 0 1996 1997 1998 1999 2000 2001 2002 2003 2004 2005 2006 Oil Natural Gas This presentation contains predictions, estimates and other forward-looking statements within the meaning of Section 27A of
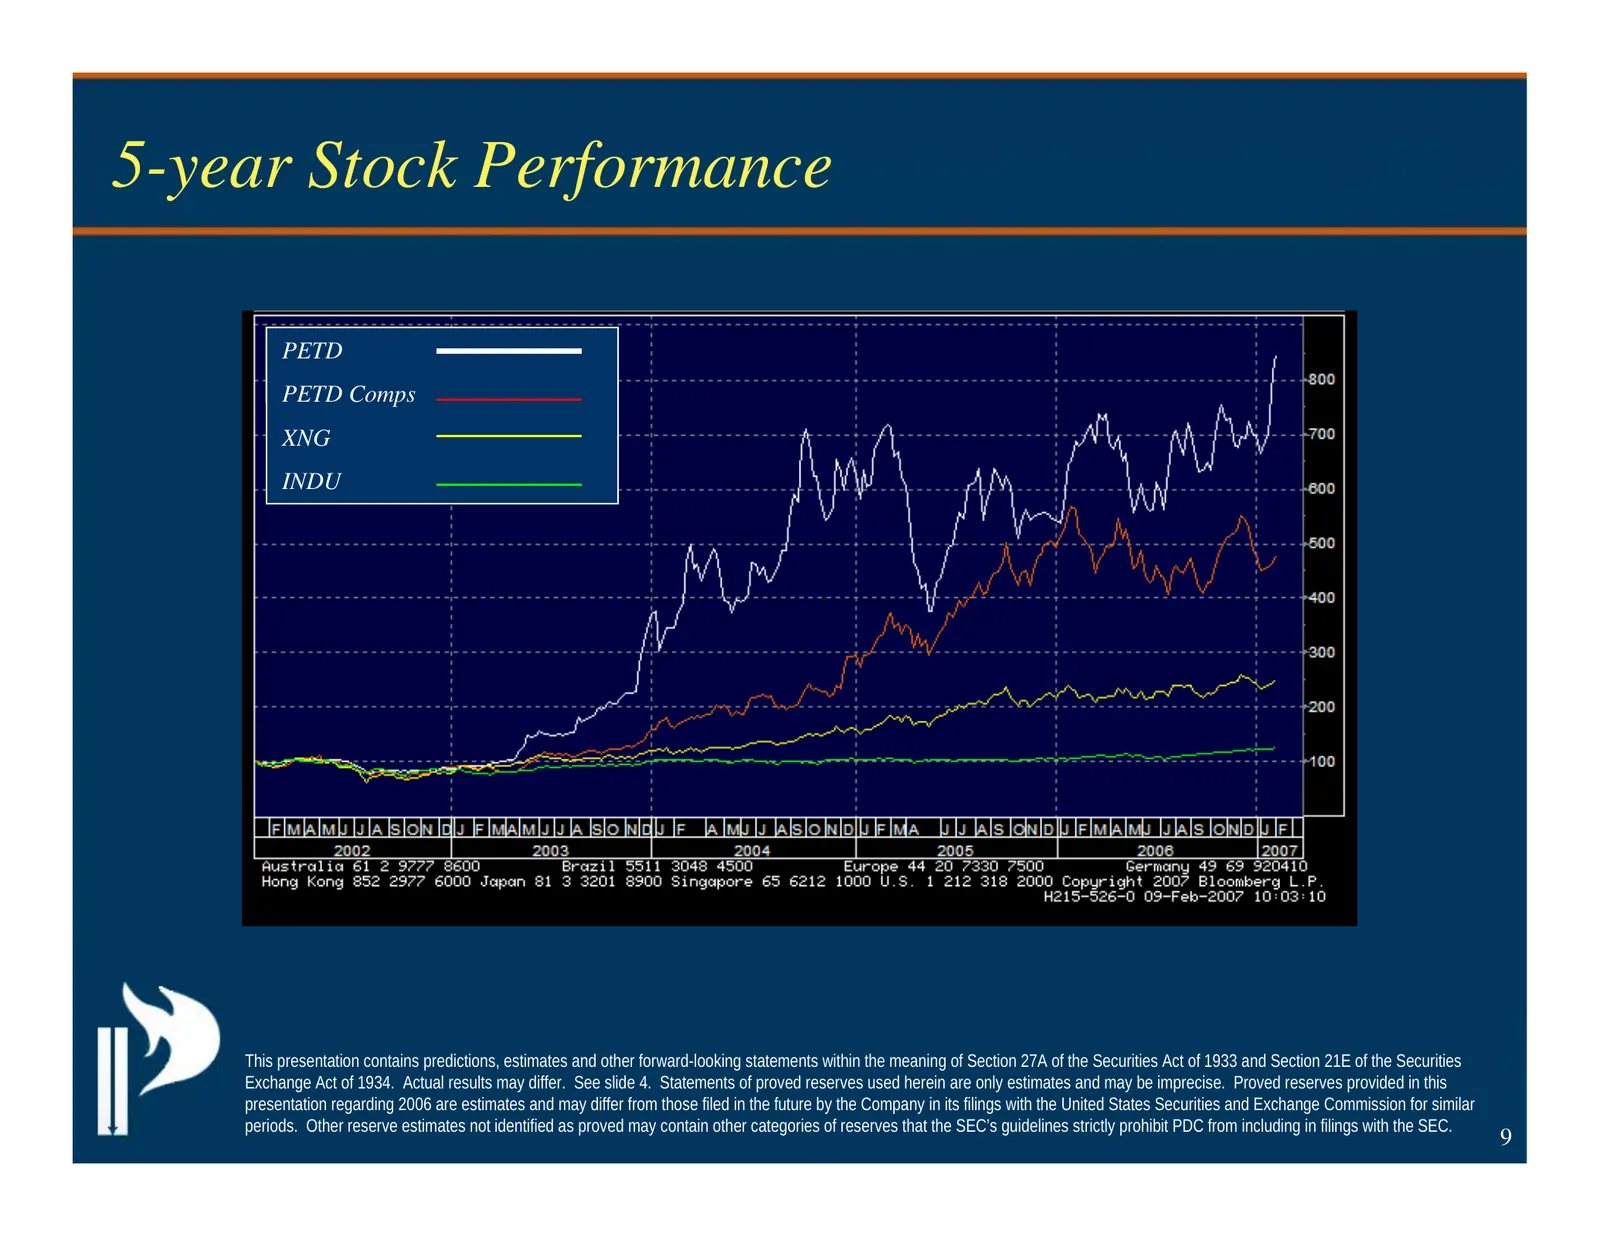
Slide 9: 5-year Stock Performance
5-year Stock Performance PETD PETD Comps XNG INDU This presentation contains predictions, estimates and other forward-looking statements within the meaning of Section 27A of the Securities Act of 1933 and Section 21E of the Securities Exchange Act of 1934. Actual results may differ. See slide 4. Sta
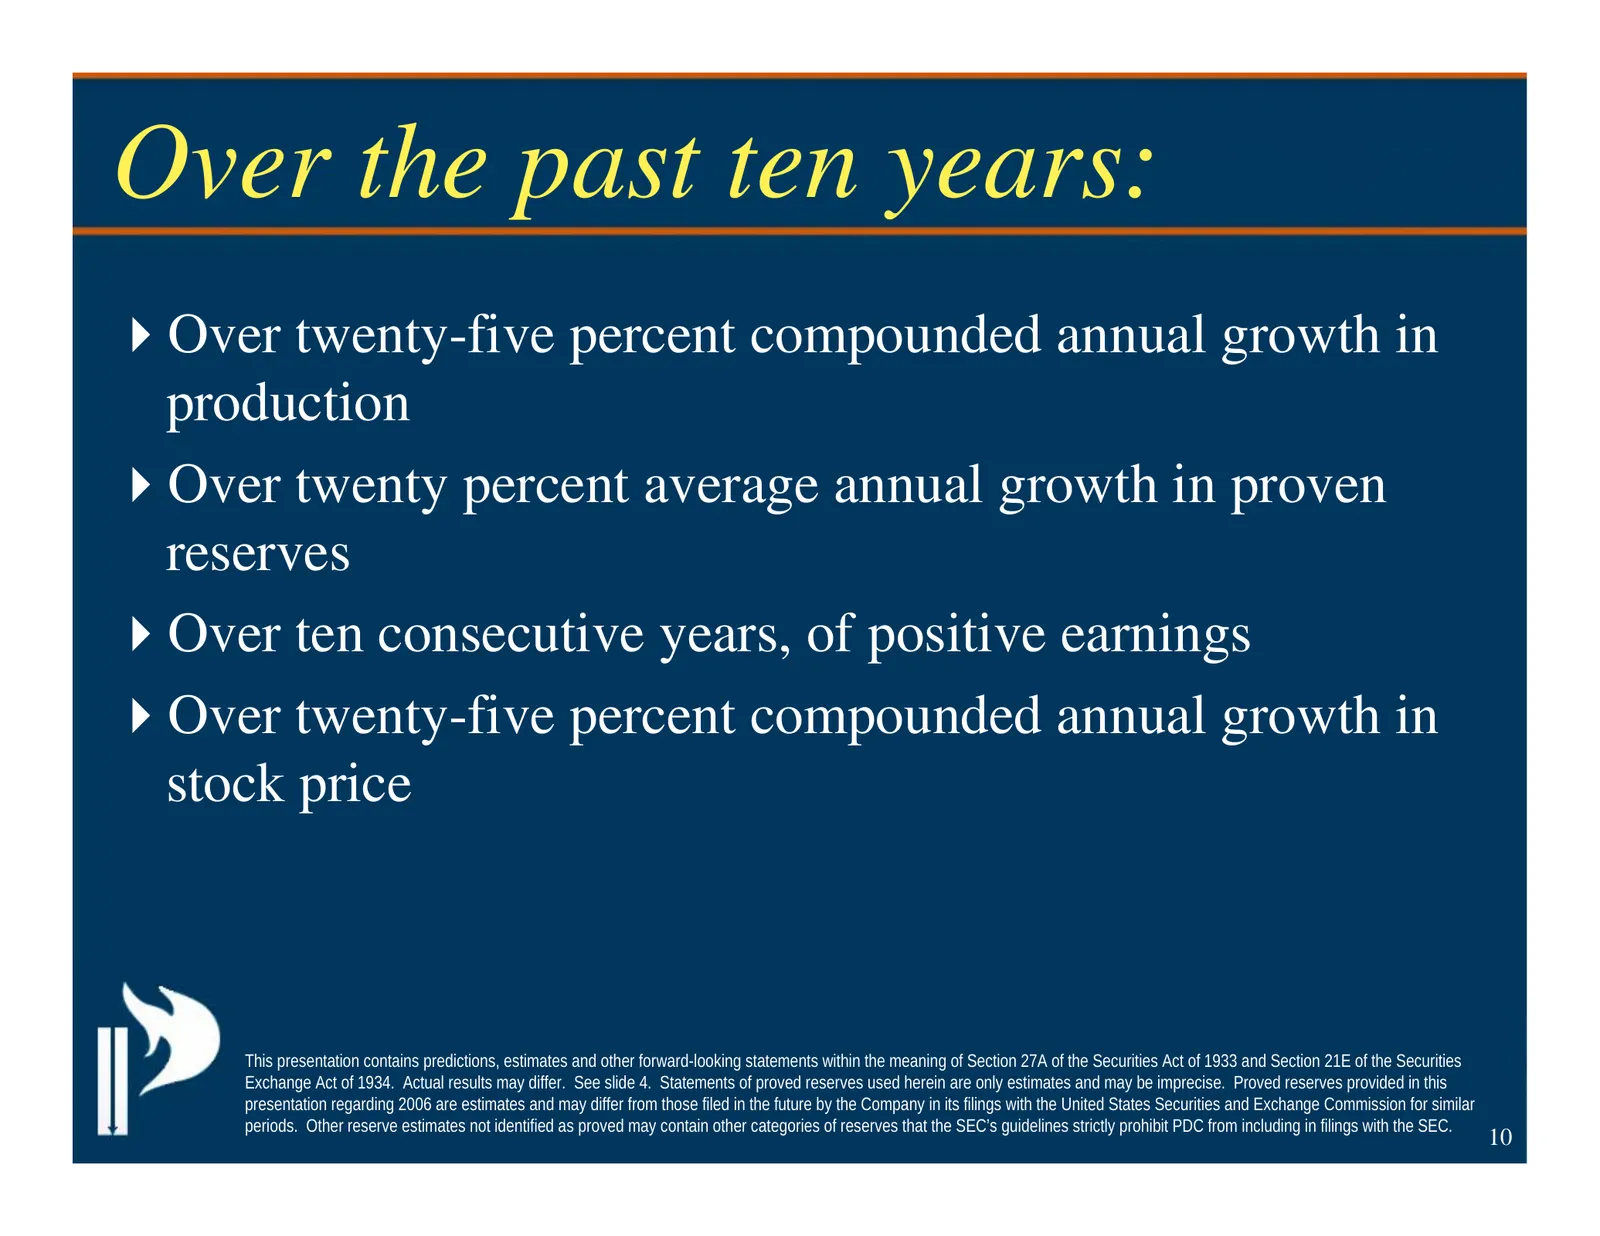
Slide 10: Over the past ten years:
Over the past ten years: Over twenty-five percent compounded annual growth in production Over twenty percent average annual growth in proven reserves Over ten consecutive years, of positive earnings Over twenty-five percent compounded annual growth in stock price This presentation contains predictio
Source: SEC EDGAR · 8-K filed Feb 20, 2007
More decks from PDC Energy Inc
 Merger or Acquisition (May 2023)9 slides · May 22, 2023
 Merger or Acquisition (August 2019)16 slides · Aug 26, 2019
 Proxy Contest (May 2019)60 slides · May 21, 2019
 Proxy Contest (May 2019)18 slides · May 15, 2019
 Proxy Contest (May 2019)17 slides · May 14, 2019
 Proxy Contest (May 2019)48 slides · May 8, 2019