McMoRan Exploration — Capital One Southcoast 6th Annual Energy Conference (December 2011)
18 slides from McMoRan Exploration's conference presentation, Dec 8, 2011
Slide 1: Capital One Southcoast 6th Annual Energy Conference
Exhibit 99.1 Capital One Southcoast th 6 Annual Energy Conference James R. Moffett Co-Chairman of the Board, President & CEO December 7, 2011
Slide 2: Cautionary Statement
Cautionary Statement This is an oral presentation which is accompanied by slides. Readers are urged to review our SEC filings. This presentation contains forward-looking statements that involve a number of assumptions, risks and uncertainties that could cause actual results to differ materially from
Slide 3: Highlights
Highlights Industry Leader in Ultra-Deep Exploration - Drilling Continues to De-risk Play & Open Up New Trend - 2011 Results Expanded Resource Potential of Trend - Identified 5 Hydrocarbon Bearing Geologic Sections Below the Salt Weld - 3 Wells Currently Drilling Advancing Davy Jones Development Act
Slide 4: 2011 Outlook Summary
2011 Outlook Summary (1) 2011 Production Estimate - Annual Average 187 MMcfe/d - 4Q11e – 170 MMcfe/d 2011 EBITDAX Estimate – $310 MM (2) 2011 Capital Expenditures Estimate – $500-550 MM - $300-350 MM in Exploration - $200 MM in Development - Spending to Continue to be Driven by Opportunities, Drilli
Slide 5: Ultra-Deep Accomplishments To-Date
Ultra-Deep Accomplishments To-Date Activities to Date Have De-risked Shallow Water, Ultra-Deep Shelf Play Proved Wells Can be Drilled/Evaluated Safely Below Salt Weld Confirmed Geologic Model in 5 Formations Below Salt Weld Proved High Quality Reservoirs with Large Structural Features Are Present Be
Slide 6: Ultra-Deep Data Points
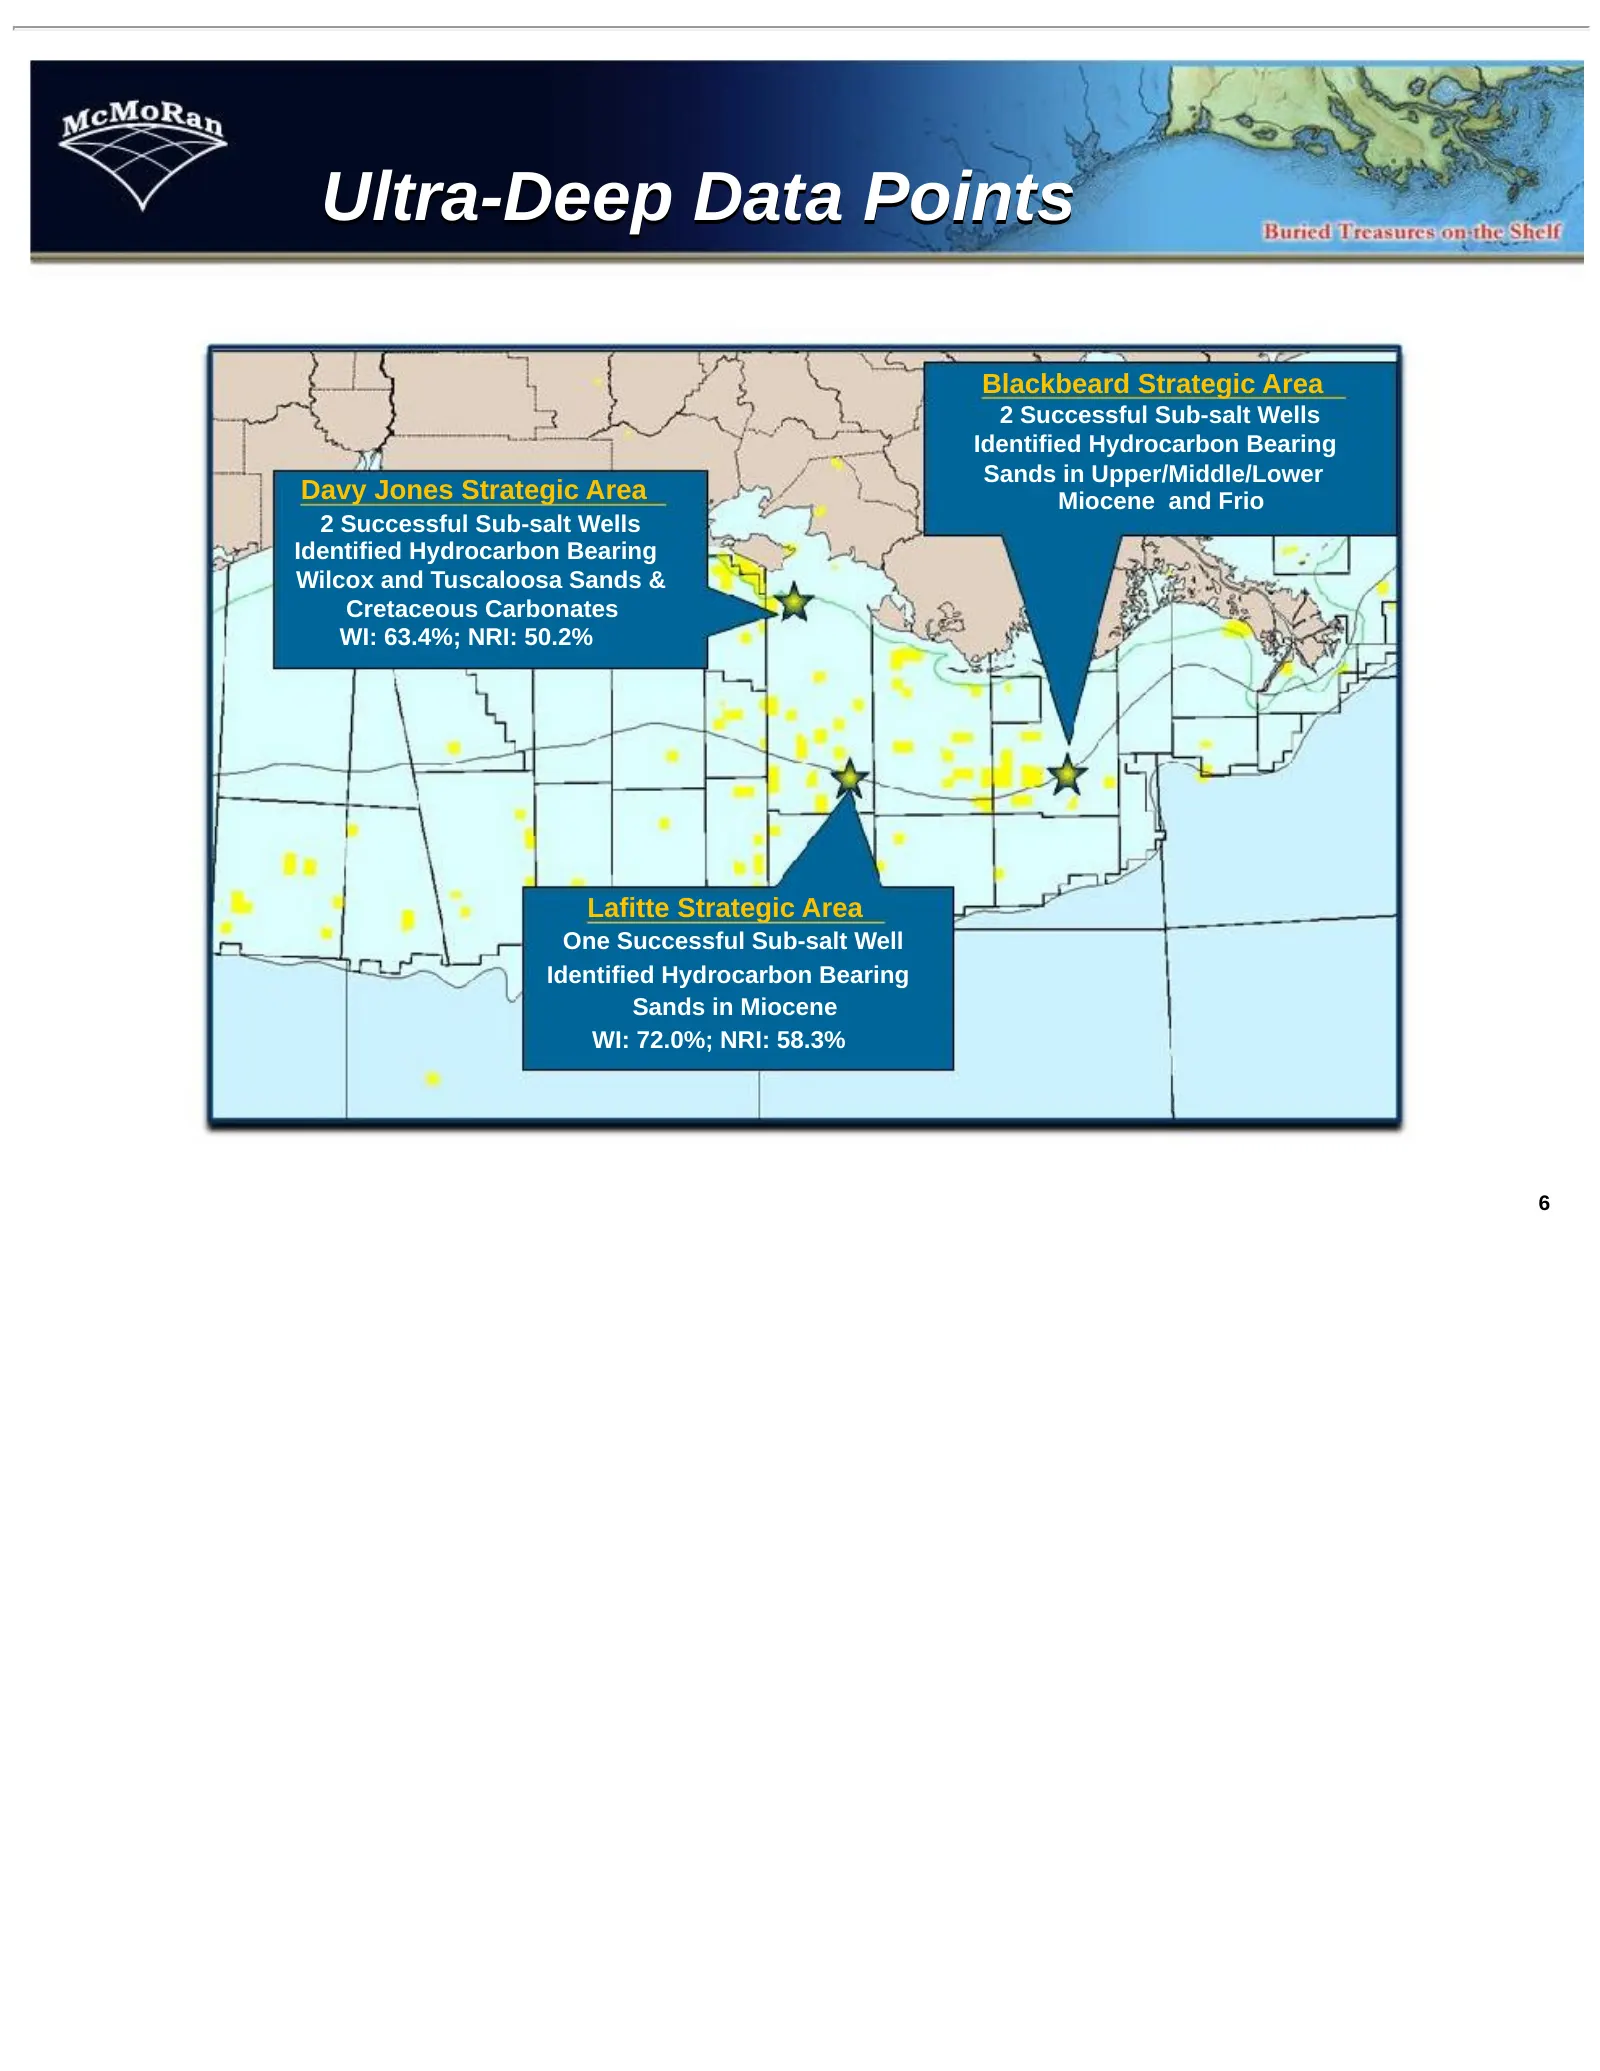
Ultra-Deep Data Points Blackbeard Strategic Area 2 Successful Sub-salt Wells Identified Hydrocarbon Bearing Sands in Upper/Middle/Lower Davy Jones Strategic Area Miocene and Frio 2 Successful Sub-salt Wells Identified Hydrocarbon Bearing Wilcox and Tuscaloosa Sands & Cretaceous Carbonates WI: 63.4%;
Slide 7: Davy Jones – Major Ultra-Deep Discovery
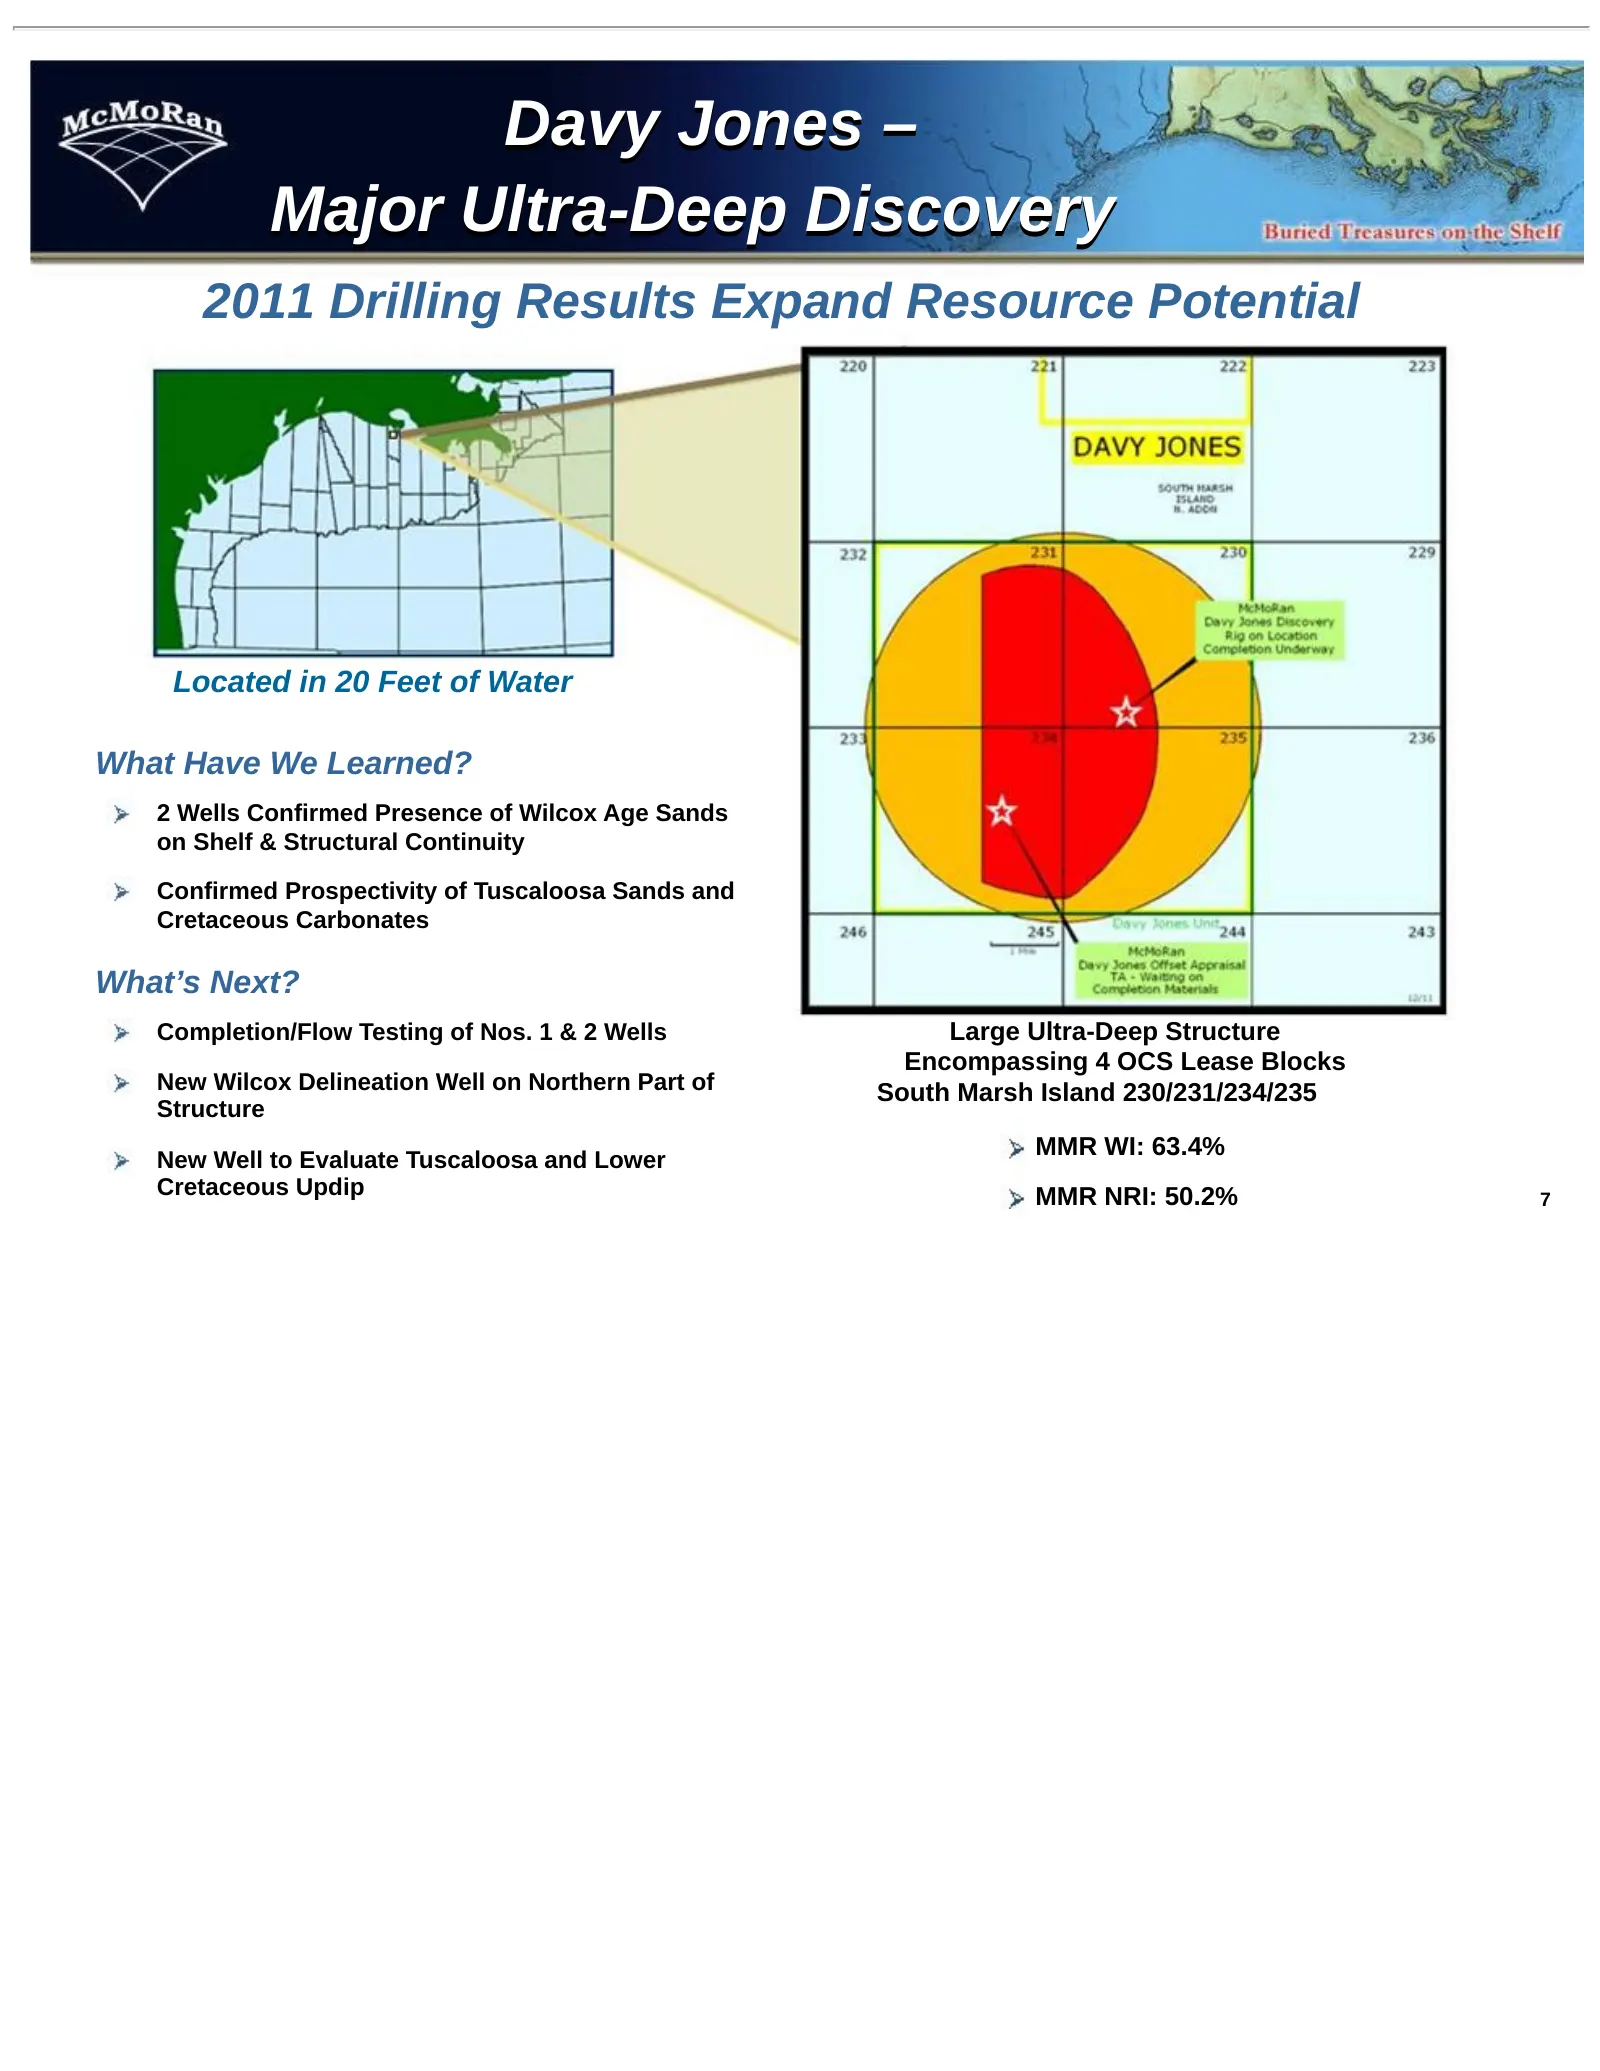
Davy Jones – Major Ultra-Deep Discovery 2011 Drilling Results Expand Resource Potential Located in 20 Feet of Water What Have We Learned? 2 Wells Confirmed Presence of Wilcox Age Sands on Shelf & Structural Continuity Confirmed Prospectivity of Tuscaloosa Sands and Cretaceous Carbonates What’s Next?
Slide 8: Davy Jones Field Development
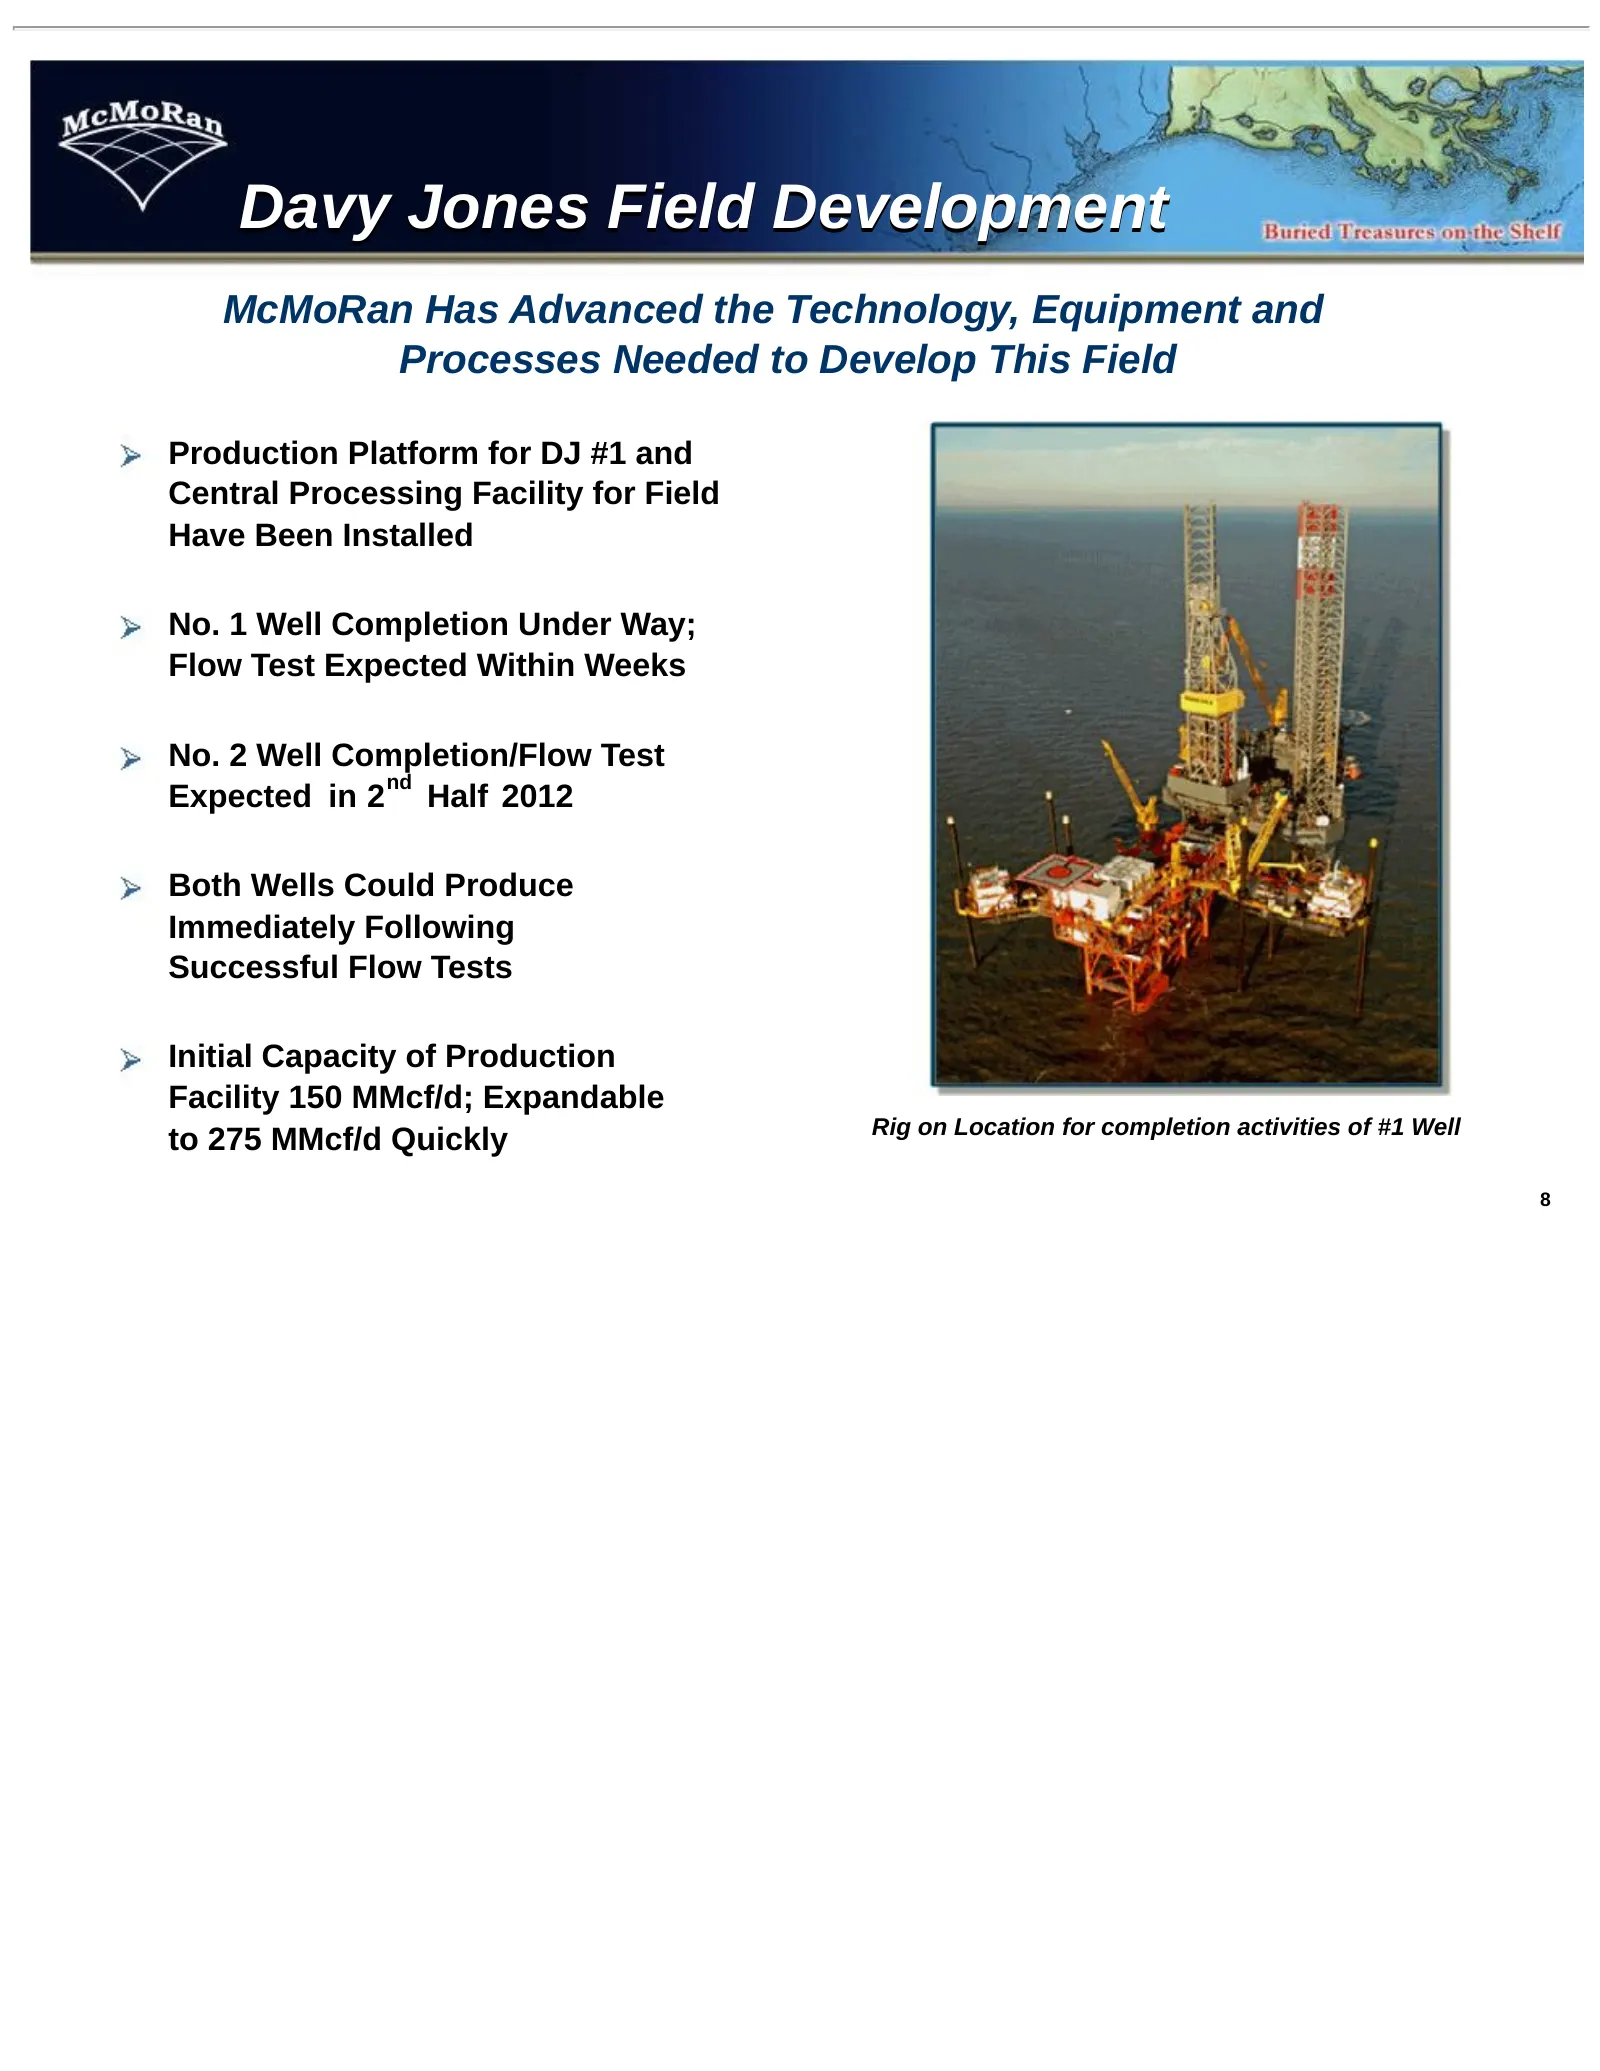
Davy Jones Field Development McMoRan Has Advanced the Technology, Equipment and Processes Needed to Develop This Field Production Platform for DJ #1 and Central Processing Facility for Field Have Been Installed No. 1 Well Completion Under Way; Flow Test Expected Within Weeks No. 2 Well Completion/Fl
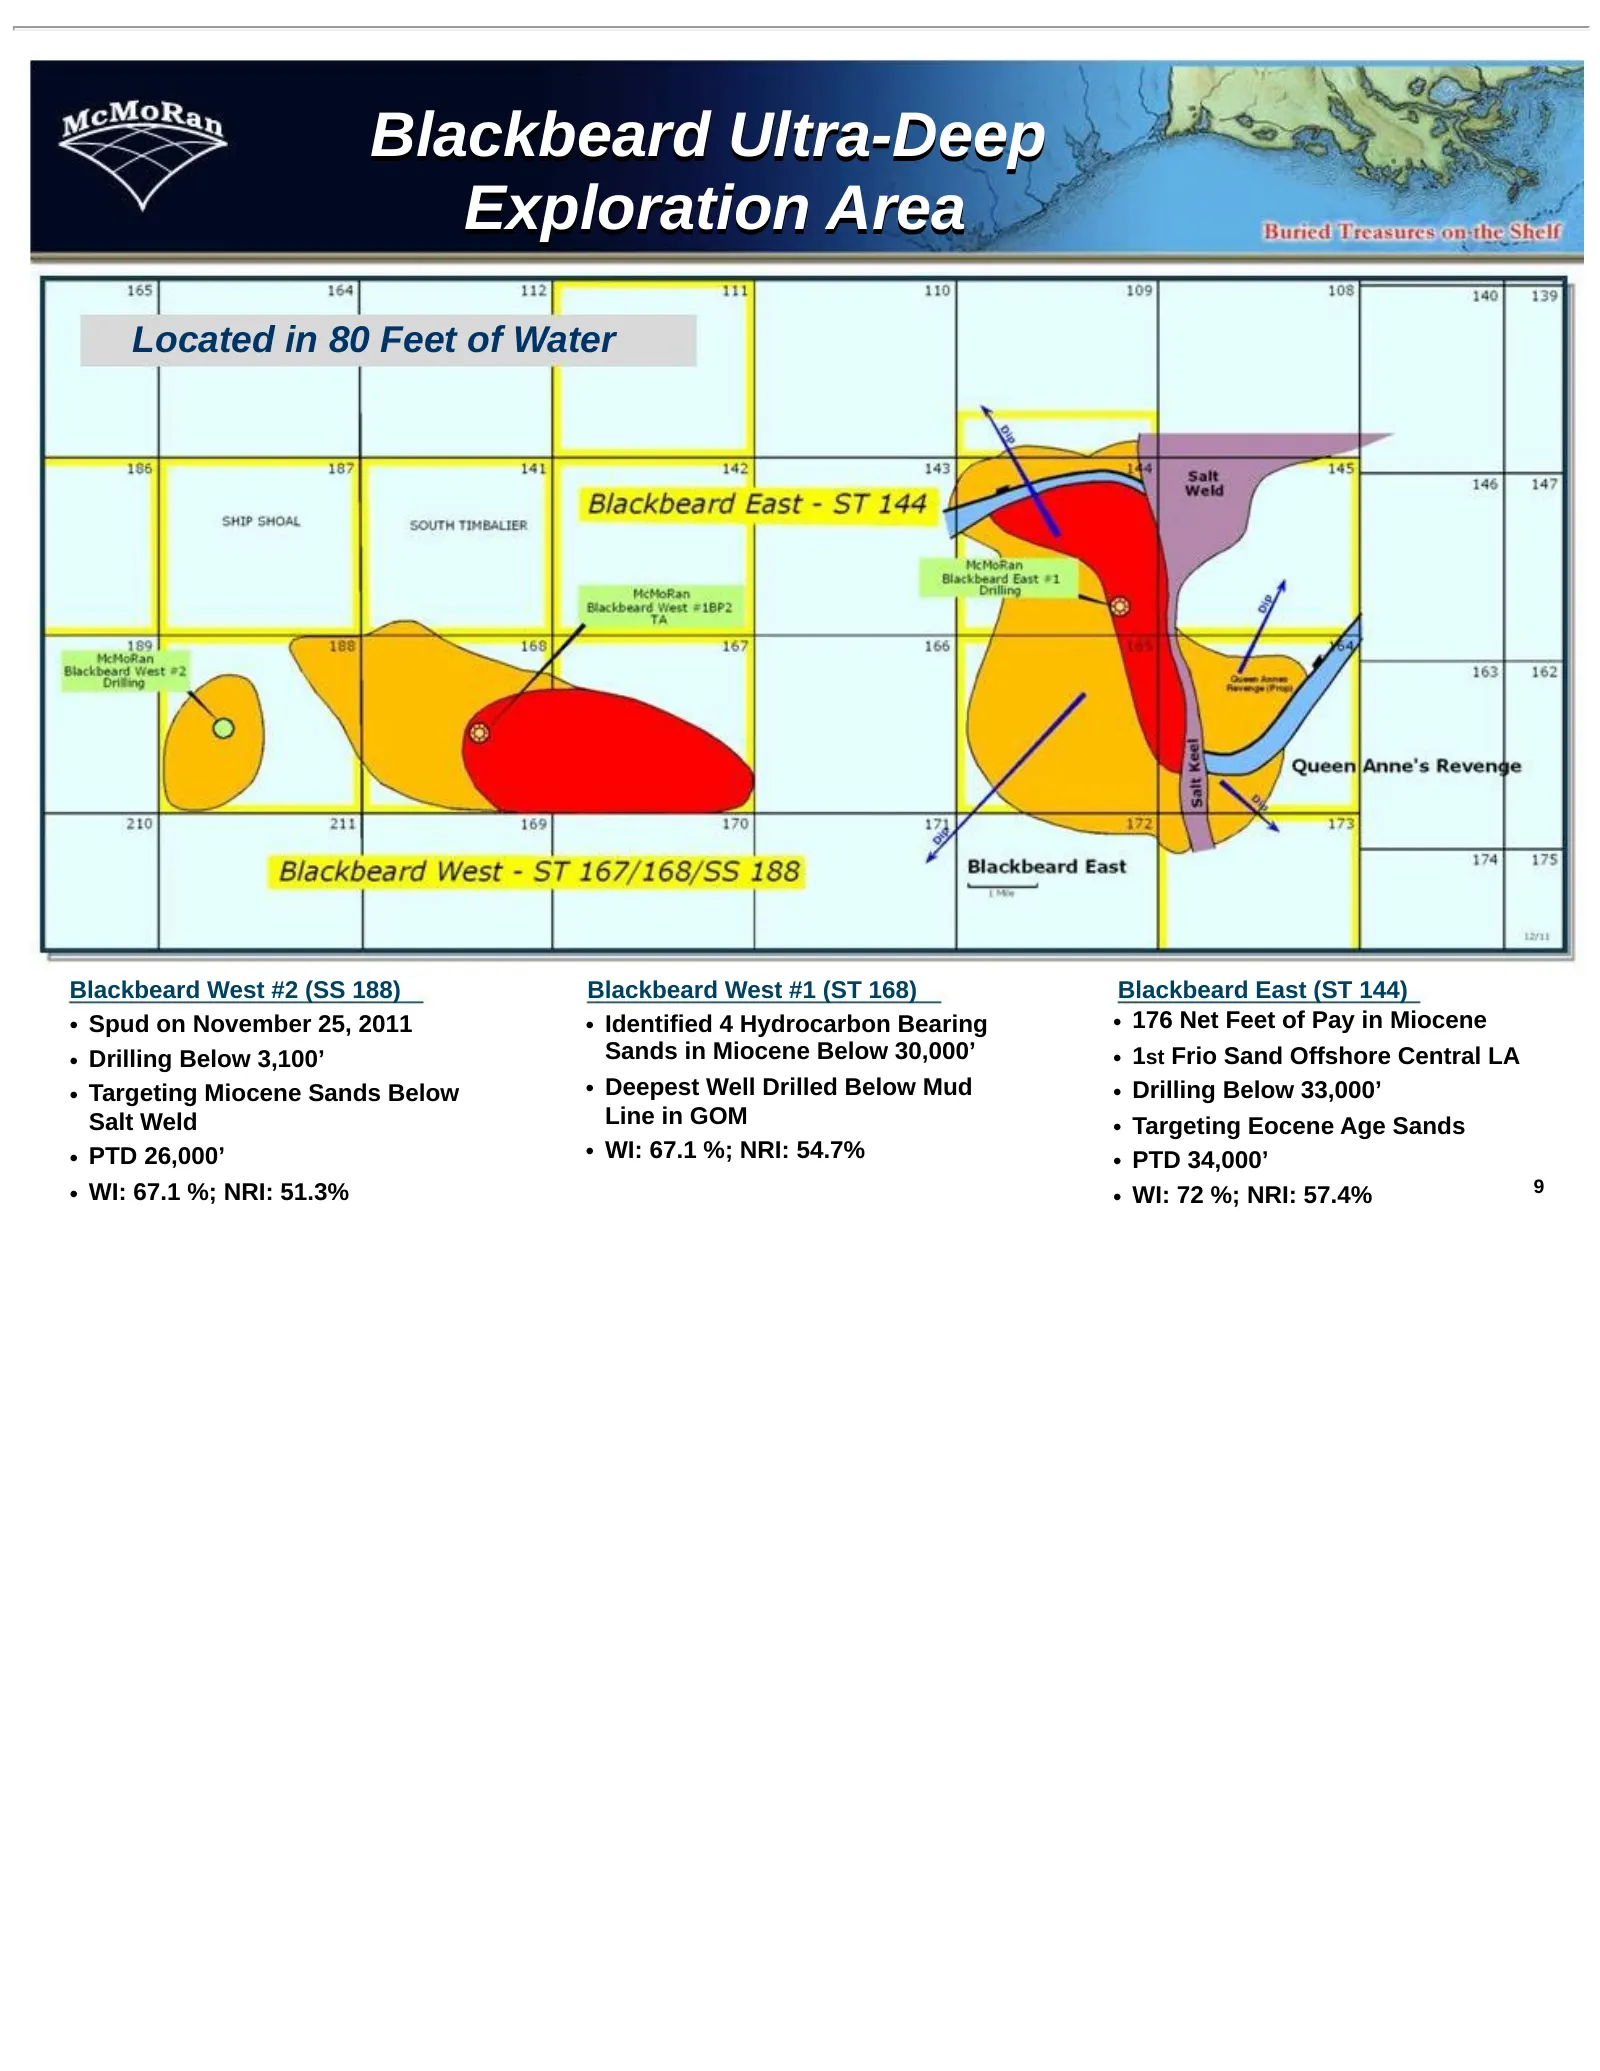
Slide 9: Blackbeard Ultra-Deep Exploration Area
Blackbeard Ultra-Deep Exploration Area Located in 80 Feet of Water Blackbeard West #2 (SS 188) Blackbeard West #1 (ST 168) Blackbeard East (ST 144) • Spud on November 25, 2011 • Identified 4 Hydrocarbon Bearing • 176 Net Feet of Pay in Miocene • Drilling Below 3,100’ Sands in Miocene Below 30,000’ •
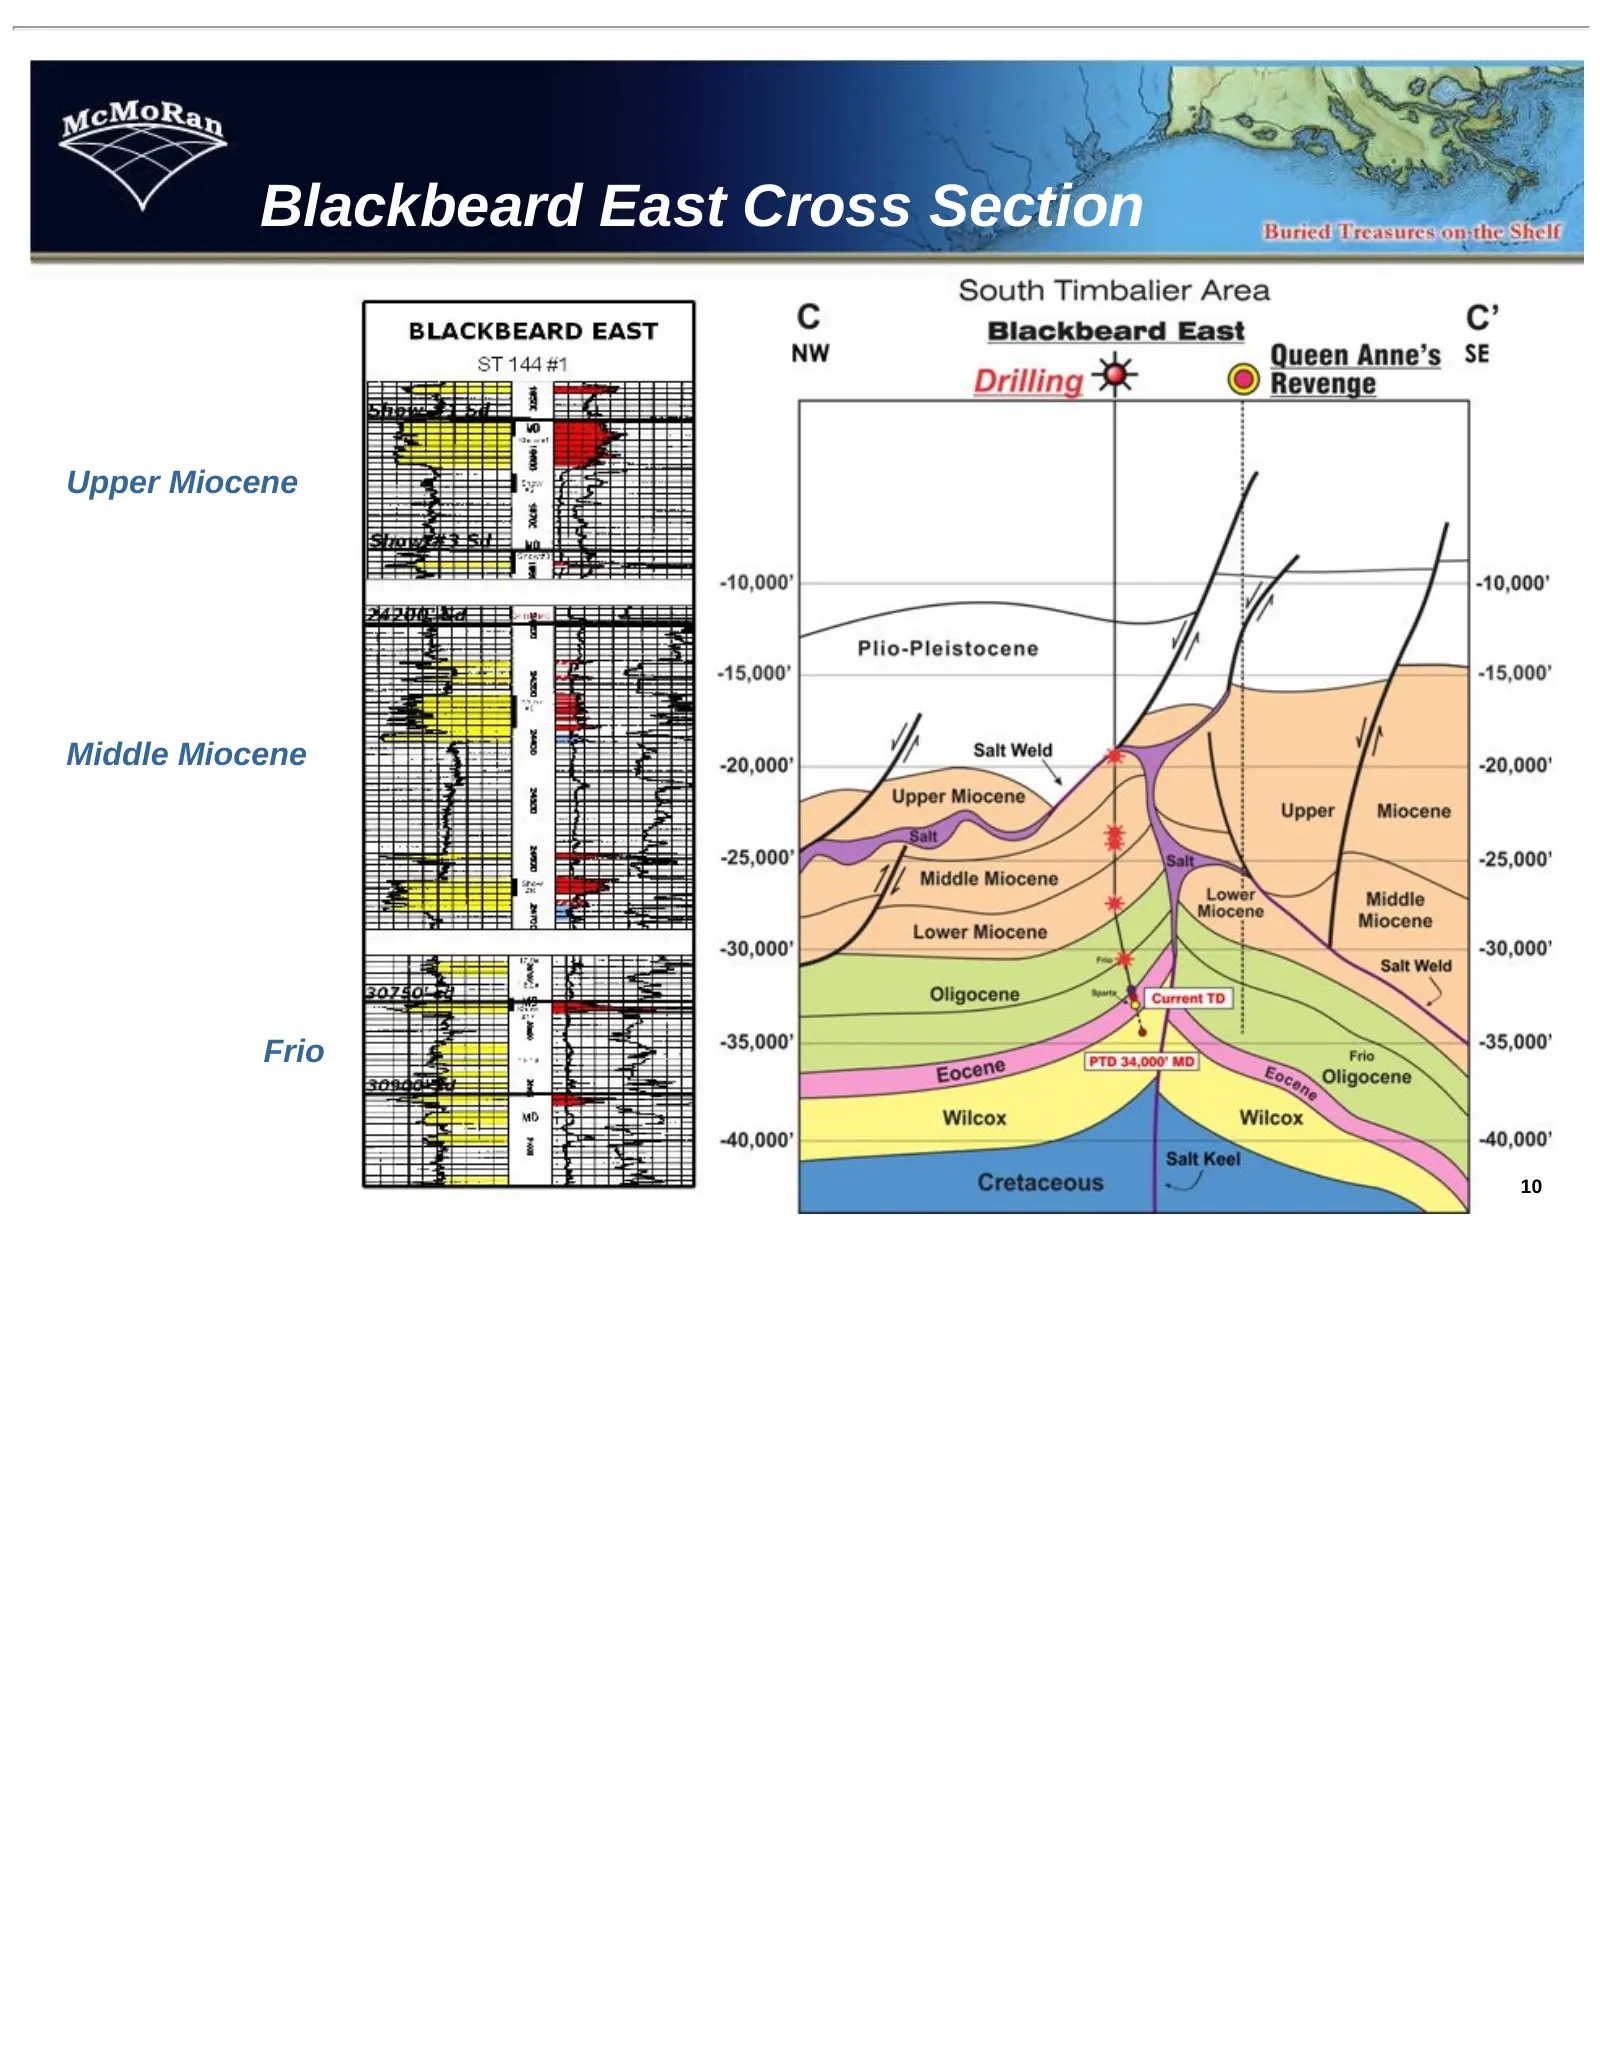
Slide 10: Blackbeard East Cross Section
Blackbeard East Cross Section Upper Miocene Middle Miocene Frio 10
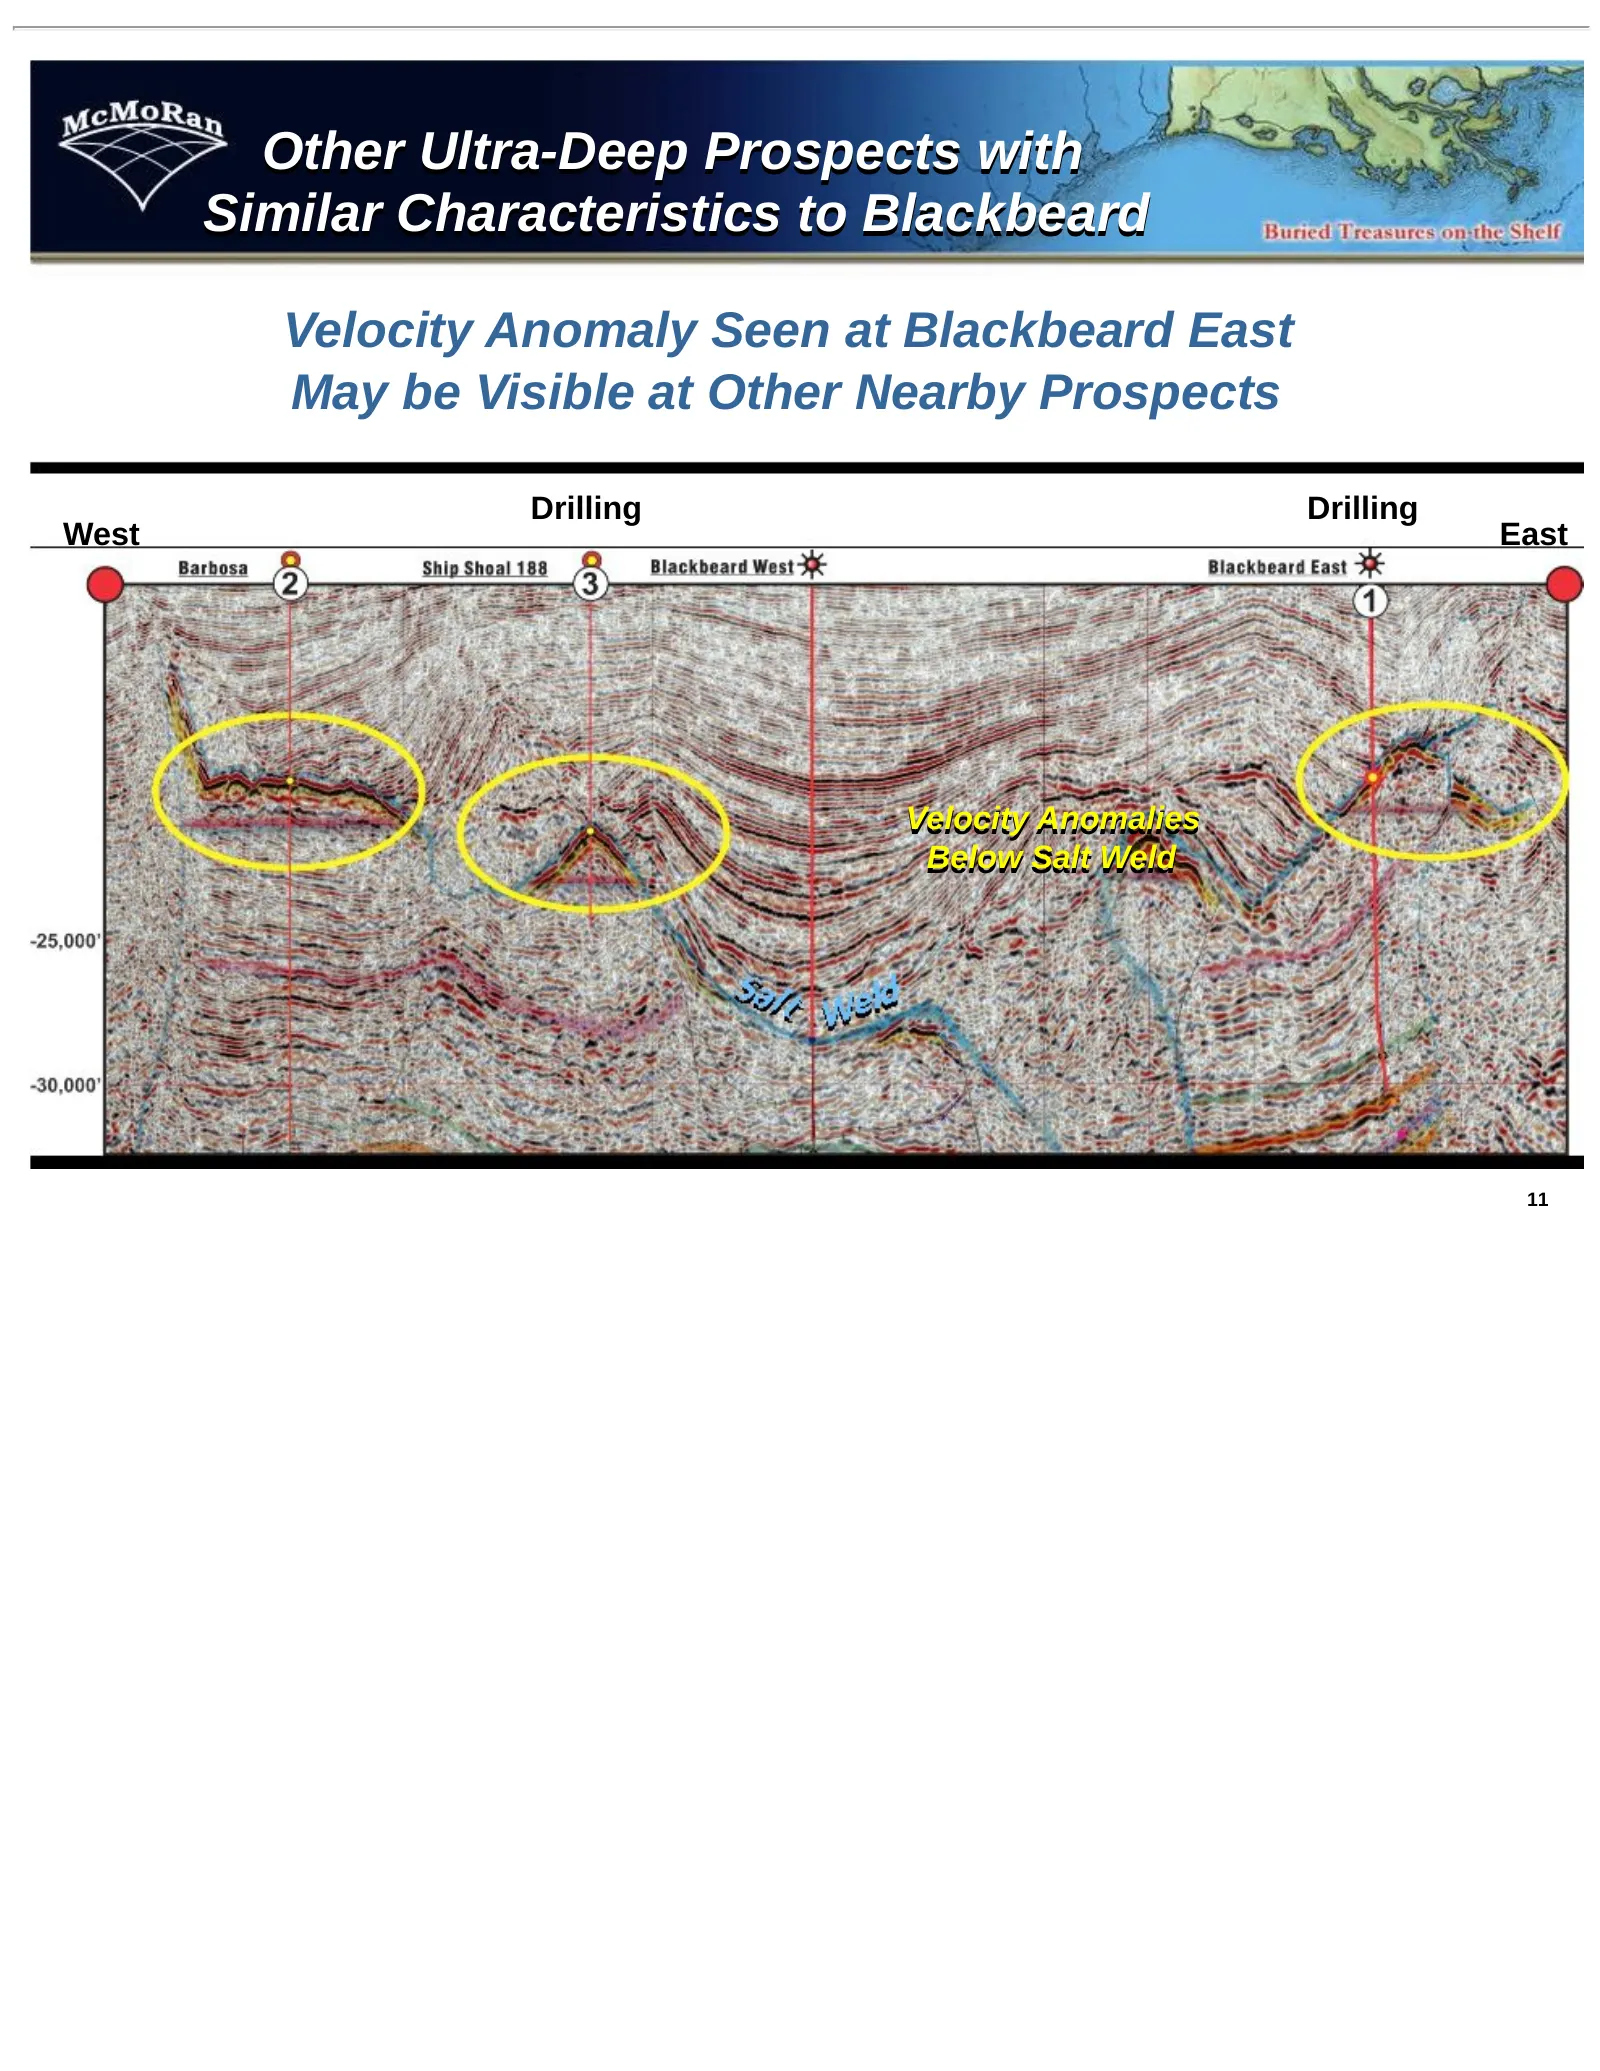
Slide 11: Other Ultra-Deep Prospects with Similar Characteristics to Blackbeard
Other Ultra-Deep Prospects with Similar Characteristics to Blackbeard Velocity Anomaly Seen at Blackbeard East May be Visible at Other Nearby Prospects Drilling Drilling West East Velocity Anomalies Below Salt Weld 11
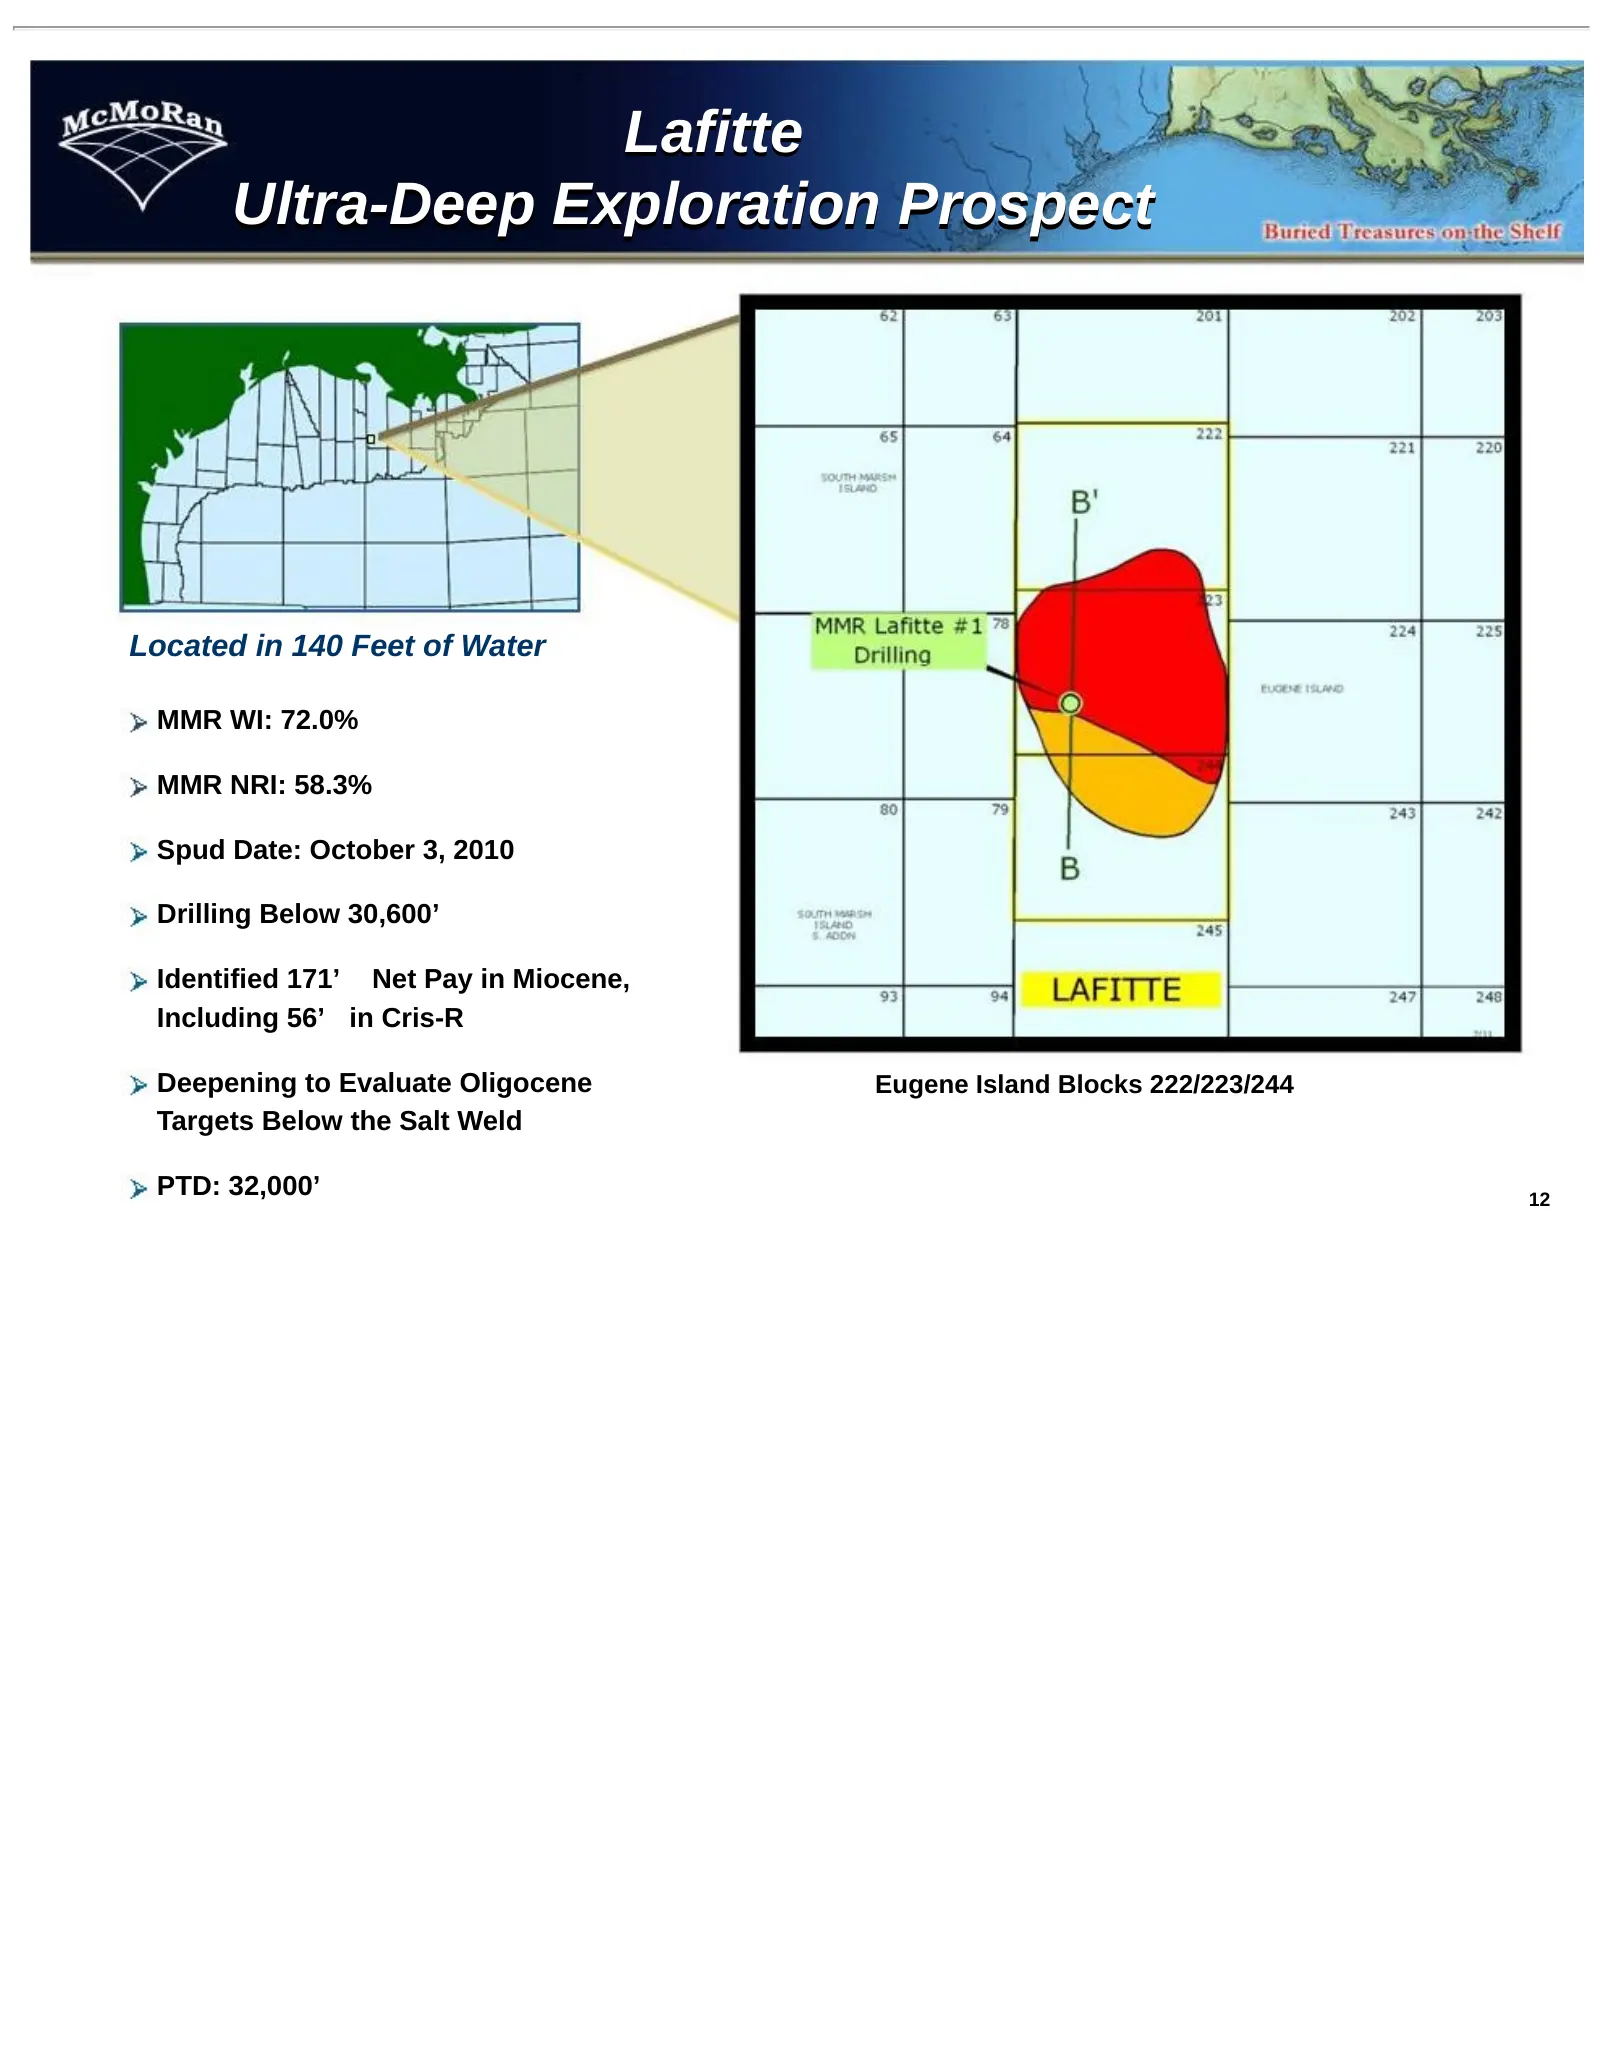
Slide 12: Lafitte Ultra-Deep Exploration Prospect
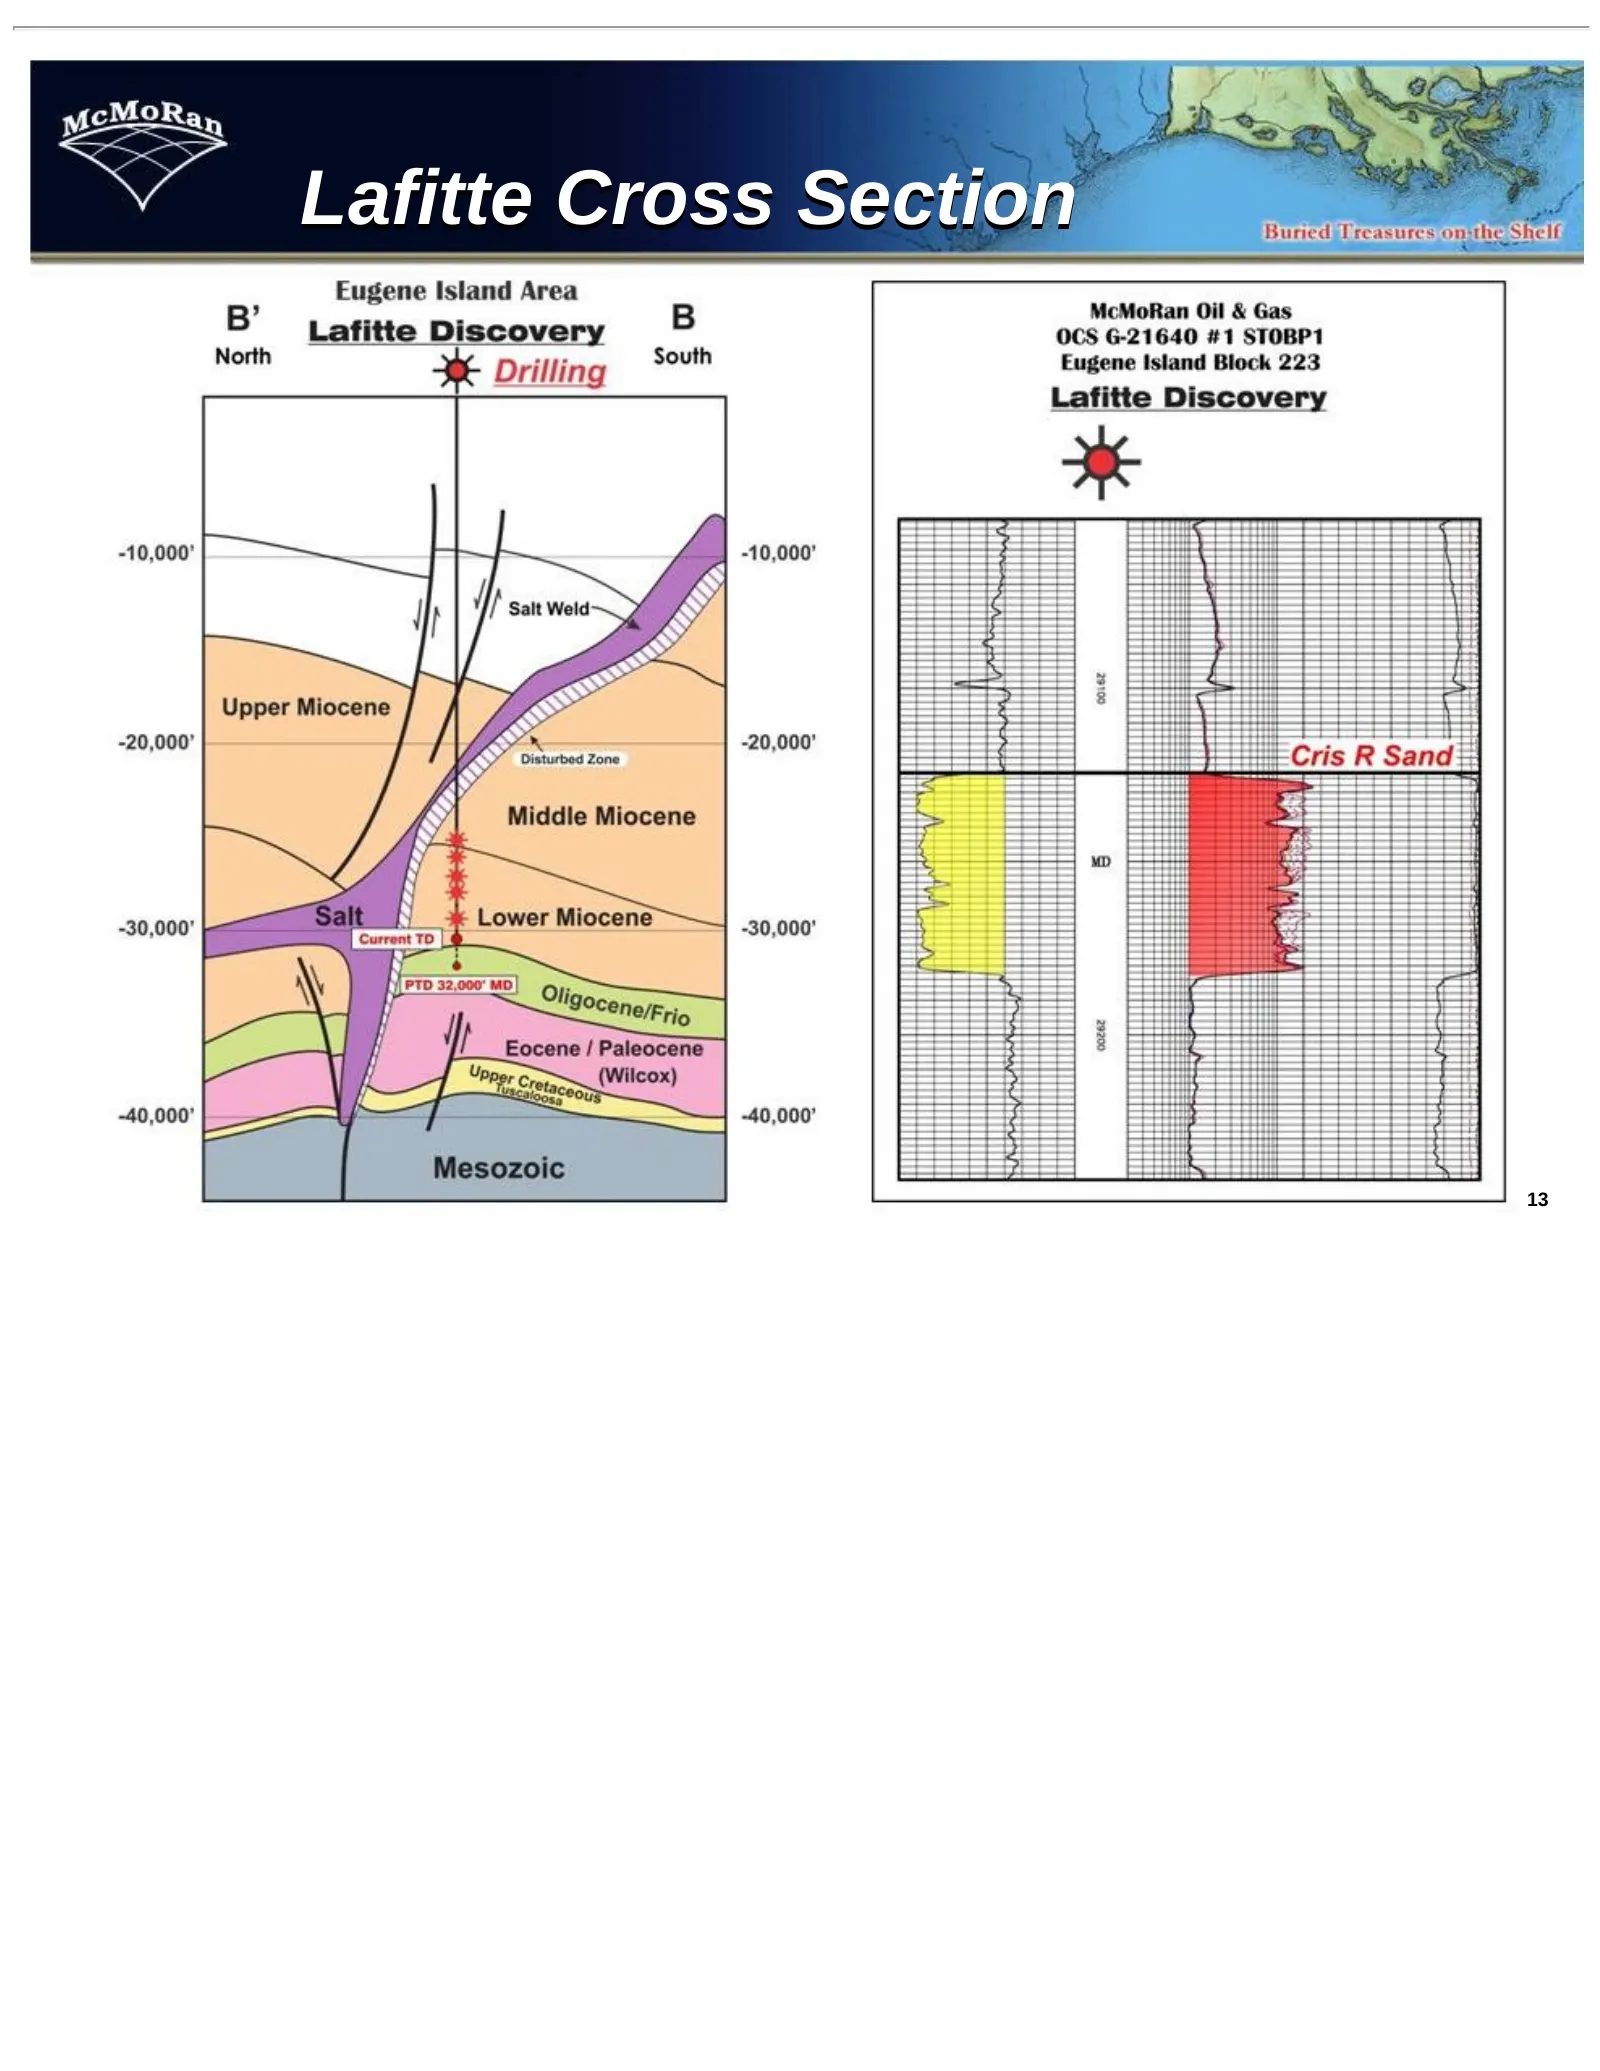
Lafitte Ultra-Deep Exploration Prospect Located in 140 Feet of Water MMR WI: 72.0% MMR NRI: 58.3% Spud Date: October 3, 2010 Drilling Below 30,600’ Identified 171’ Net Pay in Miocene, Including 56’ in Cris-R Deepening to Evaluate Oligocene Eugene Island Blocks 222/223/244 Targets Below the Salt Weld
Slide 13: Lafitte Cross Section
mcMoRa, v Lafitte Cross Section Eugene Island Area ’ McMoRan Oil & Gas B Lafitte Di ve B OCS G-21640 #1 STOBP1 North South Eugene Island Block 223 Drilling Lafitte Discovery -10,000° -10,000' -20,000" 3 26 | -20,000° -40,000' | ——§ =F ———~_} 40,000" 13
Slide 14: Lafitte/Barataria/Captain Blood Cross Section
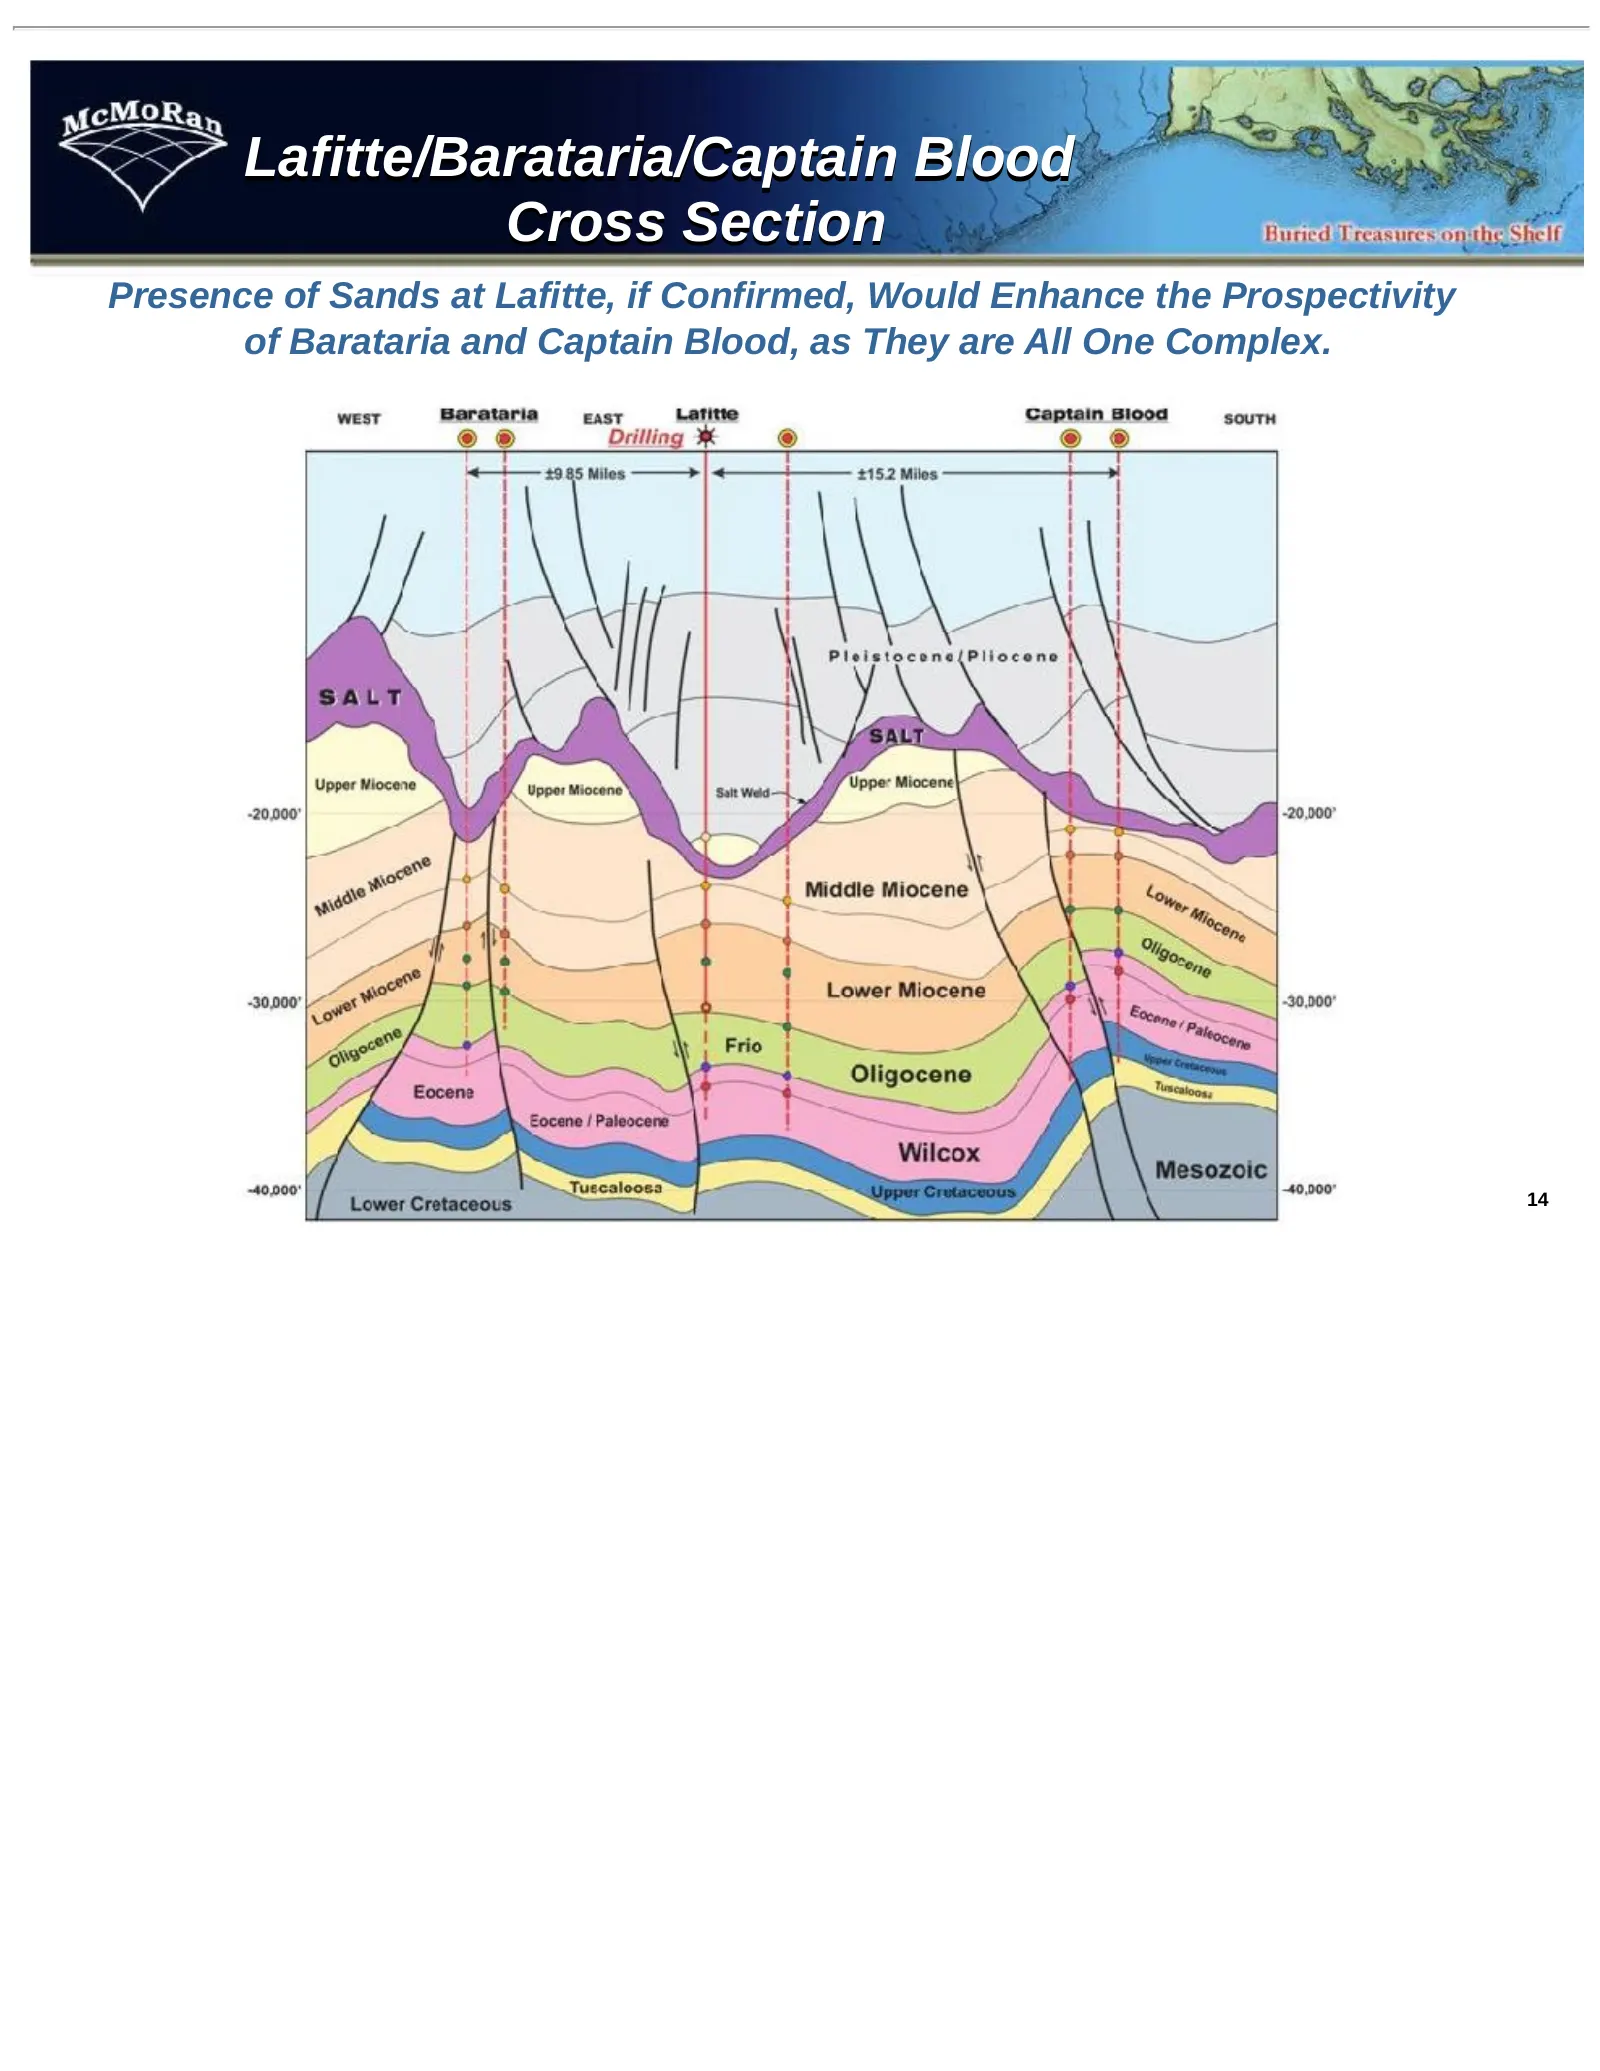
Lafitte/Barataria/Captain Blood Cross Section Presence of Sands at Lafitte, if Confirmed, Would Enhance the Prospectivity of Barataria and Captain Blood, as They are All One Complex. 14
Slide 15: Ultra-Deep Prospects/Potential
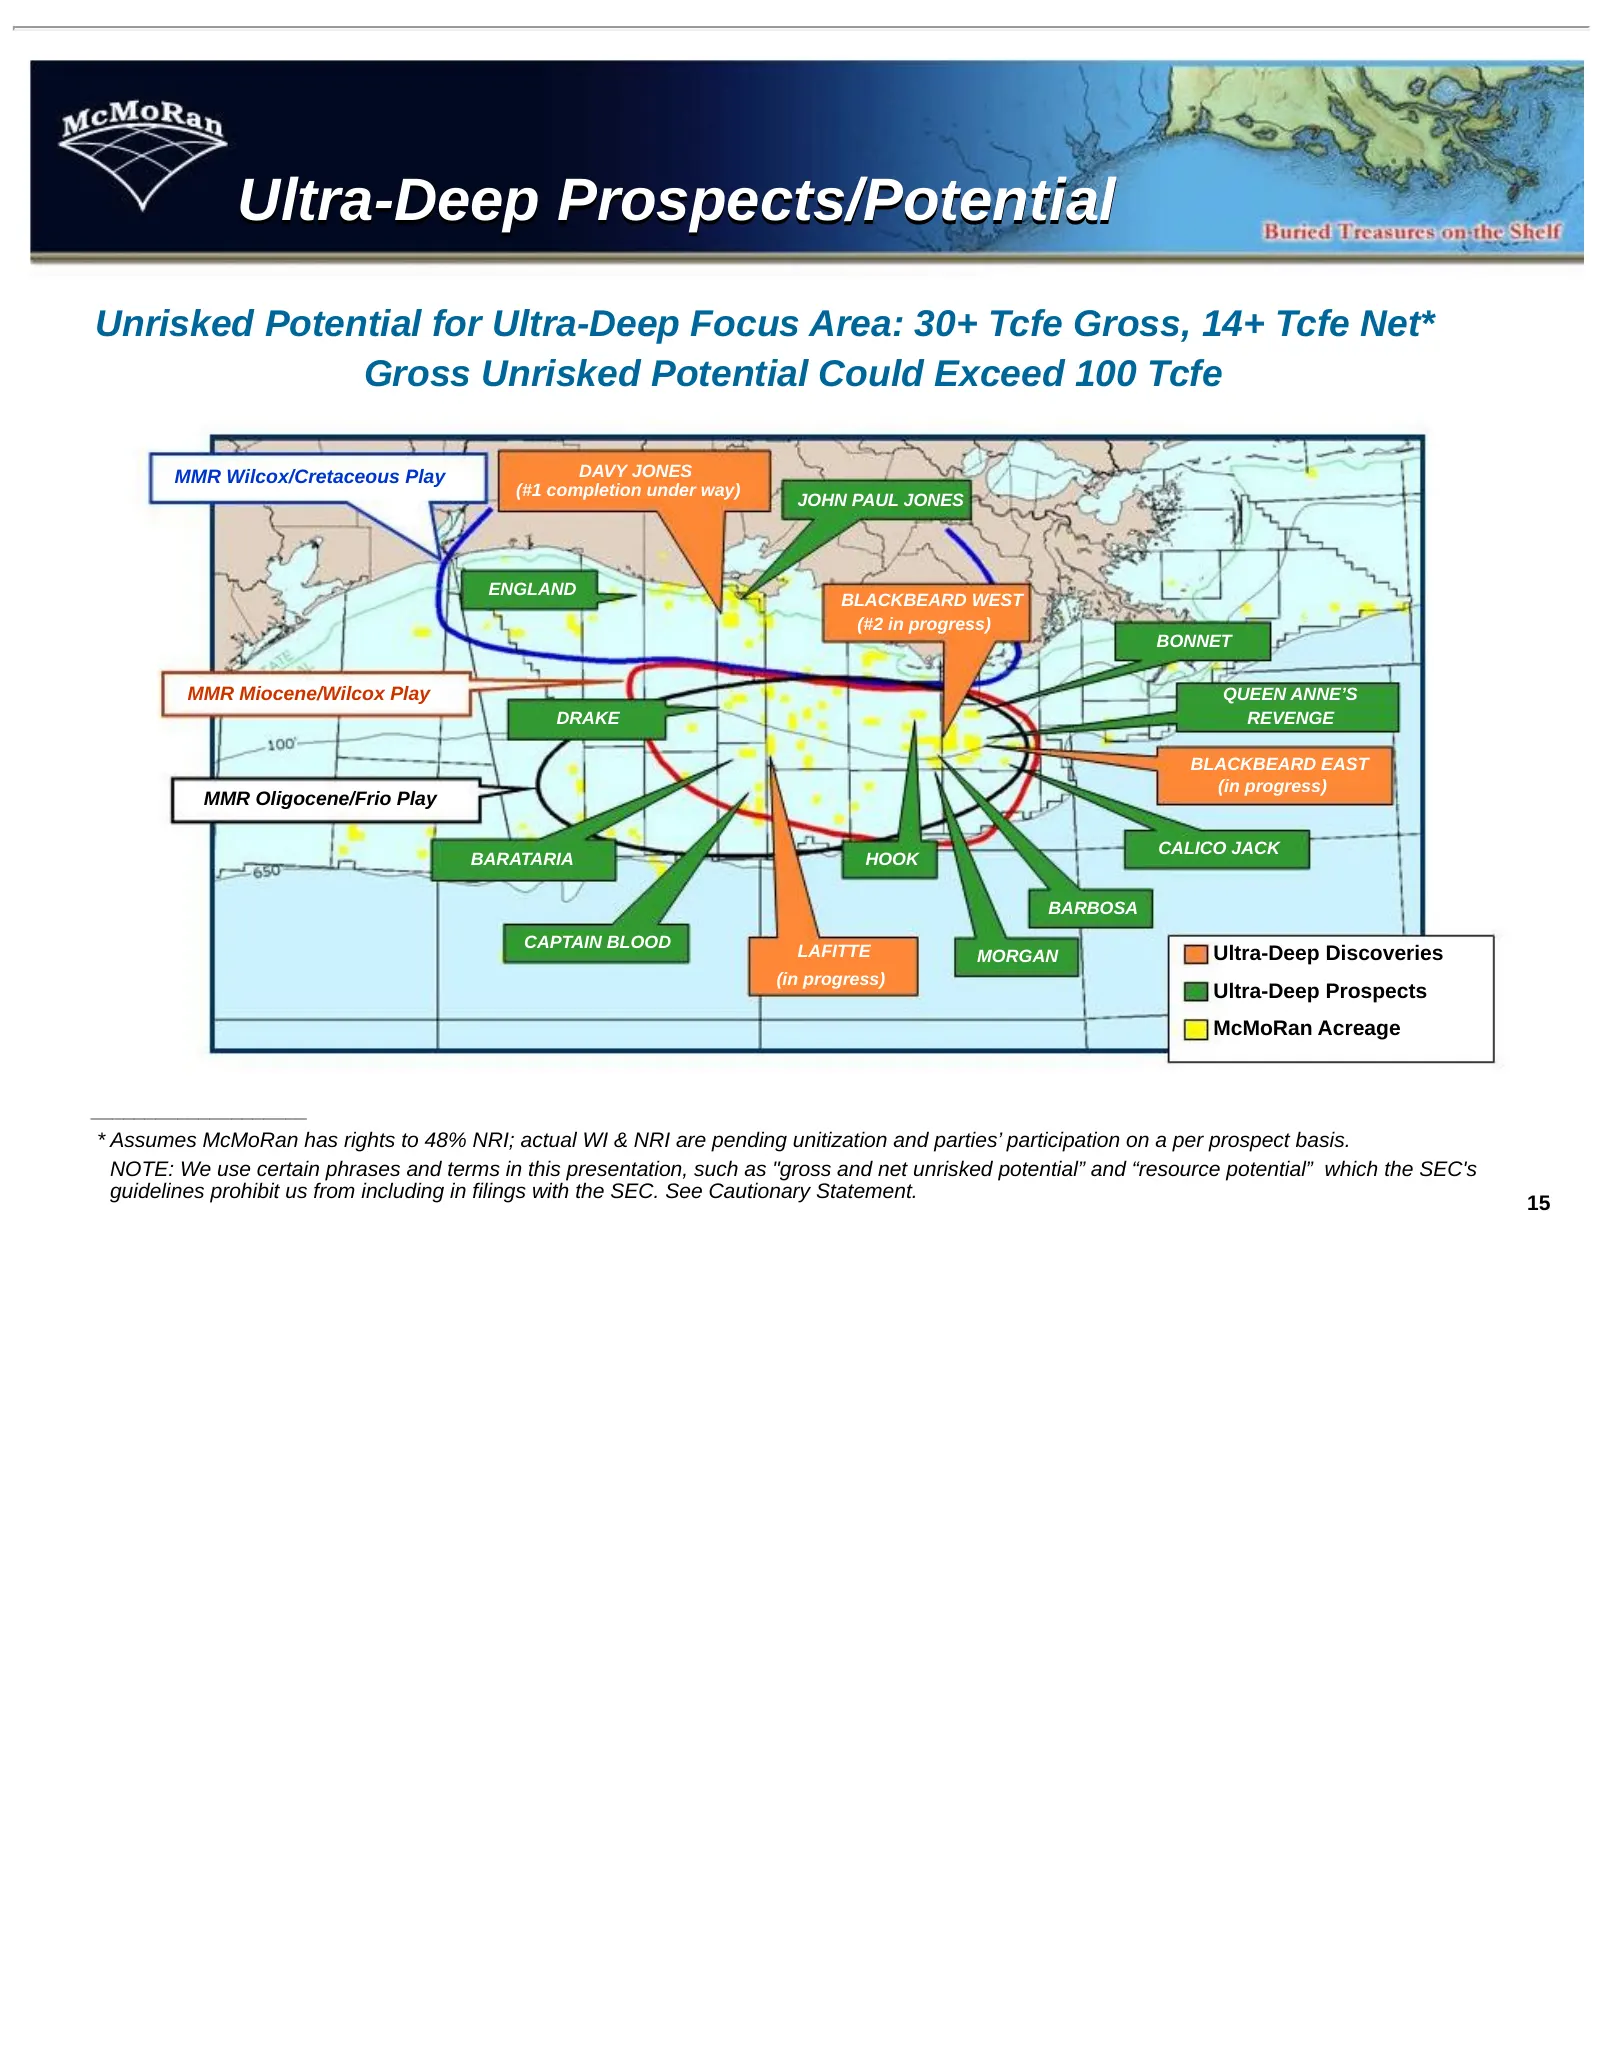
Ultra-Deep Prospects/Potential Unrisked Potential for Ultra-Deep Focus Area: 30+ Tcfe Gross, 14+ Tcfe Net* Gross Unrisked Potential Could Exceed 100 Tcfe MMR Wilcox/Cretaceous Play DAVY JONES (#1 completion under way) JOHN PAUL JONES ENGLAND BLACKBEARD WEST (#2 in progress) BONNET MMR Miocene/Wilcox
Slide 16: Resource Potential Identified to Date From Drilling Results
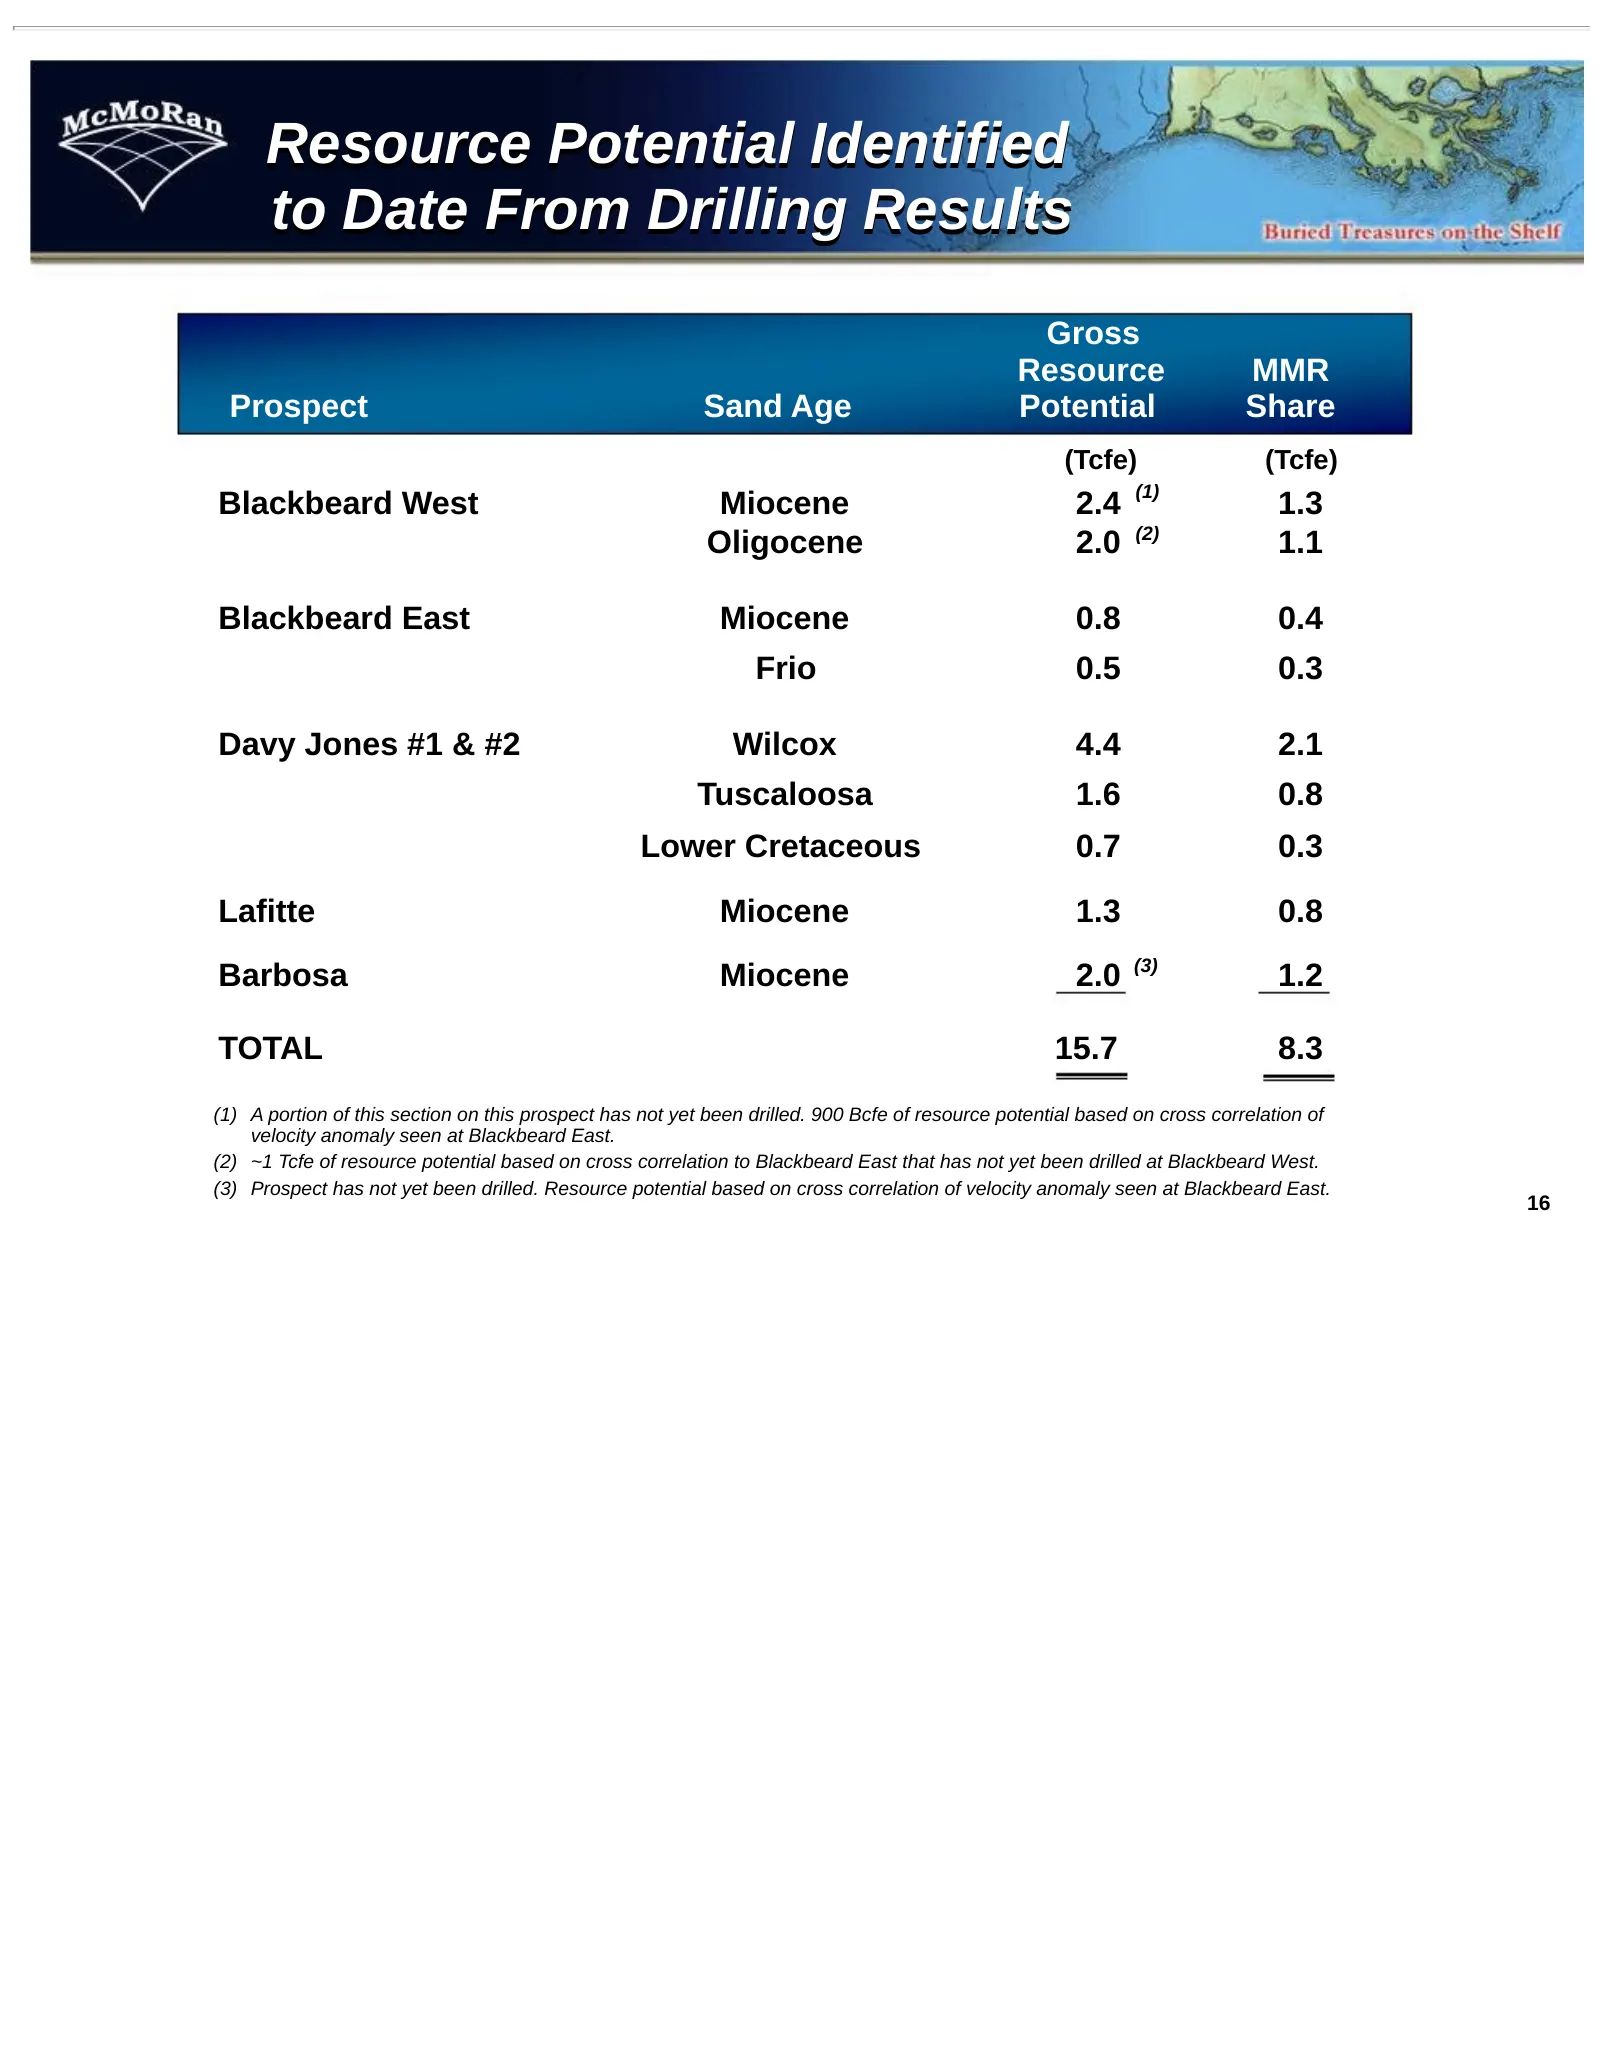
Resource Potential Identified to Date From Drilling Results Gross Resource MMR Prospect Sand Age Potential Share (Tcfe) (Tcfe) (1) Blackbeard West Miocene 2.4 1.3 Oligocene 2.0 (2) 1.1 Blackbeard East Miocene 0.8 0.4 Frio 0.5 0.3 Davy Jones #1 & #2 Wilcox 4.4 2.1 Tuscaloosa 1.6 0.8 Lower Cretaceous
Slide 17: Ultra-Deep Economic Model
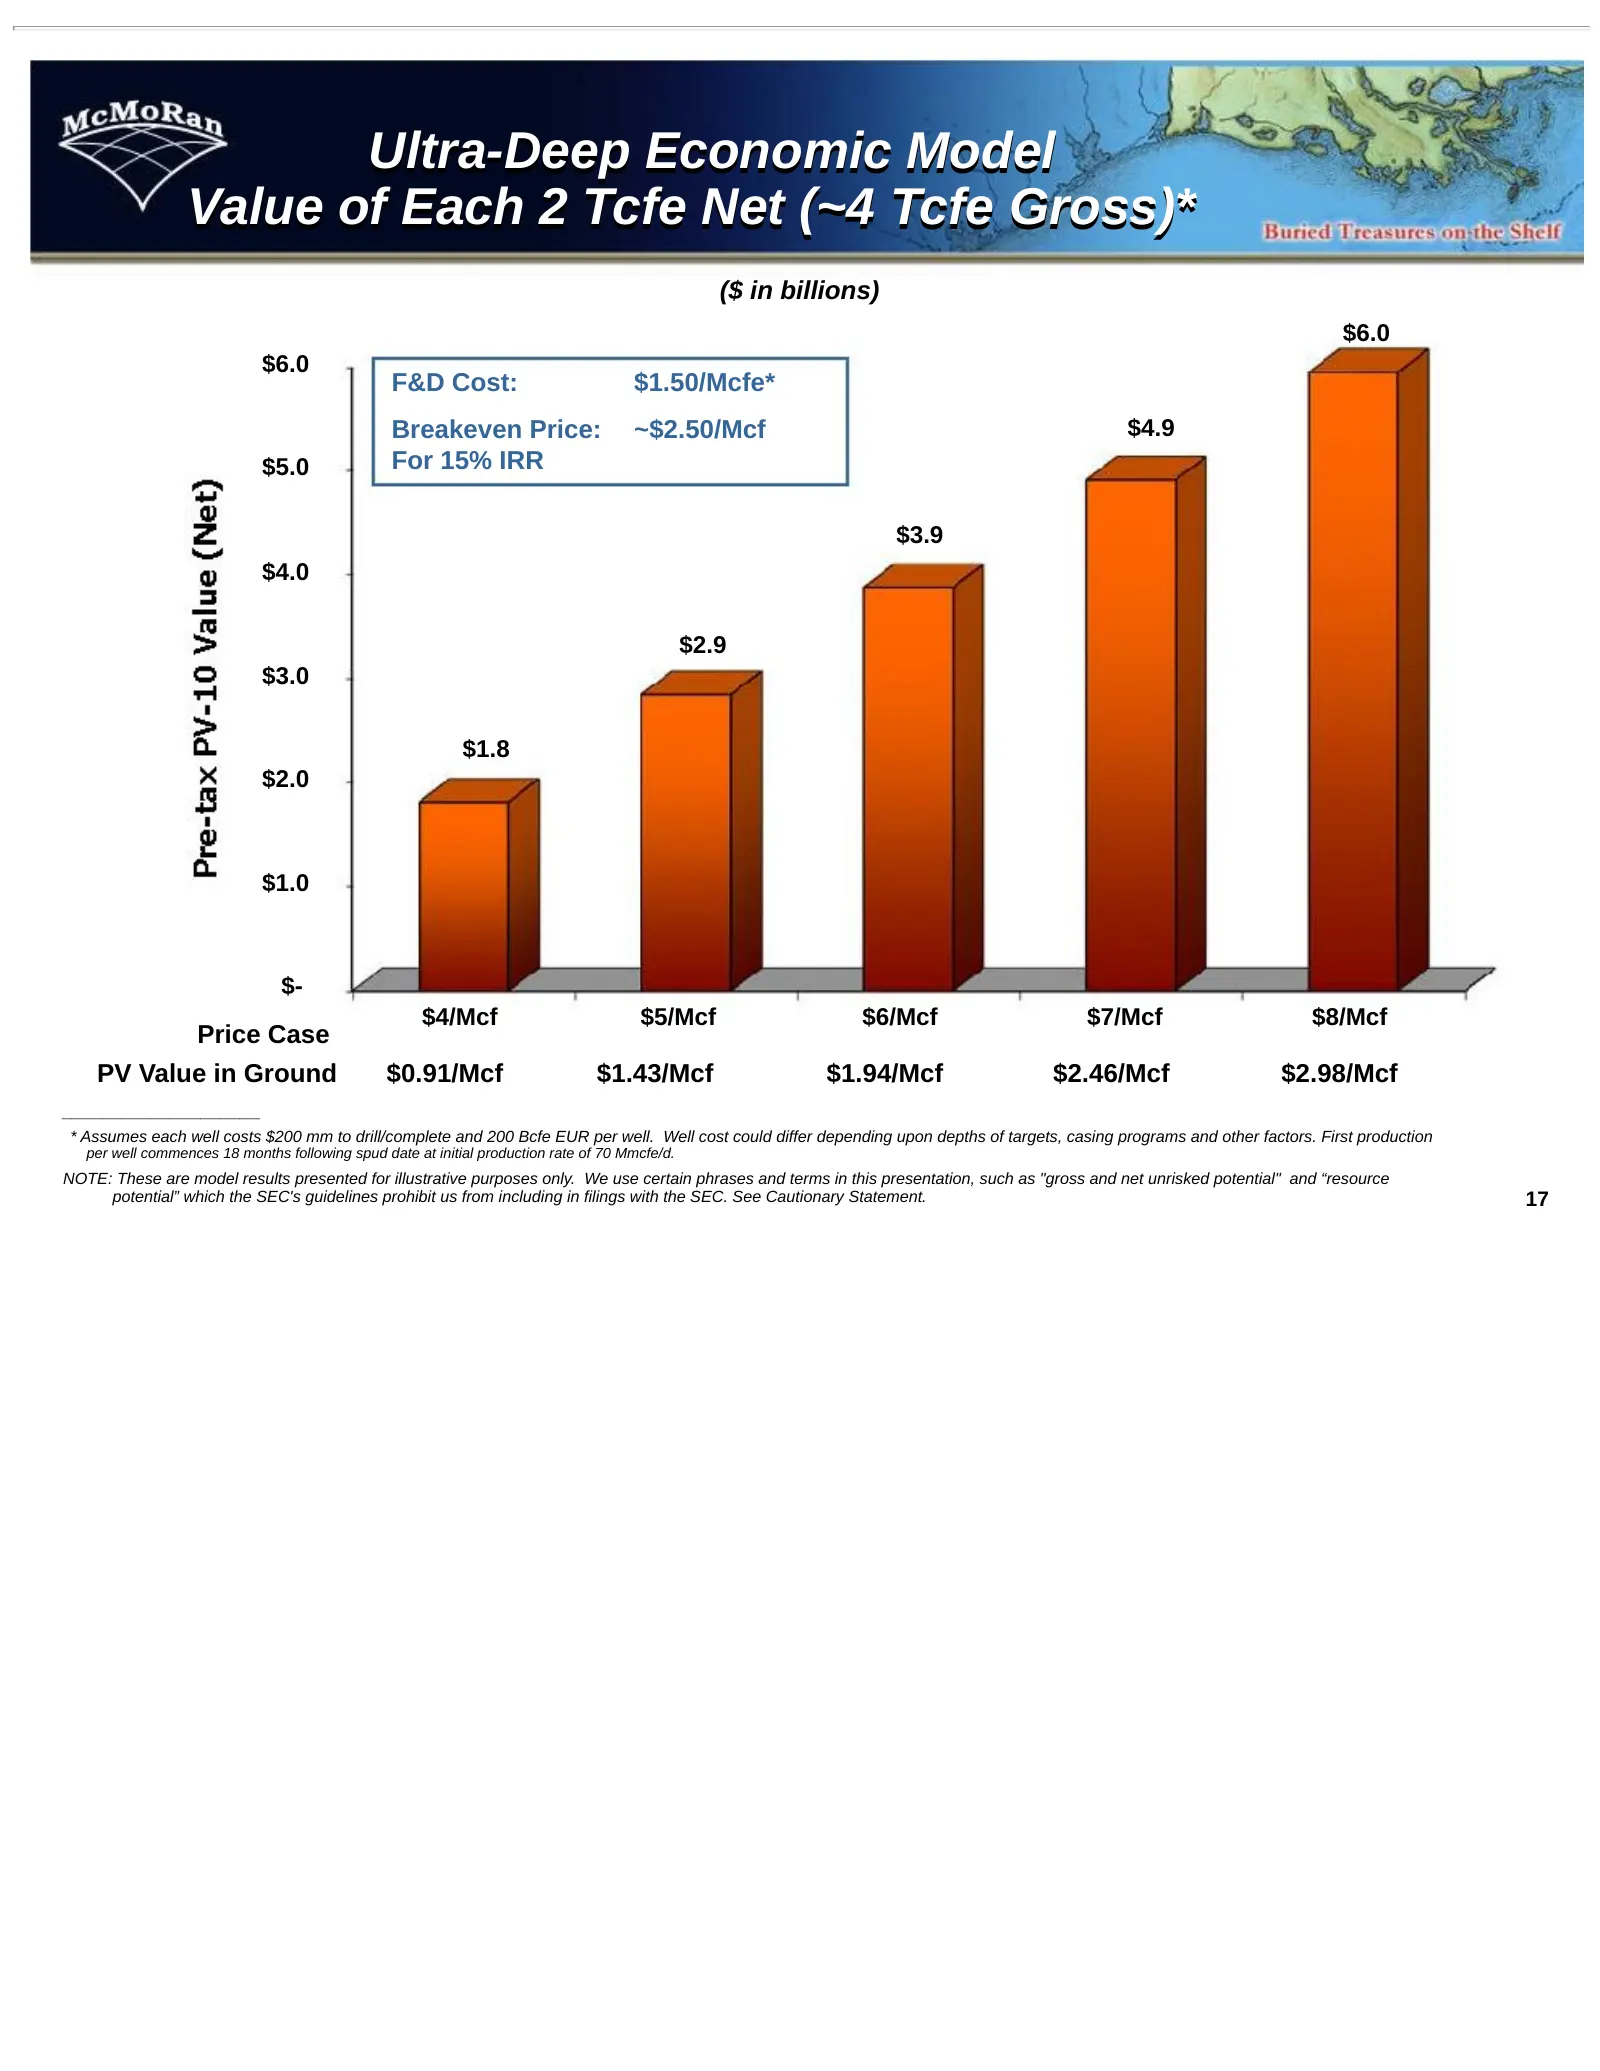
Ultra-Deep Economic Model Value of Each 2 Tcfe Net (~4 Tcfe Gross)* ($ in billions) $6.0 $6.0 F&D Cost: $1.50/Mcfe* Breakeven Price: ~$2.50/Mcf $4.9 $5.0 For 15% IRR $3.9 $4.0 $2.9 $3.0 $1.8 $2.0 $1.0 $- $4/Mcf $5/Mcf $6/Mcf $7/Mcf $8/Mcf Price Case PV Value in Ground $0.91/Mcf $1.43/Mcf $1.94/Mcf $
Slide 18: Conclusion
Conclusion Substantial Value in Data Gained to Date Multiple Near-term Catalysts Could Enhance Value • Drilling Results • Flow Testing Opportunities to Unlock Additional Value from Acreage/Prospect Inventory 18
Source: SEC EDGAR · 8-K filed Dec 8, 2011
More decks from McMoRan Exploration Company
 Global Metals, Mining & Steel Conference 201333 slides · May 14, 2013
 Q1 2013 Earnings Presentation46 slides · Apr 19, 2013
 Merger or Acquisition (February 2013)35 slides · Feb 25, 2013
 Merger or Acquisition (January 2013)30 slides · Jan 17, 2013
 Investor Presentation (August 2012)29 slides · Aug 14, 2012
 Susquehanna 2012 Energy & Resources Conference21 slides · May 9, 2012