Professional — IPO Roadshow (January 2020)
31 slides from Professional's IPO roadshow presentation, Jan 30, 2020
Slide 1: Professional Holding Corp. Initial Public Offering
Confidential Investor Presentation Professional Holding Corp. Initial Public Offering 3,100,000 shares of Class A Common Stock January 2020
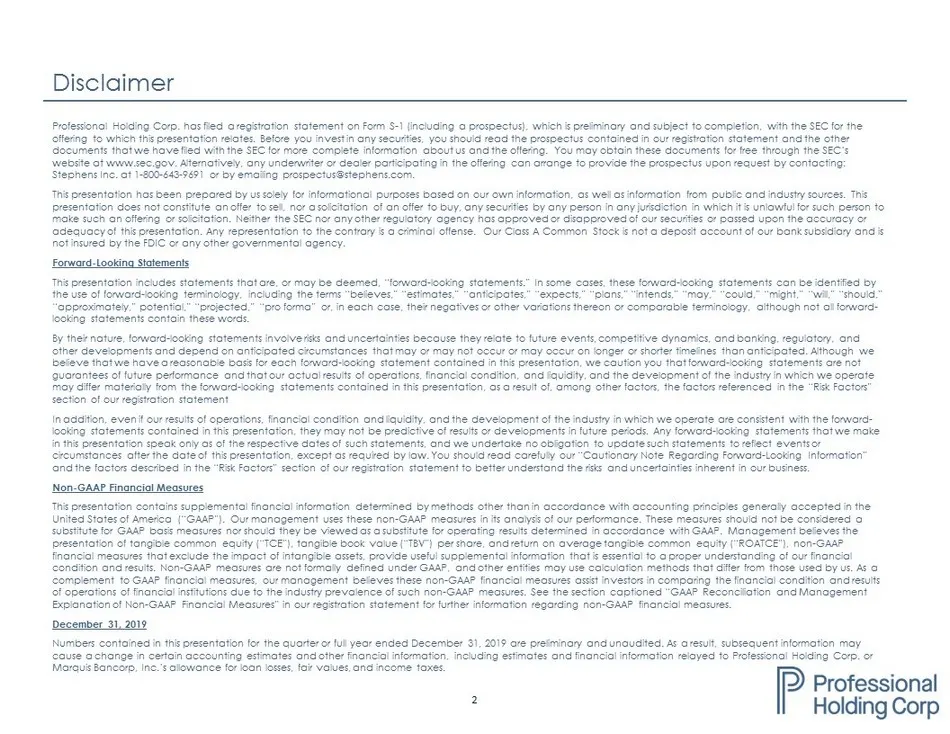
Slide 2: Disclaimer
2 Disclaimer (1) The acquisition is subject to applicable regulatory approvals, approval of the Minden shareholders and other customary closing conditions. The private placement is not conditional on the closing of the acquisition. Professional Holding Corp. has filed a registration statement on For
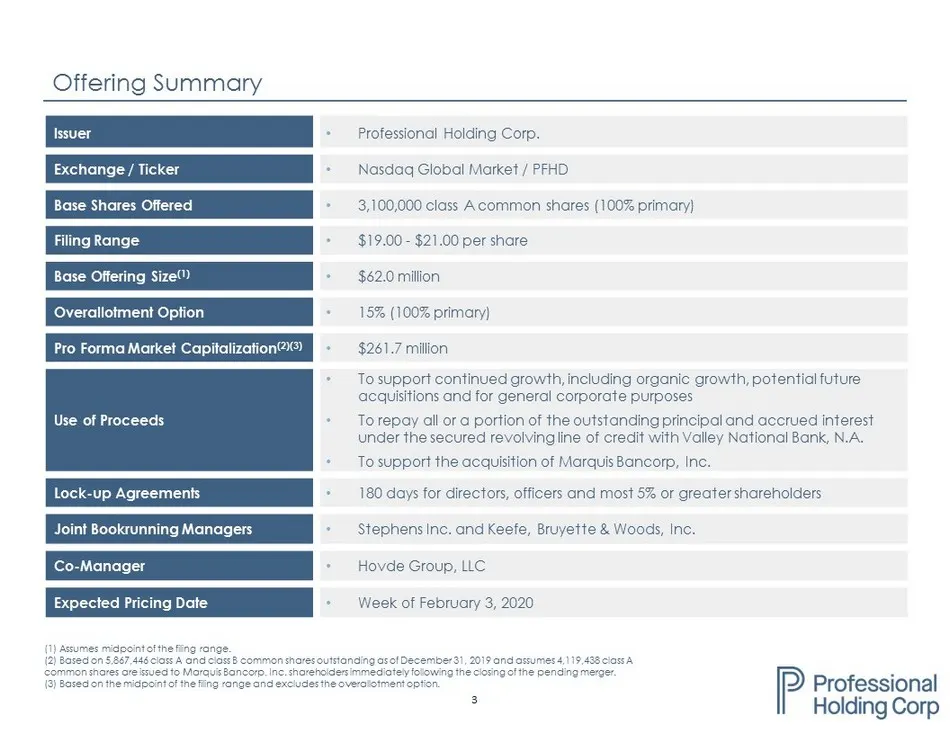
Slide 3: Offering Summary
3 Offering Summary Issuer • Professional Holding Corp. Exchange / Ticker • Nasdaq Global Market / PFHD Base Shares Offered • 3,100,000 class A common shares (100% primary) Filing Range • $19.00 - $21.00 per share Base Offering Size (1) • $62.0 million Overallotment Option • 15% (100% primary) Pro Fo
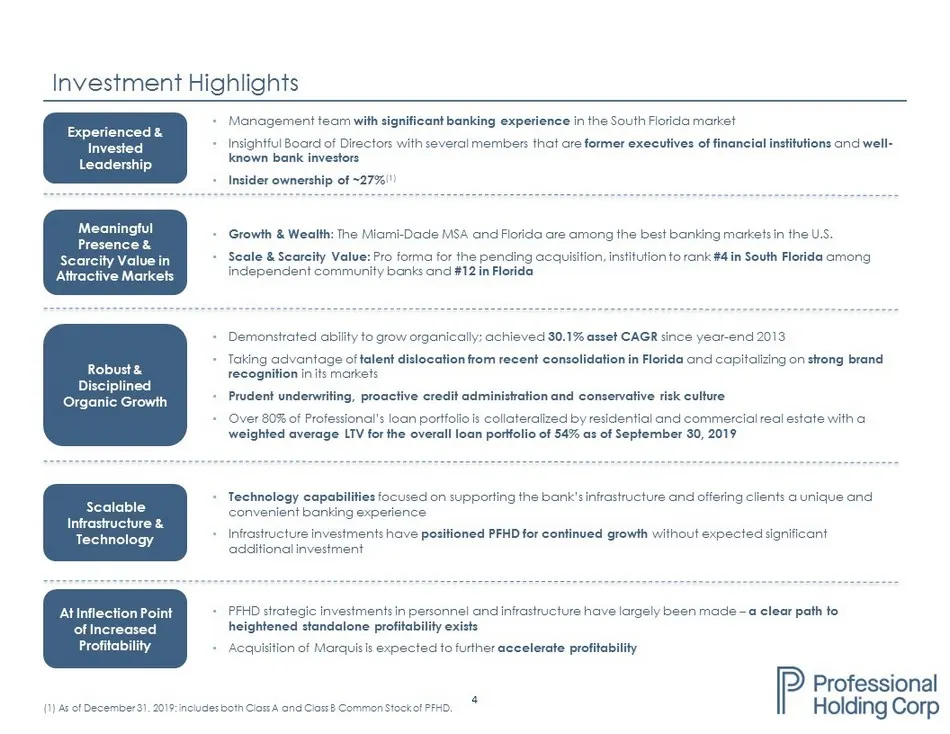
Slide 4: Investment highlights
4 • Demonstrated ability to grow organically; achieved 30.1% asset CAGR since year - end 2013 • Taking advantage of talent dislocation from recent consolidation in Florida and capitalizing on strong brand recognition in its markets • Prudent underwriting, proactive credit administration and conserva
Slide 5: Professional Bank Executive Management Team
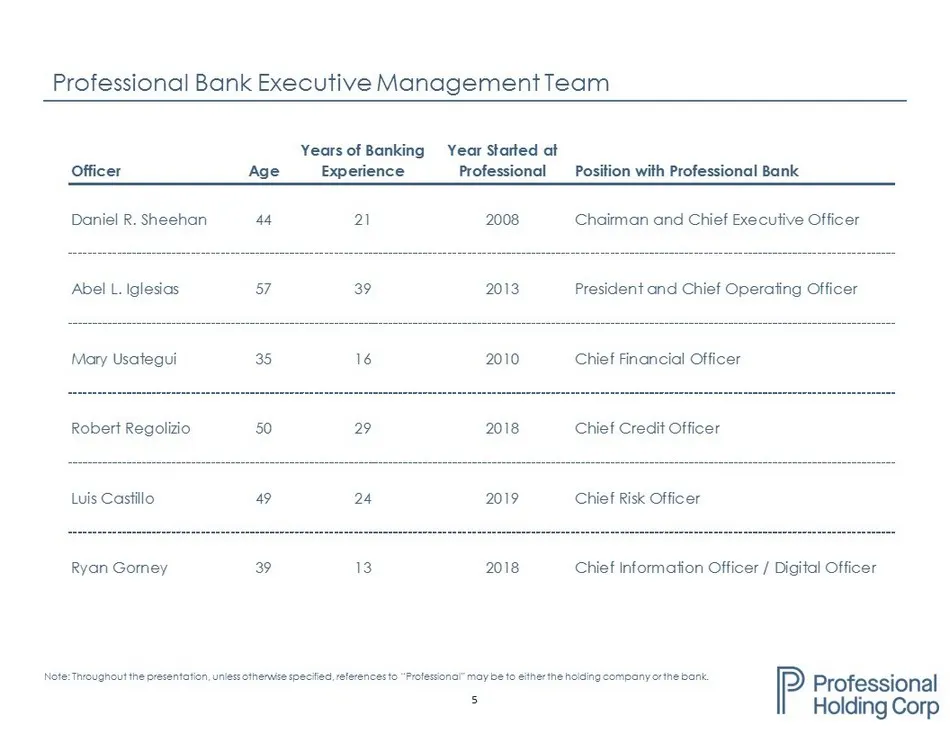
5 Professional Bank Executive Management Team Note: Throughout the presentation, unless otherwise specified, references to “Professional” may be to either the holding company or the bank. Years of Banking Year Started at Officer Age Experience Professional Position with Professional Bank Daniel R. S
Slide 6: Board of Directors
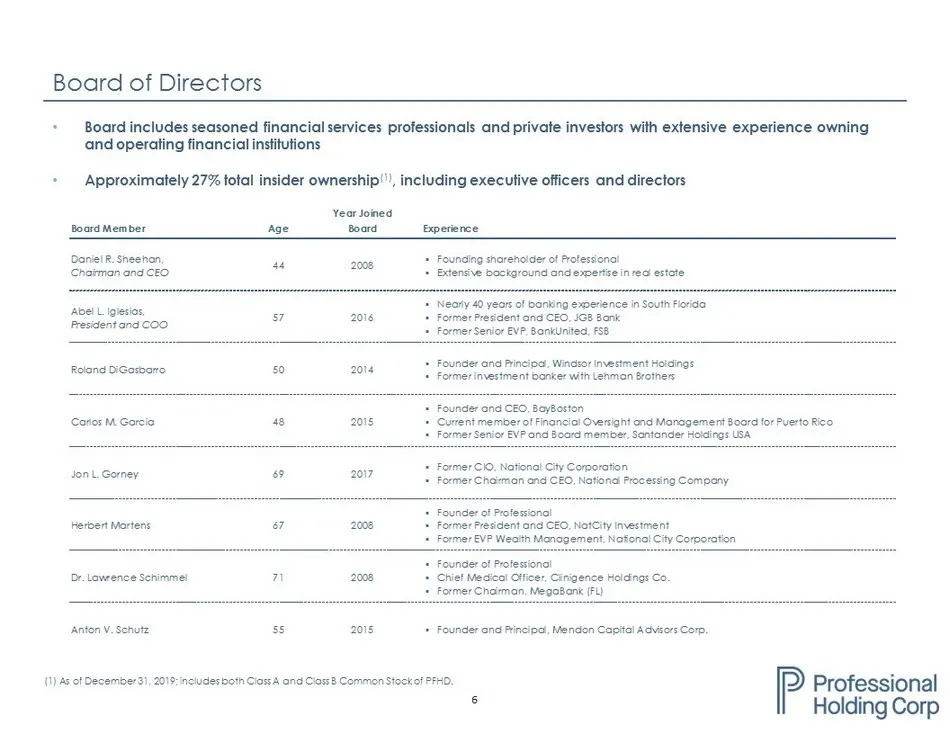
6 Board of Directors (1) As of December 31, 2019; includes both Class A and Class B Common Stock of PFHD. • Board includes seasoned financial services professionals and private investors with extensive experience owning and operating financial institutions • Approximately 27% total insider ownership
Slide 7: Overview of Professional Holding Corp.
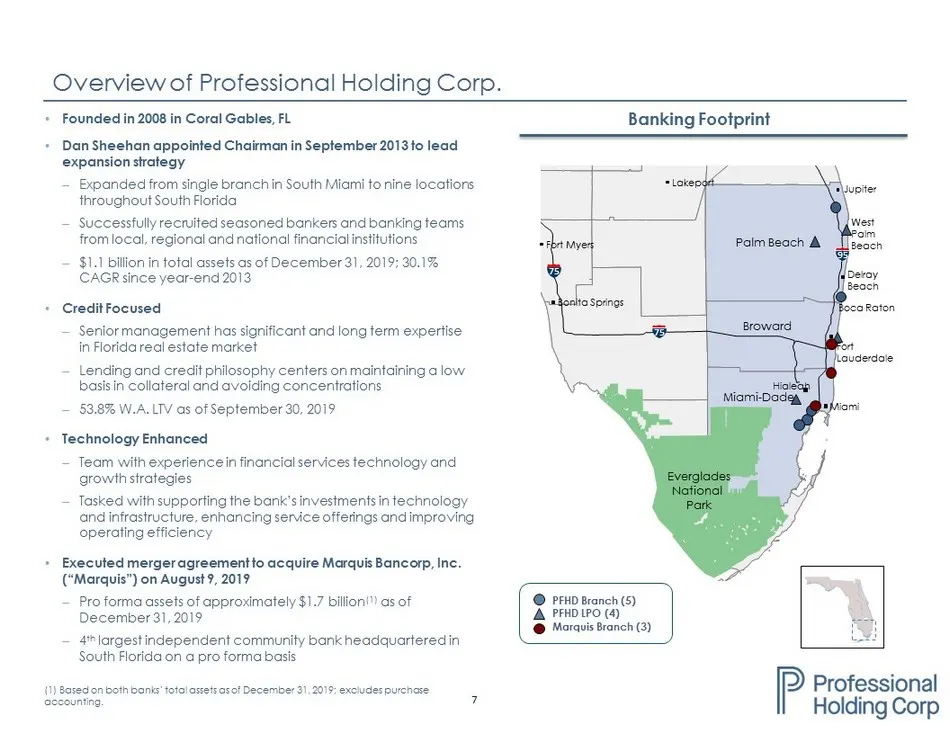
7 Fort Lauderdale Boca Raton Jupiter Bonita Springs Fort Myers West Palm Beach Delray Beach Lakeport 75 75 95 Hialeah Miami Palm Beach Broward Miami - Dade Everglades National Park Overview of Professional Holding Corp. • Founded in 2008 in Coral Gables, FL • Dan Sheehan appointed Chairman in Septem
Slide 8: Corporate History
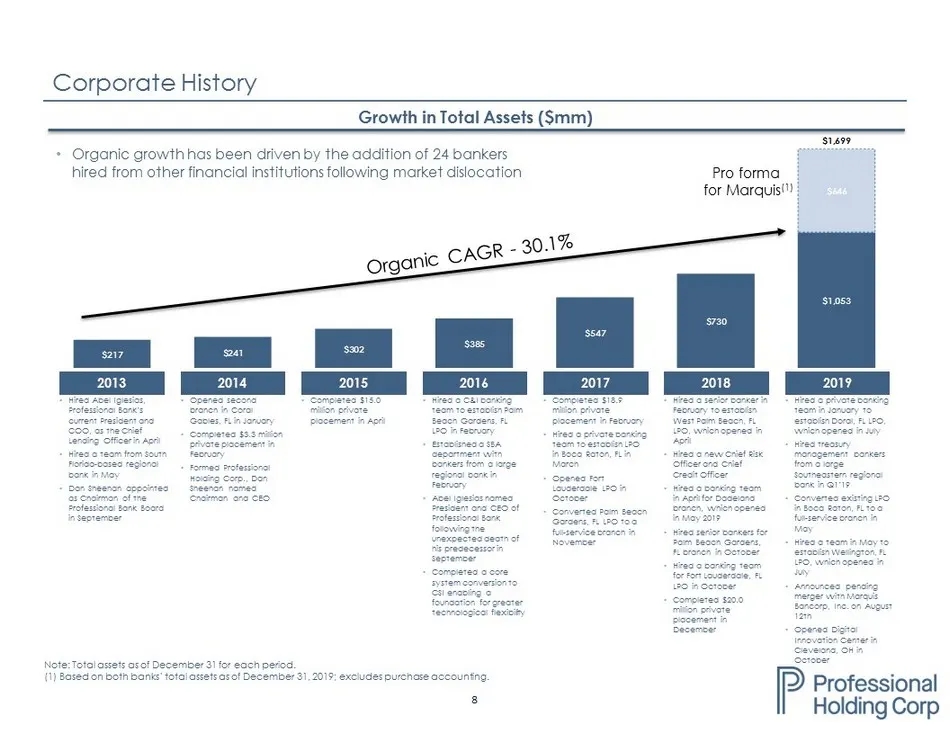
8 Corporate History Note: Total assets as of December 31 for each period. (1) Based on both banks’ tota l assets as of December 31, 2019; excludes purchase accounting. • Opened second branch in Coral Gables, FL in January • Completed $3.3 million private placement in February • Formed Professional H
Slide 9: Business Growth Strategy: Building A Premier Florida Franchise
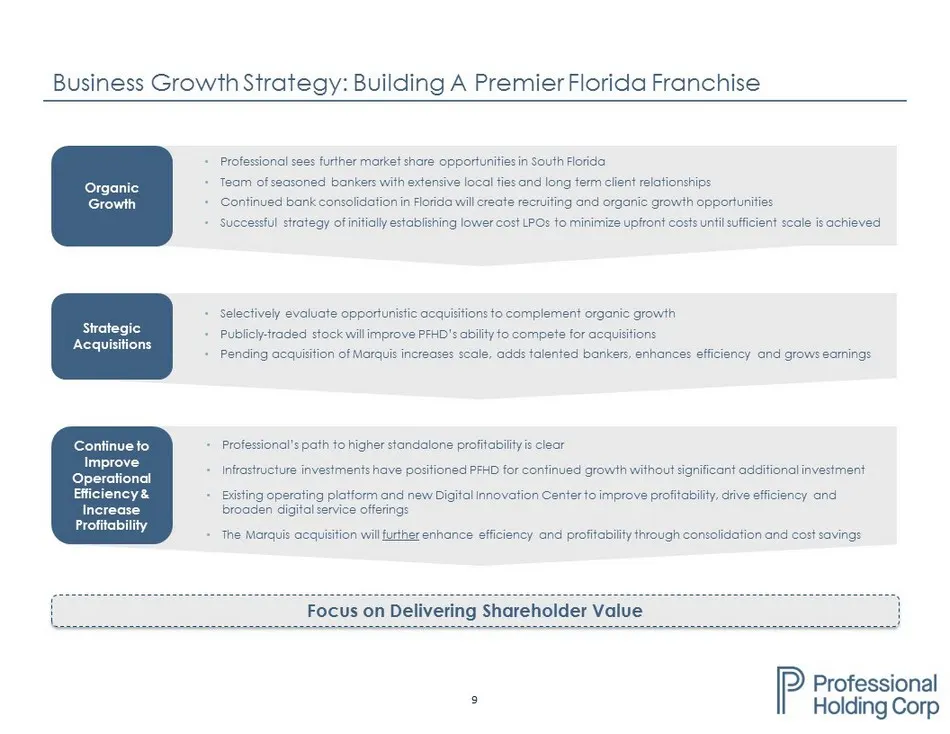
9 Business Growth Strategy: Building A Premier Florida Franchise • Professional sees further market share opportunities in South Florida • Team of seasoned bankers with extensive local ties and long term client relationships • Continued bank consolidation in Florida will create recruiting and organi
Slide 10: Miami-Dade MSA – A Leading U.S. Banking Market
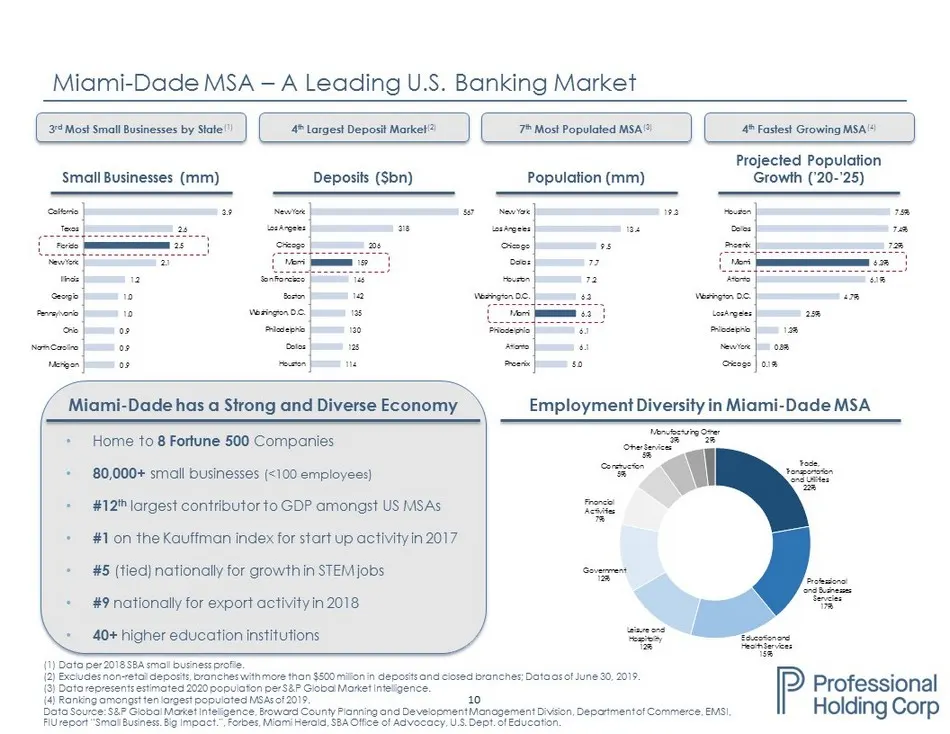
10 567 318 206 159 146 142 135 130 125 114 New York Los Angeles Chicago Miami San Francisco Boston Washington, D.C. Philadelphia Dallas Houston 19.3 13.4 9.5 7.7 7.2 6.3 6.3 6.1 6.1 5.0 New York Los Angeles Chicago Dallas Houston Washington, D.C. Miami Philadelphia Atlanta Phoenix 7.5% 7.4% 7.2% 6.3
Slide 11: Miami-Dade deposit market share ranking
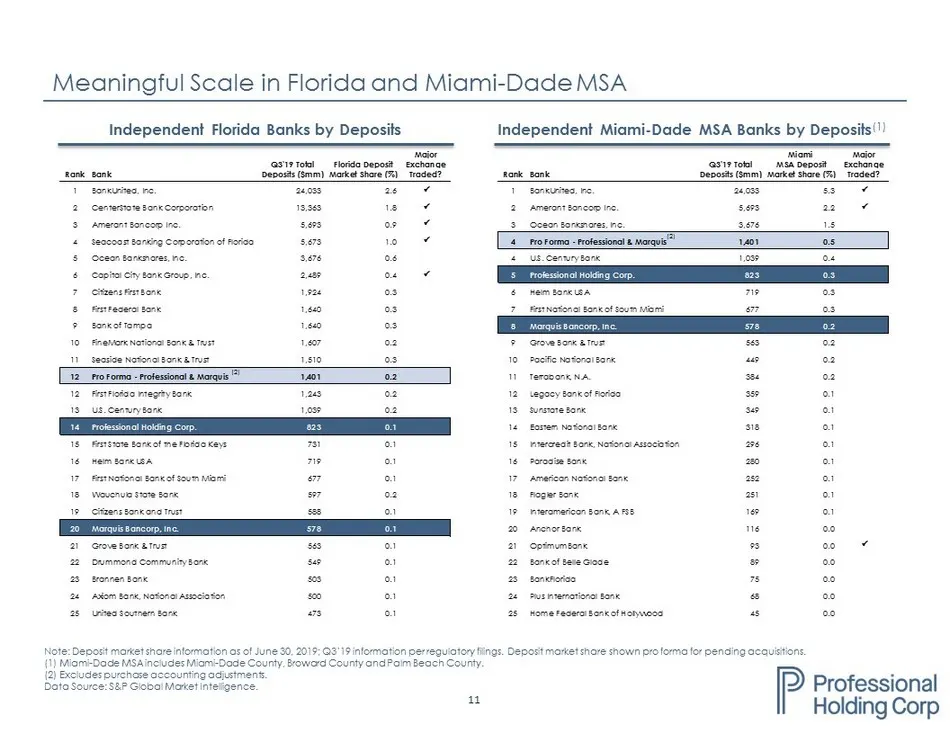
11 Miami Major Q3'19 Total MSA Deposit Exchange Rank Bank Deposits ($mm) Market Share (%) Traded? 1 BankUnited, Inc. 24,033 5.3 P 2 Amerant Bancorp Inc. 5,693 2.2 P 3 Ocean Bankshares, Inc. 3,676 1.5 4 Pro Forma - Professional & Marquis 1,401 0.5 4 U.S. Century Bank 1,039 0.4 5 Professional Holding
Slide 12: Significant Consolidation of Florida Banks Provides Growth Opportunities
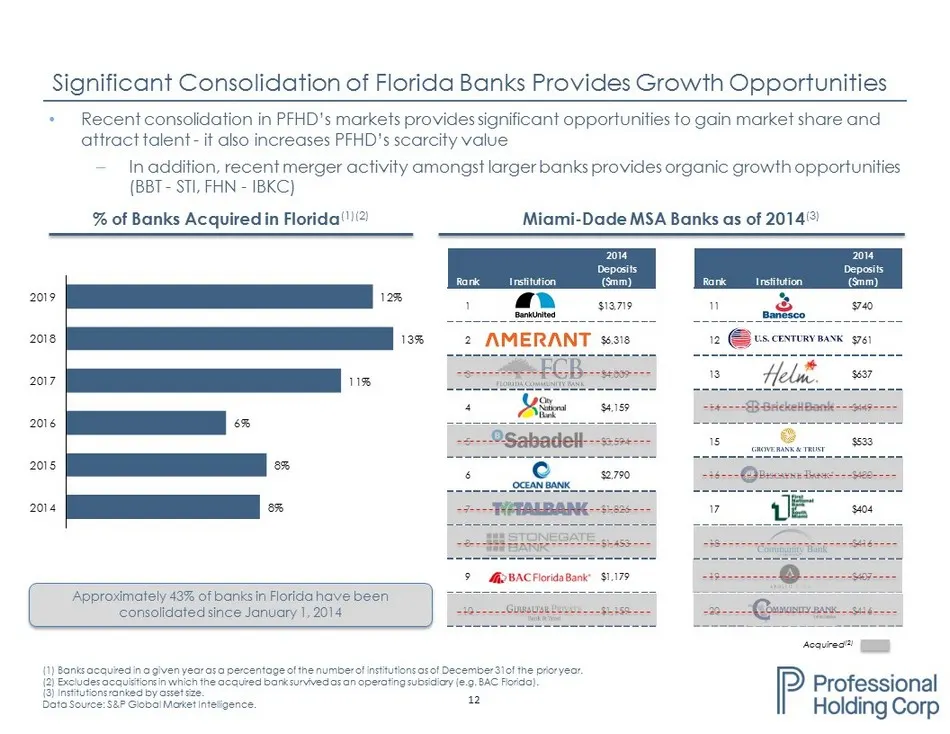
12 8% 8% 6% 11% 13% 12% 2014 2015 2016 2017 2018 2019 2014 Deposits Rank Institution ($mm) 11 $740 12 $761 13 $637 14 $449 15 $533 16 $480 17 $404 18 $416 19 $407 20 $416 Significant Consolidation of Florida Banks Provides Growth Opportunities (1) Banks acquired in a given year as a percentage of th
Slide 13: Organic Growth Strategy: Taking Advantage of Dislocation
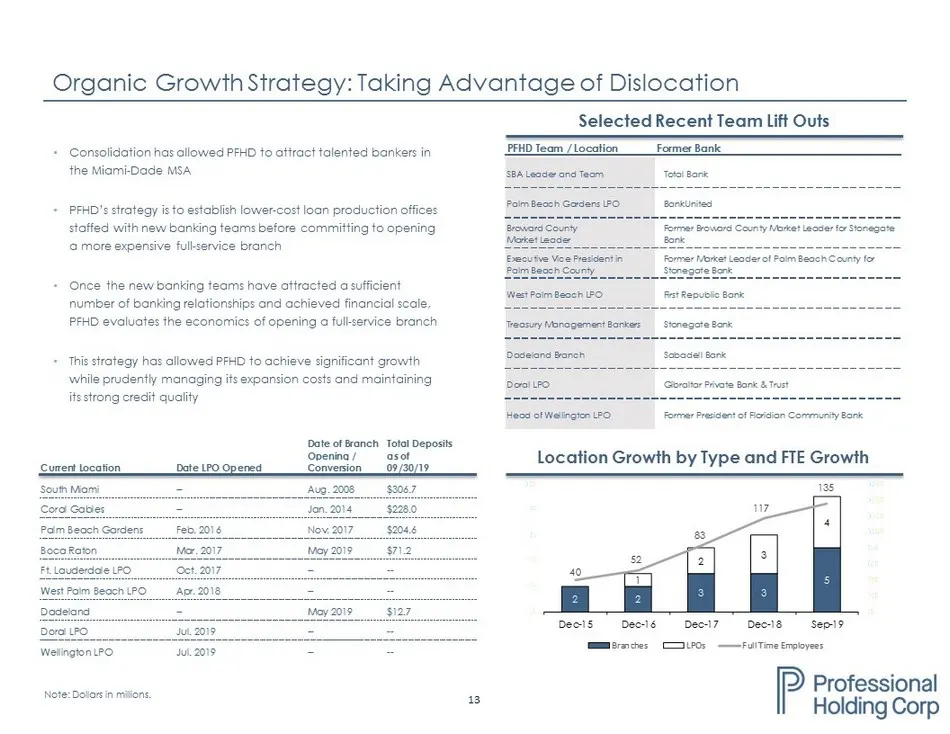
13 Organic Growth Strategy: Taking Advantage of Dislocation • Consolidation has allowed PFHD to attract talented bankers in the Miami - Dade MSA • PFHD’s strategy is to establish lower - cost loan production offices staffed with new banking teams before committing to opening a more expensive full -
Slide 14: Robust, Disciplined Organic Loan Growth
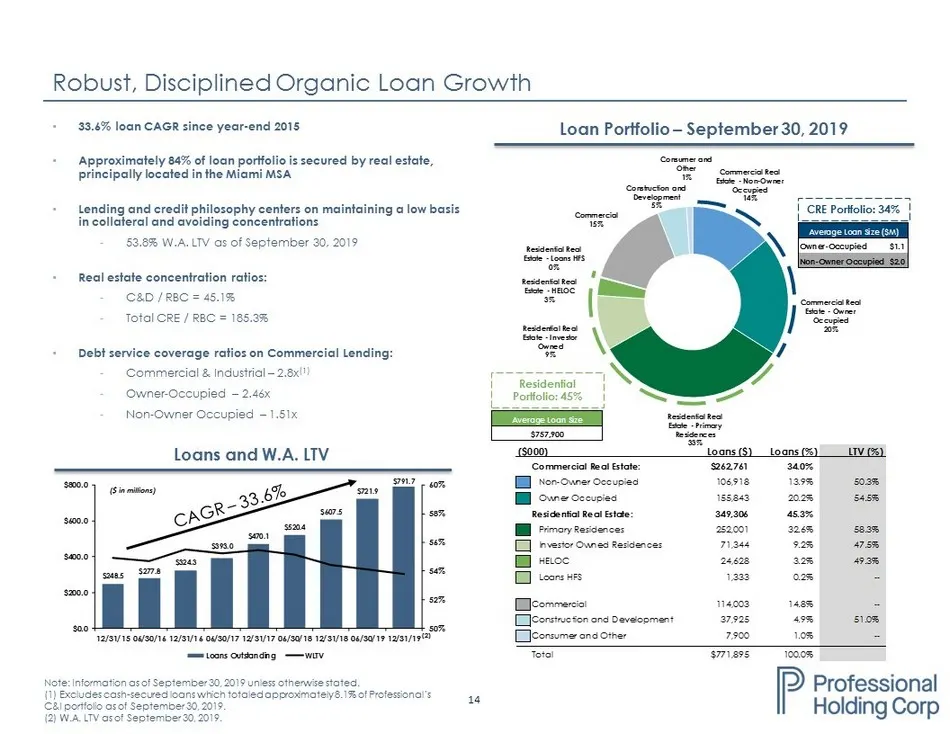
14 $248.5 $277.8 $324.3 $393.0 $470.1 $520.4 $607.5 $721.9 $791.7 50% 52% 54% 56% 58% 60% $0.0 $200.0 $400.0 $600.0 $800.0 12/31/15 06/30/16 12/31/16 06/30/17 12/31/17 06/30/18 12/31/18 06/30/19 12/31/19 Loans Outstanding WLTV Robust, Disciplined Organic Loan Growth • 33.6% loan CAGR since year - en
Slide 15: Asset Quality Managed Through Disciplined Policies and Procedures
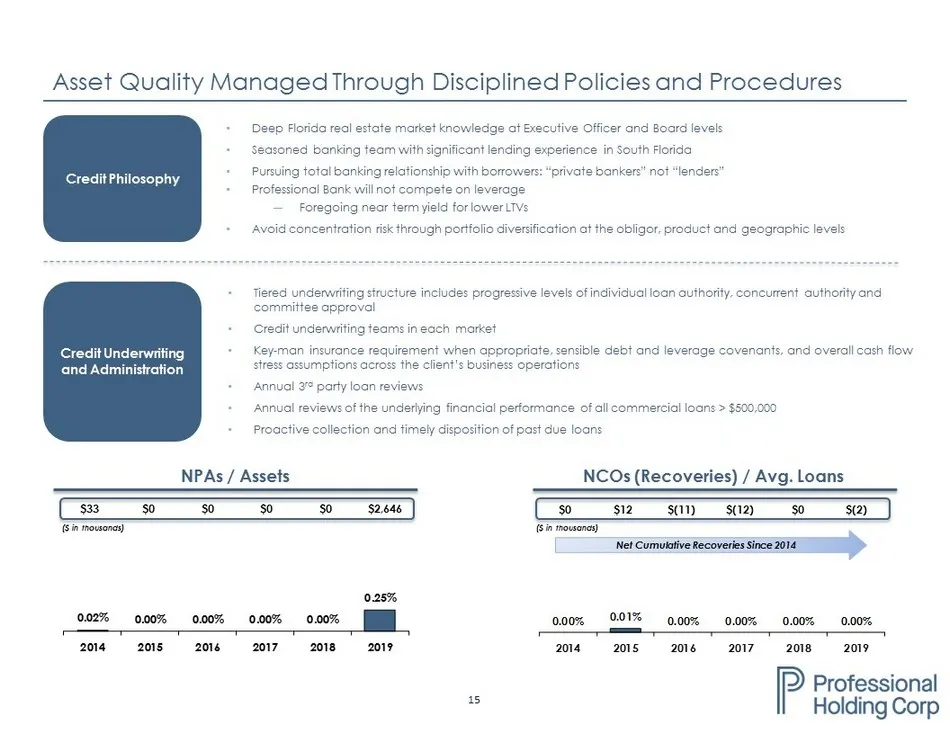
15 0.00% 0.01% 0.00% 0.00% 0.00% 0.00% 2014 2015 2016 2017 2018 2019 Asset Quality Managed Through Disciplined Policies and Procedures 0.02% 0.00% 0.00% 0.00% 0.00% 0.25% 2014 2015 2016 2017 2018 2019 Credit Philosophy Credit Underwriting and Administration • Deep Florida real estate market knowledg
Slide 16: Growing Core Deposit Franchise
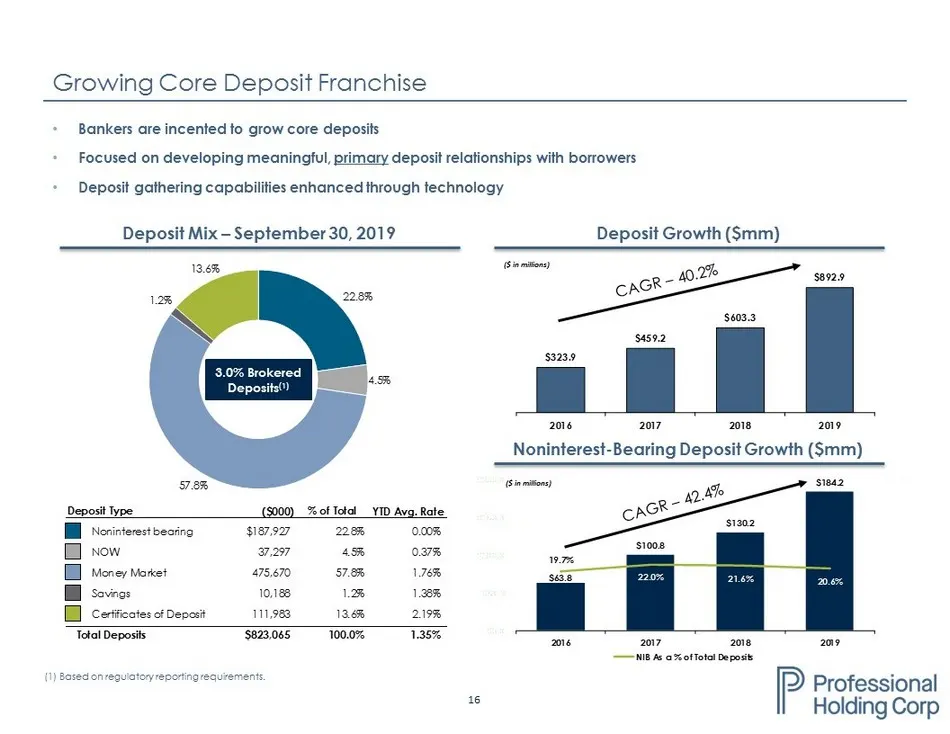
16 $63.8 $100.8 $130.2 $184.2 19.7% 22.0% 21.6% 20.6% 0.0% 10.0% 20.0% 30.0% 40.0% 50.0% $0.0 $50.0 $100.0 $150.0 $200.0 2016 2017 2018 2019 NIB As a % of Total Deposits $323.9 $459.2 $603.3 $892.9 2016 2017 2018 2019 Growing Core Deposit Franchise • Bankers are incented to grow core deposits • Focu
Slide 17: Asset Liability Management and Net Interest Margin Trends
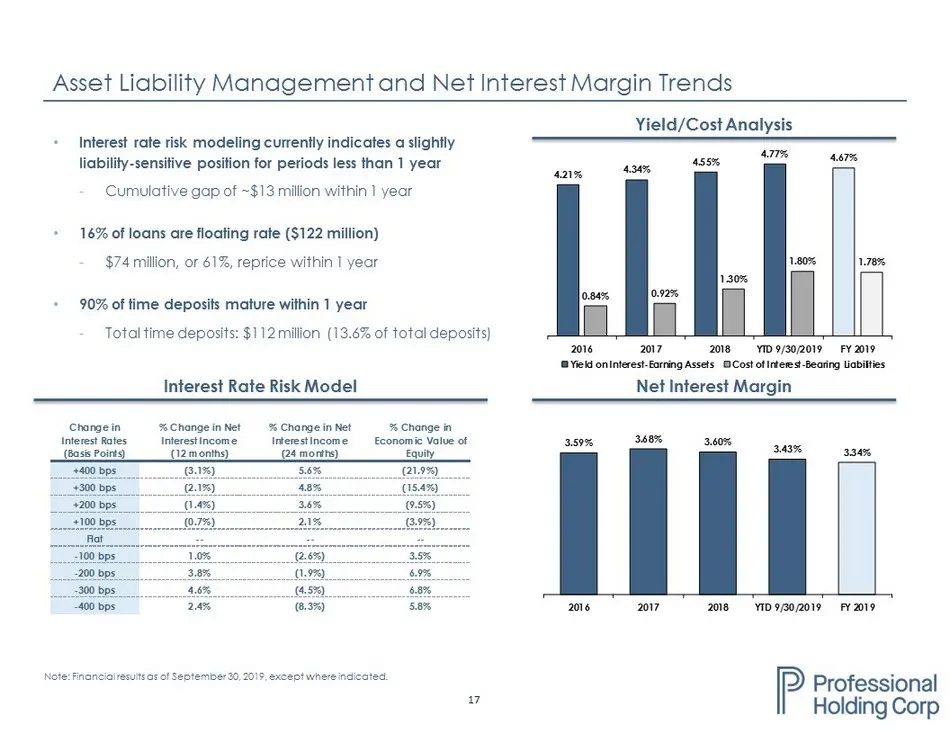
17 4.21% 4.34% 4.55% 4.77% 4.67% 0.84% 0.92% 1.30% 1.80% 1.78% 2016 2017 2018 YTD 9/30/2019 FY 2019 Yield on Interest-Earning Assets Cost of Interest-Bearing Liabilities Note: Financial results as of September 30, 2019, except where indicated . • Interest rate risk modeling currently indicates a sli
Slide 18: Digital Innovation Center and technology
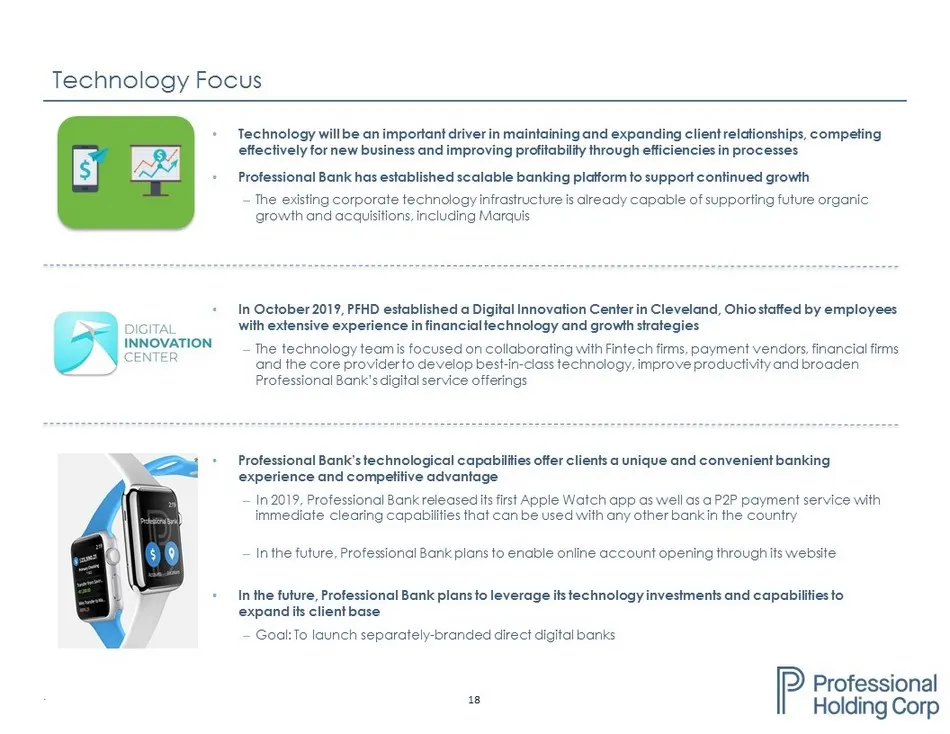
18 • In October 2019, PFHD established a Digital Innovation Center in Cleveland, Ohio staffed by employees with extensive experience in financial technology and growth strategies ‒ The technology team is focused on collaborating with Fintech firms, payment vendors, financial firms and the core provi
Slide 19: Recent Developments - 2019 Financial Results
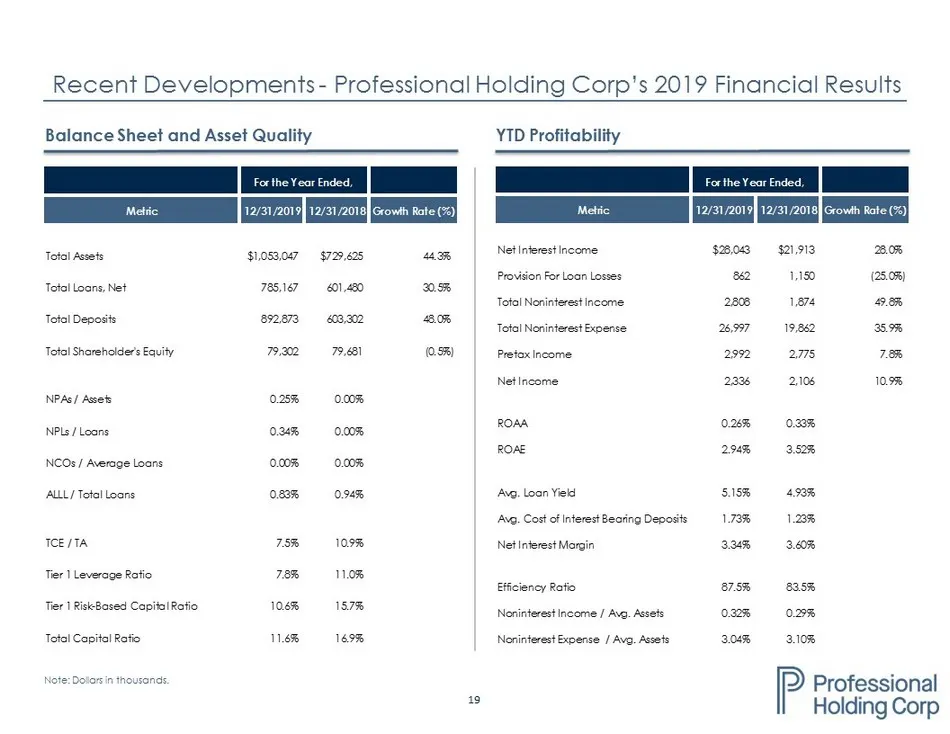
19 Recent Developments - Professional Holding Corp’s 2019 Financial Results Note: Dollars in thousands. Balance Sheet and Asset Quality YTD Profitability For the Year Ended, Metric 12/31/2019 12/31/2018 Growth Rate (%) Total Assets $1,053,047 $729,625 44.3% Total Loans, Net 785,167 601,480 30.5% Tot
Slide 20: Efficiency and profitability trends
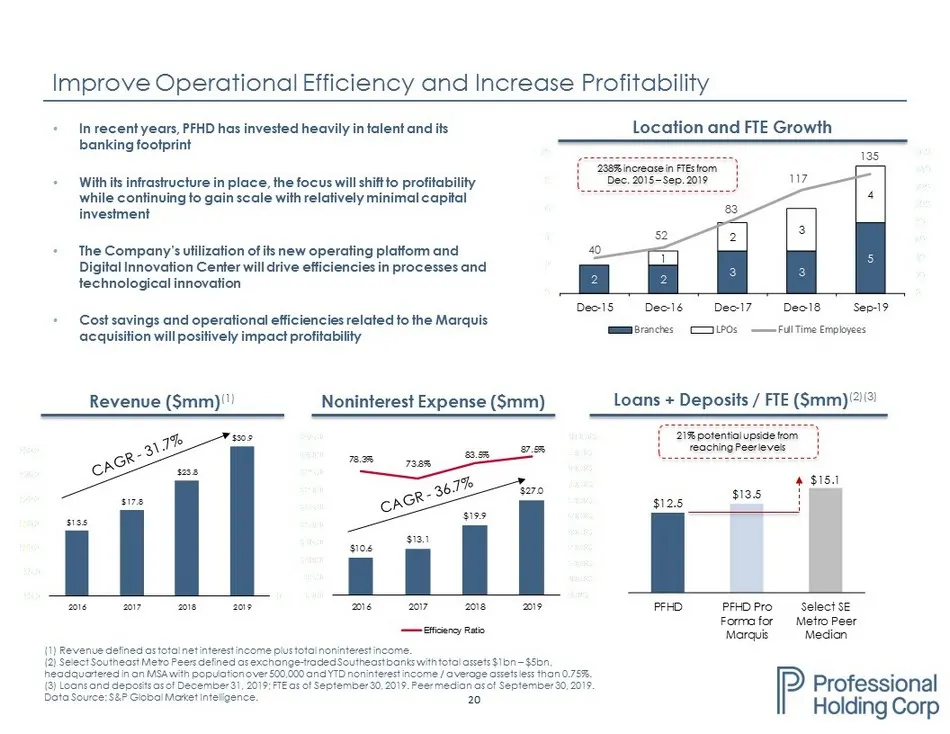
20 $10.6 $13.1 $19.9 $27.0 78.3% 73.8% 83.5% 87.5% 0.0% 10.0% 20.0% 30.0% 40.0% 50.0% 60.0% 70.0% 80.0% 90.0% 100.0% $0.0 $5.0 $10.0 $15.0 $20.0 $25.0 $30.0 $35.0 $40.0 $45.0 2016 2017 2018 2019 Efficiency Ratio $12.5 $13.5 $15.1 PFHD PFHD Pro Forma for Marquis Select SE Metro Peer Median 2 2 3 3 5
Slide 21: Overview of Marquis Bancorp, Inc.
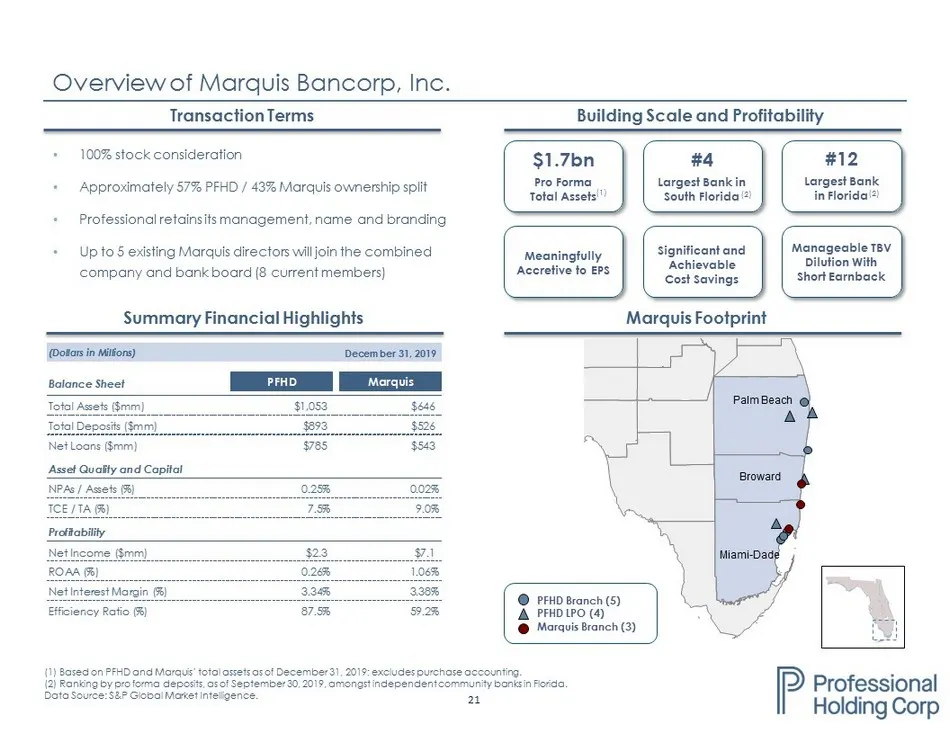
21 • 100% stock consideration • Approximately 57% PFHD / 43% Marquis ownership split • Professional retains its management, name and branding • Up to 5 existing Marquis directors will join the combined company and bank board (8 current members) Overview of Marquis Bancorp, Inc. Building Scale and Pr
Slide 22: Diverse Pro-Forma Loan and Deposit Mix
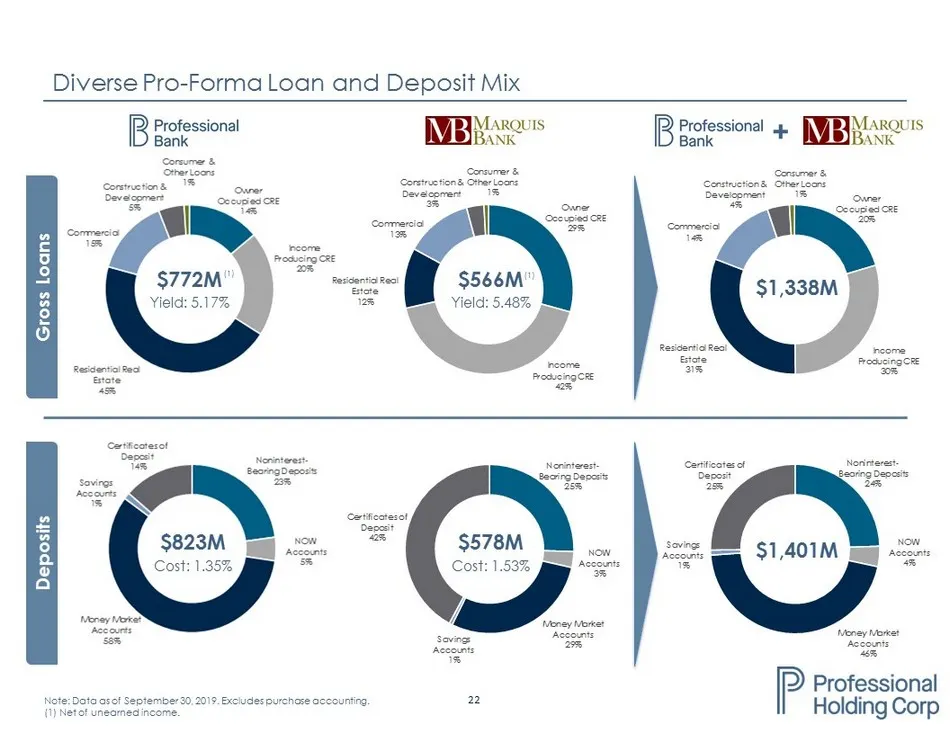
22 Noninterest - Bearing Deposits 23% NOW Accounts 5% Money Market Accounts 58% Savings Accounts 1% Certificates of Deposit 14% Owner Occupied CRE 20% Income Producing CRE 30% Residential Real Estate 31% Commercial 14% Construction & Development 4% Consumer & Other Loans 1% Owner Occupied CRE 29% In
Slide 23: Scarcity Value & Opportunities for Future Strategic Acquisitions
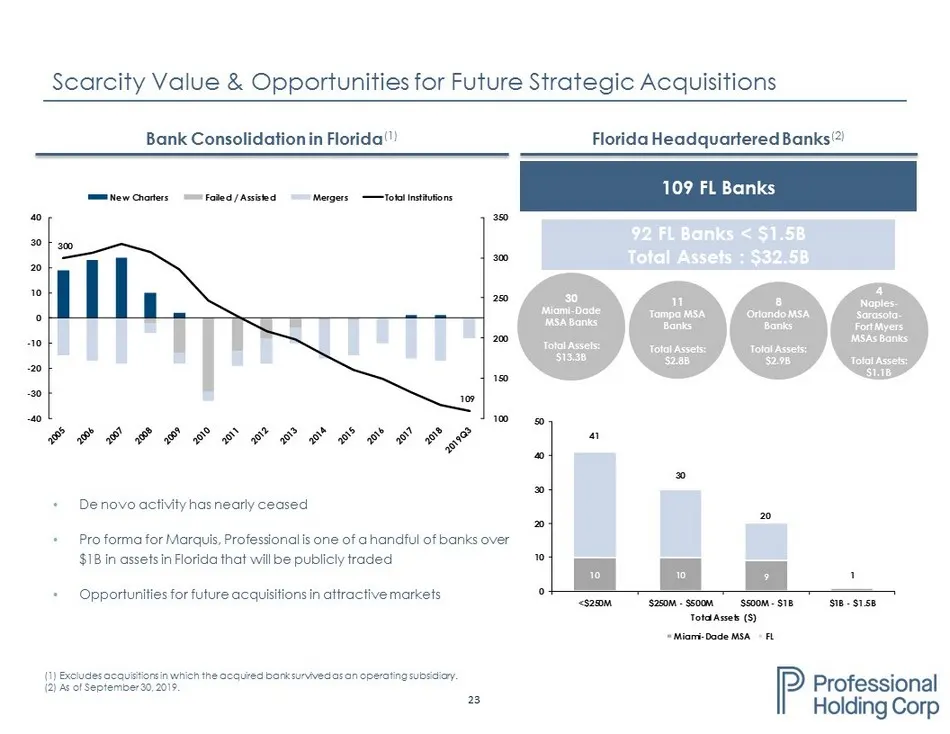
23 Scarcity Value & Opportunities for Future Strategic Acquisitions (1) Excludes acquisitions in which the acquired bank survived as an operating subsidiary. (2) As of September 30 , 2019. Bank Consolidation in Florida (1) 300 109 100 150 200 250 300 350 -40 -30 -20 -10 0 10 20 30 40 New Charters Fa
Slide 24: Investment Highlights
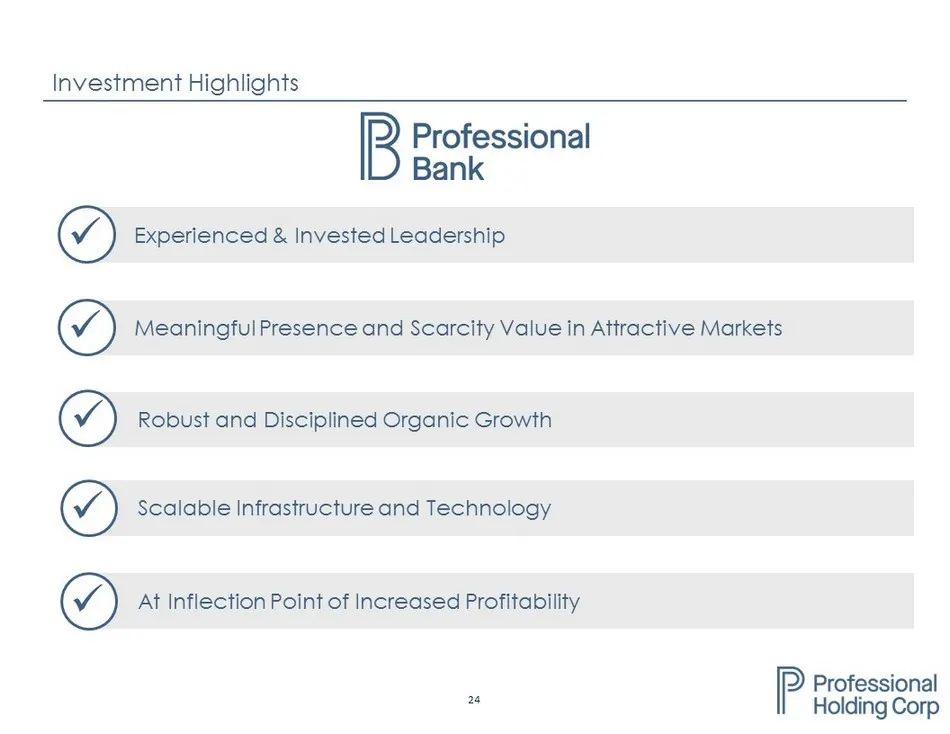
24 Meaningful Presence and Scarcity Value in Attractive Markets x Scalable Infrastructure and Technology x Robust and Disciplined Organic Growth x Investment Highlights Experienced & Invested Leadership x At Inflection Point of Increased Profitability x
Slide 25: Appendix
25 Appendix
Slide 26: Historical Financial Summary – Professional Holding Corp.
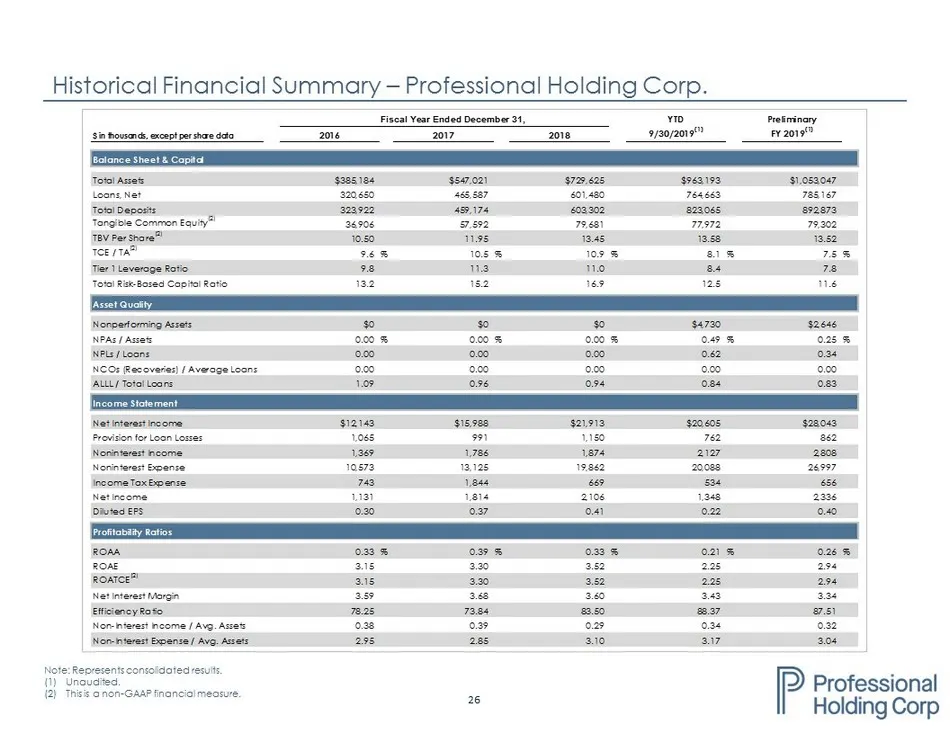
26 Historical Financial Summary – Professional Holding Corp. Note: Represents consolidated results. (1) Unaudited. (2) This is a non - GAAP financial measure. Fiscal Year Ended December 31, YTD Preliminary $ in thousands, except per share data 2016 2017 2018 9/30/2019 (1) FY 2019 (1) Balance Sheet &
Slide 27: Historical Financial Summary – Marquis Bancorp, Inc.
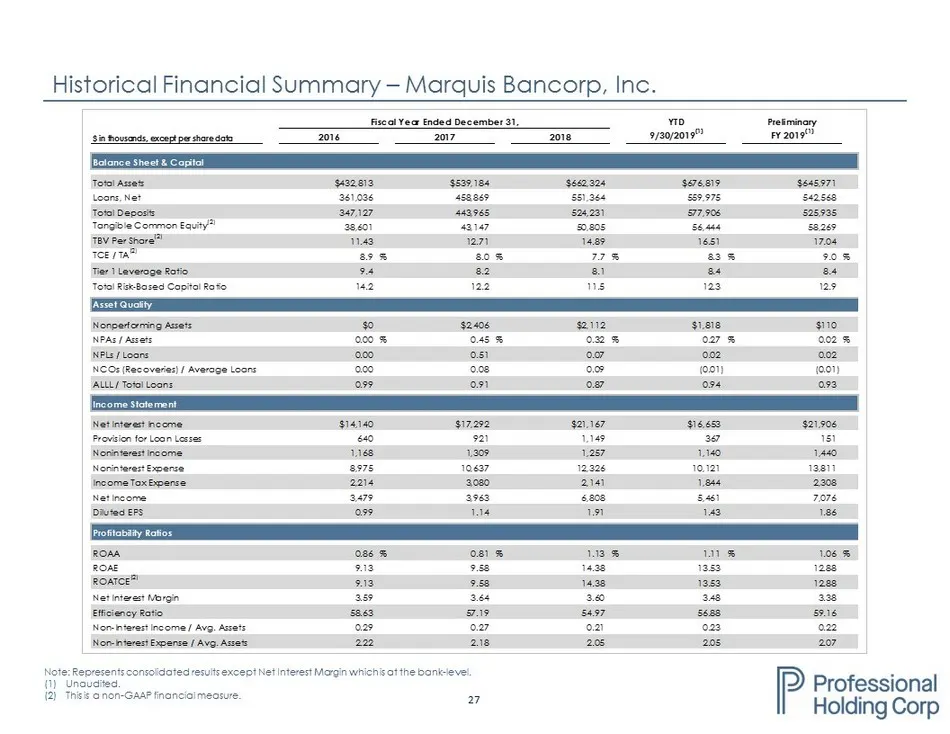
27 Historical Financial Summary – Marquis Bancorp, Inc. Note: Represents consolidated results except Net Interest Margin which is at the bank - level. (1) Unaudited. (2) This is a non - GAAP financial measure . Fiscal Year Ended December 31, YTD Preliminary $ in thousands, except per share data 2016
Slide 28: Loan Portfolio – Commercial Real Estate + Construction & Development
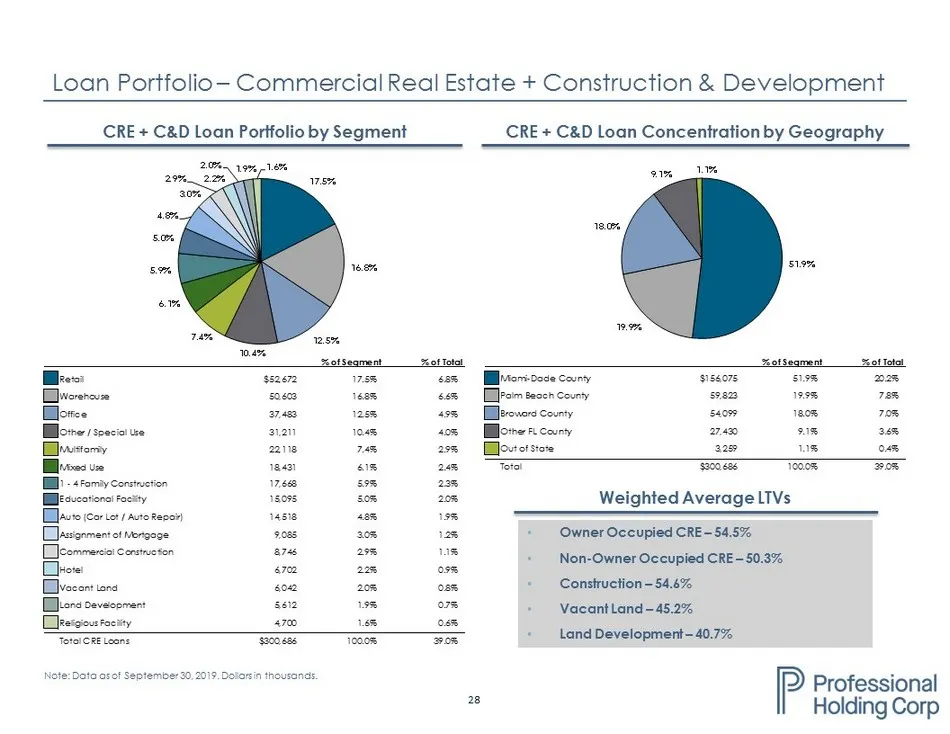
28 % of Segment % of Total Miami-Dade County $156,075 51.9% 20.2% Palm Beach County 59,823 19.9% 7.8% Broward County 54,099 18.0% 7.0% Other FL County 27,430 9.1% 3.6% Out of State 3,259 1.1% 0.4% Total $300,686 100.0% 39.0% 51.9% 19.9% 18.0% 9.1% 1.1% Loan Portfolio – Commercial Real Estate + Const
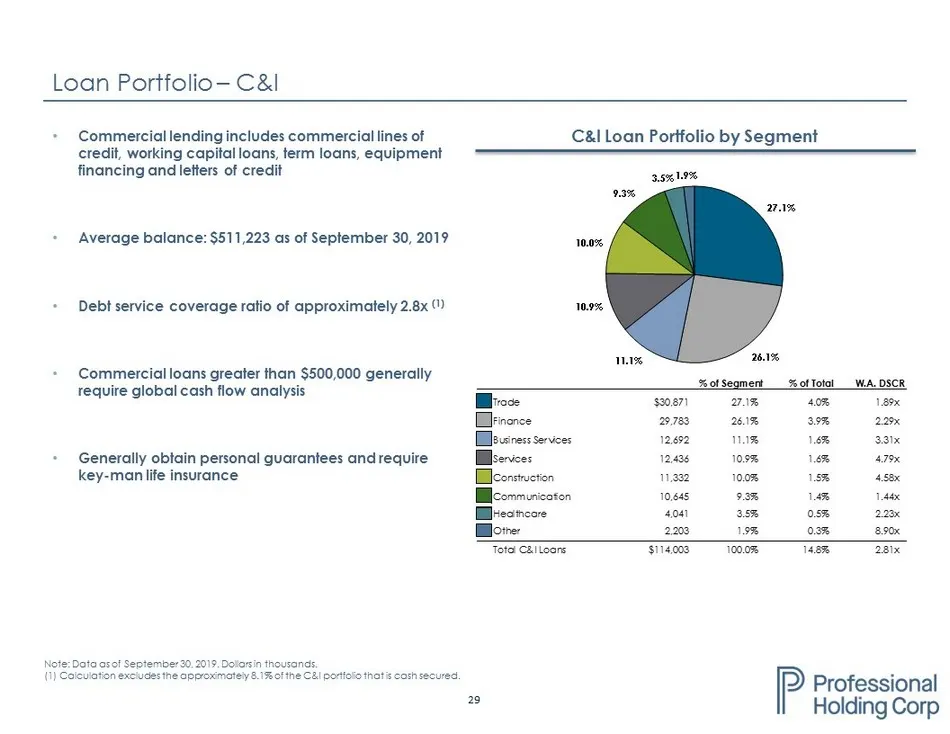
Slide 29: Loan Portfolio – C&I
29 % of Segment % of Total W.A. DSCR Trade $30,871 27.1% 4.0% 1.89x Finance 29,783 26.1% 3.9% 2.29x Business Services 12,692 11.1% 1.6% 3.31x Services 12,436 10.9% 1.6% 4.79x Construction 11,332 10.0% 1.5% 4.58x Communication 10,645 9.3% 1.4% 1.44x Healthcare 4,041 3.5% 0.5% 2.23x Other 2,203 1.9% 0
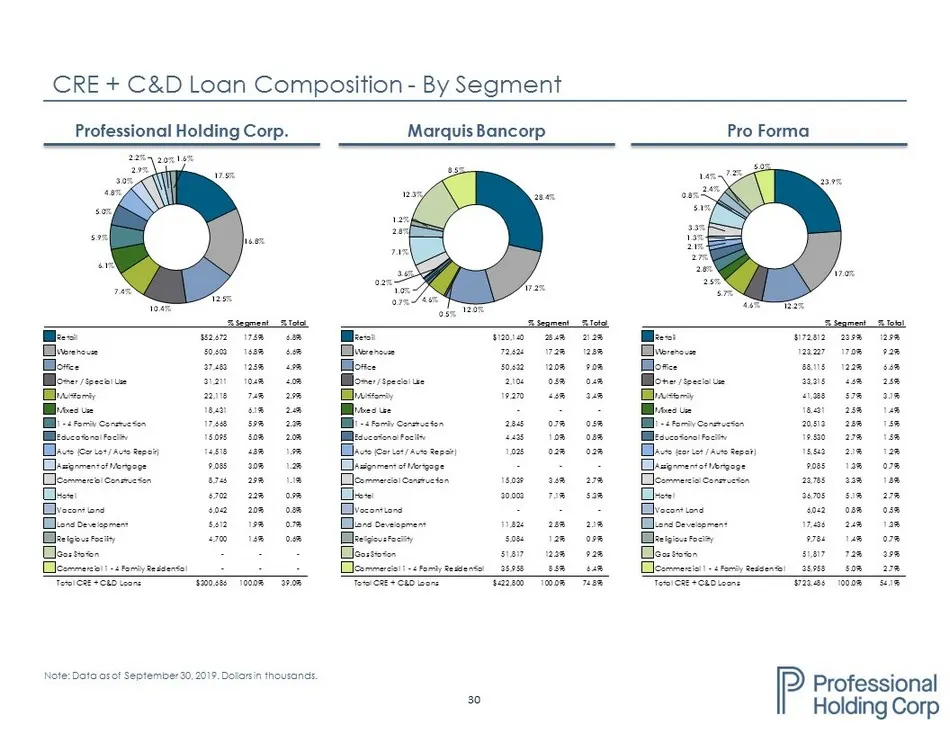
Slide 30: CRE + C&D Loan Composition - By Segment
30 CRE + C&D Loan Composition - By Segment Note: Data as of September 30, 2019. Dollars in thousands. % Segment % Total % Segment % Total % Segment % Total Retail $52,672 17.5% 6.8% Retail $120,140 28.4% 21.2% Retail $172,812 23.9% 12.9% Warehouse 50,603 16.8% 6.6% Warehouse 72,624 17.2% 12.8% Wareh
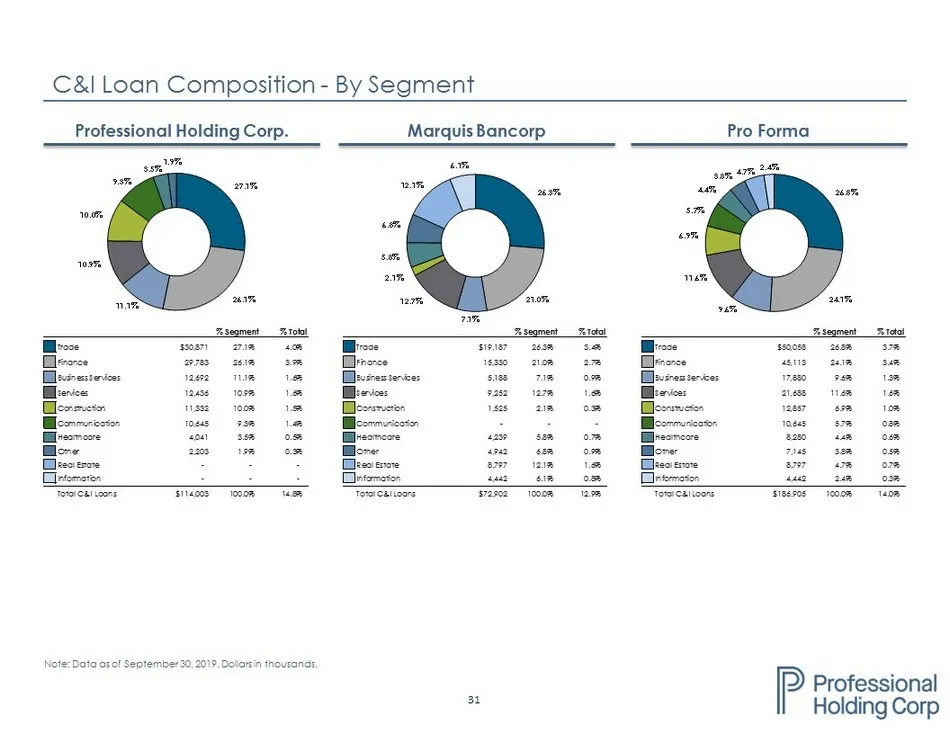
Slide 31: C&I Loan Composition - By Segment
31 C&I Loan Composition - By Segment Note: Data as of September 30, 2019. Dollars in thousands. Pro Forma Marquis Bancorp Professional Holding Corp. % Segment % Total % Segment % Total % Segment % Total Trade $30,871 27.1% 4.0% Trade $19,187 26.3% 3.4% Trade $50,058 26.8% 3.7% Finance 29,783 26.1% 3
Source: SEC EDGAR · FWP filed Jan 30, 2020
More decks from Professional Holding Corp
 Q3 2022 Earnings Presentation19 slides · Oct 28, 2022
 Q2 2022 Earnings Presentation20 slides · Jul 28, 2022
 Q1 2022 Earnings Presentation21 slides · Apr 29, 2022
 Q4 2021 Earnings Presentation19 slides · Jan 27, 2022
 Q3 2021 Earnings Presentation19 slides · Oct 28, 2021
 Q2 2021 Earnings Presentation18 slides · Jul 29, 2021