Veritex — Investor Presentation (February 2021)
30 slides from Veritex's investor presentation, Feb 2, 2021
Slide 1: Investor Presentation First Quarter 2021
Investor Presentation First Quarter 2021 Veritex Holdings, Inc.
Slide 2: Safe Harbor Statement
2 Safe Harbor Statement Forward-looking statements This presentation contains certain “forward-looking statements” within the meaning of the Private Securities Litigation Reform Act of 1995. Forward-looking statements are based on various facts and derived utilizing assumptions, current expectations
Slide 3: Non-GAAP Financial Measures
3 Non-GAAP Financial Measures Veritex reports its results in accordance with United States generally accepted accounting principles (“GAAP”). However, management believes that certain supplemental non-GAAP financial measures used in managing its business provide meaningful information to investors a
Slide 4: Franchise Overview
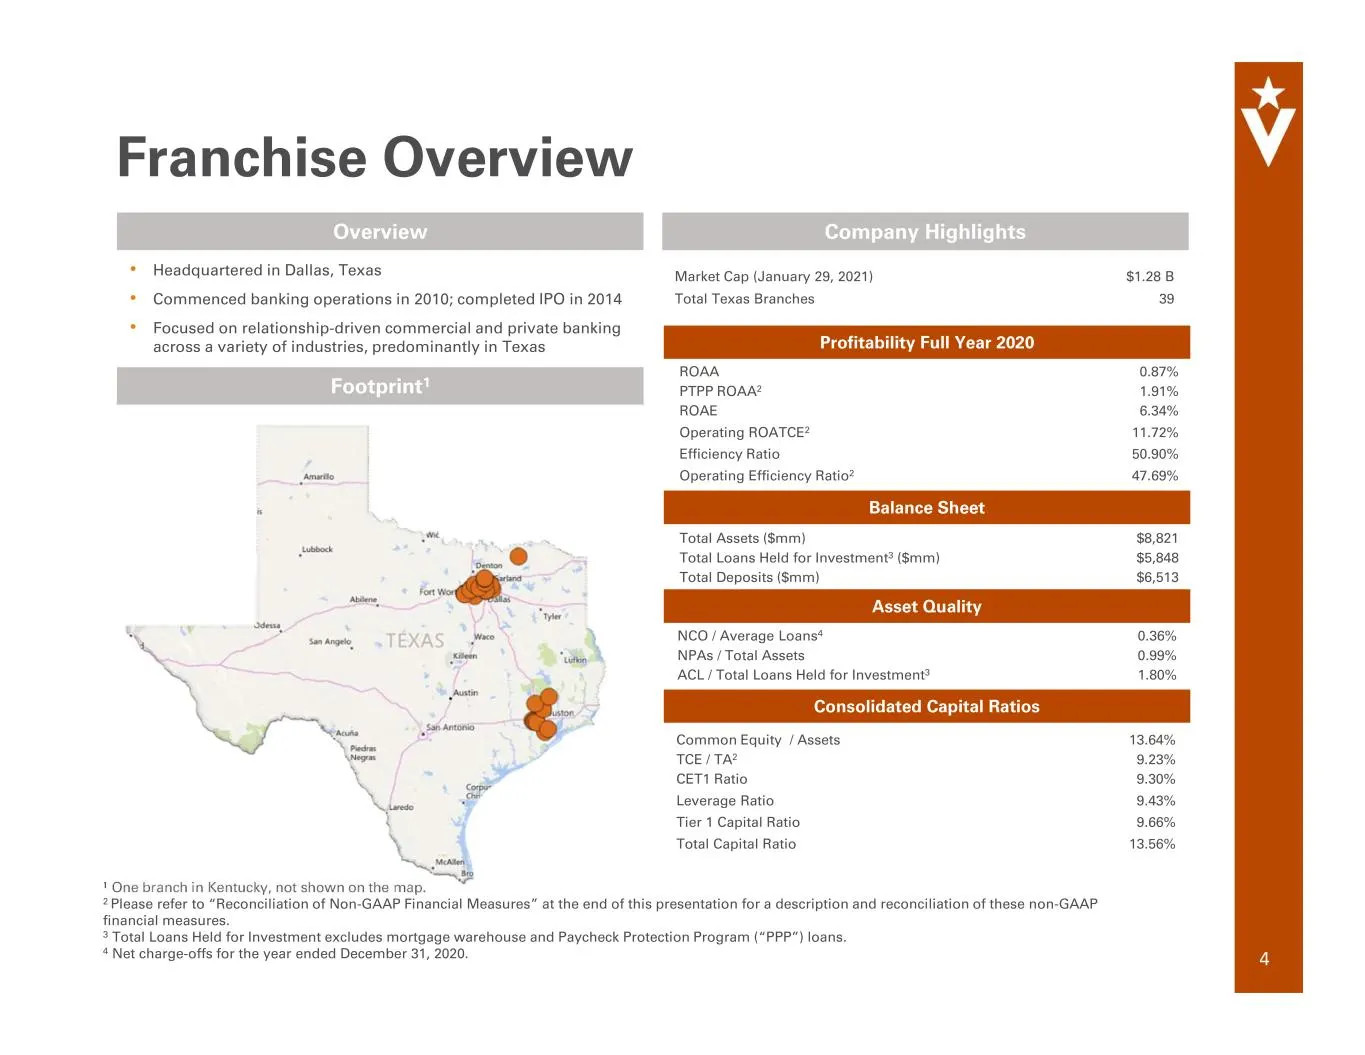
4 Franchise Overview • Headquartered in Dallas, Texas • Commenced banking operations in 2010; completed IPO in 2014 • Focused on relationship-driven commercial and private banking across a variety of industries, predominantly in Texas Overview Footprint1 Company Highlights Balance Sheet Asset Qualit
Slide 5: Franchise Overview (cont.)
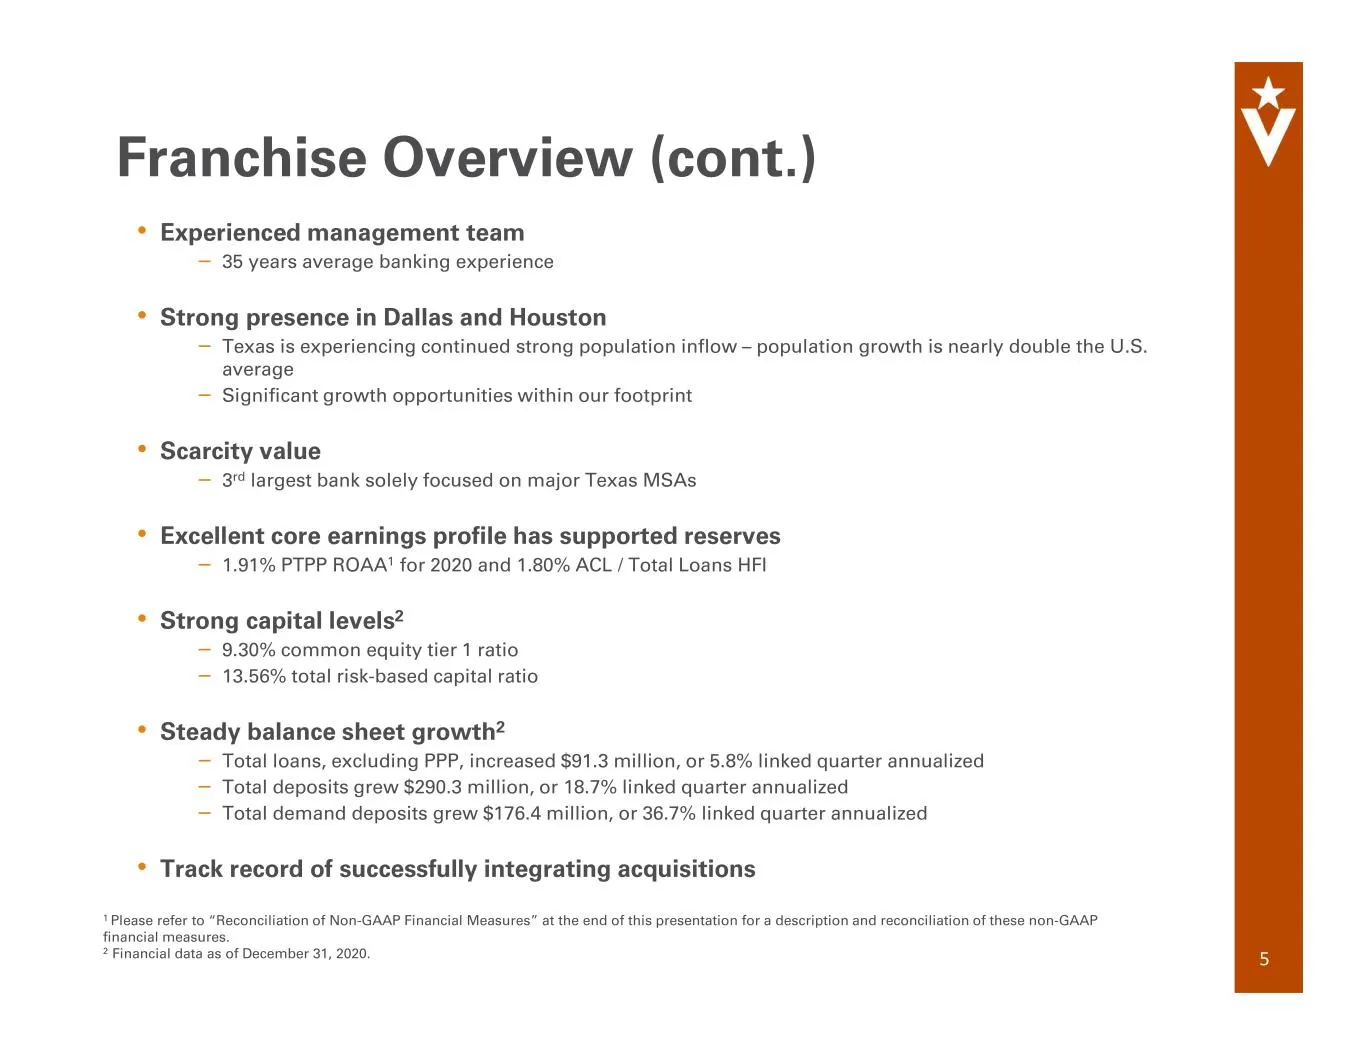
5 Franchise Overview (cont.) • Experienced management team – 35 years average banking experience • Strong presence in Dallas and Houston – Texas is experiencing continued strong population inflow – population growth is nearly double the U.S. average – Significant growth opportunities within our foot
Slide 6: Well Positioned in Attractive Texas Markets
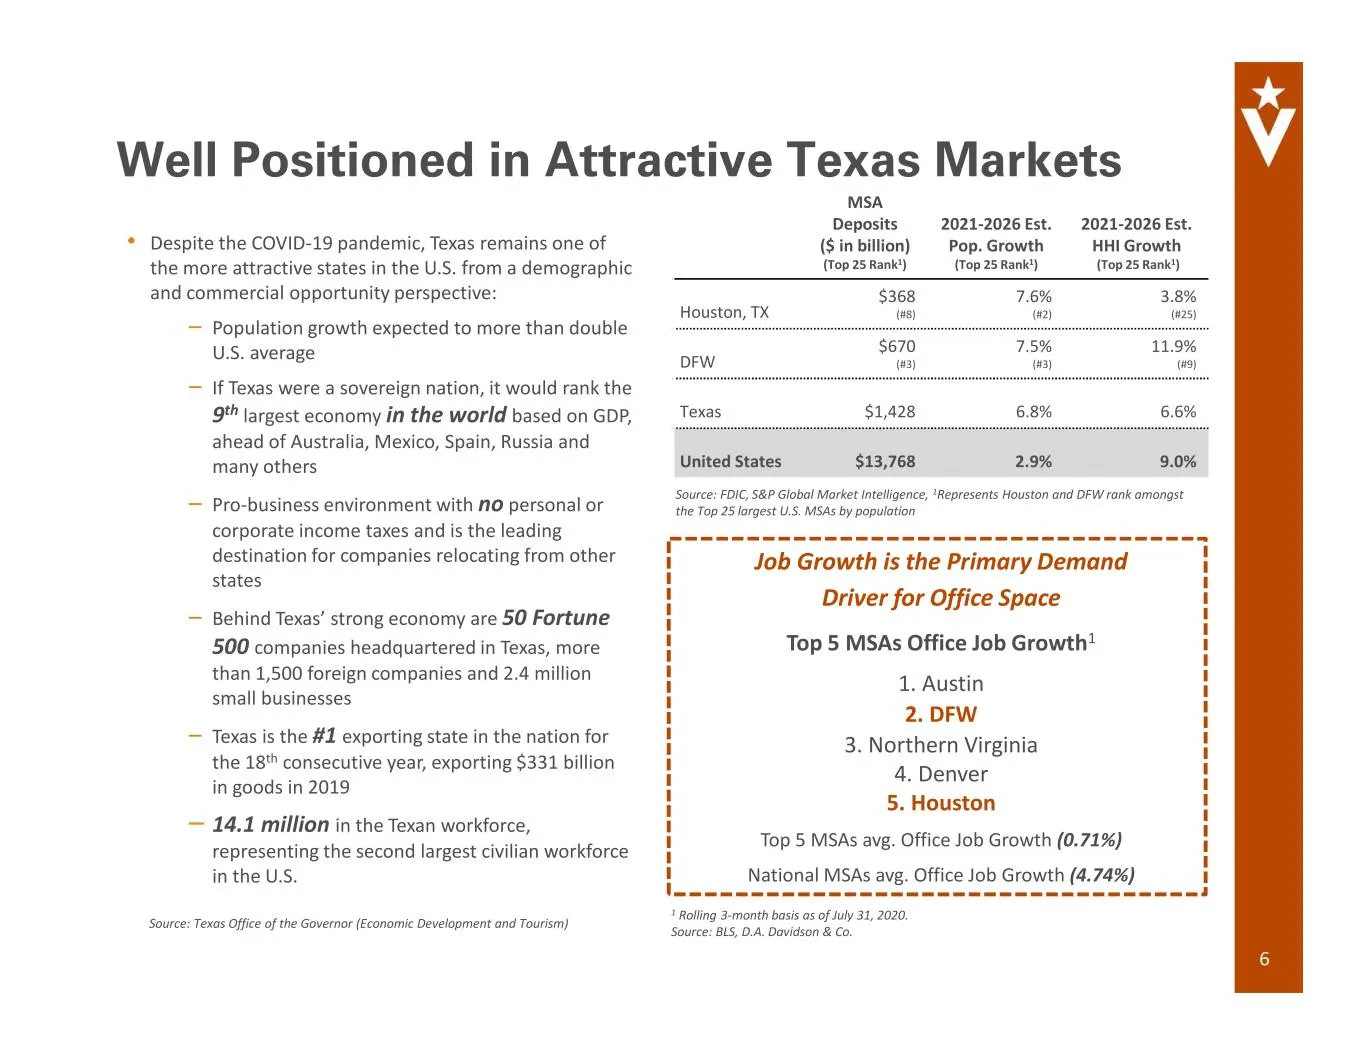
6 Well Positioned in Attractive Texas Markets • Despite the COVID-19 pandemic, Texas remains one of the more attractive states in the U.S. from a demographic and commercial opportunity perspective: – Population growth expected to more than double U.S. average – If Texas were a sovereign nation, it w
Slide 7: Well Positioned in Attractive Texas Markets
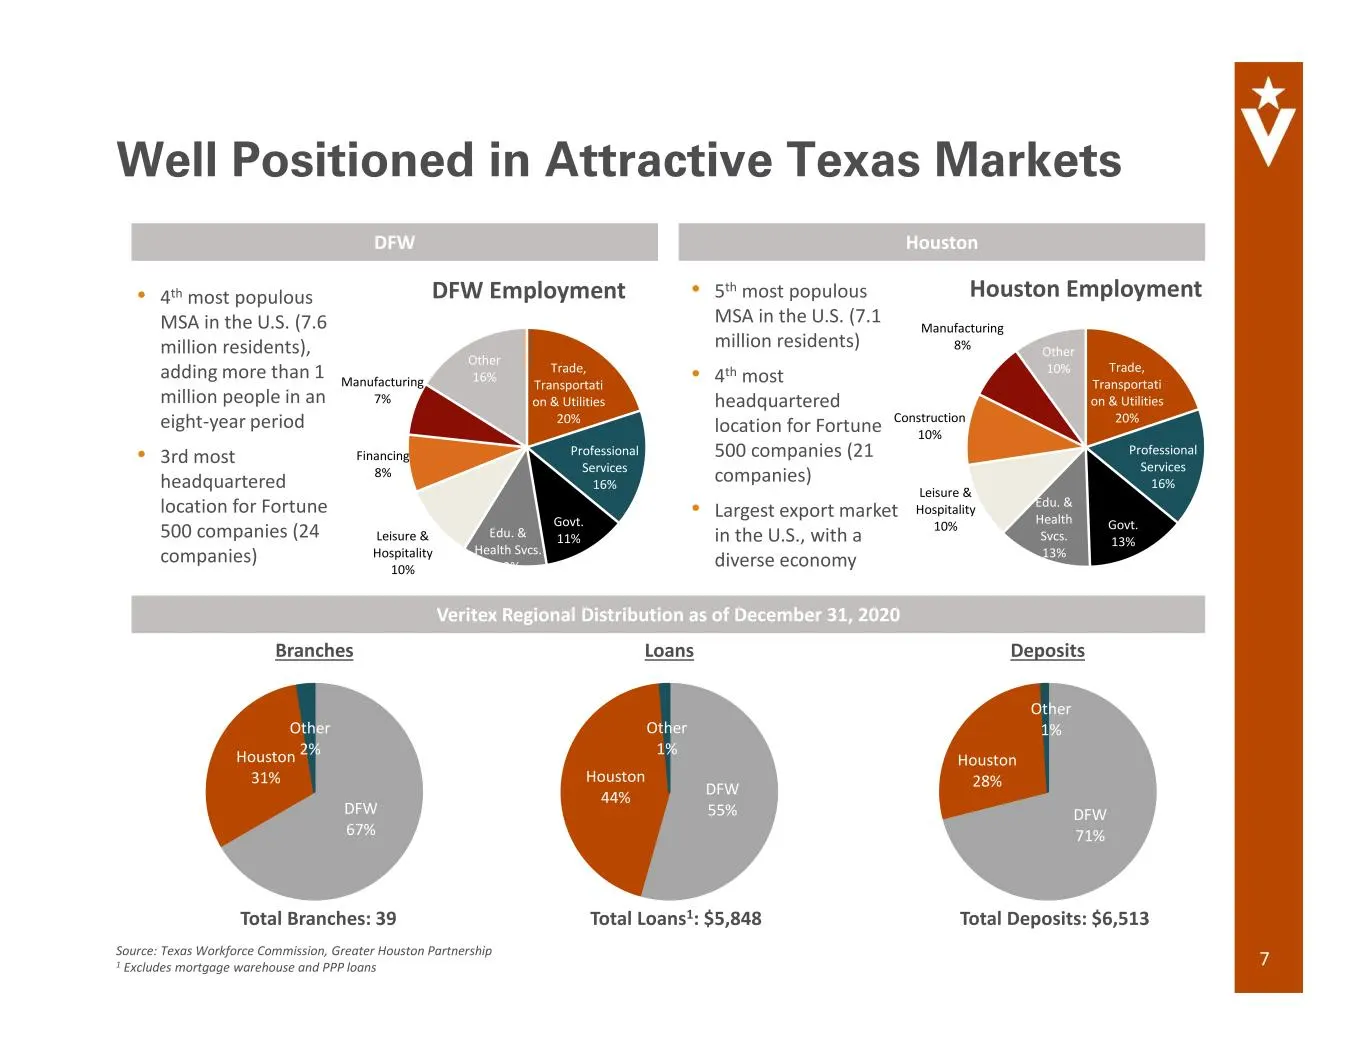
7 Well Positioned in Attractive Texas Markets DFW Houston Trade, Transportati on & Utilities 20% Professional Services 16% Govt. 13% Edu. & Health Svcs. 13% Leisure & Hospitality 10% Construction 10% Manufacturing 8% Other 10% Houston Employment• 5th most populous MSA in the U.S. (7.1 million reside
Slide 8: Well Positioned in Attractive Texas Markets
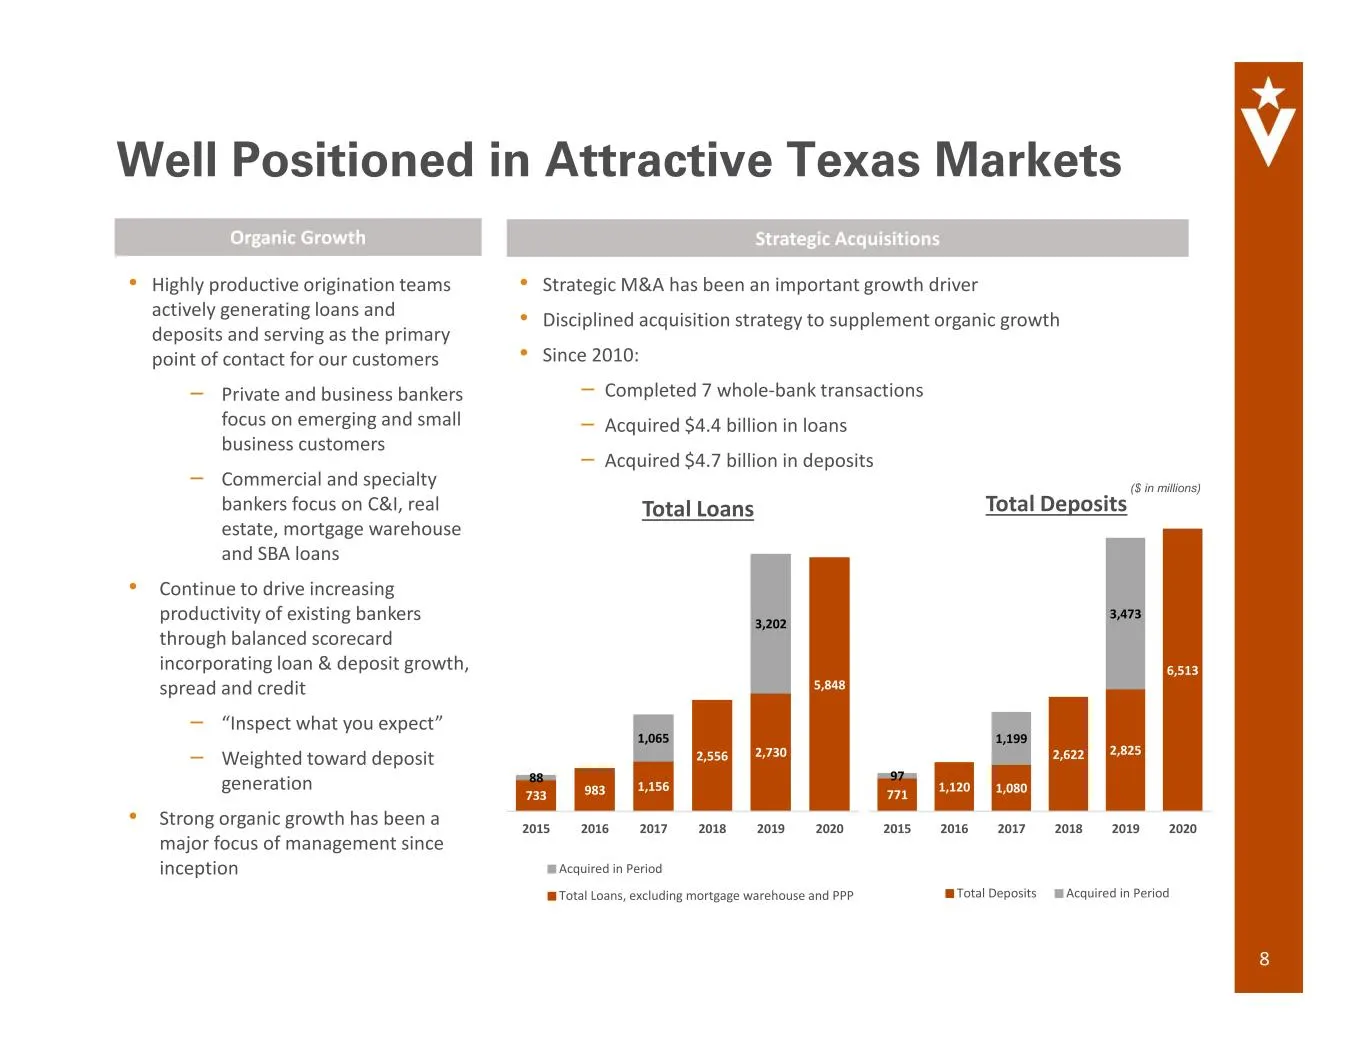
8 Well Positioned in Attractive Texas Markets Organic Growth Strategic Acquisitions • Strategic M&A has been an important growth driver • Disciplined acquisition strategy to supplement organic growth • Since 2010: – Completed 7 whole-bank transactions – Acquired $4.4 billion in loans – Acquired $4.7
Slide 9: Strong Earnings, Loan and Deposit Growth, Capital
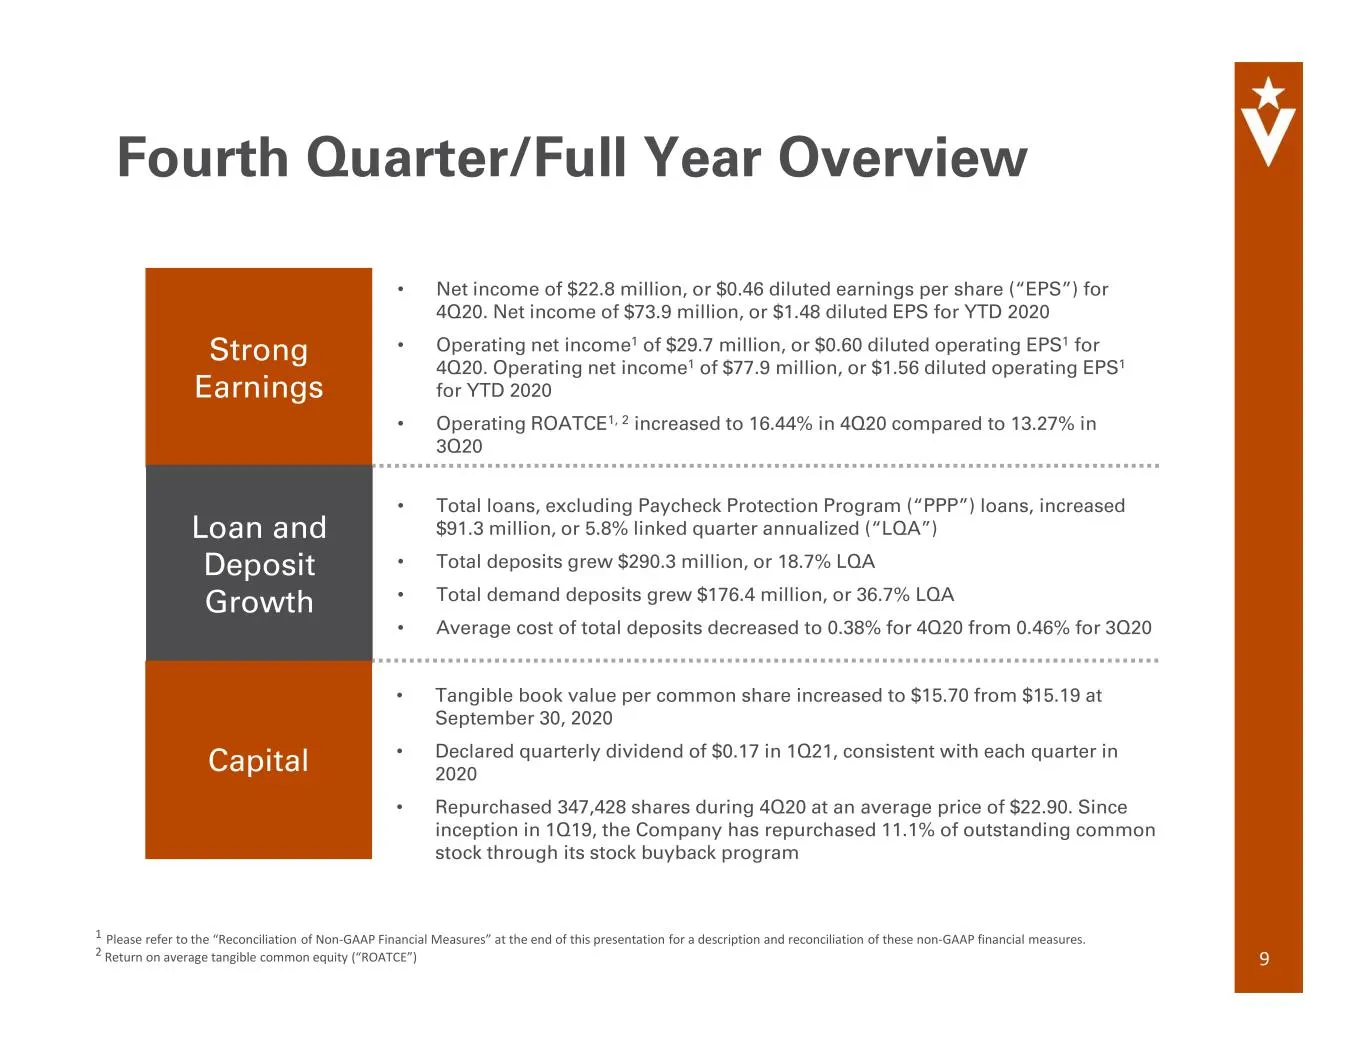
Strong Earnings Loan and Deposit Growth Capital • Net income of $22.8 million, or $0.46 diluted earnings per share (“EPS”) for 4Q20. Net income of $73.9 million, or $1.48 diluted EPS for YTD 2020 • Operating net income1 of $29.7 million, or $0.60 diluted operating EPS1 for 4Q20. Operating net income
Slide 10: Key Financial Metrics
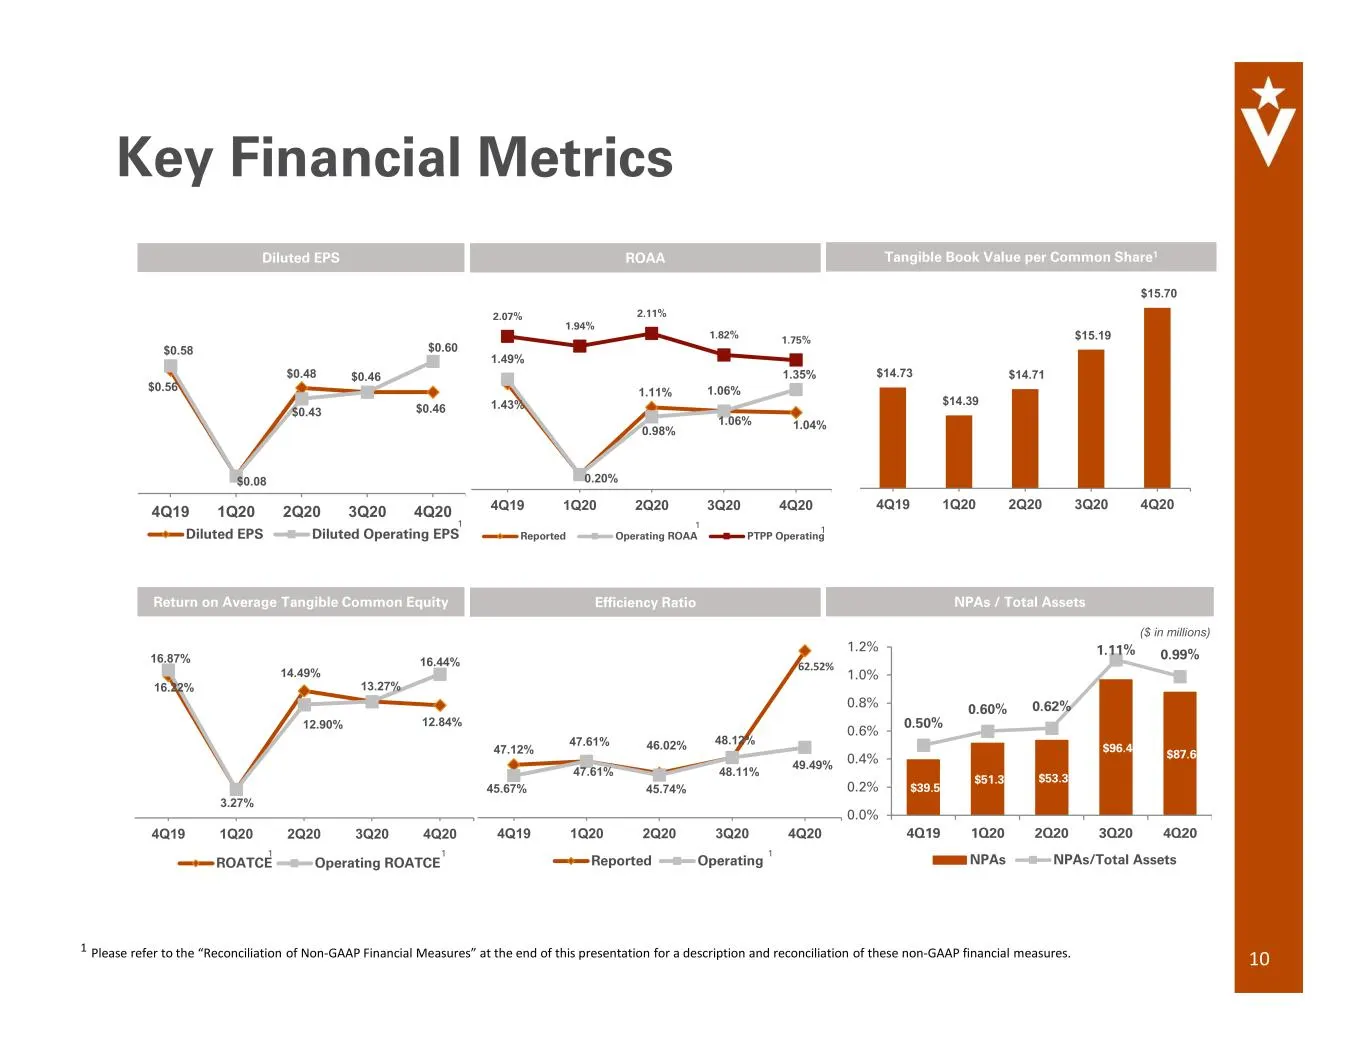
Key Financial Metrics 47.12% 47.61% 46.02% 48.12% 45.67% 47.61% 45.74% 48.11% 49.49% 4Q19 1Q20 2Q20 3Q20 4Q20 Reported Operating Efficiency Ratio 1.43% 0.20% 1.11% 1.06% 1.04% 1.49% 0.98% 1.06% 1.35% 2.07% 1.94% 2.11% 1.82% 1.75% 4Q19 1Q20 2Q20 3Q20 4Q20 Reported Operating ROAA PTPP Operating $14.73
Slide 11: Net Interest Income
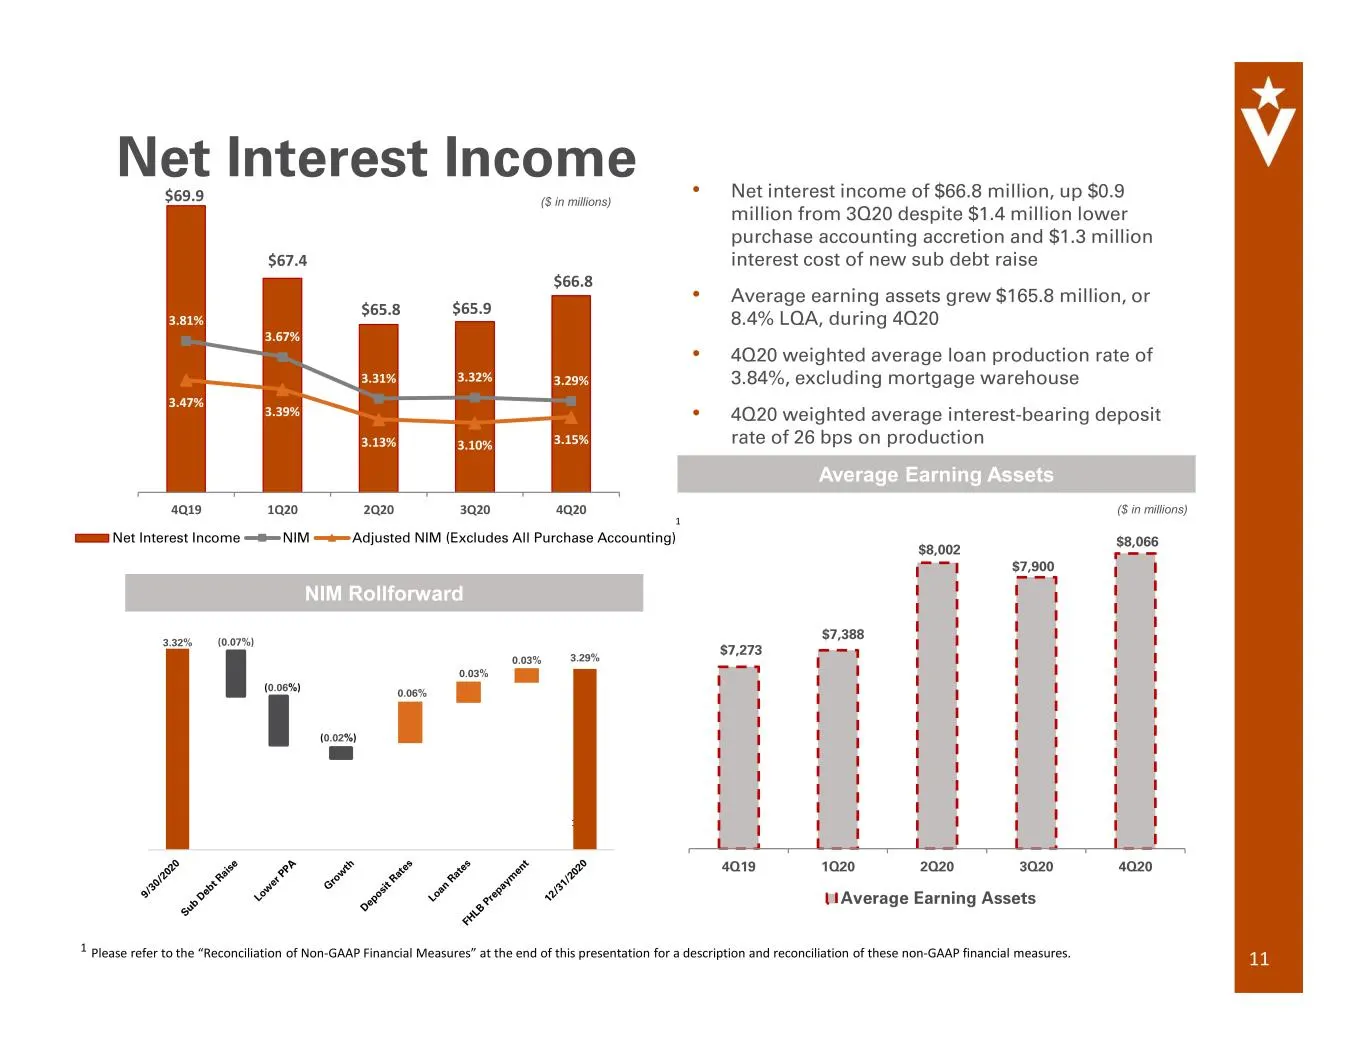
• Net interest income of $66.8 million, up $0.9 million from 3Q20 despite $1.4 million lower purchase accounting accretion and $1.3 million interest cost of new sub debt raise • Average earning assets grew $165.8 million, or 8.4% LQA, during 4Q20 • 4Q20 weighted average loan production rate of 3.84%
Slide 12: Operating Noninterest Income and Expense
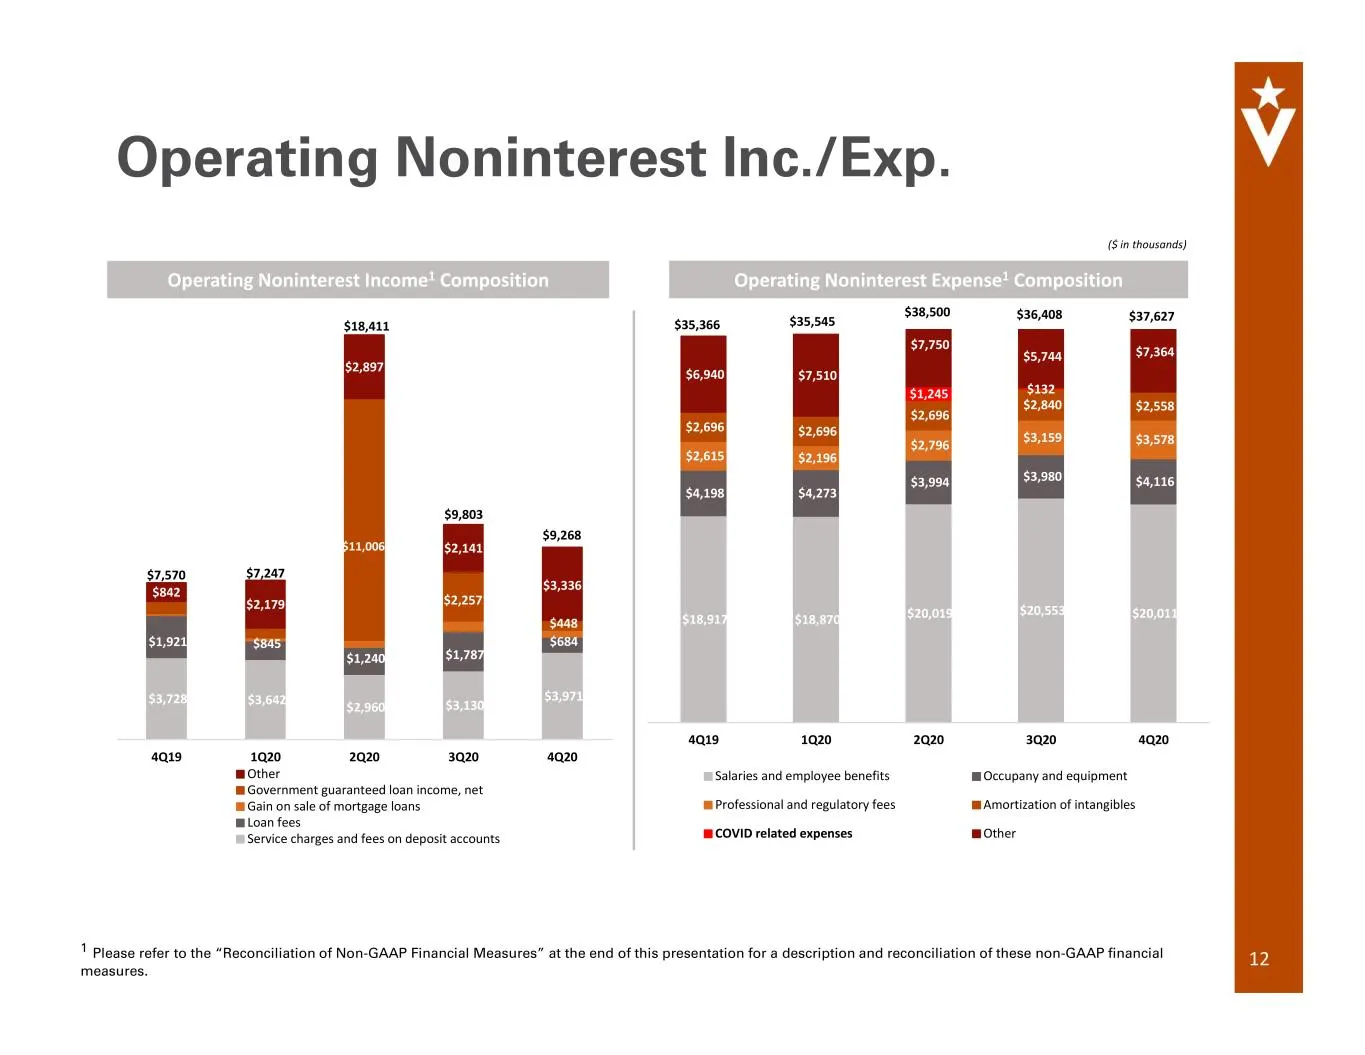
Operating Noninterest Inc./Exp. 12 Operating Noninterest Income1 Composition $3,728 $3,642 $2,960 $3,130 $3,971 $1,921 $845 $1,240 $1,787 $684 $842 $2,179 $2,897 $2,141 $3,336 4Q19 1Q20 2Q20 3Q20 4Q20 Other Government guaranteed loan income, net Gain on sale of mortgage loans Loan fees Service charg
Slide 13: Cost of Deposits and Deposit Composition
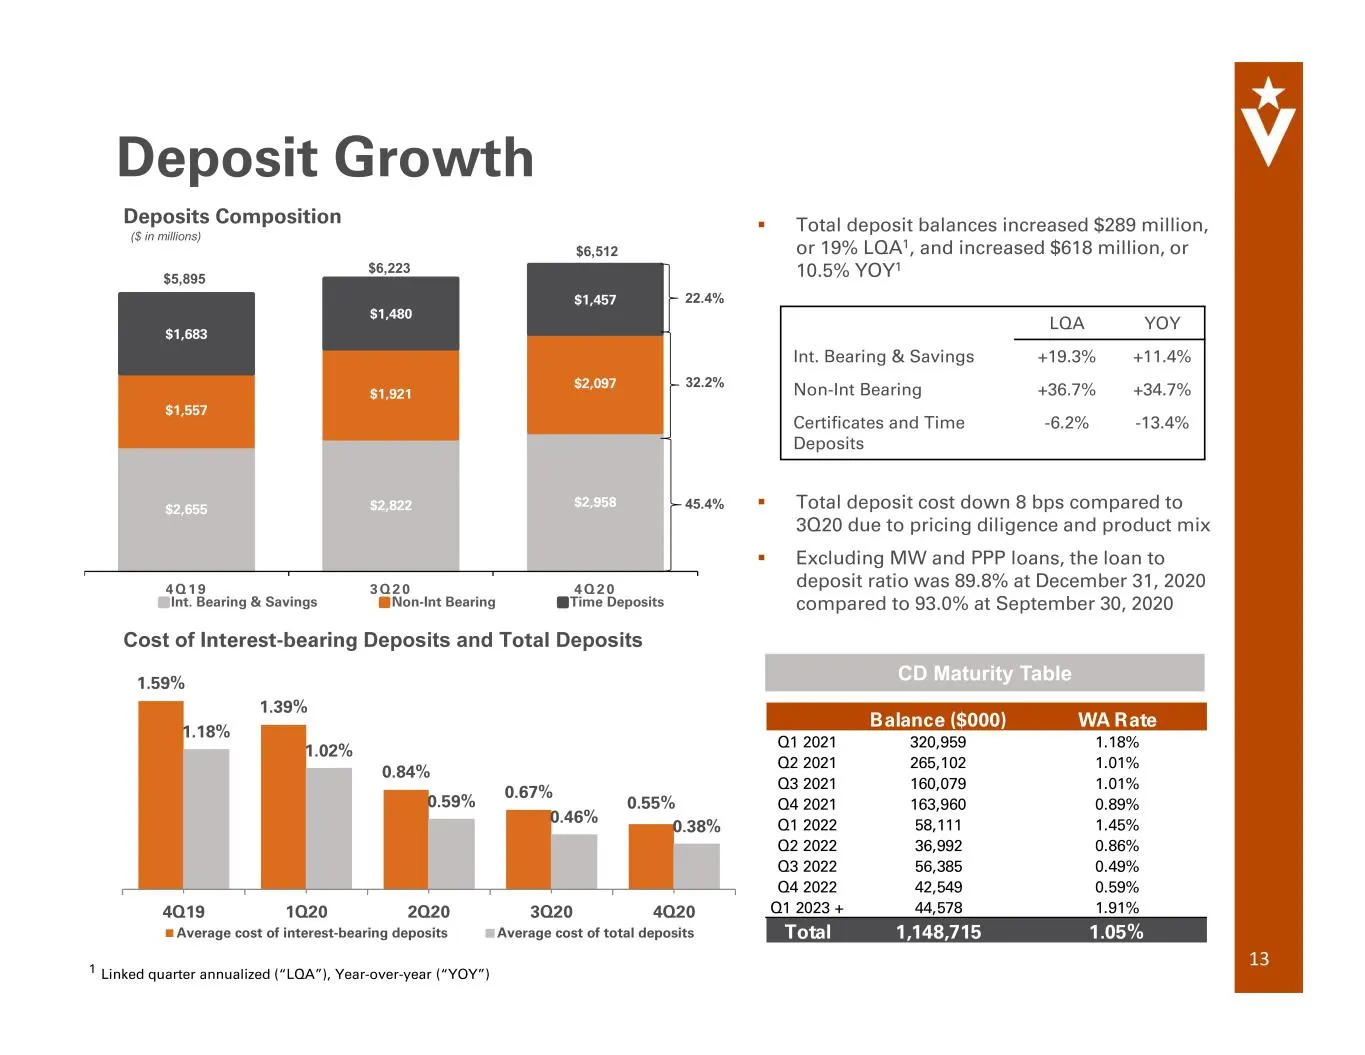
1.59% 1.39% 0.84% 0.67% 0.55% 1.18% 1.02% 0.59% 0.46% 0.38% 4Q19 1Q20 2Q20 3Q20 4Q20 Average cost of interest-bearing deposits Average cost of total deposits Cost of Interest-bearing Deposits and Total Deposits Total deposit balances increased $289 million, or 19% LQA1, and increased $618 million,
Slide 14: Loan Portfolio, Mortgage Warehouse and PPP Loans
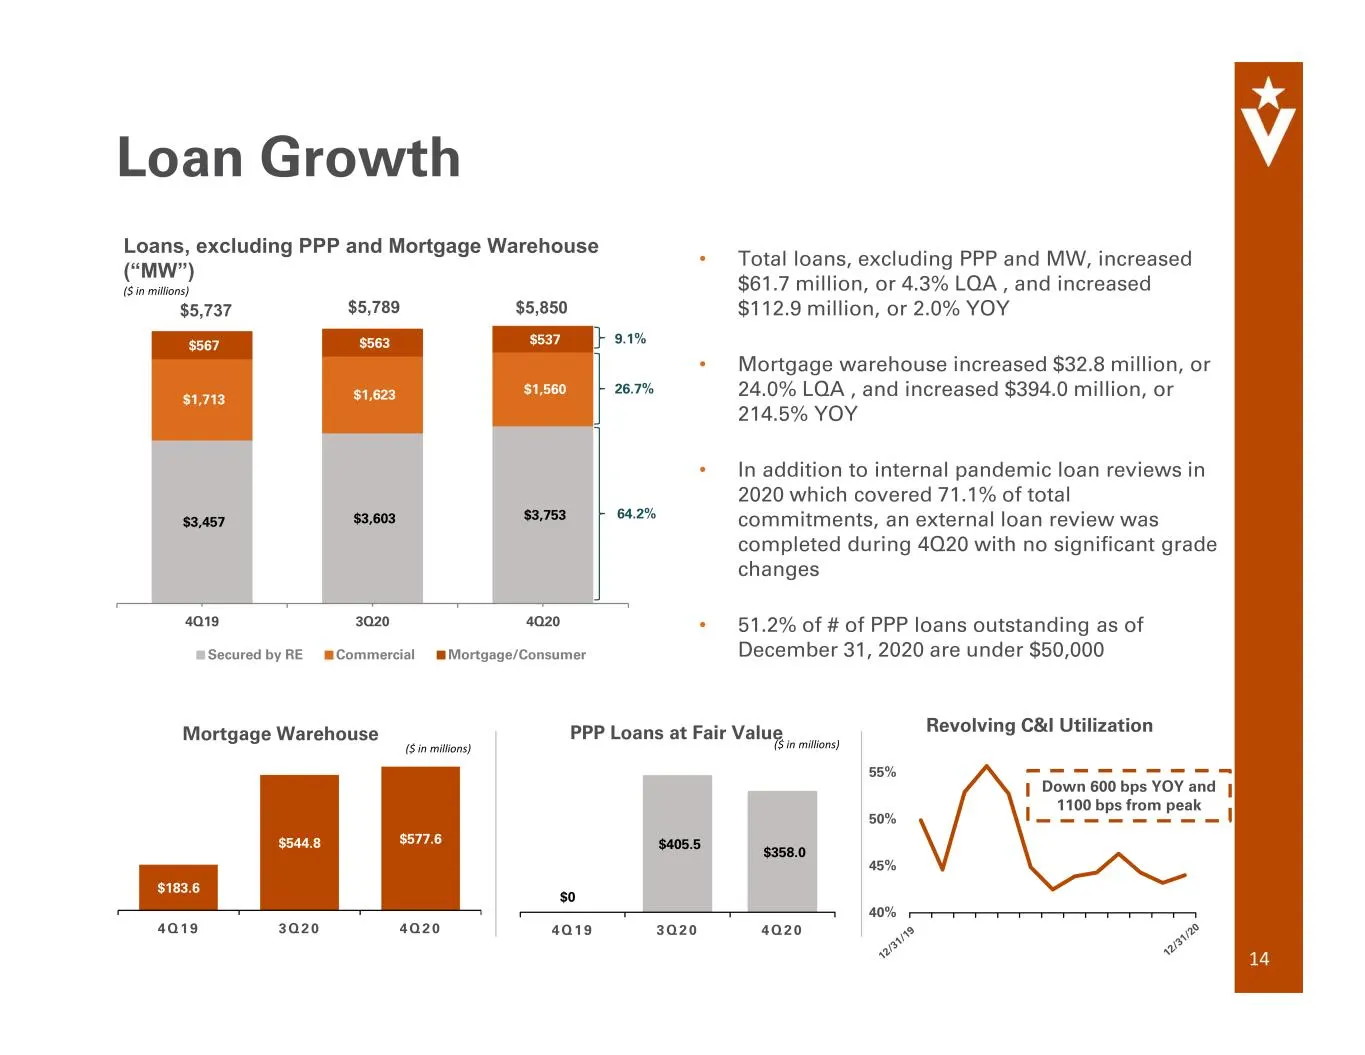
• Total loans, excluding PPP and MW, increased $61.7 million, or 4.3% LQA , and increased $112.9 million, or 2.0% YOY • Mortgage warehouse increased $32.8 million, or 24.0% LQA , and increased $394.0 million, or 214.5% YOY • In addition to internal pandemic loan reviews in 2020 which covered 71.1% o
Slide 15: Allowance for Credit Losses
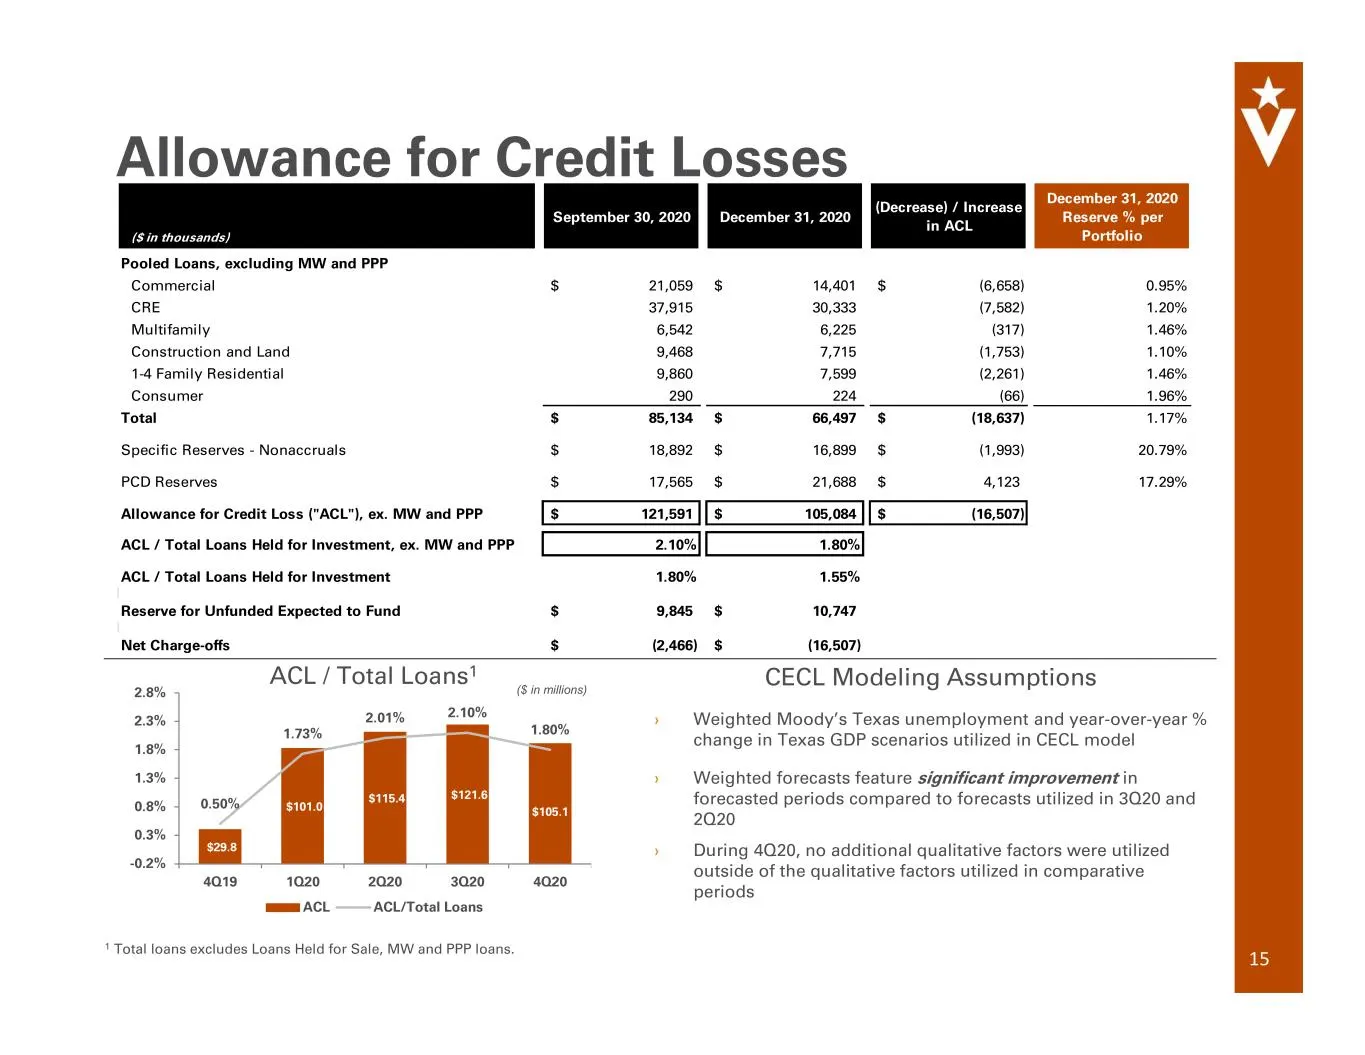
1 Total loans excludes Loans Held for Sale, MW and PPP loans. Allowance for Credit Losses 15 $29.8 $101.0 $115.4 $121.6 $105.1 0.50% 1.73% 2.01% 2.10% 1.80% -0.2% 0.3% 0.8% 1.3% 1.8% 2.3% 2.8% 4Q19 1Q20 2Q20 3Q20 4Q20 ACL ACL/Total Loans ACL / Total Loans1 CECL Modeling Assumptions › Weighted Moody’
Slide 16: Continued Capital Build
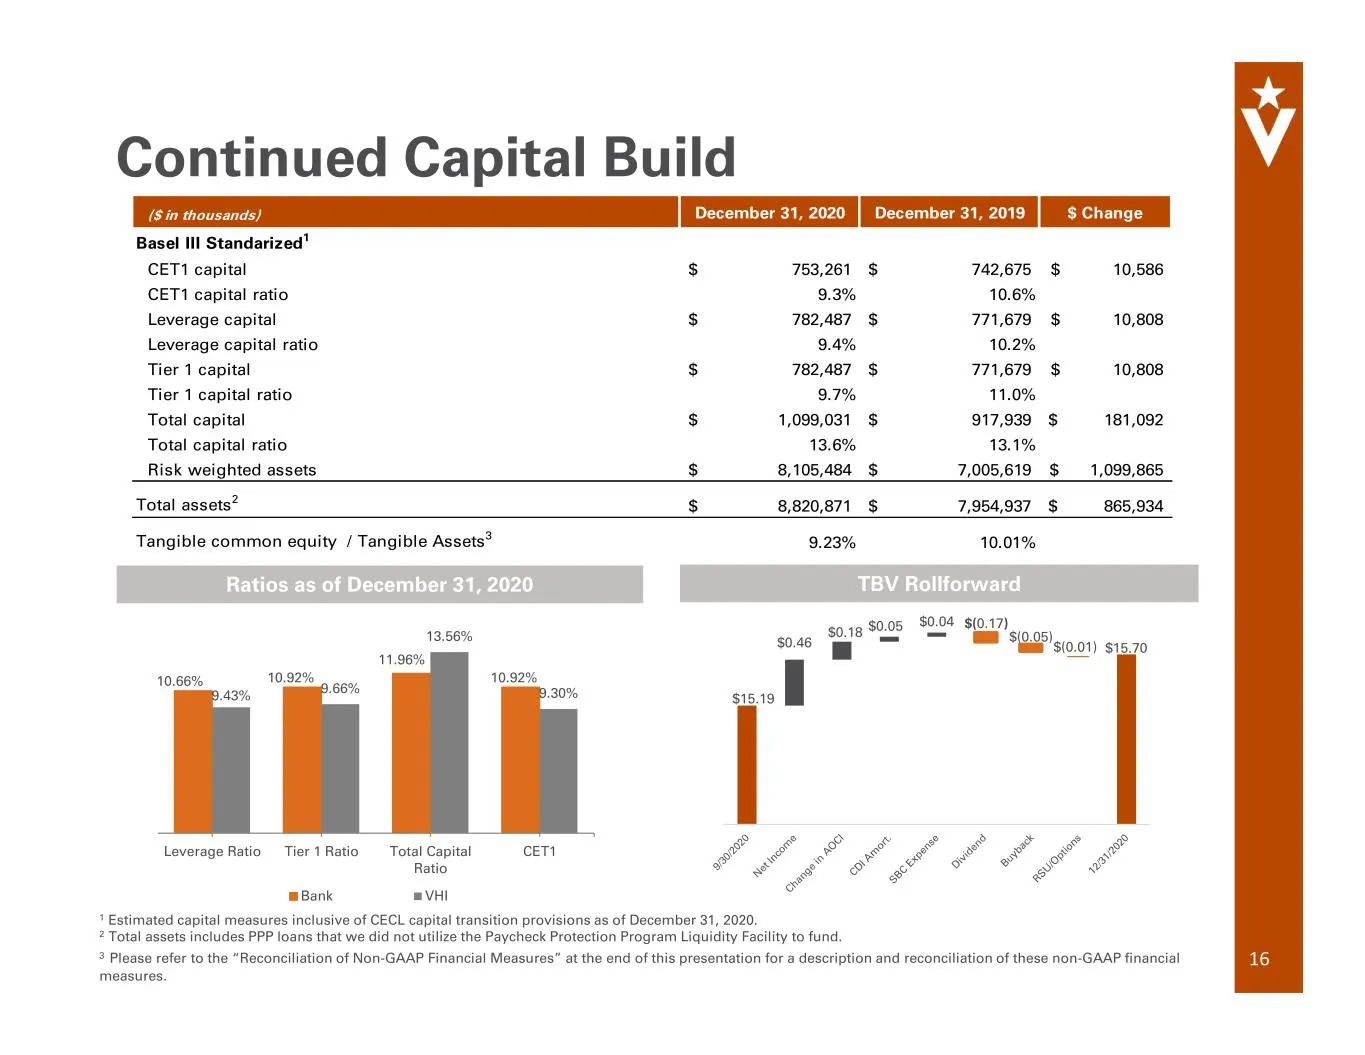
Continued Capital Build 16 10.66% 10.92% 11.96% 10.92% 9.43% 9.66% 13.56% 9.30% Leverage Ratio Tier 1 Ratio Total Capital Ratio CET1 Bank VHI 1 Estimated capital measures inclusive of CECL capital transition provisions as of December 31, 2020. 2 Total assets includes PPP loans that we did not utiliz
Slide 17: Asset Quality
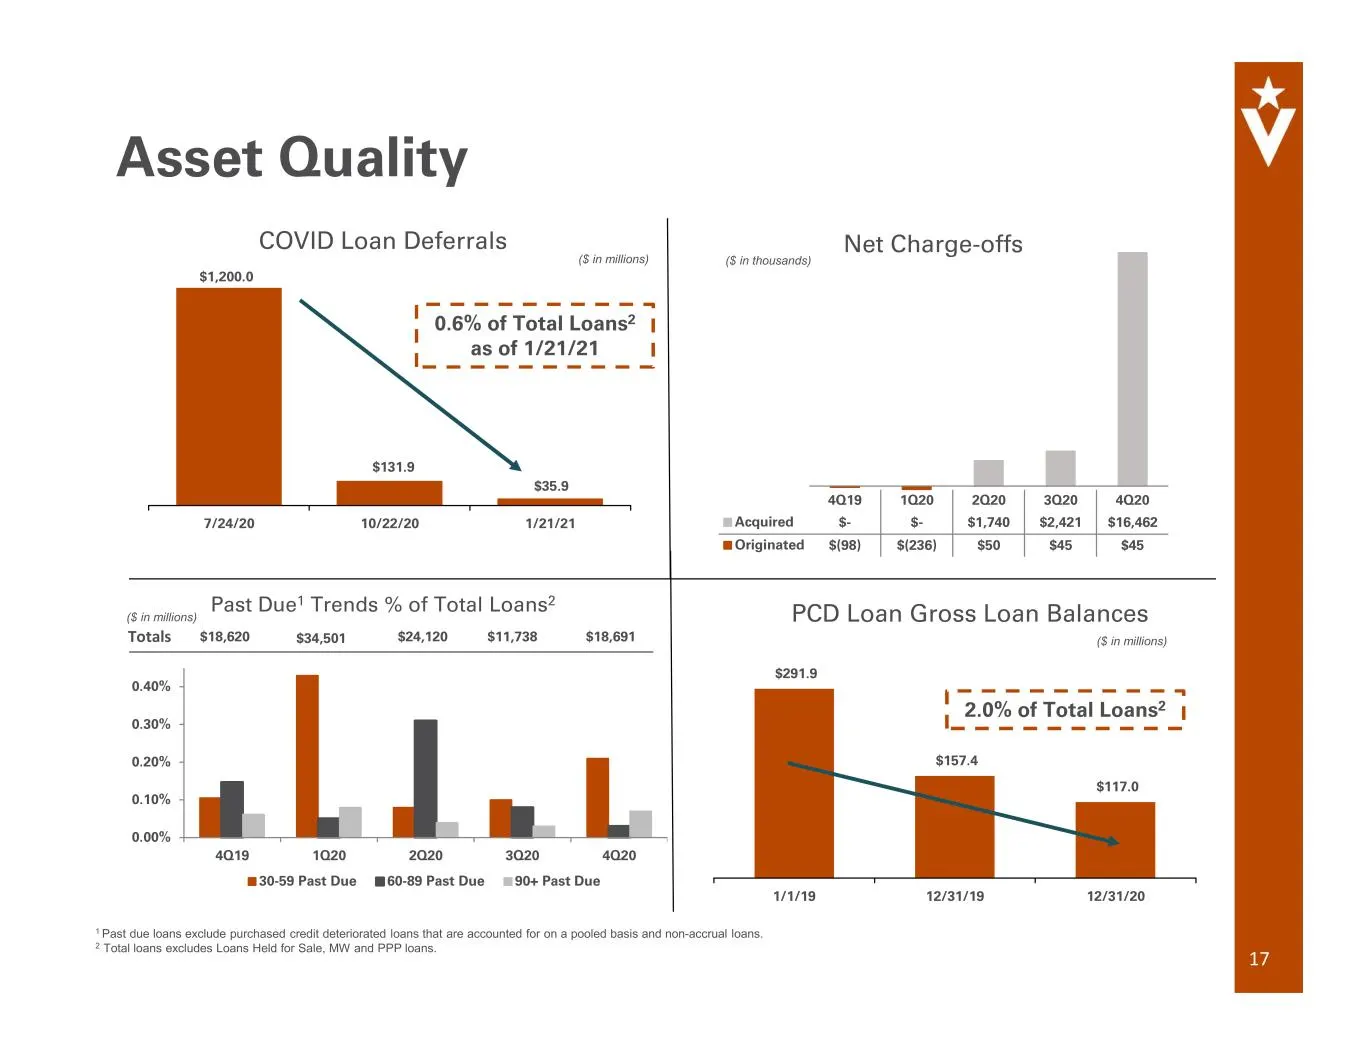
1 Past due loans exclude purchased credit deteriorated loans that are accounted for on a pooled basis and non-accrual loans. 2 Total loans excludes Loans Held for Sale, MW and PPP loans. 4Q19 1Q20 2Q20 3Q20 4Q20 0.00% 0.10% 0.20% 0.30% 0.40% 30-59 Past Due 60-89 Past Due 90+ Past Due Past Due1 Trend
Slide 18: Hospitality Portfolio Drill Down
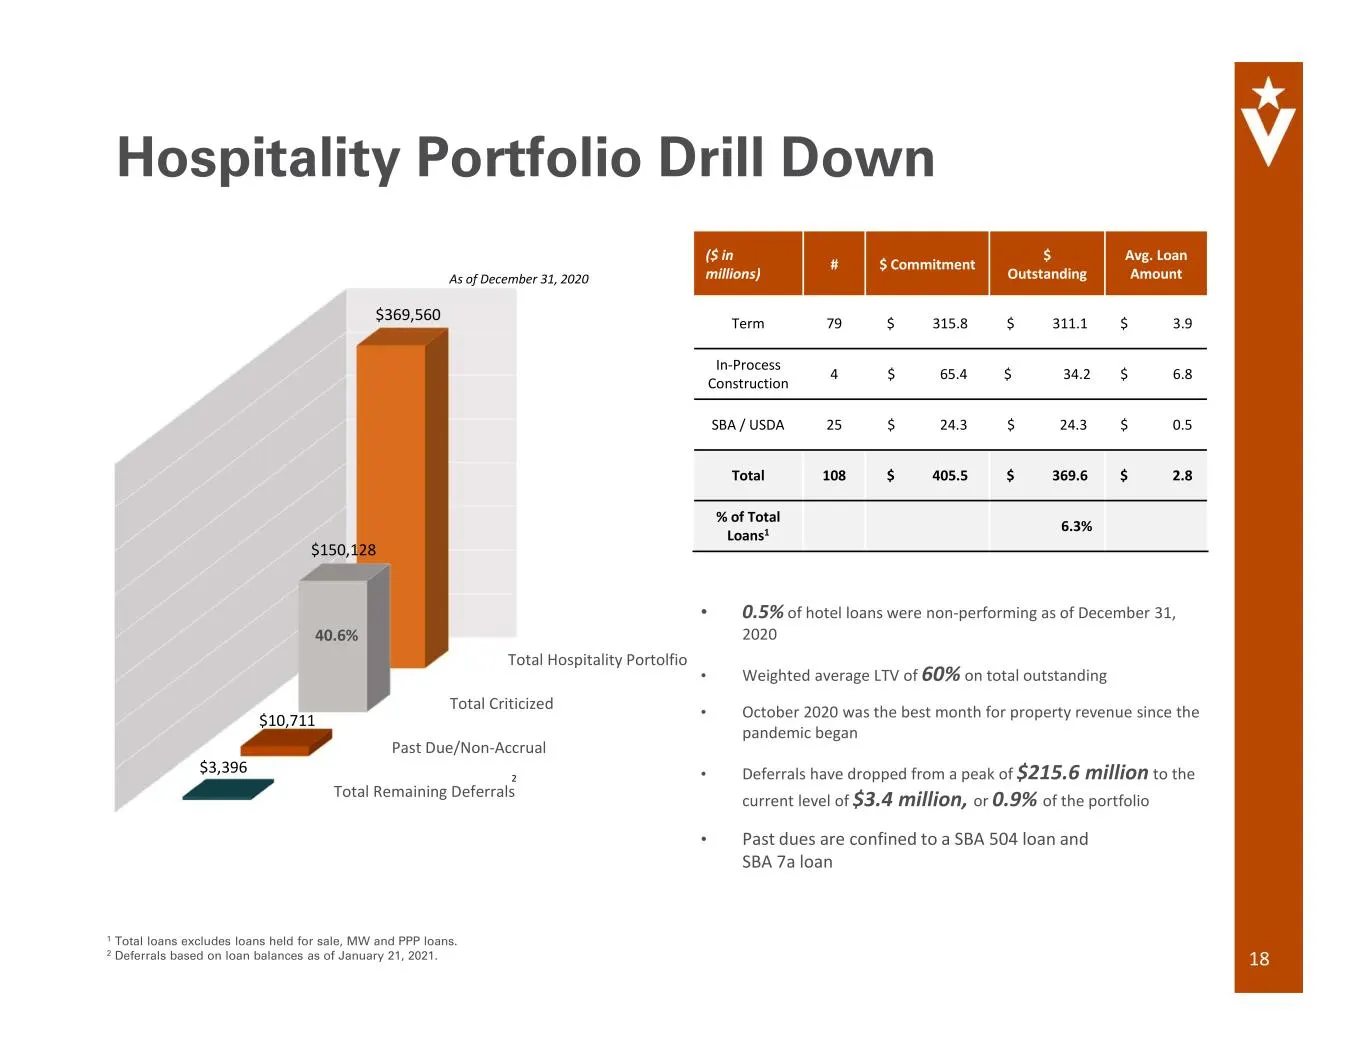
Hospitality Portfolio Drill Down 18 Total Remaining Deferrals Past Due/Non-Accrual Total Criticized Total Hospitality Portolfio $3,396 $10,711 $150,128 $369,560 40.6% As of December 31, 2020 2 ($ in millions) # $ Commitment $ Outstanding Avg. Loan Amount Term 79 $ 315.8 $ 311.1 $ 3.9 In-Process Cons
Slide 19: Hospitality Portfolio Drill Down: Top 10 Relationships
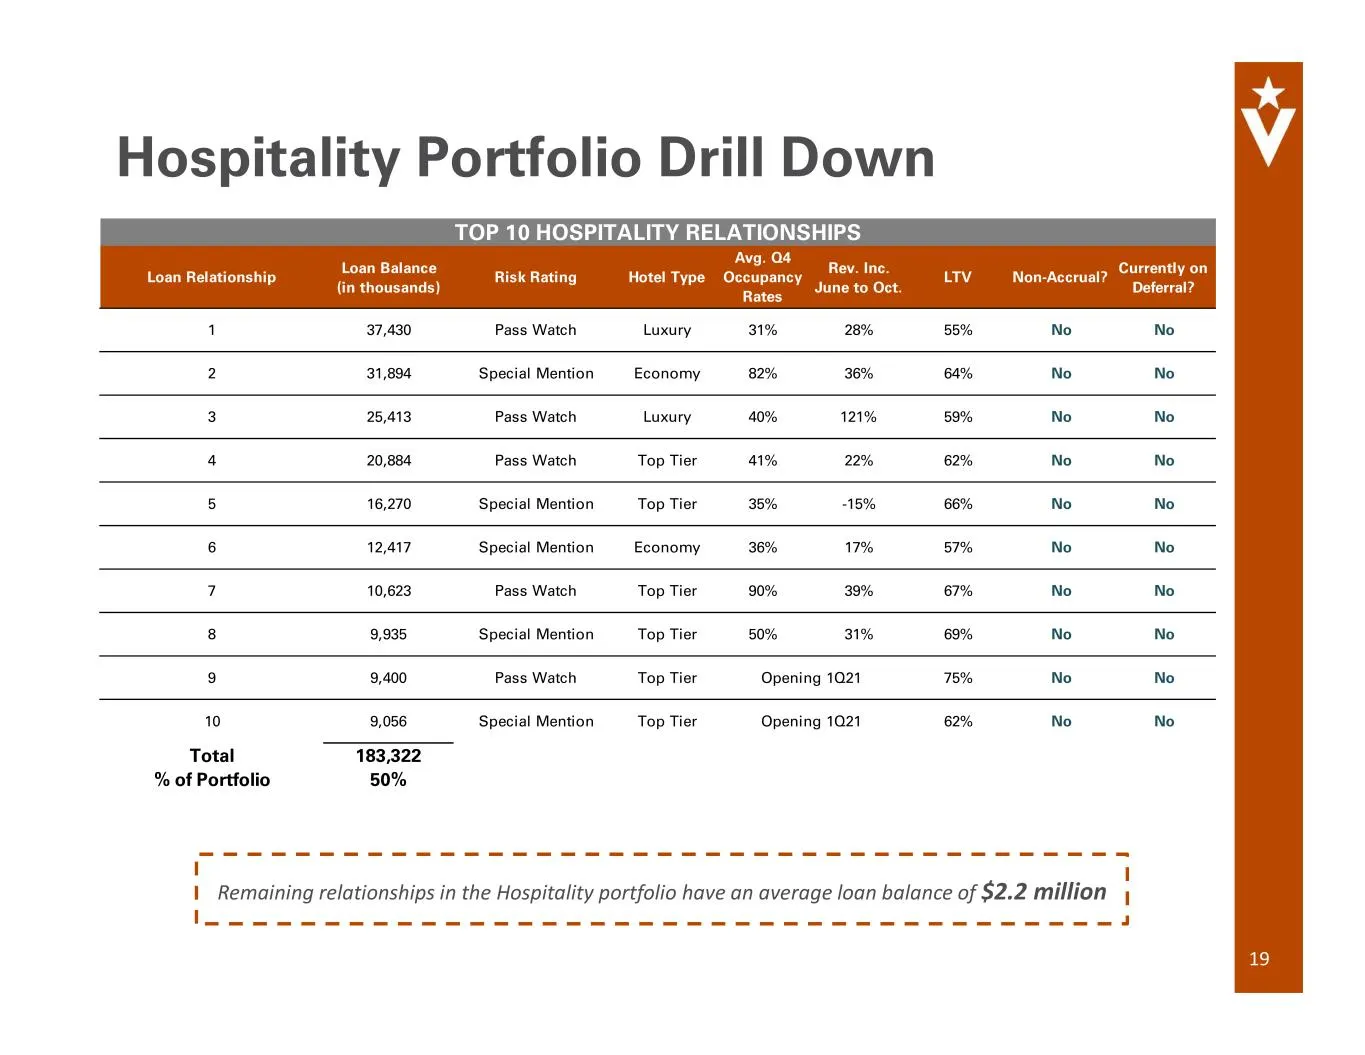
Hospitality Portfolio Drill Down 19 Remaining relationships in the Hospitality portfolio have an average loan balance of $2.2 million Loan Relationship Loan Balance (in thousands) Risk Rating Hotel Type Avg. Q4 Occupancy Rates Rev. Inc. June to Oct. LTV Non-Accrual? Currently on Deferral? 1 37,430 P
Slide 20: Retail CRE Portfolio Drill Down
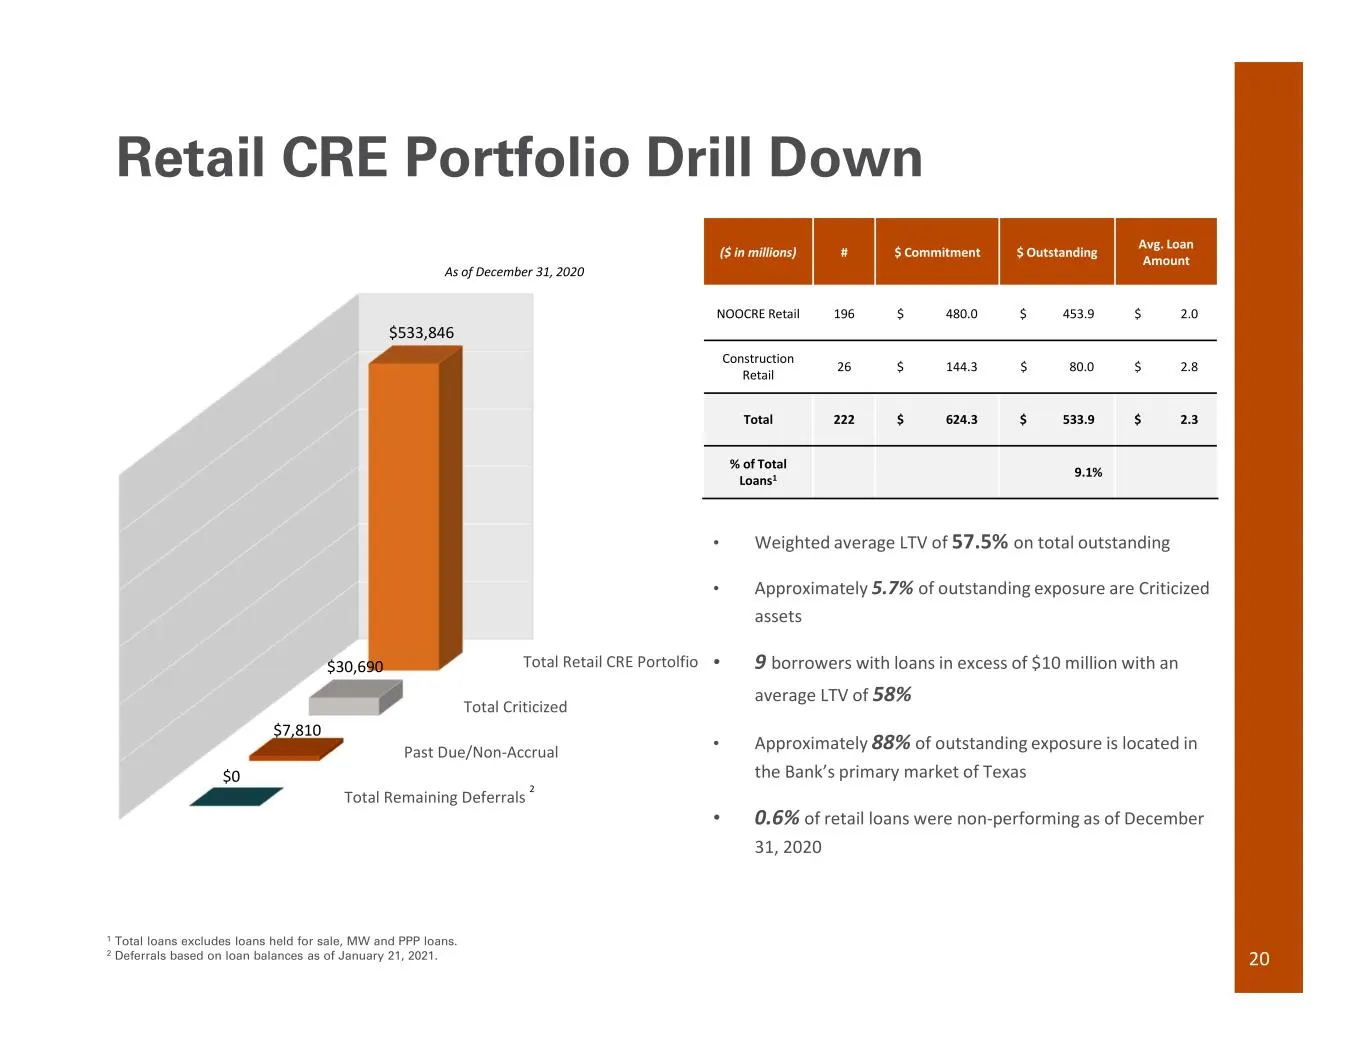
Retail CRE Portfolio Drill Down Total Remaining Deferrals Past Due/Non-Accrual Total Criticized Total Retail CRE Portolfio $0 $7,810 $30,690 $533,846 ($ in millions) # $ Commitment $ Outstanding Avg. Loan Amount NOOCRE Retail 196 $ 480.0 $ 453.9 $ 2.0 Construction Retail 26 $ 144.3 $ 80.0 $ 2.8 Tota
Slide 21: Restaurant Portfolio Drill Down
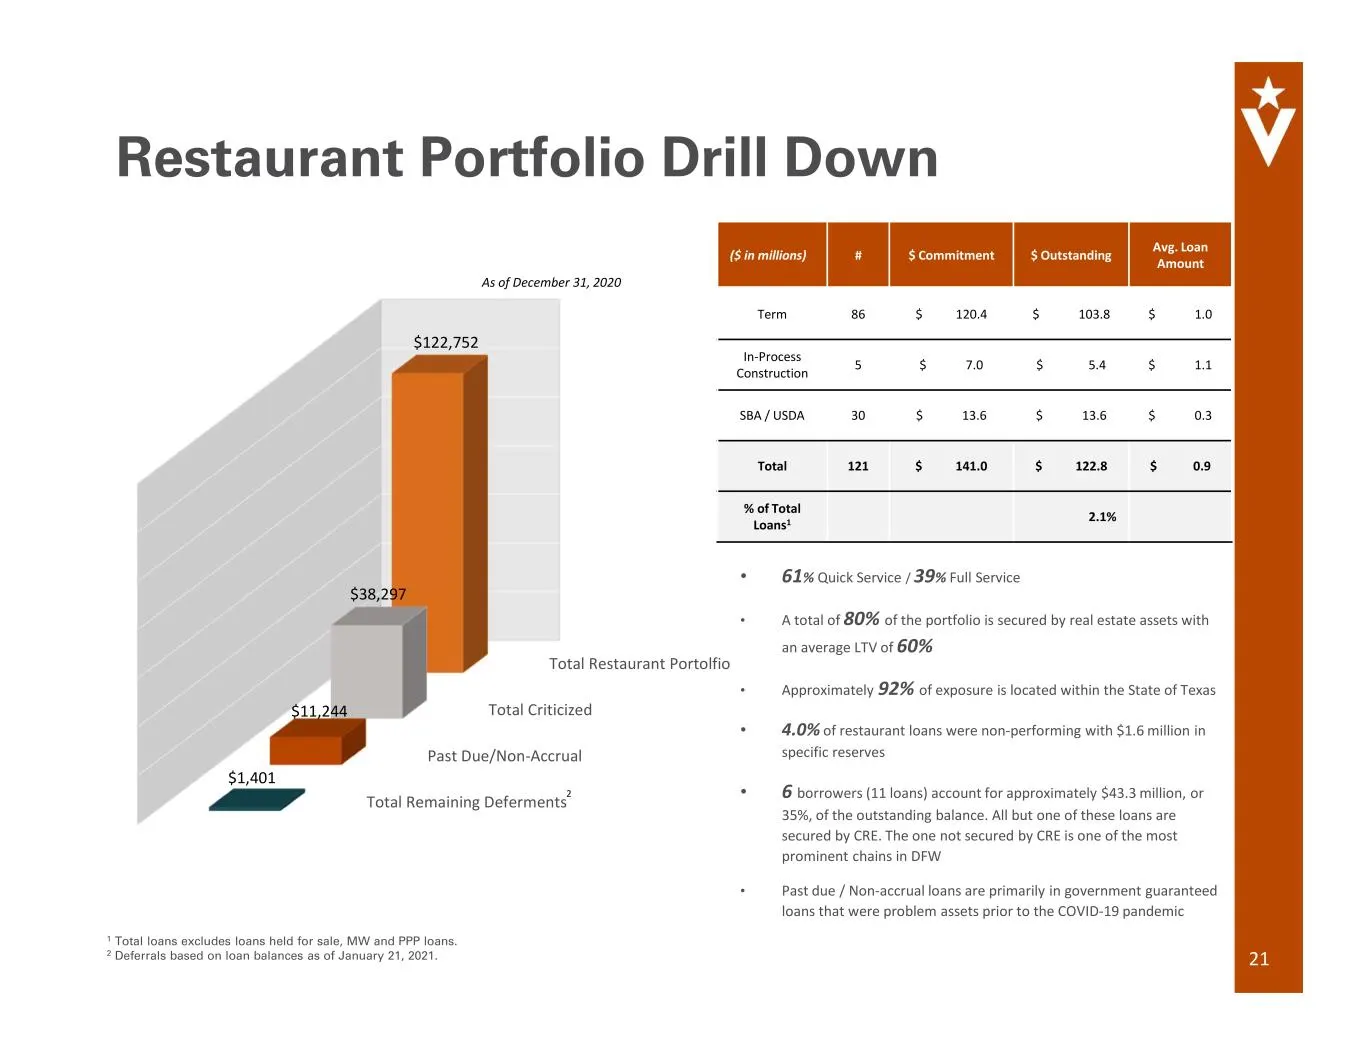
Restaurant Portfolio Drill Down 21 Total Remaining Deferments Past Due/Non-Accrual Total Criticized Total Restaurant Portolfio $1,401 $11,244 $38,297 $122,752 As of December 31, 2020 ($ in millions) # $ Commitment $ Outstanding Avg. Loan Amount Term 86 $ 120.4 $ 103.8 $ 1.0 In-Process Construction 5
Slide 22: Government Guaranteed Drill Down
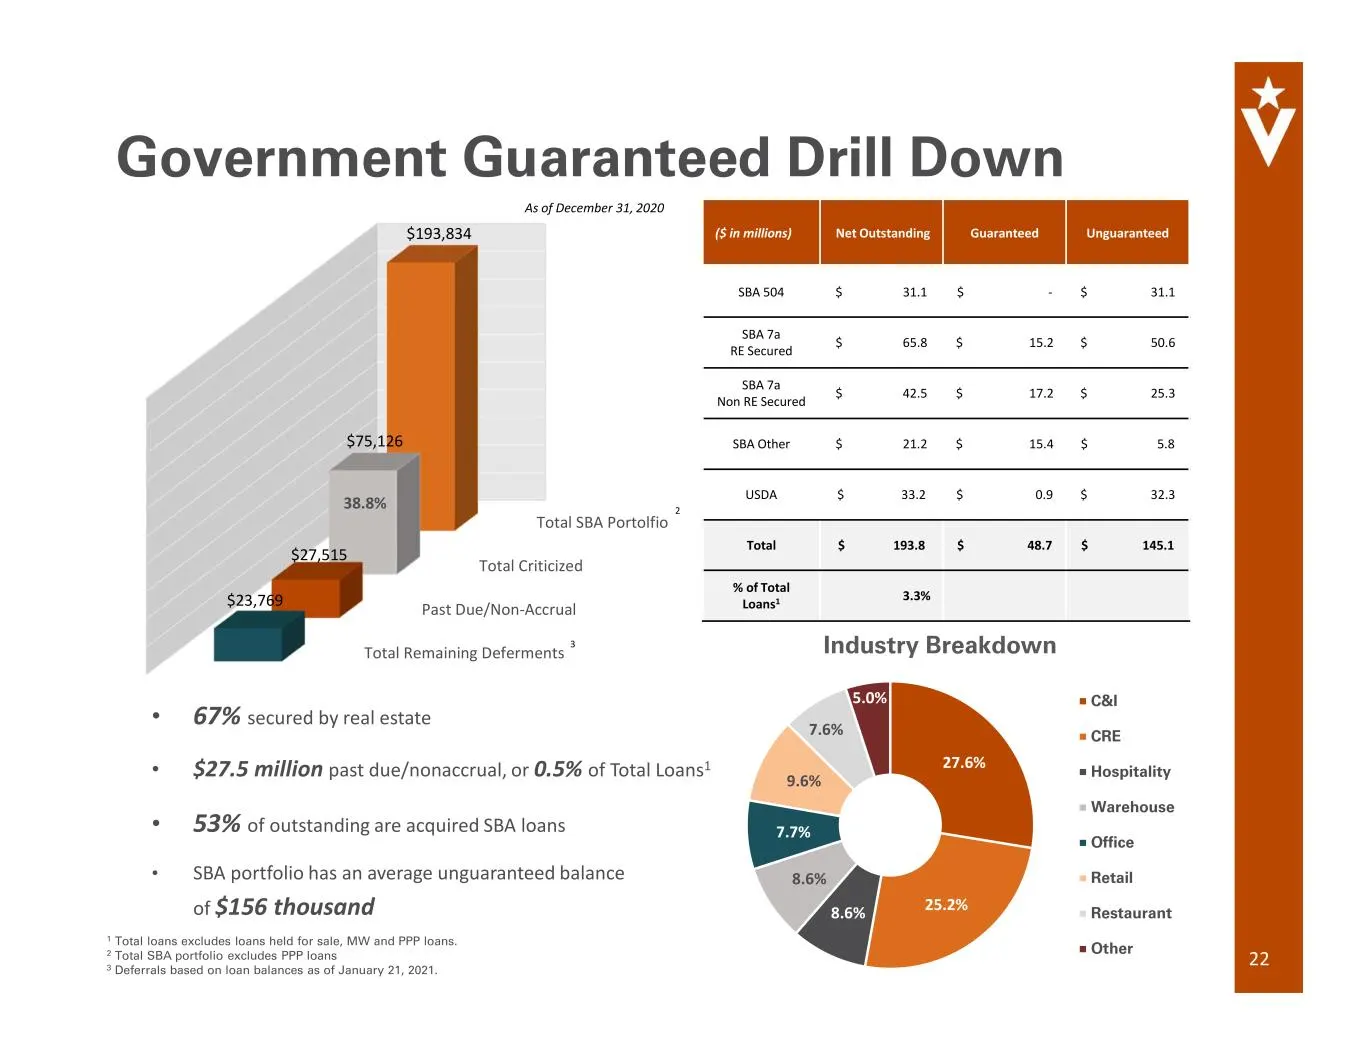
Government Guaranteed Drill Down 22 Total Remaining Deferments Past Due/Non-Accrual Total Criticized Total SBA Portolfio $23,769 $27,515 $75,126 $193,834 As of December 31, 2020 238.8% ($ in millions) Net Outstanding Guaranteed Unguaranteed SBA 504 $ 31.1 $ - $ 31.1 SBA 7a RE Secured $ 65.8 $ 15.2 $
Slide 23: Talent Investments in Last 6 Months
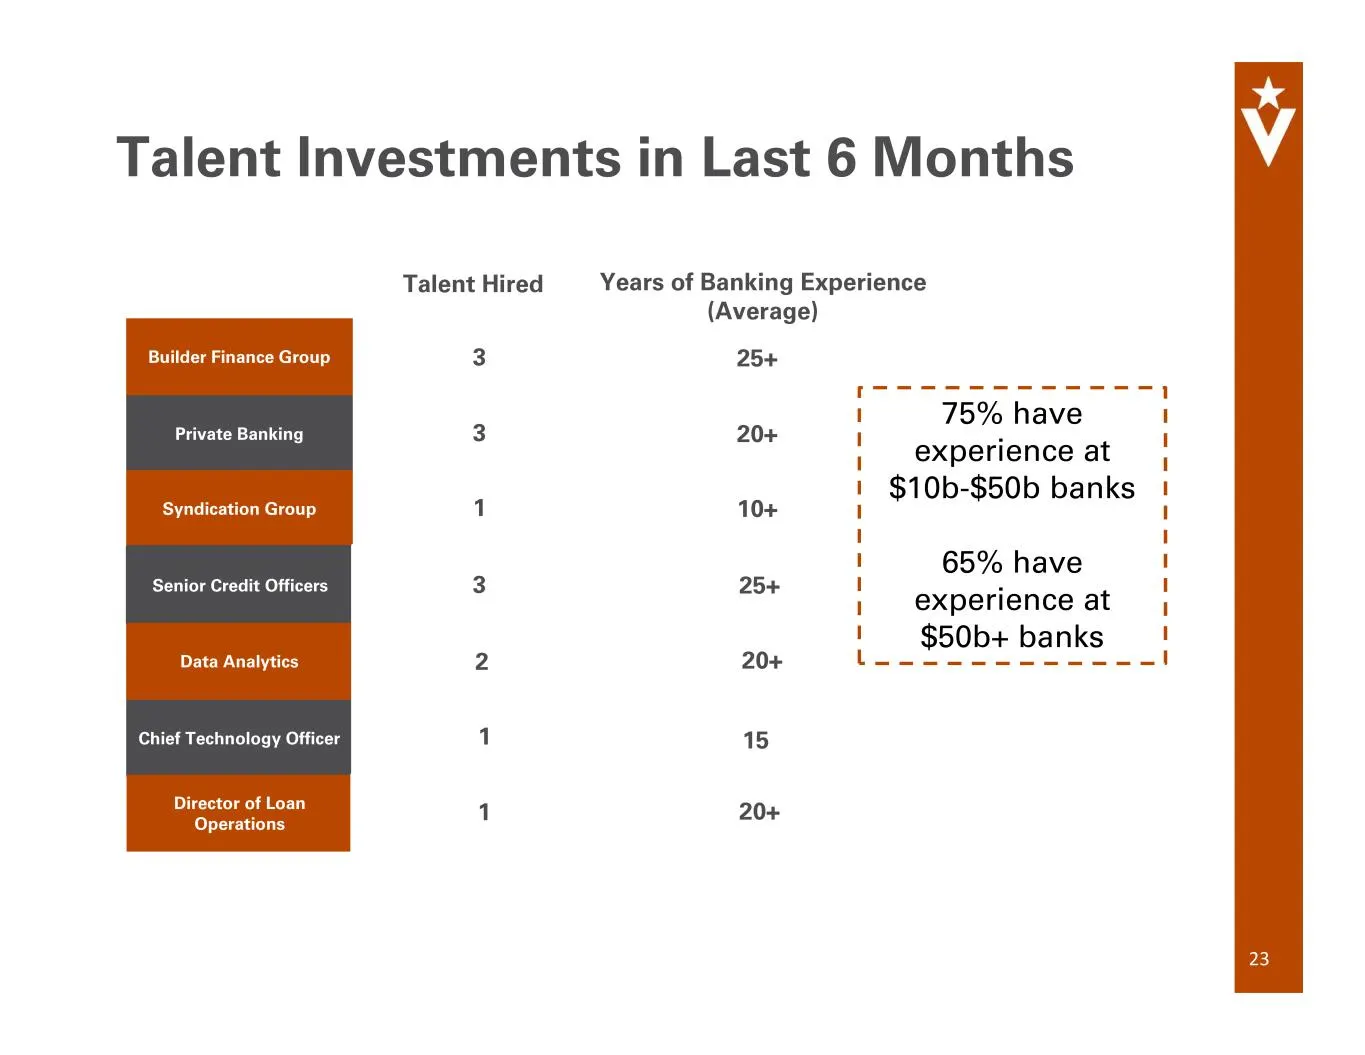
Builder Finance Group Private Banking 23 Talent Investments in Last 6 Months Syndication Group Senior Credit Officers Data Analytics Chief Technology Officer Director of Loan Operations 3 25+ 3 20+ 1 10+ 4 3 1 15 1 Talent Hired Years of Banking Experience (Average) 3 25+ 2 20+ 1 1 20+ 75% have exper
Slide 24: Supplemental Information
Supplemental Information Veritex Holdings, Inc.
Slide 25: Reconciliation of Non-GAAP Financial Measures
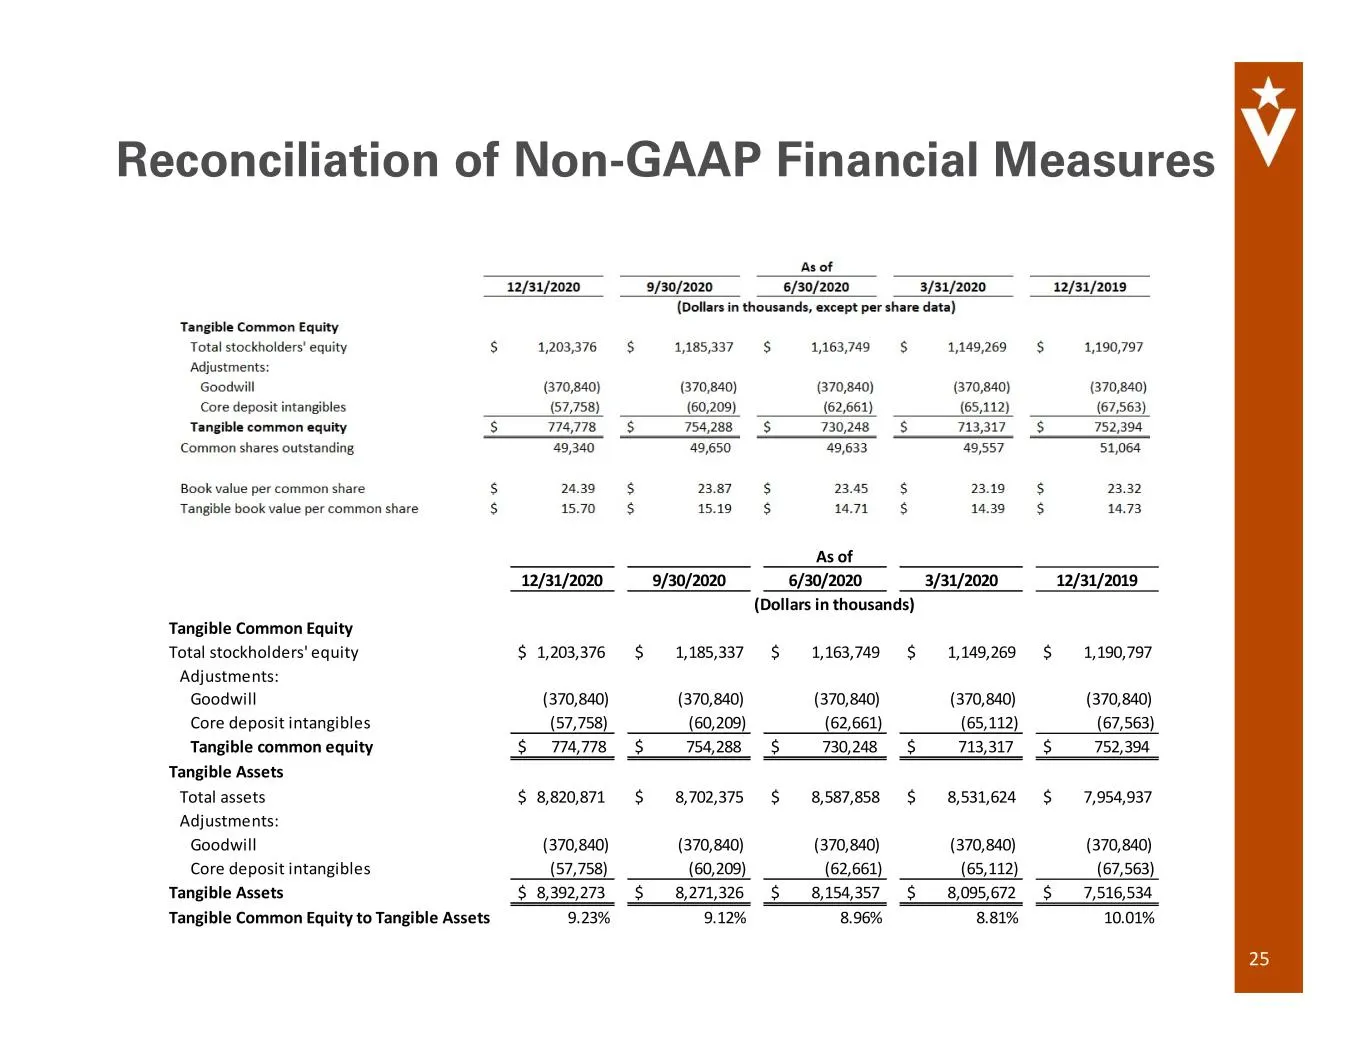
25 Reconciliation of Non-GAAP Financial Measures 12/31/2020 9/30/2020 6/30/2020 3/31/2020 12/31/2019 Tangible Common Equity Total stockholders' equity $ 1,203,376 $ 1,185,337 $ 1,163,749 $ 1,149,269 $ 1,190,797 Adjustments: Goodwill (370,840) (370,840) (370,840) (370,840) (370,840) Core deposit inta
Slide 26: Reconciliation of Non-GAAP Financial Measures
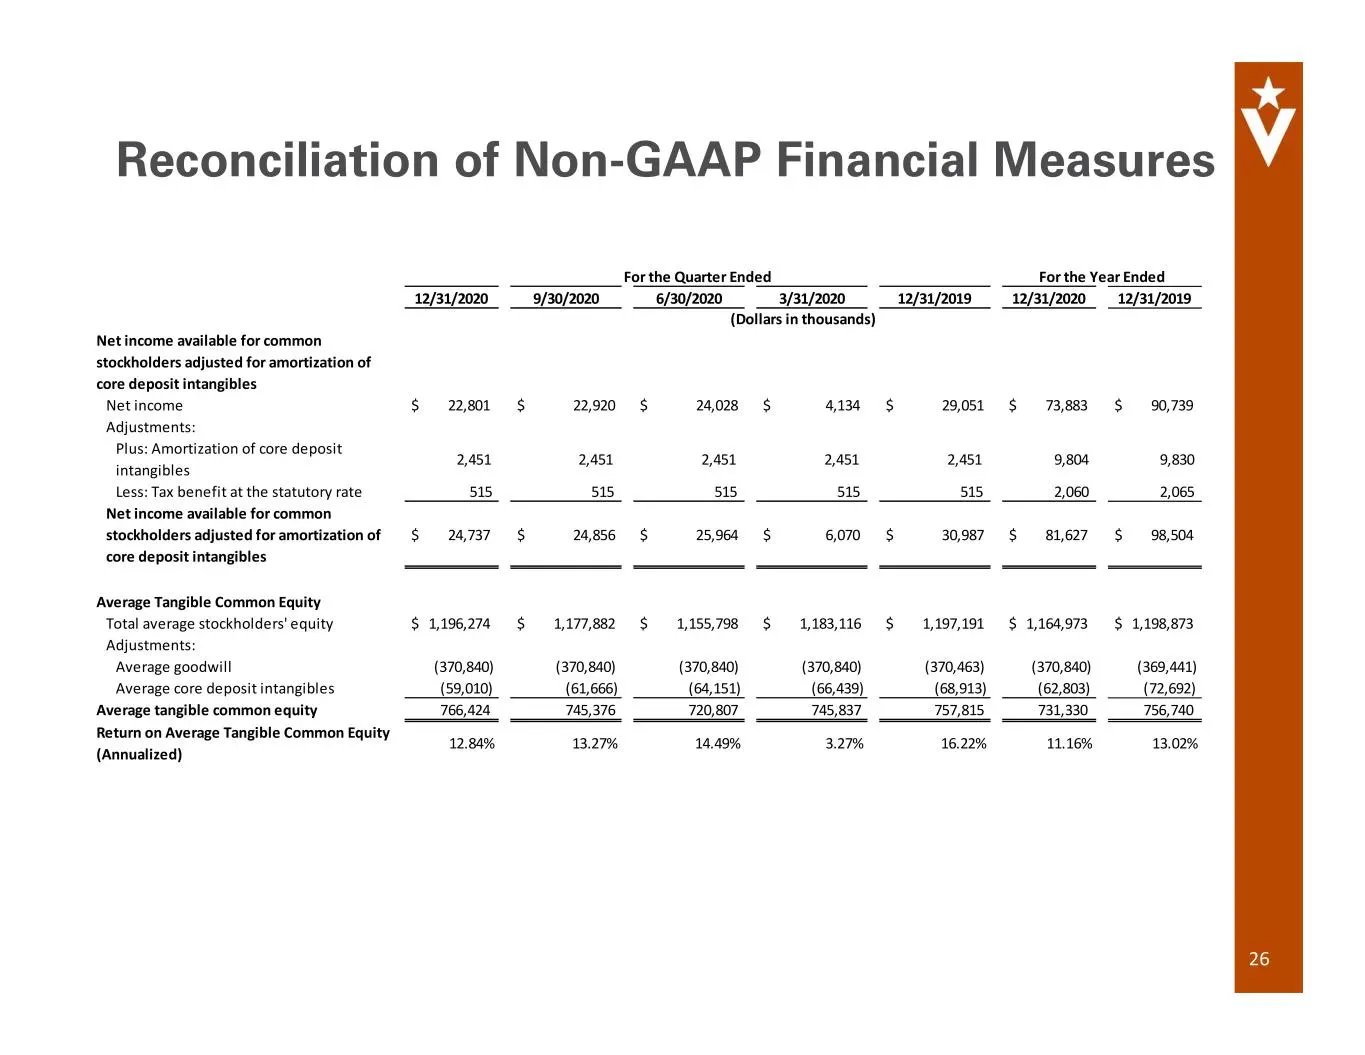
26 Reconciliation of Non-GAAP Financial Measures 12/31/2020 9/30/2020 6/30/2020 3/31/2020 12/31/2019 12/31/2020 12/31/2019 Net income available for common stockholders adjusted for amortization of core deposit intangibles Net income $ 22,801 $ 22,920 $ 24,028 $ 4,134 $ 29,051 $ 73,883 $ 90,739 Adjus
Slide 27: Reconciliation of Non-GAAP Financial Measures
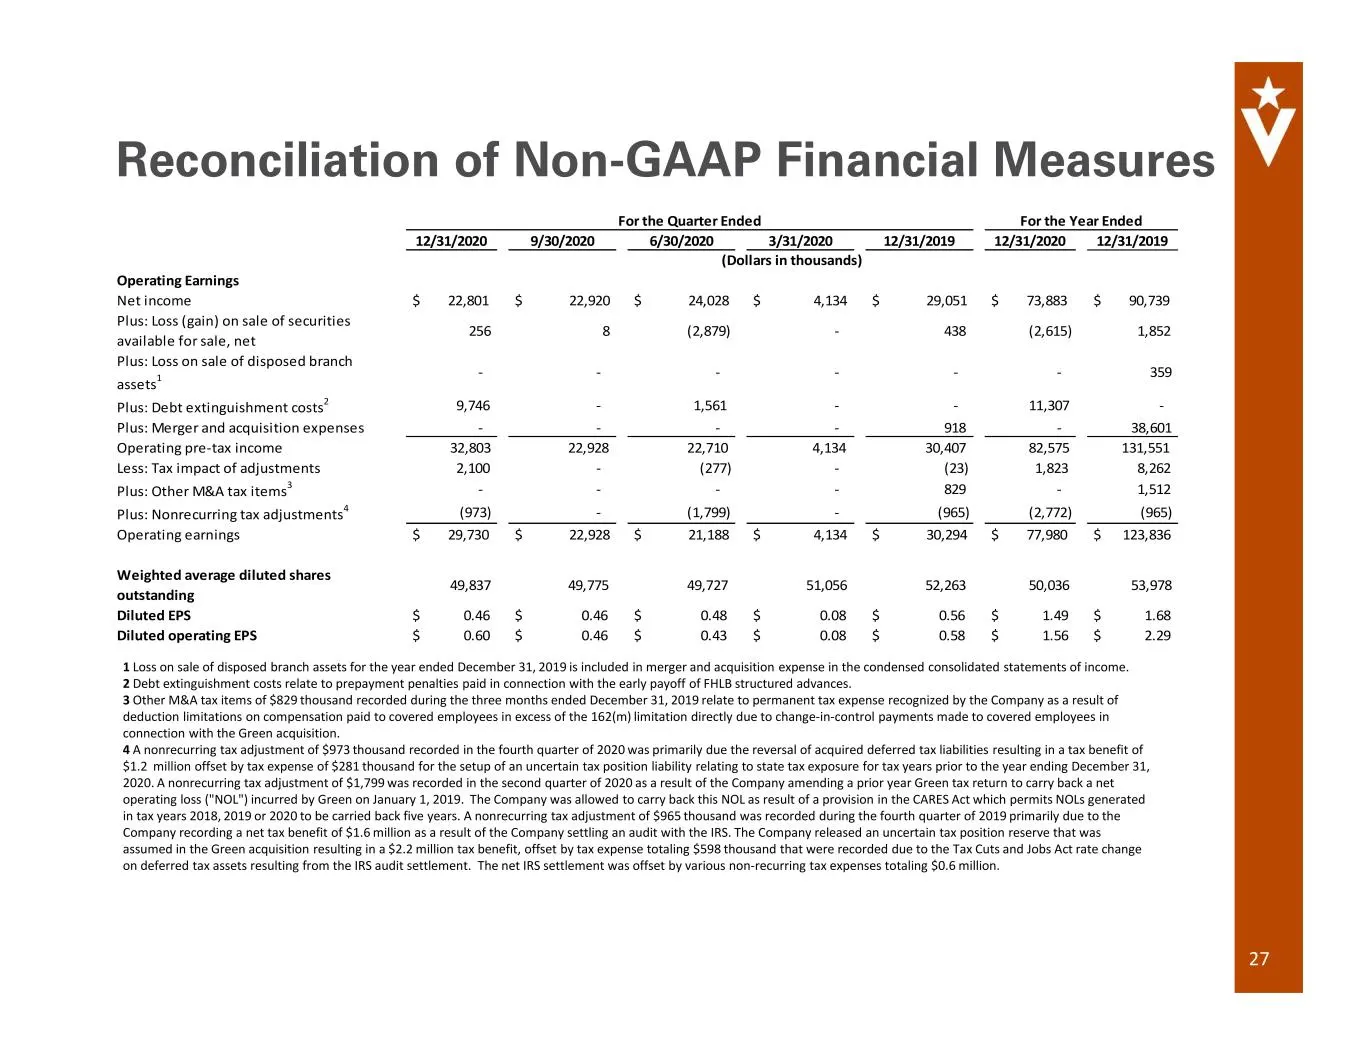
27 Reconciliation of Non-GAAP Financial Measures 1 Loss on sale of disposed branch assets for the year ended December 31, 2019 is included in merger and acquisition expense in the condensed consolidated statements of income. 2 Debt extinguishment costs relate to prepayment penalties paid in connecti
Slide 28: Reconciliation of Non-GAAP Financial Measures
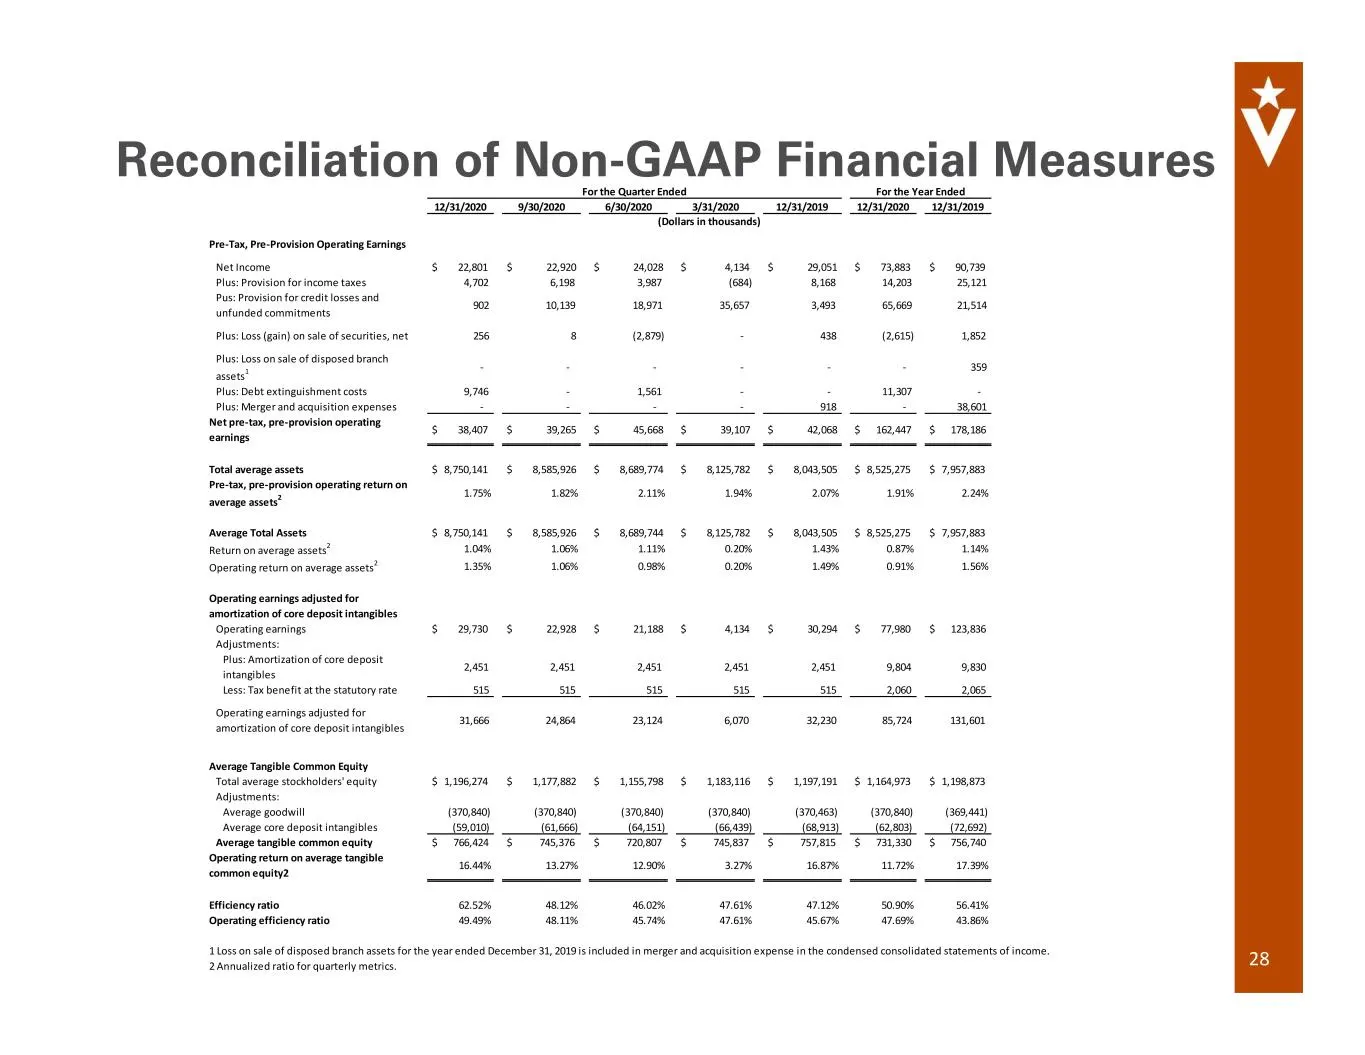
28 Reconciliation of Non-GAAP Financial Measures 12/31/2020 9/30/2020 6/30/2020 3/31/2020 12/31/2019 12/31/2020 12/31/2019 Pre-Tax, Pre-Provision Operating Earnings Net Income $ 22,801 $ 22,920 $ 24,028 $ 4,134 $ 29,051 $ 73,883 $ 90,739 Plus: Provision for income taxes 4,702 6,198 3,987 (684) 8,168
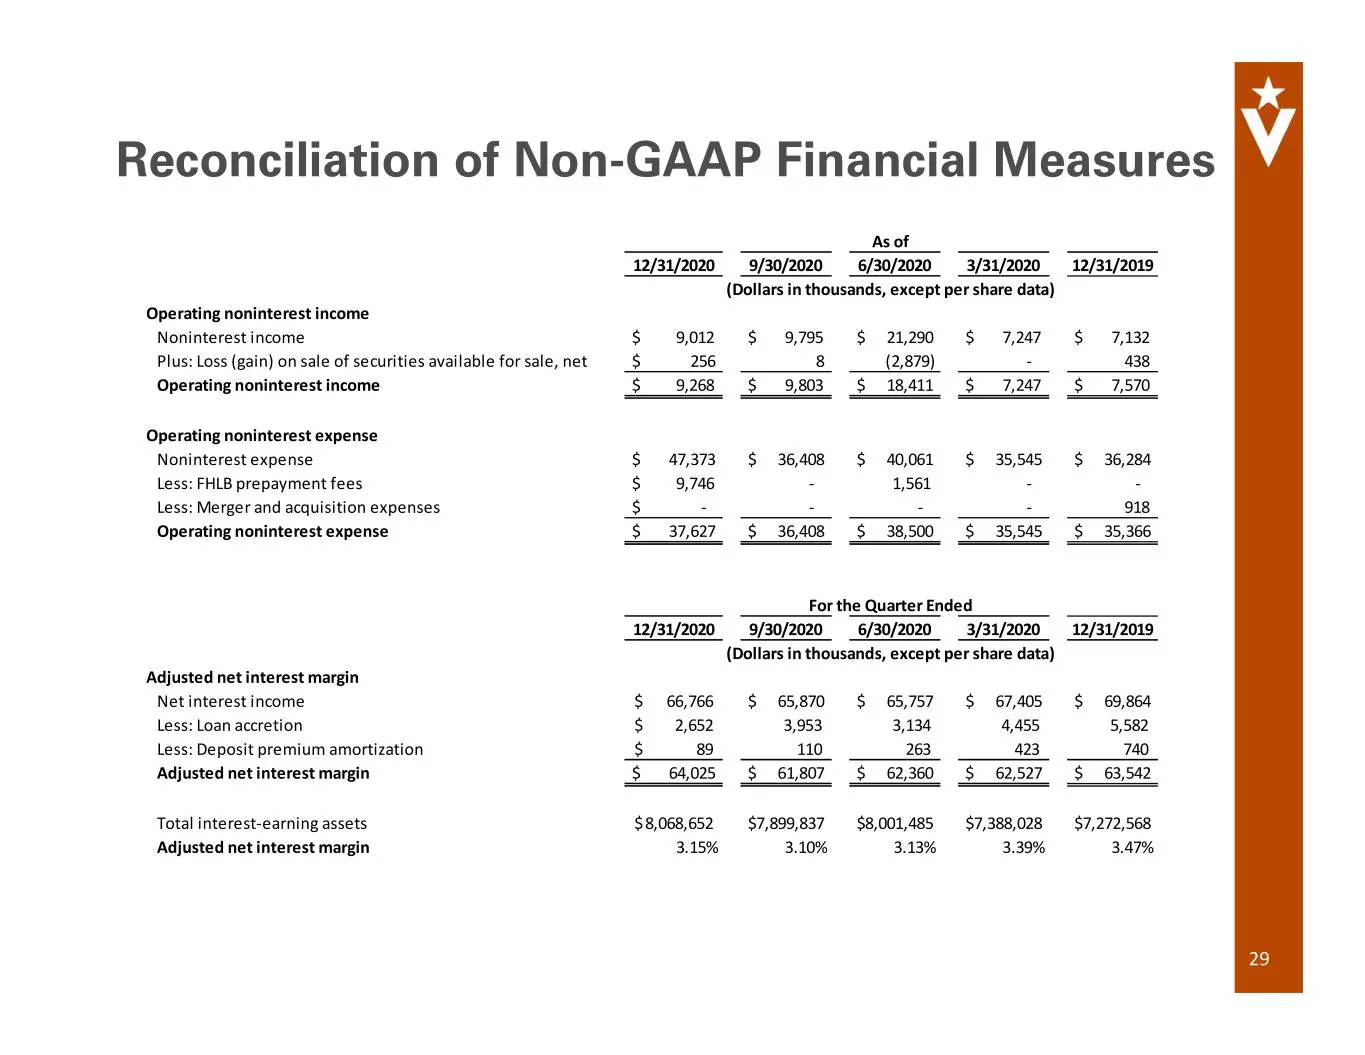
Slide 29: Reconciliation of Non-GAAP Financial Measures
29 Reconciliation of Non-GAAP Financial Measures 12/31/2020 9/30/2020 6/30/2020 3/31/2020 12/31/2019 Operating noninterest income Noninterest income $ 9,012 $ 9,795 $ 21,290 $ 7,247 $ 7,132 Plus: Loss (gain) on sale of securities available for sale, net $ 256 8 (2,879) - 438 Operating noninterest in
Slide 30: Veritex Holdings, Inc.
Veritex Holdings, Inc.
Source: SEC EDGAR · 8-K filed Feb 2, 2021
More decks from Veritex Holdings Inc
 Merger or Acquisition (July 2025)17 slides · Jul 14, 2025
 Q1 2025 Earnings Presentation22 slides · Apr 23, 2025
 Q4 2024 Earnings Presentation22 slides · Jan 28, 2025
 Q3 2024 Earnings Presentation24 slides · Oct 23, 2024
 Investor Presentation (August 2024)30 slides · Aug 27, 2024
 Q2 2024 Earnings Presentation22 slides · Jul 24, 2024