Bear State Financial — DA Davidson 18th Annual Financial Institutions Conference (May 2016)
24 slides from Bear State Financial's conference presentation, May 9, 2016
Slide 1: DA Davidson 18th Annual Financial Institutions Conference
DA Davidson 18th Annual Financial Institutions Conference May 9-11, 2016 NASDAQ:BSF BEAR STATE
Slide 2: Forward Looking Information
Forward Looking Information “This presentation contains certain forward-looking information about Bear State Financial, Inc. (“BSE”) that is intended to be covered by the safe harbor for “forward-looking statements” provided by the jon Reform Act of 1995. All statements other than statements of hist
Slide 3: Bear State Financial - Our Story
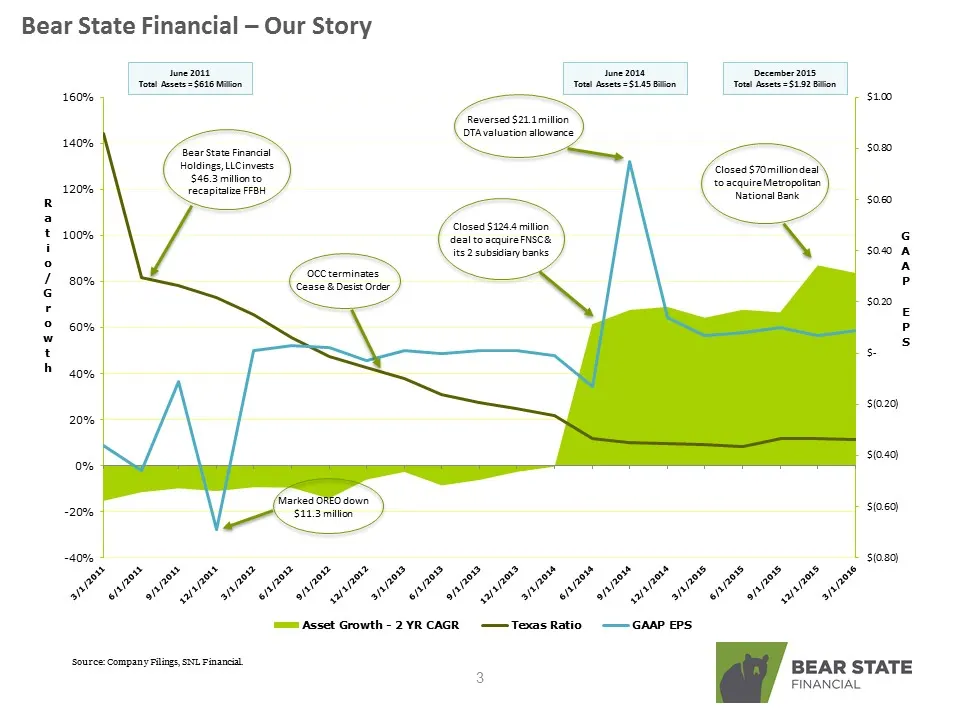
Bear State Financial —- Our Story oe vest lammen || rt TSS 160% 100 hevre 24 ion 0% Bear State Financial ae "Stig ies Geet somite ion ecureeropon 120% recapitalize FFBH nm Tense sa 2 hued $124 100% ‘deal to acquire FNSC& < i Tedsnssam an wo ° A 1 80% r s $0.20 r E 2 c0% P w 5 : . 40% sto20 20% S{0.4
Slide 4: ée BEAR STATE
ée BEAR STATE
Slide 5: Well Positioned to Drive Sustained, Long-Term Growth & Returns
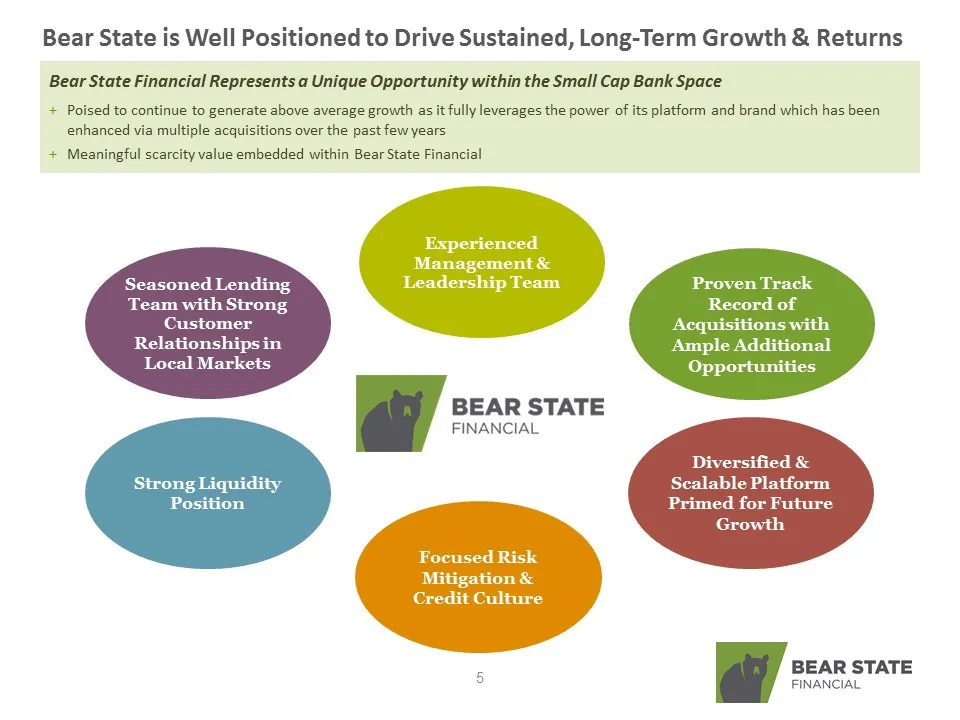
Bear State is Well Positioned to Drive Sustained, Long-Term Growth & Returns Bear State Financial Represents a Unique Opportunity within the Small Cap Bank Space + Poised to continue to generate above average growth as it fully leverages the power of its platform and brand which has been enhanced vi
Slide 6: Financial Investment Highlights: Experienced Management & Leadership Team - Board
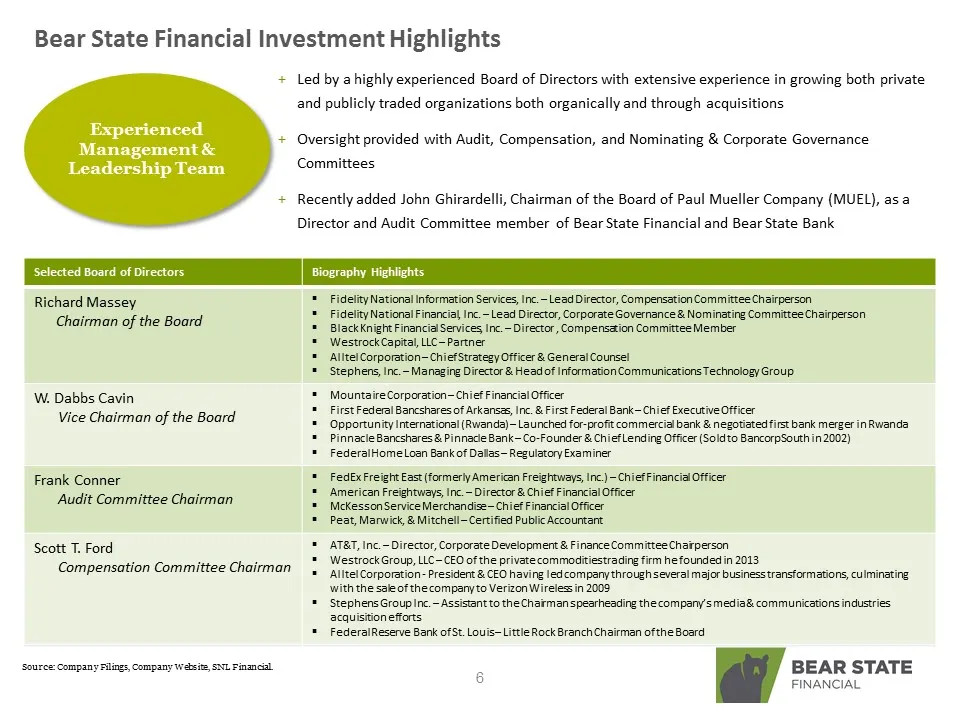
Bear State Financial Investment Highlights Experienced Management & Leadership Team Selected Board of Directors Led by a highly experienced Board of Directors with extensive experience in growing both private and publicly traded organizations both organically and through acquisi ions Oversight provi
Slide 7: Financial Investment Highlights: Selected Senior Management
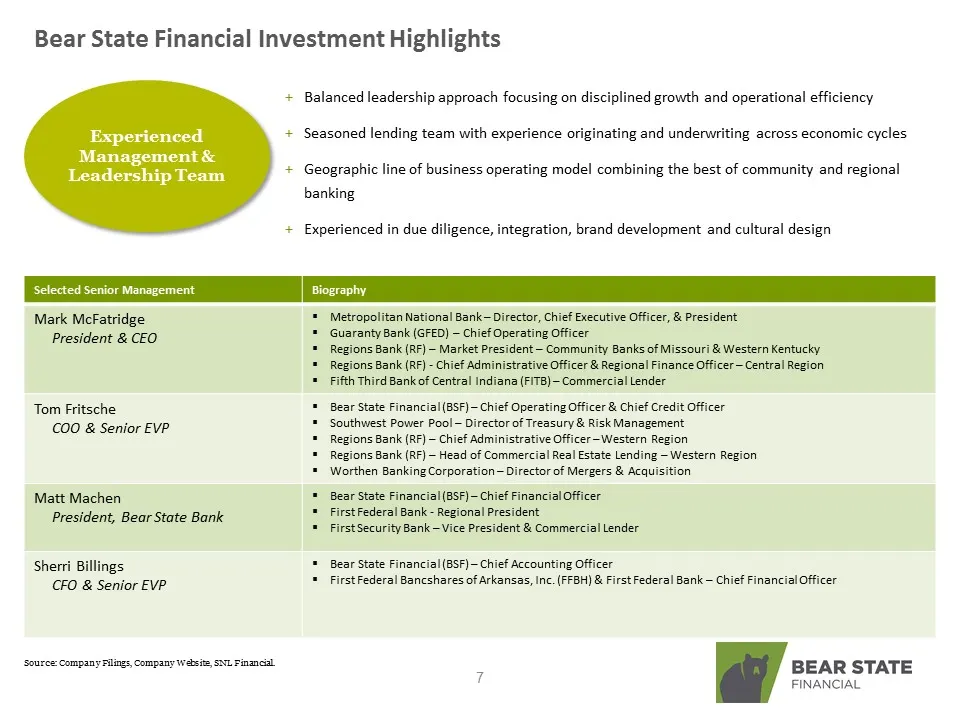
Bear State Financial Investment Highlights Experienced Management & Leadership Team Selected Senior Management Balanced leadership approach focusing on disciplined growth and operational efficiency Seasoned lending team with experience originating and underwriting across economic cycles Geographic l
Slide 8: Financial Investment Highlights: Proven Track Record of Acquisitions
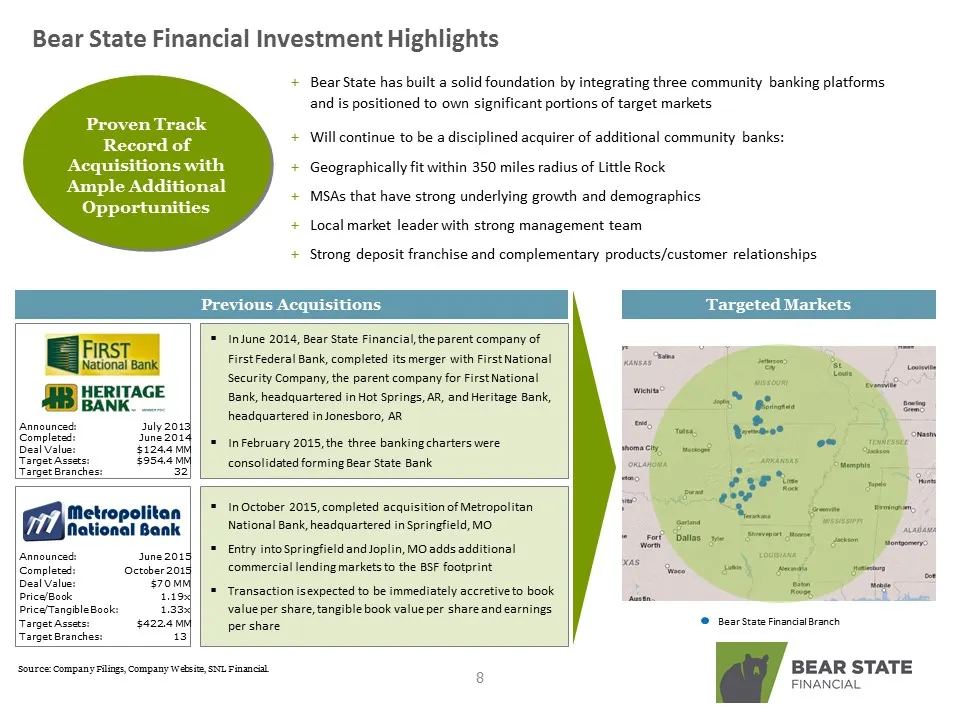
Bear State Financial Investment Highlights + Bear State has built a solid foundation by integrating three community banking platforms and is positioned to own significant portions of target markets Proven Track Record of + Will continue to be adi ed acquirer of additional community banks: Acquisitio
Slide 9: Growth Markets
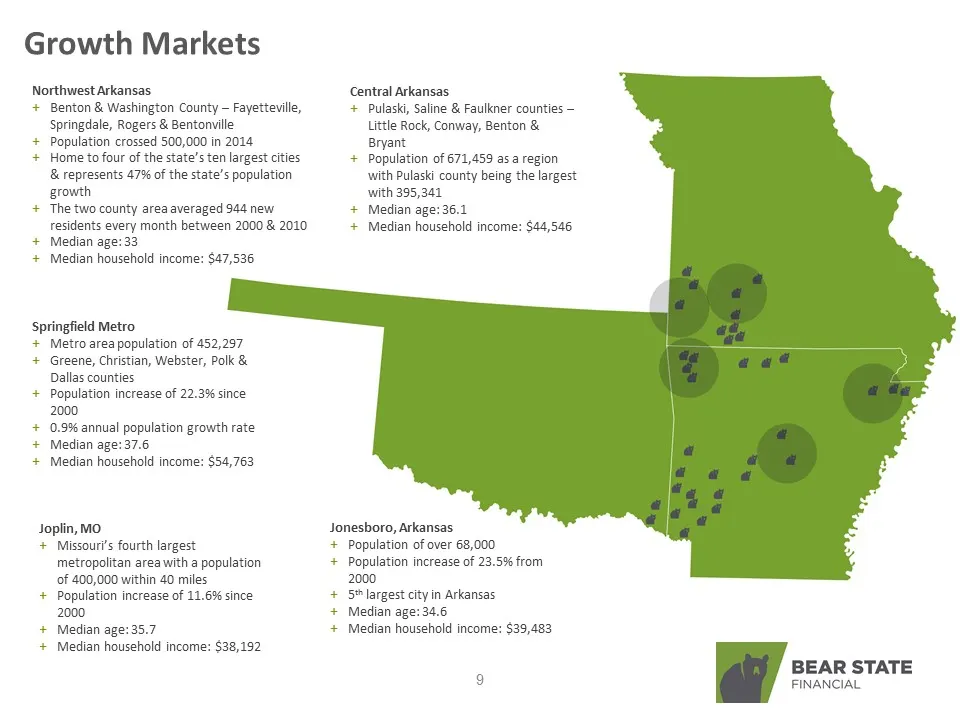
Growth Markets Northwest Arkansas + Benton & Washington County — Fayetteville, Springdale, Rogers & Bentonville + Population crossed 500,000 in 2014 + Home to four of the state’s ten largest cities & represents 47% of the state’s population growth + The two county area averaged 944 new residents eve
Slide 10: Financial Investment Highlights: Diversified & Scalable Platform
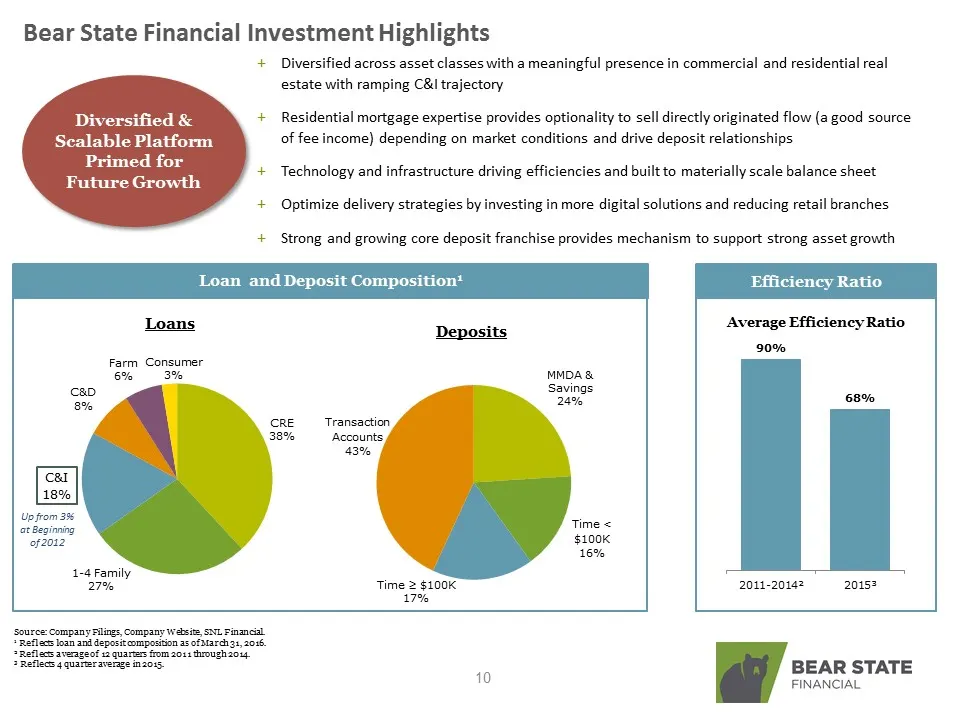
Bear State Financial Investment Highlights + Diversified across asset classes with a meaningful presence in commercial and residential real estate with ramping C& trajectory + Residential mortgage expertise provides optionality to sell directly originated flow (a good source of fee income) depending
Slide 11: Financial Investment Highlights: Focused Risk Mitigation & Credit Culture
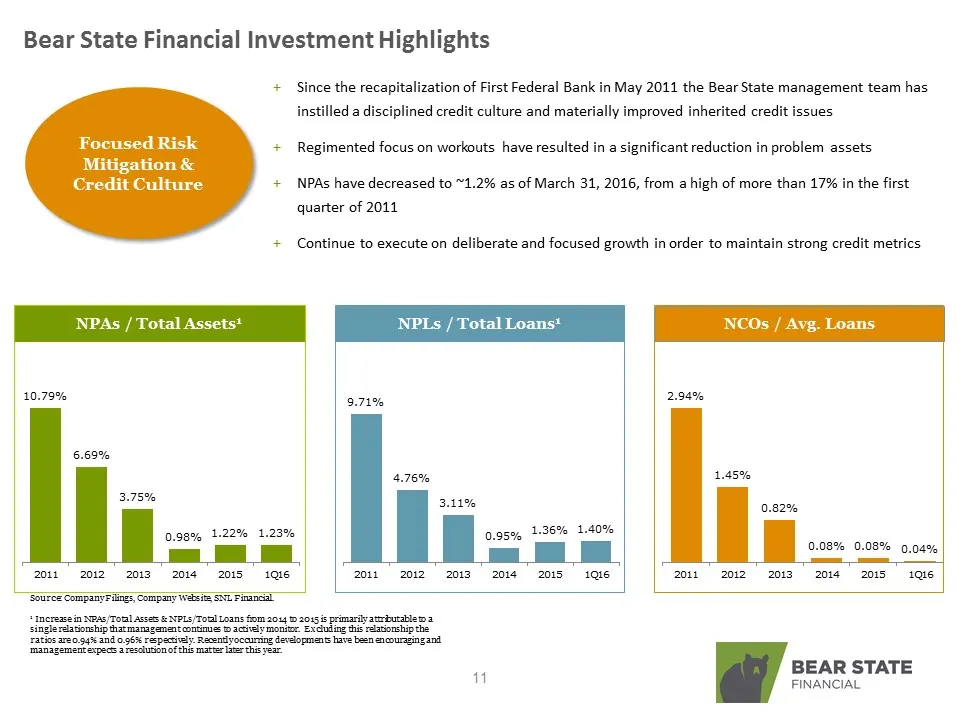
Bear State Financial Investment Highlights Focused Risk + Mitigation & Credit Culture + NPAs have decreased to ~1.2% as of March 31, 2016, from a high of more than 17% in the first, quarter of 2011 NPAs / Total Assets* NPLs / Total Loans* 0.98% 1.22% 1.23% o.95% 136% 2011 2012 2013 2014-2015 1416 oi
Slide 12: Financial Investment Highlights: Strong Liquidity Position
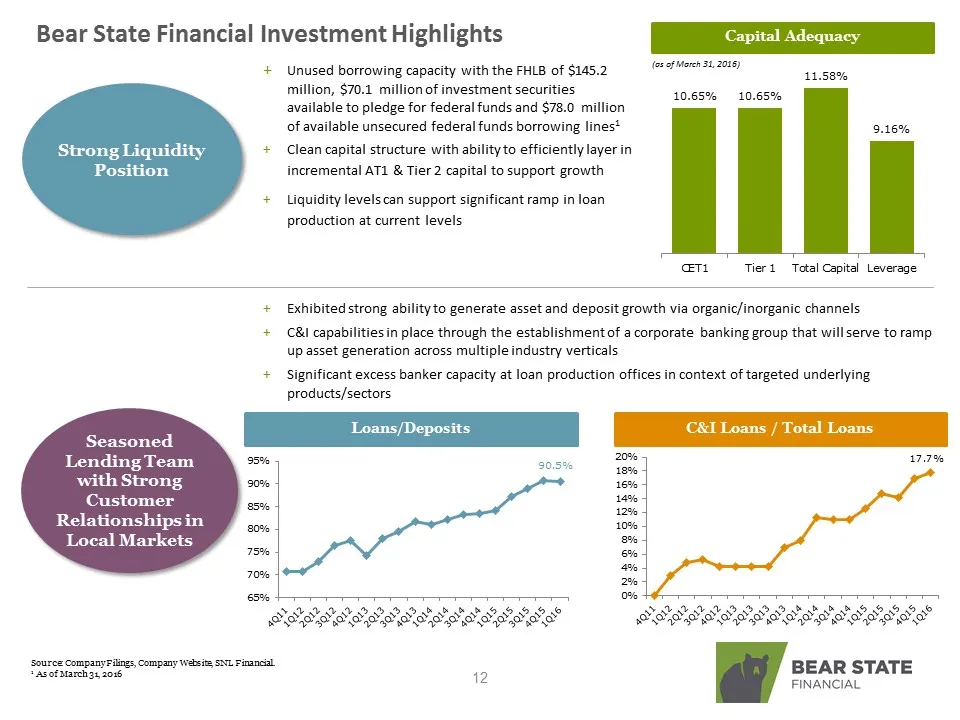
Bear State Financial Investment Highlights + Strong Liquidity Position Capital Adequacy Unused borrowing capacity with the FHLB of $145.2 sical million, $70.1 million of investment securities available to pledge for federal funds and $78.0 million of available unsecured federal funds borrowing lines
Slide 13: Additional Financial Data
Additional Financial Data | es STATE FINANCIAL
Slide 14: 2015 Highlights
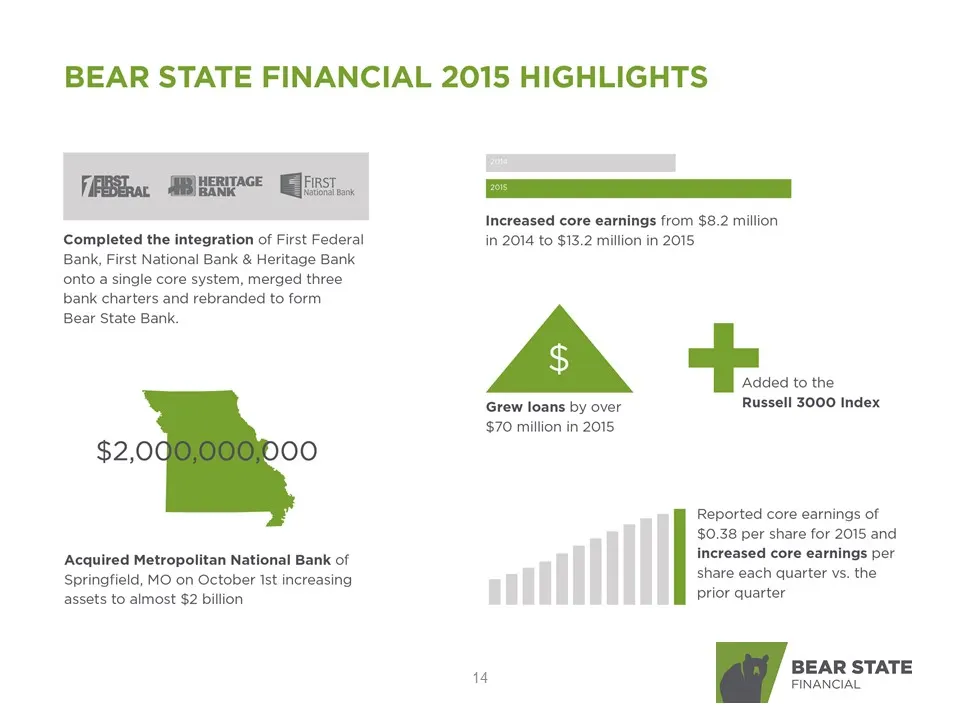
BEAR STATE FINANCIAL 2015 HIGHLIGHTS Fit MRA BESS. Increased core earnings from $8.2 million Completed the integration of First Federal in 2014 to $13.2 million in 2015 Bank, First National Bank & Heritage Bank conto a single core system, merged three bank charters and rebranded to form Bear State B
Slide 15: Balance Sheet Growth Acquisitions
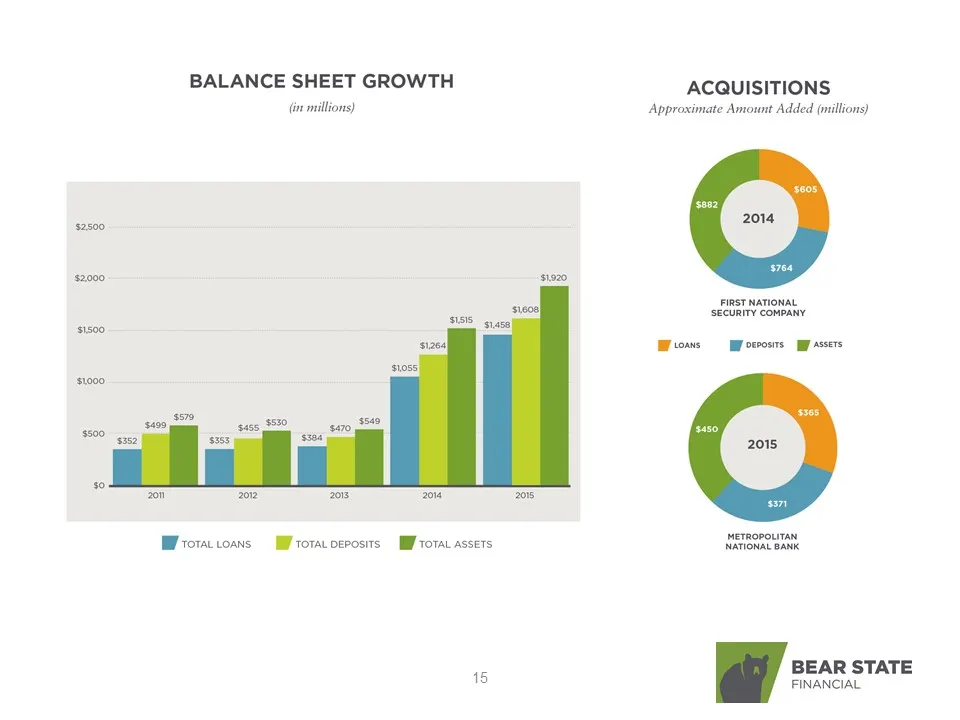
BALANCE SHEET GROWTH ACQUISITIONS (in millions) Approximate Amount Added (millions) FIRST NATIONAL. $1500 toms yf oxvosits gy assers ‘s1000 eS METROPOLITAN, Witotacoans = Mf toracoeposits Mf Tora assets NATIONAL BANK BEAR STATE 15 FINANCIAL
Slide 16: Core Income & Core EPS
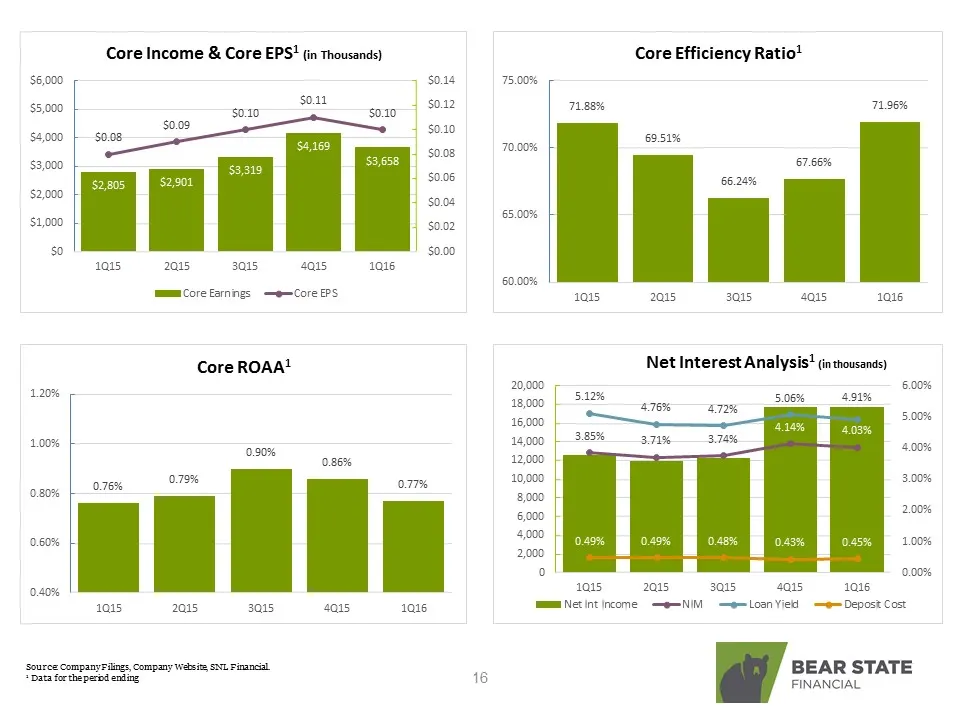
Core Income & Core EPS? (in thousands) $6,000 $0.10 1015 201s 3015 soa 4015 mEMEECore Earrings —e=Core EPS: Core ROAA* 1.20% 1.00% 0.90% 0.7956 -f | aoe if 1015 2015 sais Source CompanyFilngs Company Websity SL Financia, Data forthepered enti 0.86% 4015 soe soso $01? $0.0 0.08 $0.08 $0.04 0.02 $0.00
Slide 17: Summary Balance Sheet
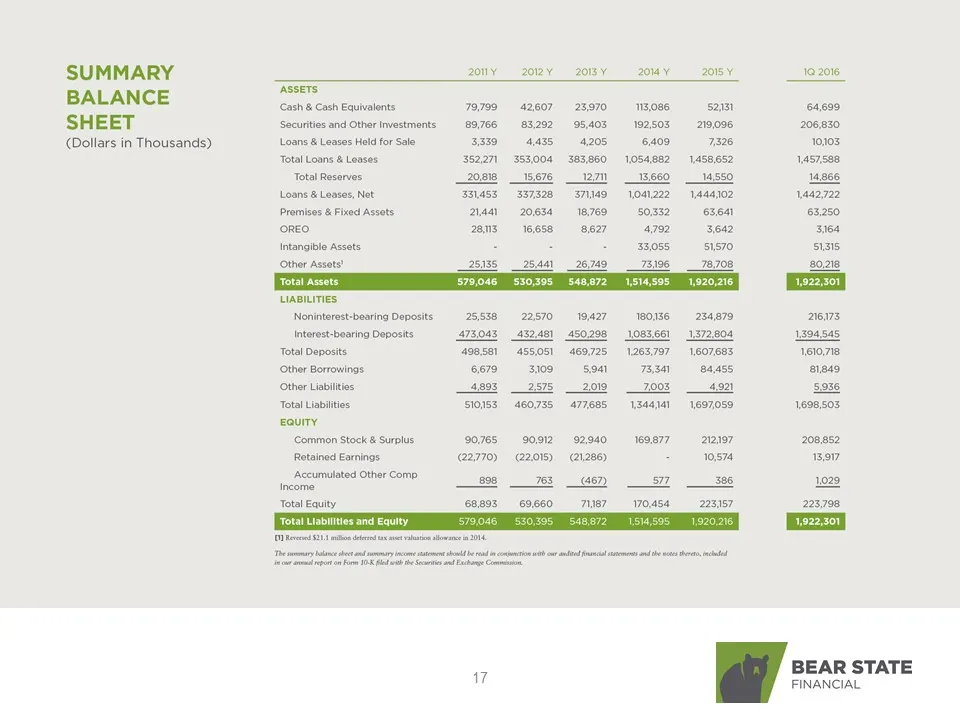
SUMMARY BALANCE SHEET (Dollars in Thousands) zony _20Y _208Y__20HY 2018 102016 ro Cash Cash Equivalents ya700 42607 25970 0882 64699 Secures and Other investments 69,766 83282 95403182503 219096 206830 Loans & Leases Held for Sle 3389 4435420540, 7826, 10103 Total Loans & Leases 352271 353004 385950
Slide 18: Summary Income Statement
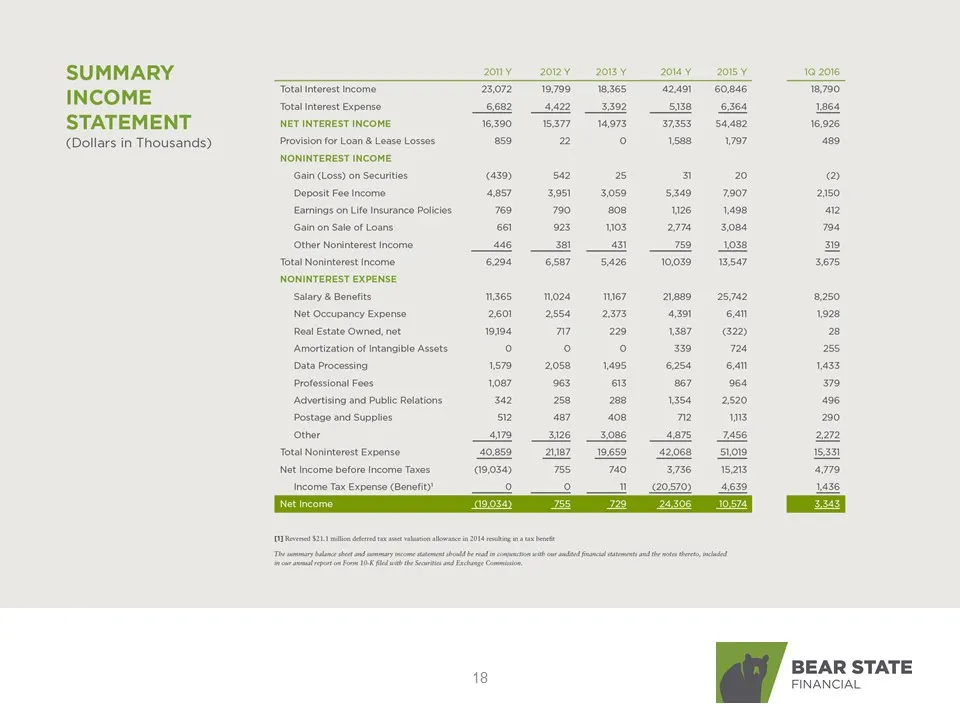
SUMMARY INCOME STATEMENT (Dollars in Thousands) 2onY _202Y _201Y _—-20KMY _205 102016 Total interest income 23072 19709 ~—+18365—~—«a2.a0]~—«GOAS 18790 ‘Total nterest Expense sez _4422 __ 3,302 58a 6.364 1364 NET INTEREST INCOME 16590 15377 «149787358 54.482 16.926 Provision for Loan & Lease Losses
Slide 19: Leadership Team
Bear State Leadership Team
Slide 20: Financial & Bank Board of Directors
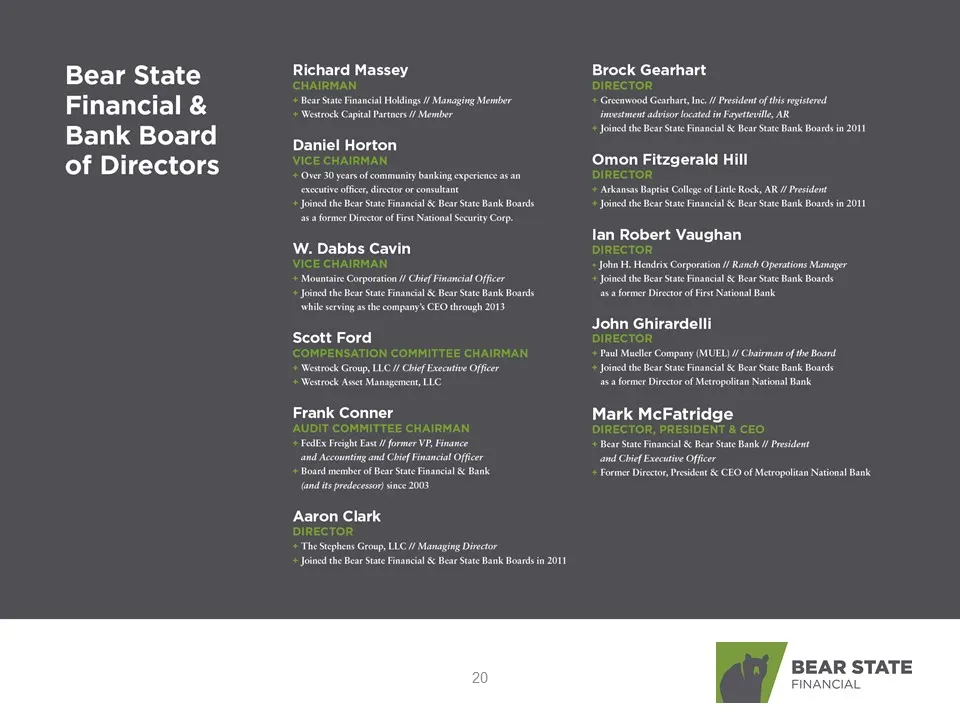
Bear State Financial & Bank Board of Directors Richard Massey Rear State Financial Holdings // Manoging Member Westrock Capital Partners // Member Daniel Horton ‘Over 30 years of community banking experience as an ‘exccutive offer, director or consultant Joined the Rese State Financial & Br State Ra
Slide 21: Bank Leadership Team
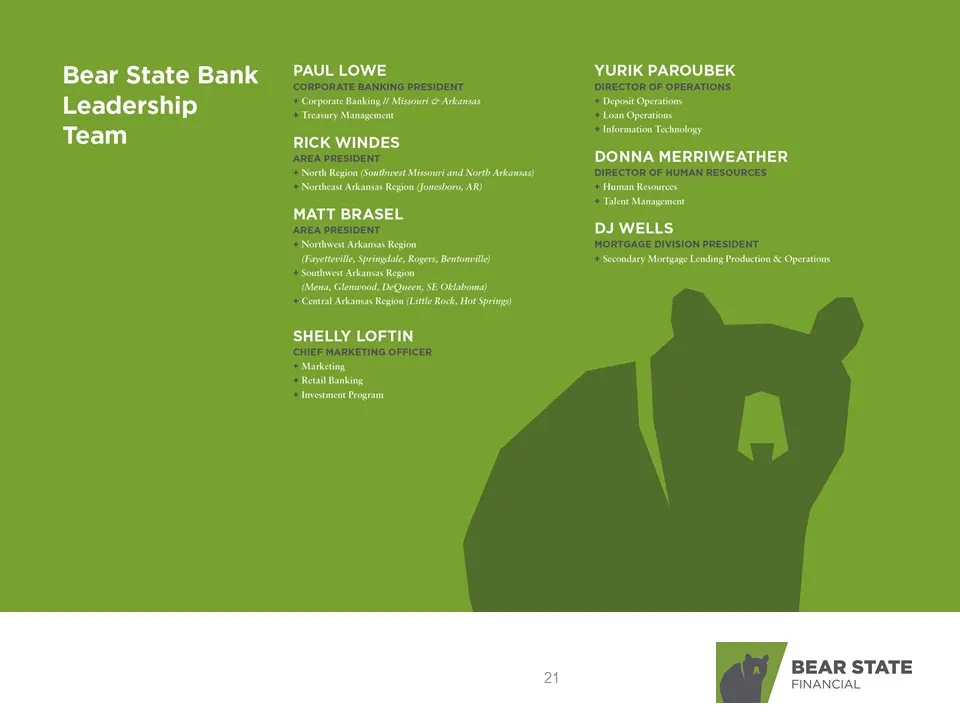
Bear State Bank Leadership Team PAUL LOWE (Corporate Banking Mistouri Arkansas Treasary Manag RICK WINDES thet Mi [Northeast Arkansas Regio MATT BRASEL. Arkansas) Northest Ae 2s Regi ig ayetteville Rogers, Bentowille Southwest Arkansas Rego (Mena, Glencood, De SE Oblaboma) (CenralAekansas Regio (Lit
Slide 22: Appendix
Appendix | es STATE FINANCIAL
Slide 23: Reconciliation of Non-GAAP Financial Data
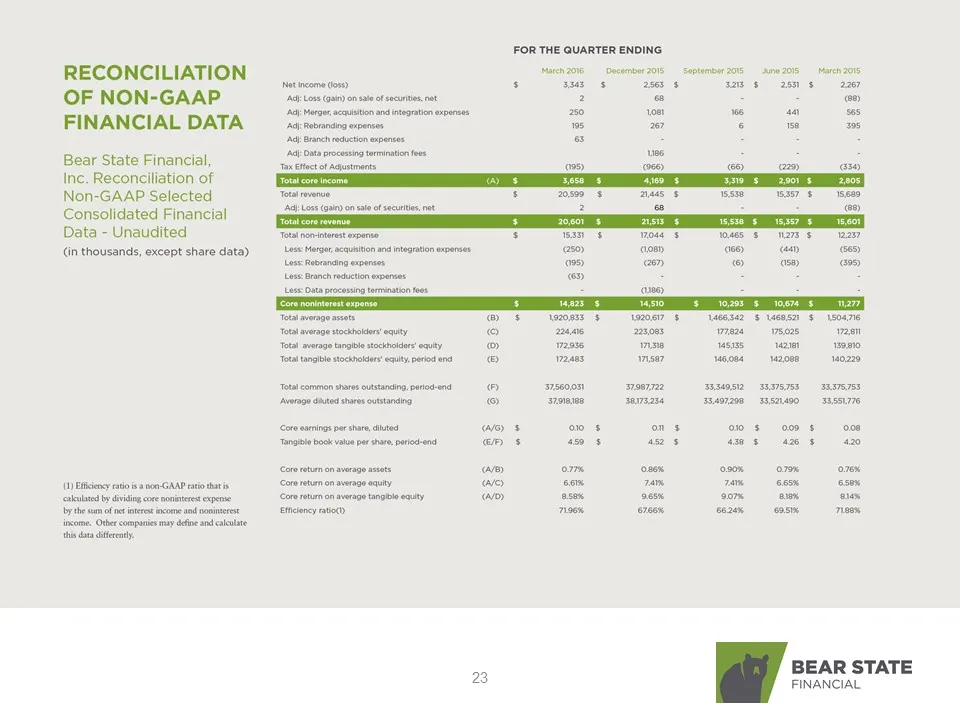
FOR THE QUARTER ENDING RECONCILIATION. March 2016 December 2015 September 2015 Ane 2015 March 2015, Net cam Gos) 5 Bus $2555 5 sas $ asi $2267 OF NON-GAAP ‘Ae: Lo (ona sciies, rat 2 oo 2 E ‘Ac: orga acestton and tert expen 250 os 6 aa ses FINANCIAL DATA ‘i: Rebranding expenses 195 207 6 158 395 ‘Ac:
Slide 24: 1Q16 BSF Earnings Release
1Q16 BSF Earnings Release
Source: SEC EDGAR · 8-K filed May 9, 2016