Consolidated Communications — Deutsche Bank 2006 High Yield Conference
31 slides from Consolidated Communications's conference presentation, Oct 4, 2006
Slide 1: Deutsche Bank 2006 High Yield Conference
Consolidated’ communications Qe Steve Childers — Chief Financial Officer Deutsche Bank 2006 High Yield Conference October 3-5, 2006
Slide 2: Regulation G and Safe Harbor
e (Consolidated ulation G and Safe Harbor Regulation G This presentation contains disclosures regarding our “adjusted EBIDTA”, cash available to pay dividends and “total net debt to last 12-month adjusted EBITDA" (which we refer to as leverage), allof which are non-GAAP financial measures as defined
Slide 3: Company Overview
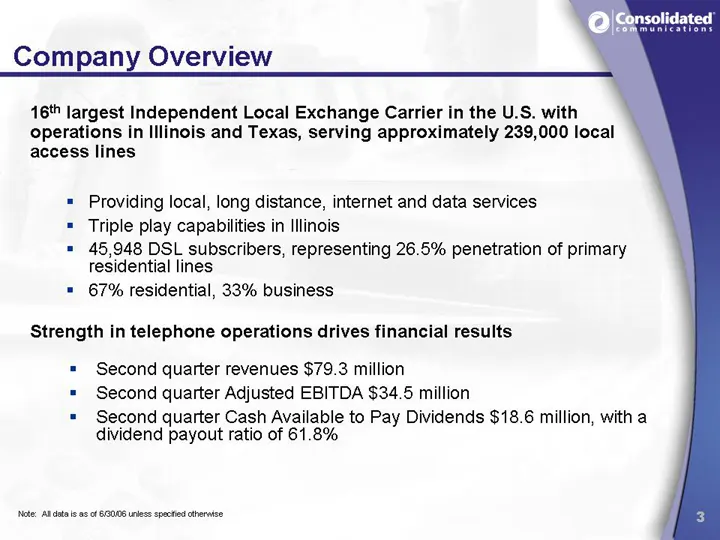
Company Overview 16 largest Independent Local Exchange Carrier in the U.S. with operations in Illinois and Texas, serving approximately 239,000 local access lines = Providing local, long distance, internet and data services = Triple play capabilities in Illinois = 45,948 DSL subscribers, representin
Slide 4: More Than 100 Years of Operations
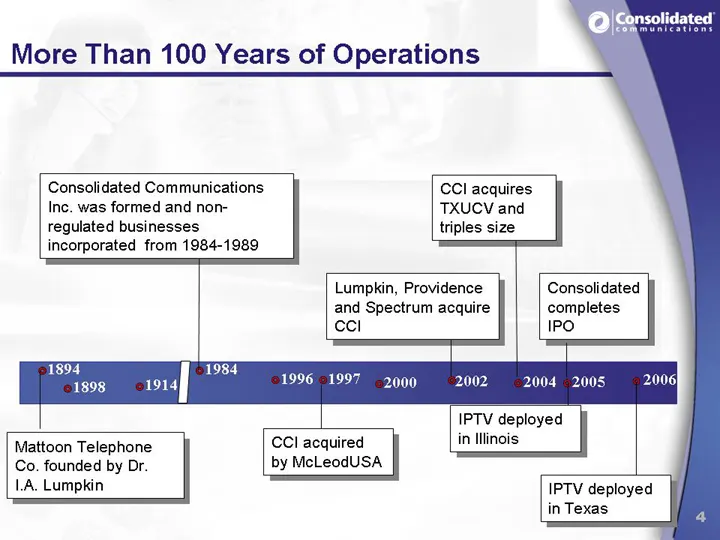
More Than 100 Years of Operations Consolidated Communications Inc. was formed and non- regulated businesses incorporated from 1984-1989 triples size CCI acquires TXUCV and Lumpkin, Providence and Spectrum acquire ccl 1894 1898 1996 1997 1984 1914 2000 CCI acquired in Illinois by McLeodUSA Mattoon Te
Slide 5: Stable Rural Markets in Illinois & Lufkin, Texas
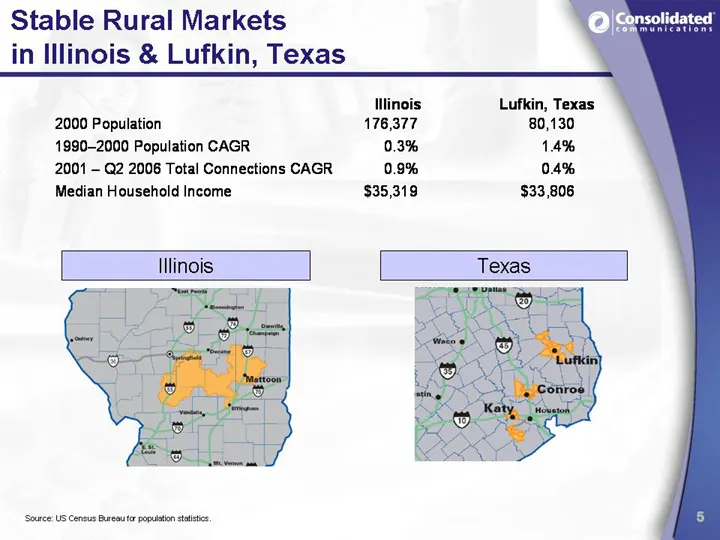
Stable Rural Markets in Illinois & Lufkin, Texas Minois Lufkin, Texas 2000 Population 176,377 80,130 1990-2000 Population CAGR: 0.3% 14% 2001 - Q2 2006 Total Connections CAGR 0.9% 04% Median Household Income $35,319 $33,806 Illinois ‘Source: US Cenaus Buea popu ttiis,
Slide 6: Growing Suburban / Rural Markets in Katy & Conroe, Texas
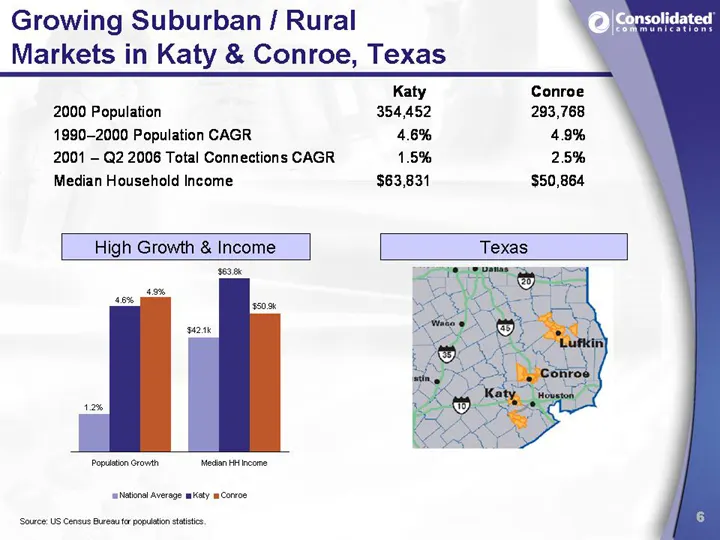
Growing Suburban / Rural Markets in Katy & Conroe, Texas Katy Conroe 2000 Population 354,452 293,768 1990-2000 Population CAGR 46% 49% 2001 - Q2 2006 Total Connections CAGR 1.5% 25% Median Household Income $63,831 $50,864 High Growth & Income so wen Popusten Crown Messin Fae sheen Average mKaty mCor
Slide 7: Limited Competition
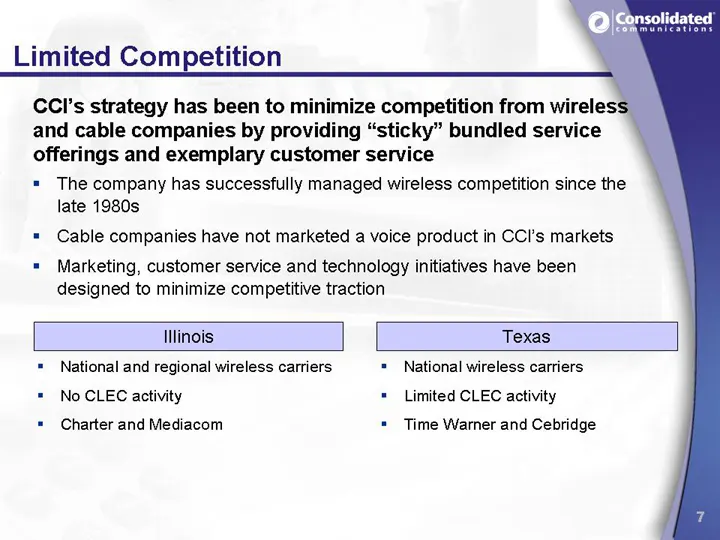
Limited Competition CCl’s strategy has been to minimize competition from wireless and cable companies by providing “sticky” bundled service offerings and exemplary customer service = The company has successfully managed wireless competition since the late 1980s = Cable companies have not marketed a
Slide 8: Federal, Illinois and Texas Regulation
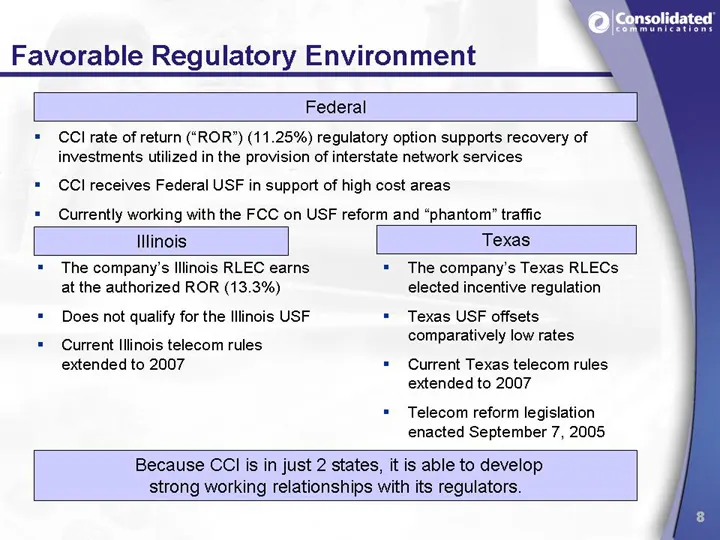
Federal CCI rate of return (“ROR”) (11.25%) regulatory option supports recovery of investments utilized in the provision of interstate network services CCI receives Federal USF in support of high cost areas Currently working with the FCC on USF reform and “phantom" traffic Illinois Texas The company
Slide 9: Experienced & Operations-Focused Management Team
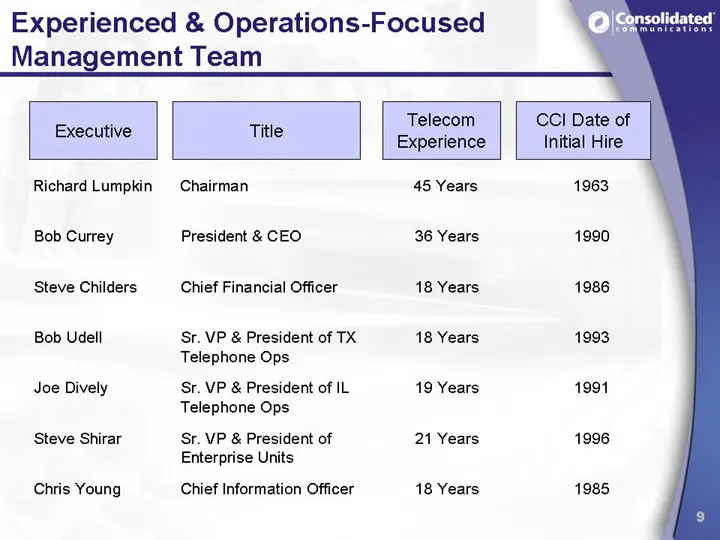
Experienced & Operations-Focused Management Team Executive Title Telecom CCI Date of Experience Initial Hire Richard Lumpkin Chairman 45 Years Bob Currey President & CEO. 36 Years 1990 ‘Steve Childers Chief Financial Officer 18 Years 1986 Bob Udell Sr. VP & President of TX 18 Years 1993 Telephone Op
Slide 10: Executing on our Strategy
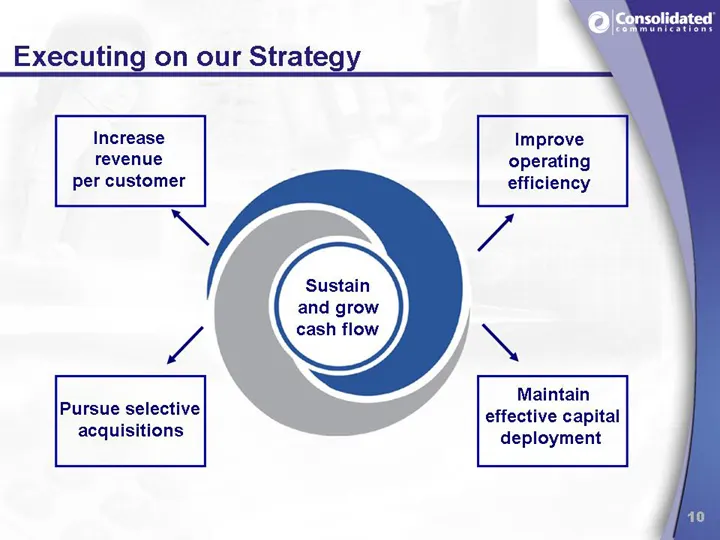
Executing on our Strateg Increase Improve revenue operating per customer efficiency x hor Sustain and grow TA cash flow SS Maintain effective capital deployment Pursue selective acquisitions
Slide 11: Increasing Revenue
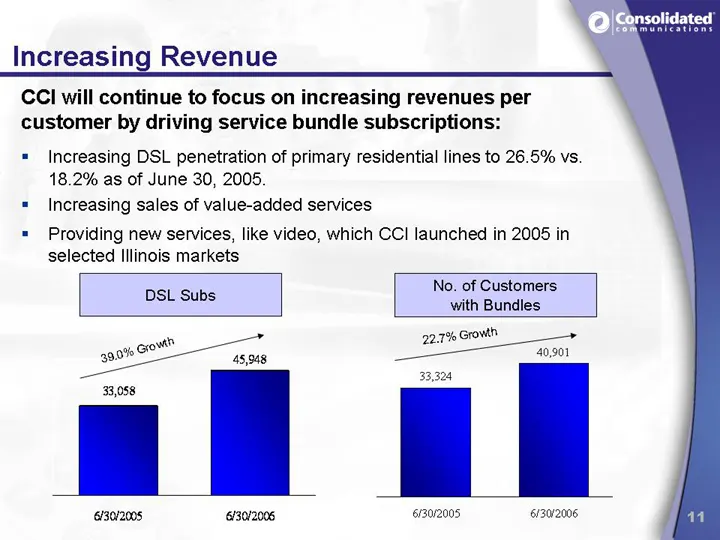
Increasing Revenue CCI will continue to focus on increasing revenues per customer by driving service bundle subscriptions: = Increasing DSL penetration of primary residential lines to 26.5% vs. 18.2% as of June 30, 2005. = Increasing sales of value-added services = Providing new services, like video
Slide 12: Increasing Revenue
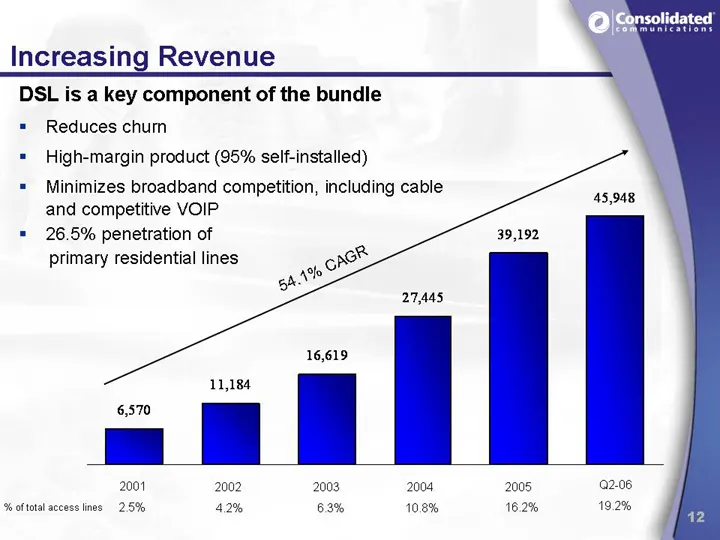
Increasing Revenue DSL is a key component of the bundle = Reduces chum = High-margin product (95% self-installed) = Minimizes broadband competition, including cable and competitive VOIP = 26.5% penetration of primary residential lines % oftotal access ines 2.5% 42% 63% 108% 16.2%
Slide 13: Increasing Revenue — New Opportunity
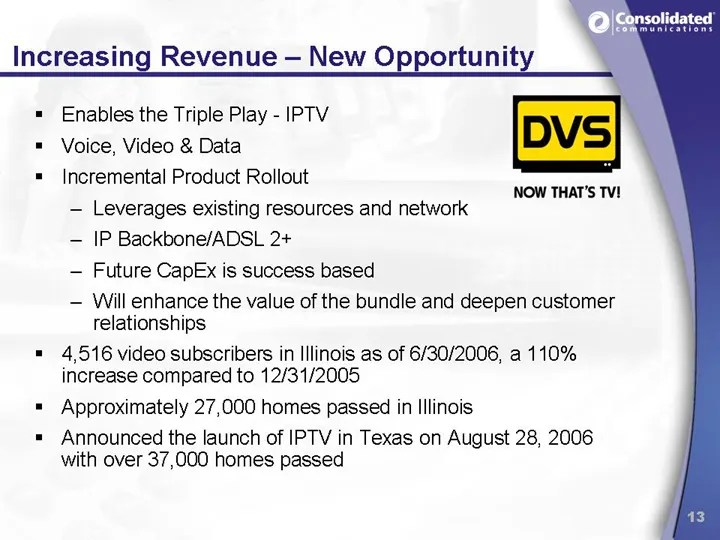
Increasing Revenue — New Opportunity = Enables the Triple Play - IPTV = Voice, Video & Data = Incremental Product Rollout — Leverages existing resources and network — IP Backbone/ADSL 2+ — Future CapEx is success based — Will enhance the value of the bundle and deepen customer relationships = 4,516
Slide 14: Stable Customer Base
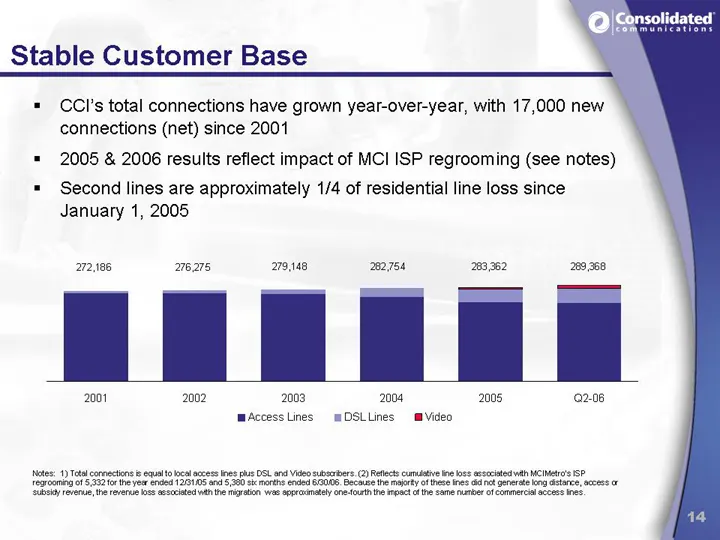
Stable Customer Base CC's total connections have grown year-over-year, with 17,000 new connections (net) since 2001 = 2005 & 2006 results reflect impact of MCI ISP regrooming (see notes) = Second lines are approximately 1/4 of residential line loss since January 1, 2005 272,186 6275 279,148 2754 200
Slide 15: Integration Creates Potential for Greater Operating Efficiencies
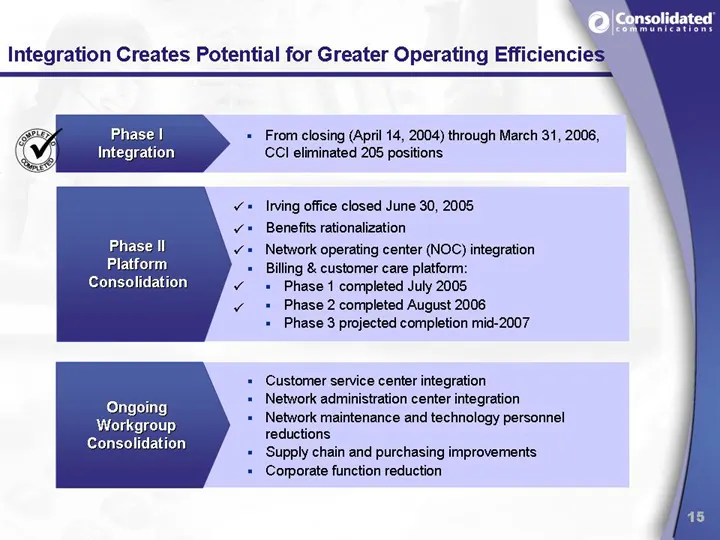
Integration Creates Potential for Greater Operating Efficiencies e Phase | + From closing (April 14, 2004) through March 31, 2006, ve Integration CCl eliminated 205 positions Irving office closed June 30, 2005 Benefits rationalization Network operating center (NOC) integration Billing & customer car
Slide 16: Adjusted EBITDA per Employee
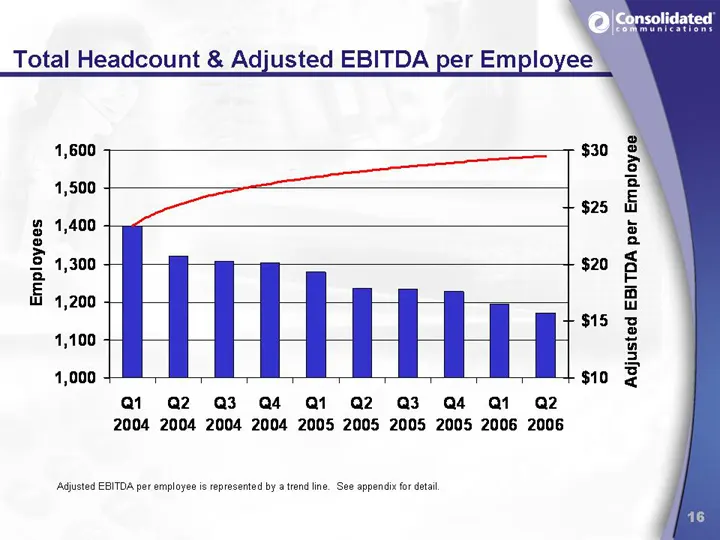
1,500 + $25 ¥ 1,400 + = 2 1,300 4 $20 & 1,200 + $15 1,000 + + $10 ai @2 Q@3 Q@4 Qi Q@2 G3 G4 Qi a2 2004 2004 2004 2004 2005 2005 2005 2005 2006 2006 ‘Adjusted EBITDA per employee is represented by a trendline. See appendix for detail Adjusted EBITDA per Employ:
Slide 17: Effective Capital Deployment
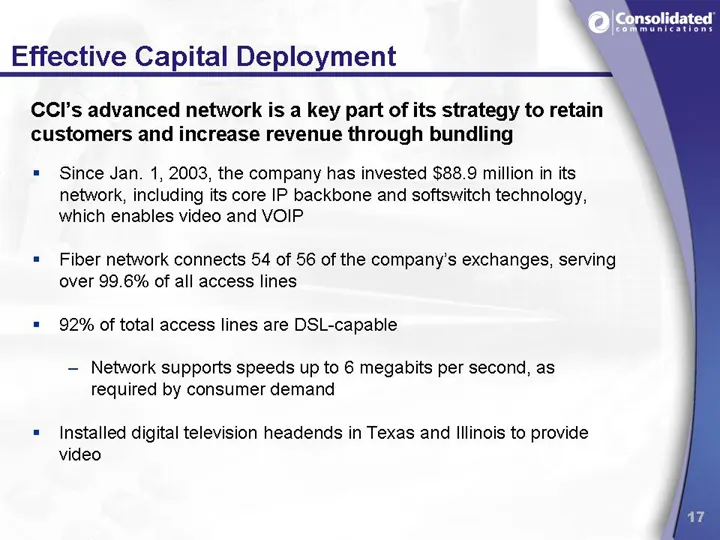
Effective Capital Deployment CCl’s advanced network is a key part of its strategy to retain customers and increase revenue through bundling = Since Jan. 1, 2003, the company has invested $88.9 million in its network, including its core IP backbone and softswitch technology, which enables video and V
Slide 18: Acquisition Philosophy
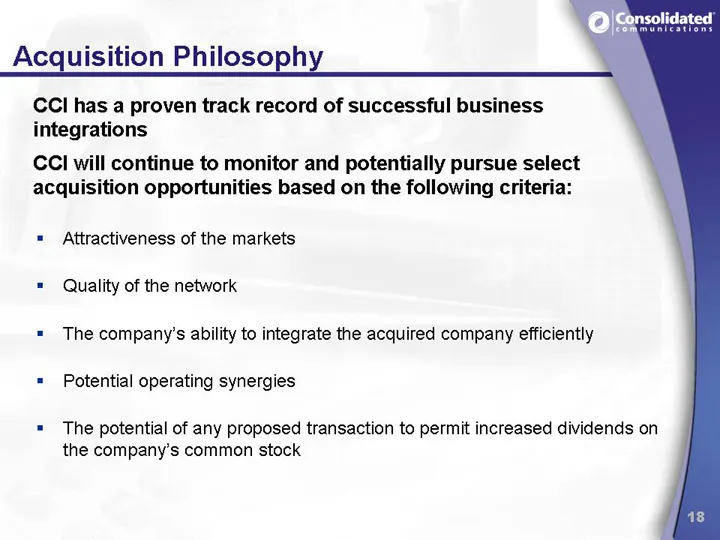
Acquisition Philosoph CCI has a proven track record of successful business integrations ccl acqui: I continue to monitor and potentially pursue select ition opportunities based on the following criteria: = Attractiveness of the markets = Quality of the network = The company’s ability to integrate th
Slide 19: Solid Financial Results
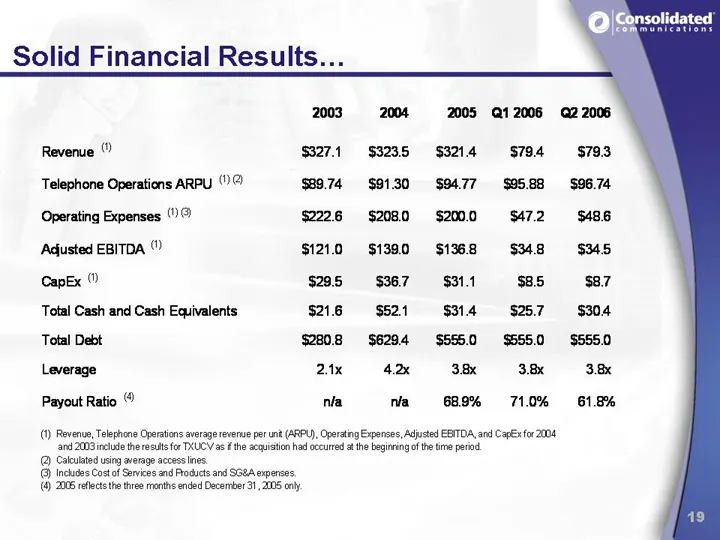
Solid Financial Results... Revenue $327.1 $3235 $3214 $794 $793 Telephone Operations ARPU (")® $89.74 $9130 $84.77 $8588 $96.74 Operating Expenses ()® $2226 $2080 $200 S72 $486 Adusted EBITDA $121.0 $1390 $1368 $348 $345 Capex $205 $367 $31.1 $85 $87 Total Cash and Cash Equivalents $216 $521 $314 $2
Slide 20: Capital Structure
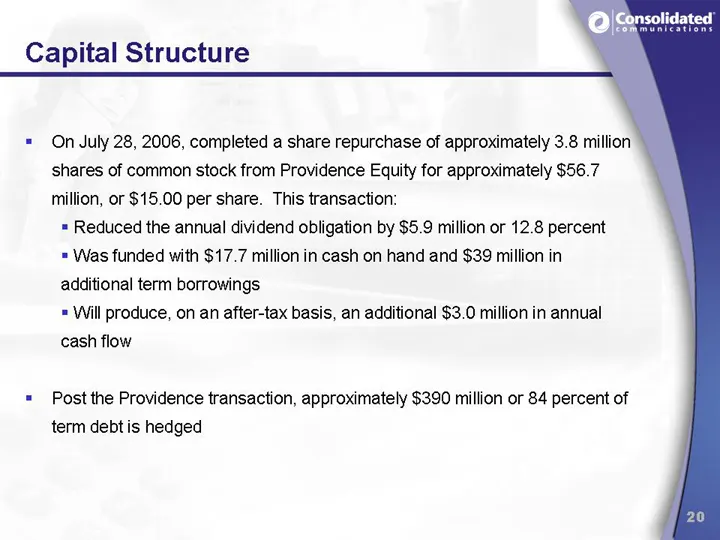
Capital Structure On July 28, 2006, completed a share repurchase of approximately 3.8 million shares of common stock from Providence Equity for approximately $56.7 million, or $15.00 per share. This transaction: = Reduced the annual dividend obligation by $5.9 million or 12.8 percent = Was funded wi
Slide 21: Investment Highlights
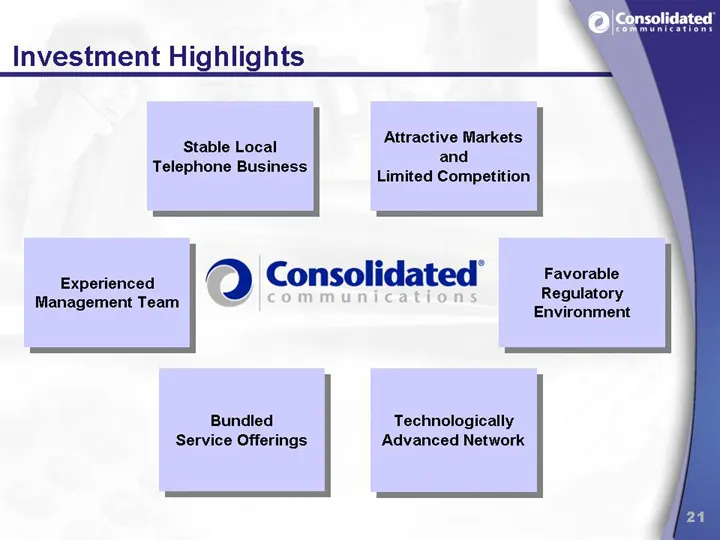
Investment Highlights Attractive Markets and Limited Competition Stable Local Telephone Business Experienced e@) Consolidated’ Favorable Management Team communications Regulatory Environment Bundled Technologically Service Offerings Advanced Network
Slide 22: Appendix
Appendix
Slide 23: GAAP Reconciliation
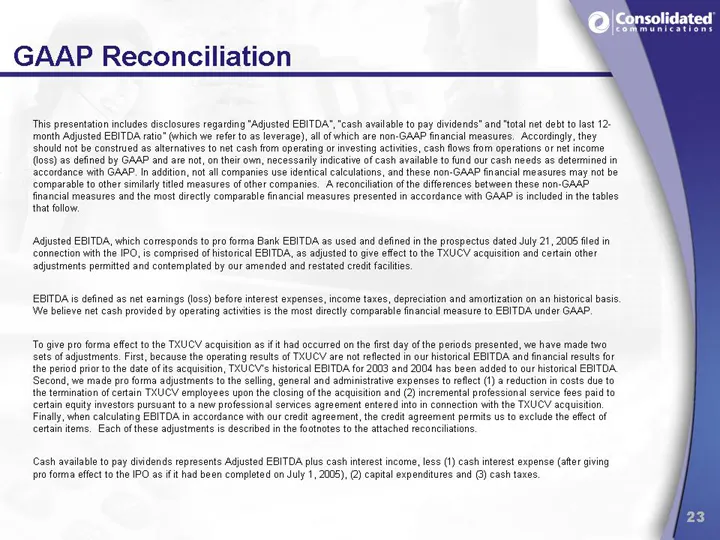
e Consolidated GAAP Reconciliation This presentation includes disclosures regarding “Adjusted EBITDA”, ‘cash available to pay dividends” and total net debt to last 12. ‘month Adjusted EBITDA ratio (which we refer to as leverage), all ofwhich are non-GAAP financial measures. Accordingly, they ‘should
Slide 24: GAAP Reconciliation
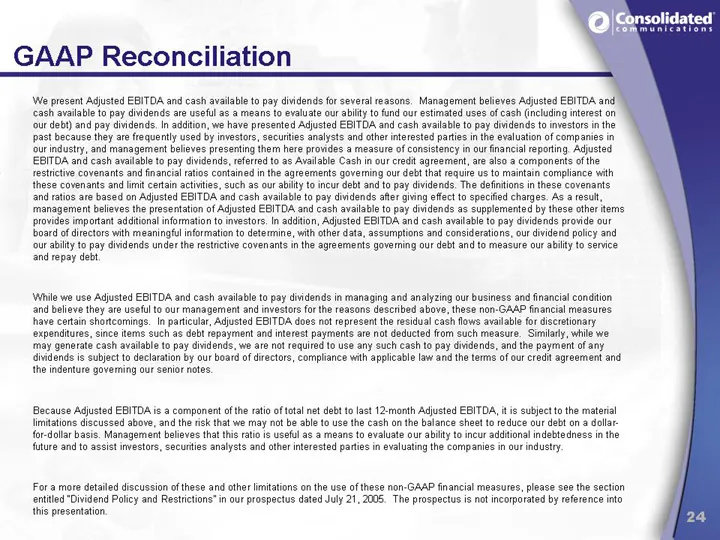
e Consolidated GAAP Reconciliation We present Adjusted EBITOA and cash available to pay dividends for several reasons. Management believes Adjusted EBITDA and ‘cach avaiable to pay dividends are usefl as a means to evaluate our abil to fund our estimated uses of cash (including interest on ‘ur debit
Slide 25: GAAP Reconciliation (Cont'd)
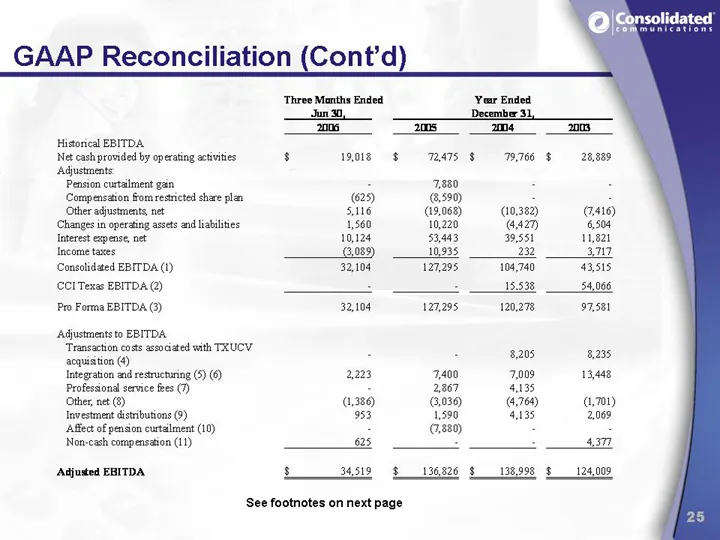
GAAP Reconciliation (Cont'd e (Consolidated “Three Manth Ended Your Ended “hn December 3, 2a a am a Hisoied EBITDA Netcashprovdedby operating settee $ wos $RaTs $8 $D ‘doses Penson cranes gin . 7980 : Comparsaion fom rece sh pan os 330) : Other adjustments, net 5116 (19,068) (10,382) (7,416) Change
Slide 26: GAAP Reconciliation (Cont'd)
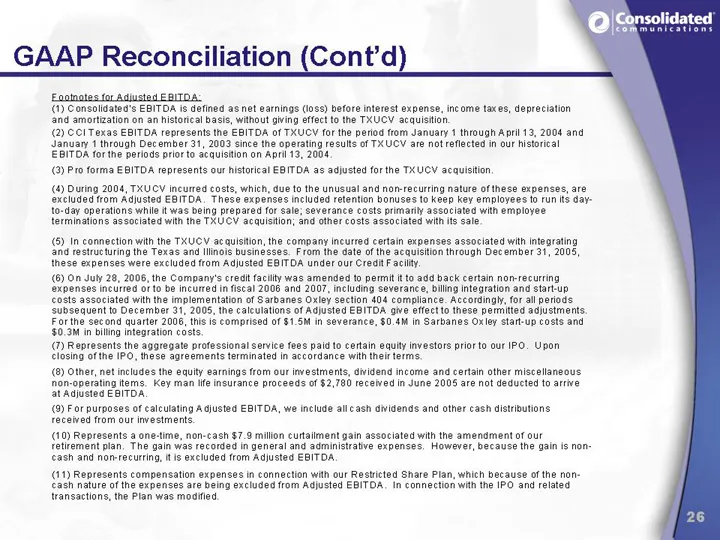
e Consolidated GAAP Reconciliation (Cont'd (1) Consoliatea's EBITOA ts defined as not earnings (oss) before interest expense, income taxes, depreciation {and amortzation on an histoncal basis, without giving effect to the TXUCY acquistion, (2) CCI Texas EBITDA represents the EBITDA of TXUCV for the
Slide 27: Cash Available to Pay Dividends
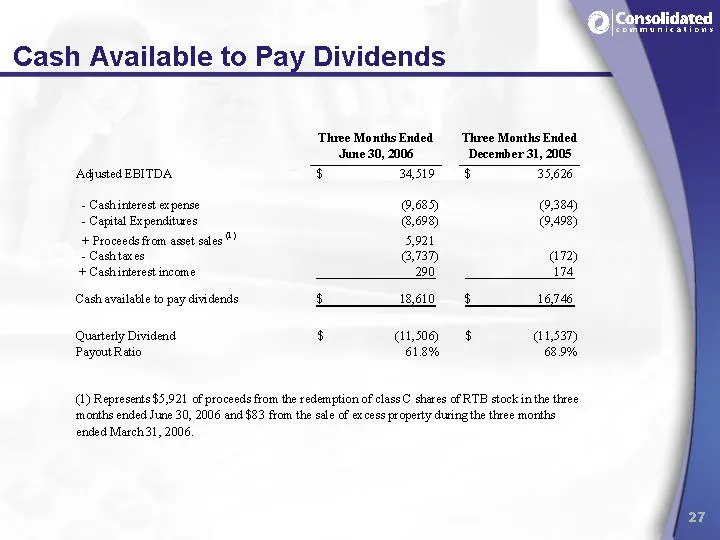
Olcorse! idated Cash Available to Pay Dividends ‘Three Months Ended Three Months Ended June 30, 2006 December 31, 2005 Adjusted EBITDA, 5 mss F 35,66 - Cashinterest expense 0,685) (9.384) - Capital Expenditures, G08) 0.498) + Proceeds from asset sales ®? 5921 - Cashtaces, 737 72) + Cash inierest inc
Slide 28: Total Net Debt to Adjusted EBITDA Ratio
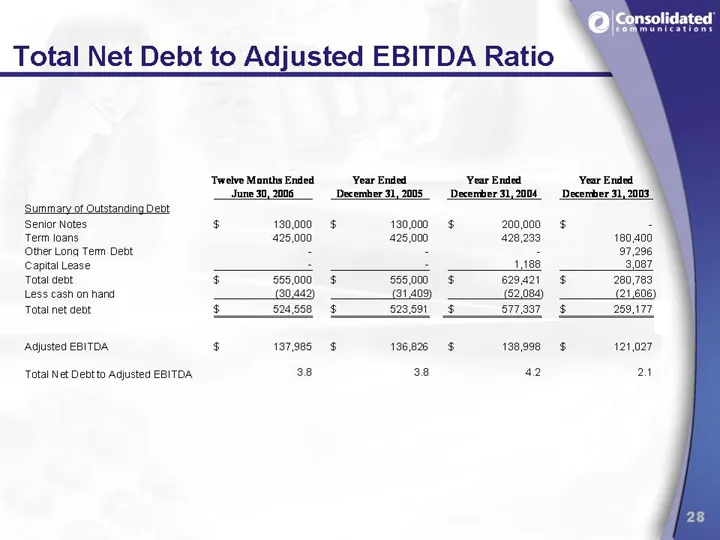
e (Consolidated Total Net Debt to Adjusted EBITDA Ratio ‘Summary of Outstanding Debt Senior Notes $ 190,000 $ 19000 $ 200000 ¢ . Term loans 425,000 425,000 428,233, 180,400 (Other Long Tenn Debt : - : 97,296 Capital Lease : : 1,188 31087 Total deot 3 955,000 $ 555000 $ e292 & 260,783 Less cash on ha
Slide 29: Adjusted EBITDA
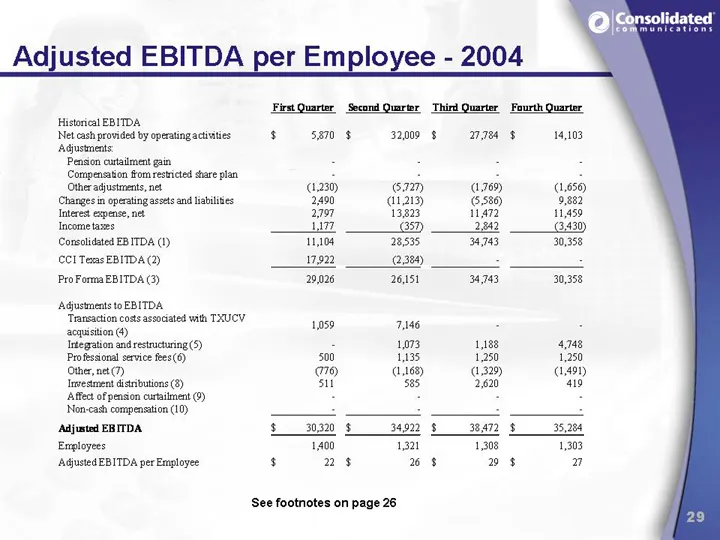
e (Consolidated Adjusted EBITDA ‘First Quarter Second Quarter Third Quarter Fourth Quarter Historical EBITDA Neteash provided by opeatingactiwies «$= 5870 $= 32009 $M $= 4 103 Agustments enon cutailment gain 2 - Compensation ftom restricted dare plan 3 5 é Other adjustments, net 230) om 4.769) (1,65
Slide 30: Adjusted EBITDA
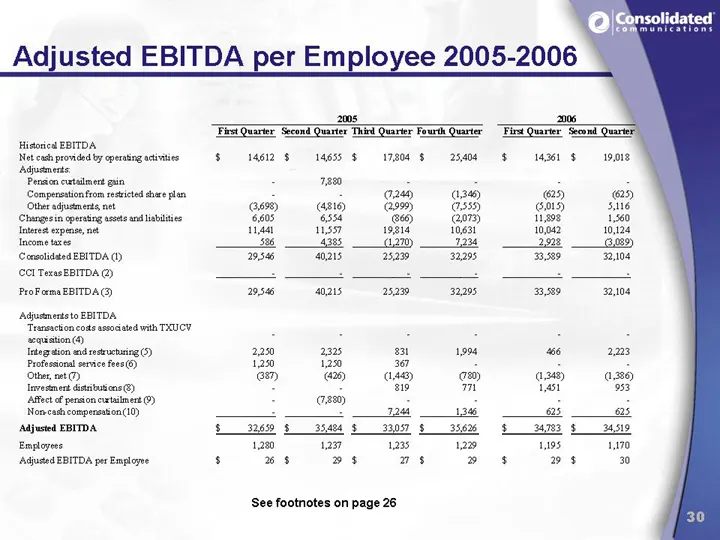
e (Consolidated Adjusted EBITDA 20s 2006 Fis Quarer Second Quarter Thid Quer Four Qurer “Find Quarter Seond 9 Higorca EBITDA Netewh prowdedty cperatingeciviies «$4612: $= «14655 $NTSOA SUSAN $14 $e Adjuamets Penson cutaimert in : 730 Compenestion from rected share plan : 924) 346) ay es Other adusim
Slide 31: Ending Access Lines and Telephone Operations ARPU
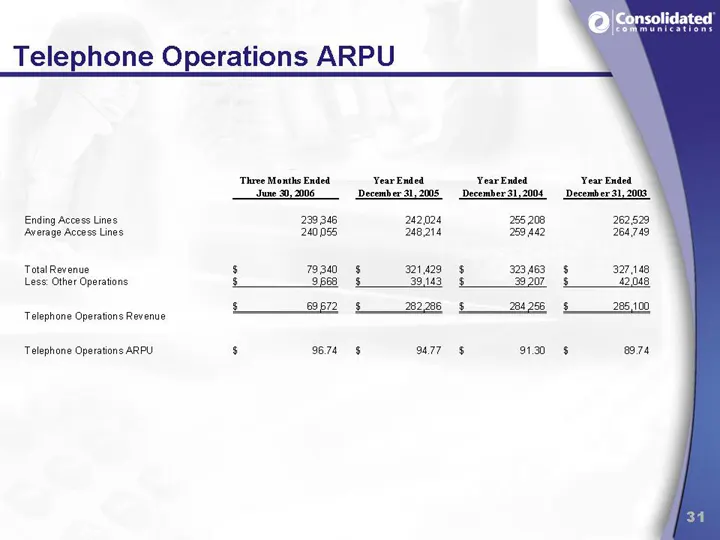
Ending Access Lines ‘Average Access Lines TotalRevenue Less: Other Operations Telephone Operations Revenue Telephone Operations ARPU e (Consolidated 733348 22004 255208 262529 24055 28.214 29a 264749 s 730 § mia § 323463 § 327148 8 3p § 33163 $ 33207 § 2008 A sap § e278 $ 2a2s8 $ 285,100 s 7 § ou77
Source: SEC EDGAR · 8-K filed Oct 4, 2006
More decks from Consolidated Communications
 Proxy Contest (January 2024)34 slides · Jan 11, 2024
 Merger or Acquisition (October 2023)7 slides · Oct 16, 2023
 Q2 2023 Earnings Presentation27 slides · Aug 8, 2023
 Q1 2023 Earnings Presentation28 slides · May 2, 2023
 Shareholder Meeting (May 2023)15 slides · May 1, 2023
 J.P. Morgan Global High Yield & Leveraged Finance Conference 202317 slides · Mar 7, 2023