Altra Industrial Motion — Q2 2018 Earnings Presentation
14 slides from Altra Industrial Motion's earnings presentation, Jul 26, 2018

Slide 1: Second Quarter 2018 Results
Second Quarter 2018 Results Exhibit 99.2
Slide 2: Q2 2018 Conference Call Details
Live Webcast July 26, 2018 at 10:00 AM ET 877-407-8293 Domestic 201-689-8349 International Webcast at www.altramotion.com Replay Through August 9, 2018 877-660-6853 Domestic 201-612-7415 International Conference ID: # 13681715 www.altramotion.com Q2 2018 Conference Call Details
Slide 3: SEC Disclosure Rules Additional Information
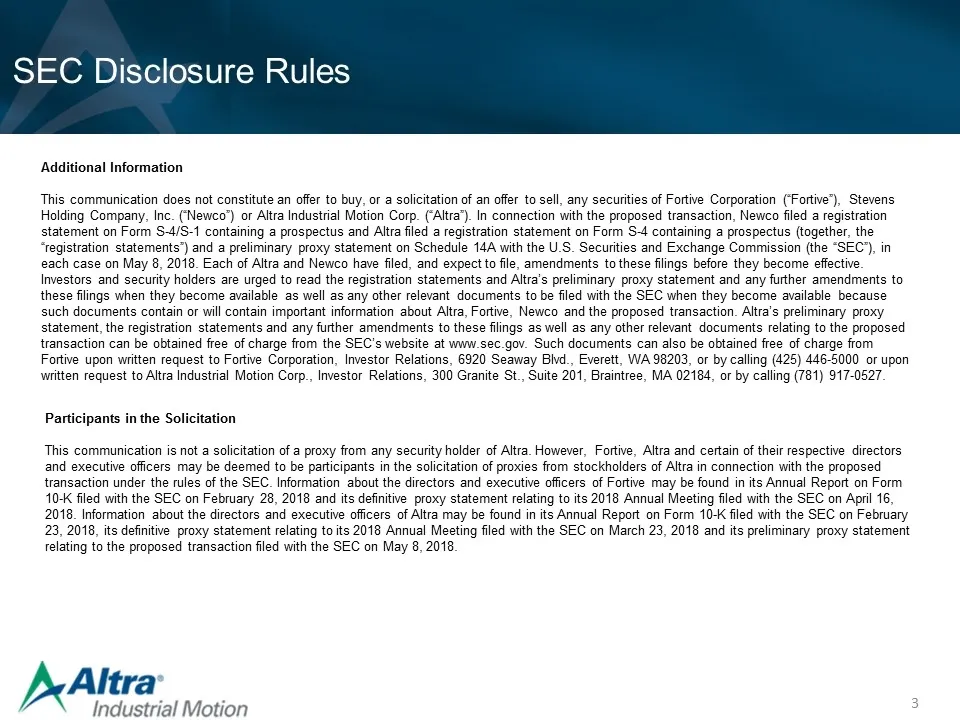
SEC Disclosure Rules Additional Information This communication does not constitute an offer to buy, or a solicitation of an offer to sell, any securities of Fortive Corporation (“Fortive”), Stevens Holding Company, Inc. (“Newco”) or Altra Industrial Motion Corp. (“Altra”). In connection with the pro
Slide 4: Safe Harbor Statement
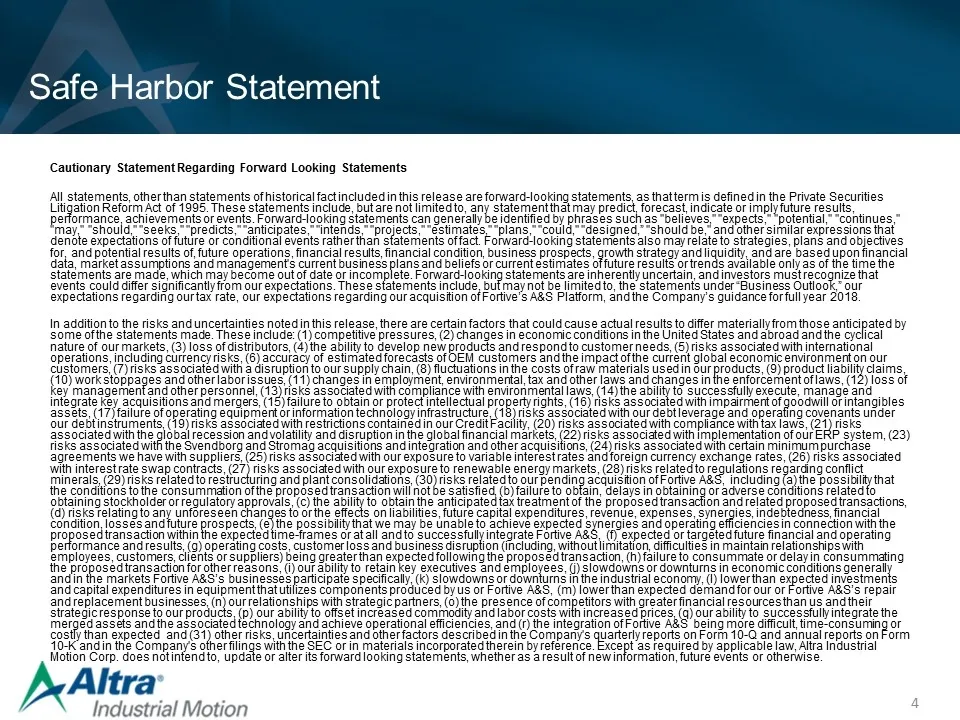
Safe Harbor Statement Cautionary Statement Regarding Forward Looking Statements All statements, other than statements of historical fact included in this release are forward-looking statements, as that term is defined in the Private Securities Litigation Reform Act of 1995. These statements include,

Slide 5: Agenda and Speakers
Executive Overview Q2 Financial Review Market Review Q&A Agenda and Speakers Carl Christenson Chairman & Chief Executive Officer Christian Storch Vice President & Chief Financial Officer
Slide 6: Second-Quarter 2018 Highlights
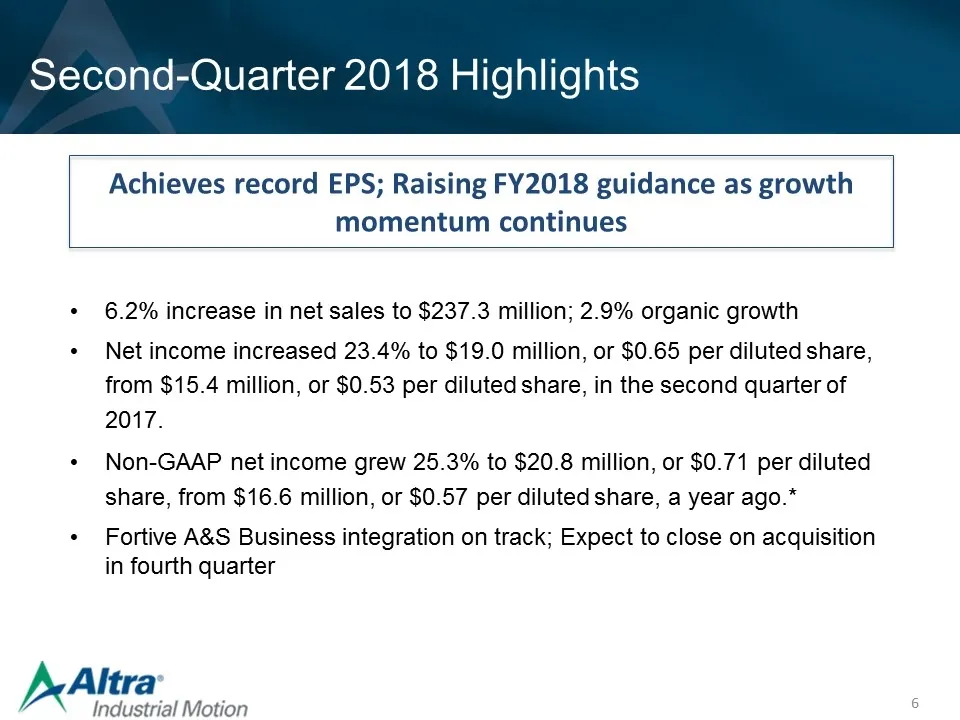
Achieves record EPS; Raising FY2018 guidance as growth momentum continues 6.2% increase in net sales to $237.3 million; 2.9% organic growth Net income increased 23.4% to $19.0 million, or $0.65 per diluted share, from $15.4 million, or $0.53 per diluted share, in the second quarter of 2017. Non-GAAP
Slide 7: Q2 2018 Financial Highlights
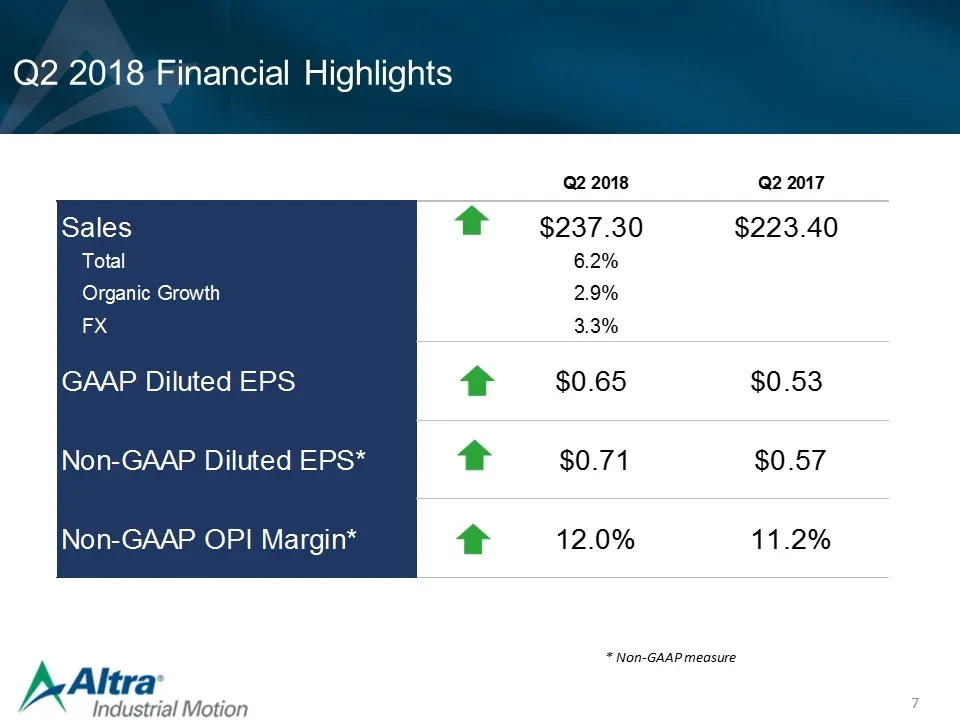
Q2 2018 Financial Highlights * Non-GAAP measure Q2 2018 Q2 2017 Sales $237.3 $223.4 Total 6.2% Organic Growth 2.9% FX 3.3% GAAP Diluted EPS $0.65 $0.53 Non-GAAP Diluted EPS* $0.71 $0.56999999999999995 Non-GAAP OPI Margin* 0.12 0.112
Slide 8: Balance Sheet Highlights
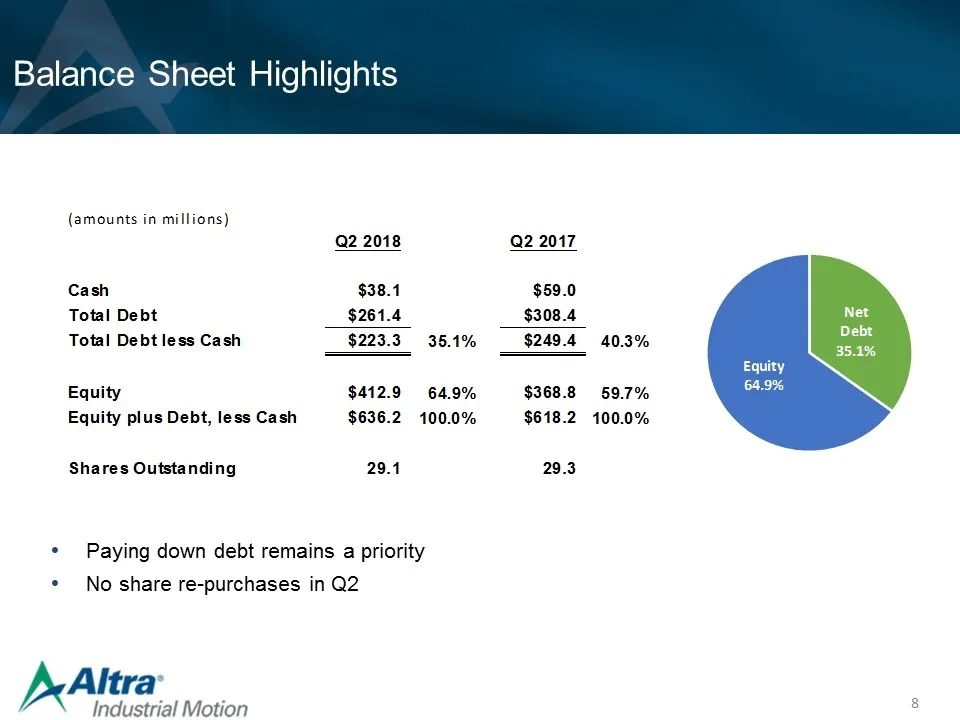
Balance Sheet Highlights Paying down debt remains a priority No share re-purchases in Q2 (amounts in millions) Q2 2018 Q2 2017 Cash $38.1 $59 Total Debt $261.39999999999998 $308.39999999999998 Total Debt less Cash $223.29999999999998 0.35099025463690664 $249.39999999999998 0.40342931090262046 Equity
Slide 9: 2018 Guidance: Raising Top and Bottomline Expectations
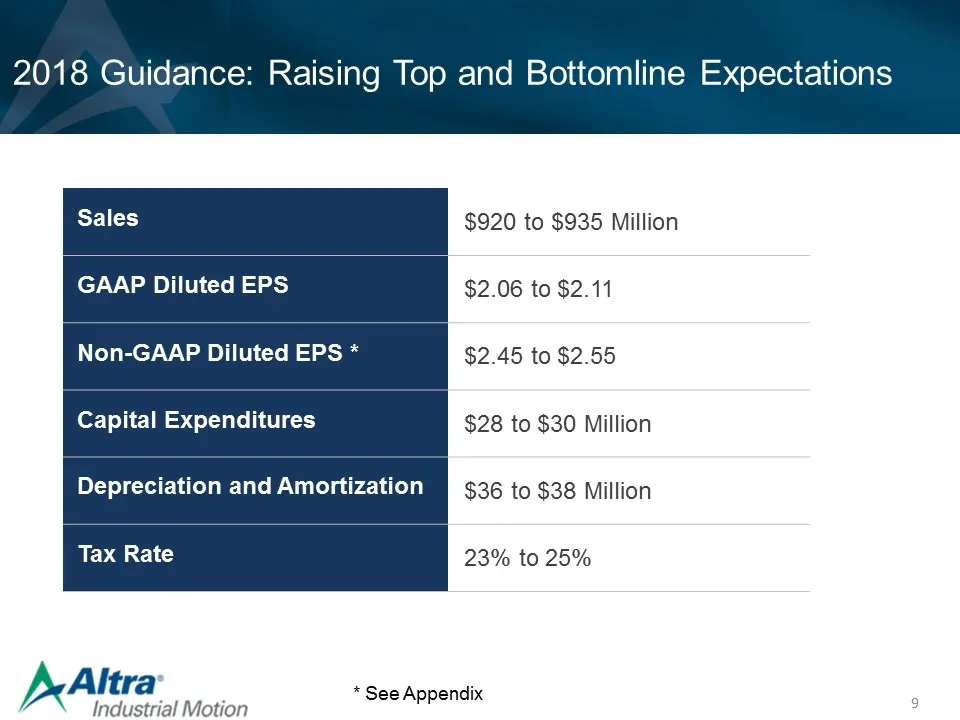
2018 Guidance: Raising Top and Bottomline Expectations Sales $920 to $935 Million GAAP Diluted EPS $2.06 to $2.11 Non-GAAP Diluted EPS * $2.45 to $2.55 Capital Expenditures $28 to $30 Million Depreciation and Amortization $36 to $38 Million Tax Rate 23% to 25% * See Appendix
Slide 10: End Market Review
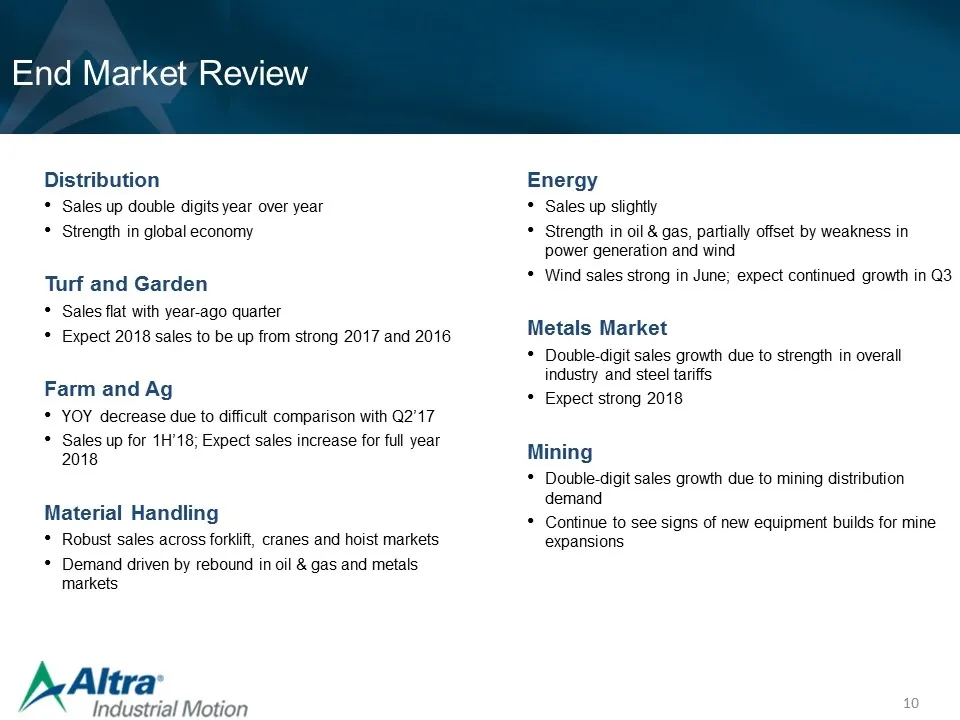
End Market Review Distribution Sales up double digits year over year Strength in global economy Turf and Garden Sales flat with year-ago quarter Expect 2018 sales to be up from strong 2017 and 2016 Farm and Ag YOY decrease due to difficult comparison with Q2’17 Sales up for 1H’18; Expect sales incre
Slide 11: Summary
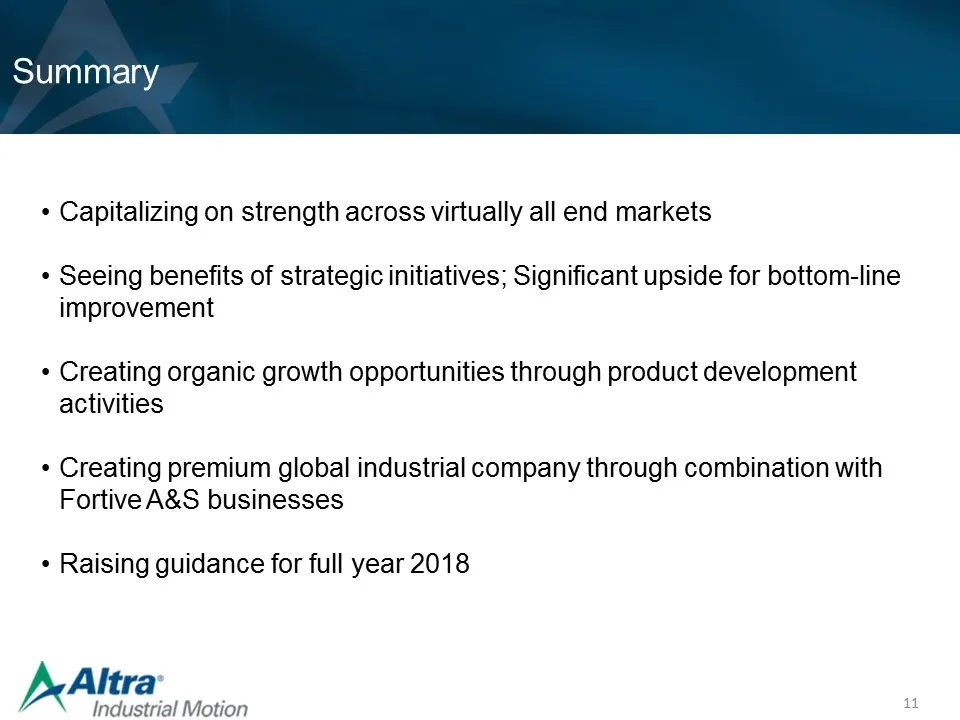
Summary Capitalizing on strength across virtually all end markets Seeing benefits of strategic initiatives; Significant upside for bottom-line improvement Creating organic growth opportunities through product development activities Creating premium global industrial company through combination with
Slide 12: Discussion of Non-GAAP Measures
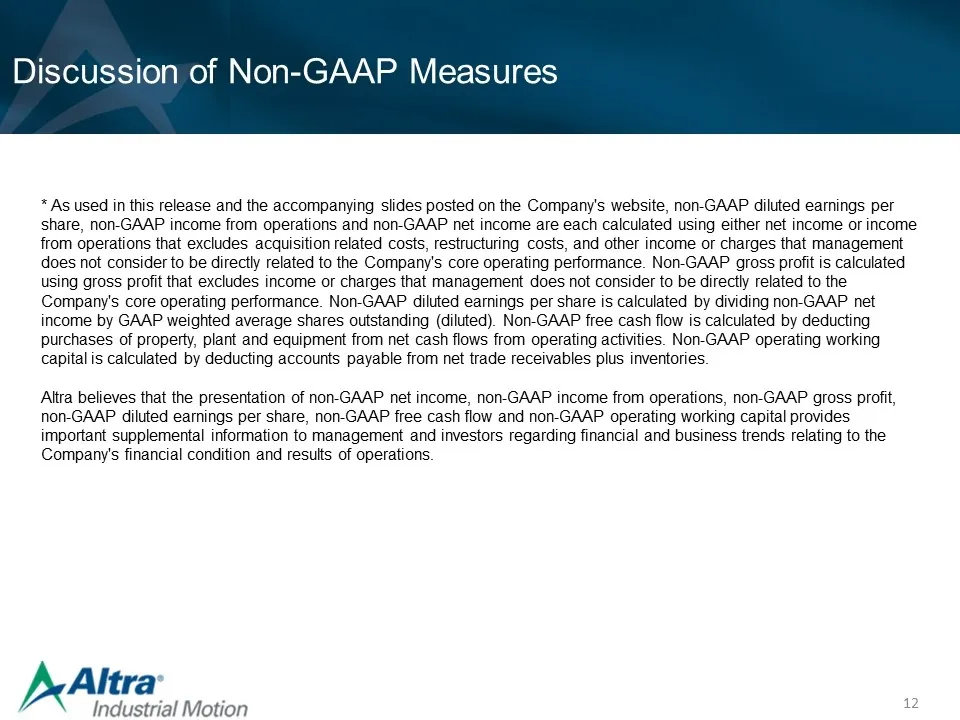
Discussion of Non-GAAP Measures * As used in this release and the accompanying slides posted on the Company's website, non-GAAP diluted earnings per share, non-GAAP income from operations and non-GAAP net income are each calculated using either net income or income from operations that excludes acqu
Slide 13: Appendix Non-GAAP Measures: Non-GAAP Net Income
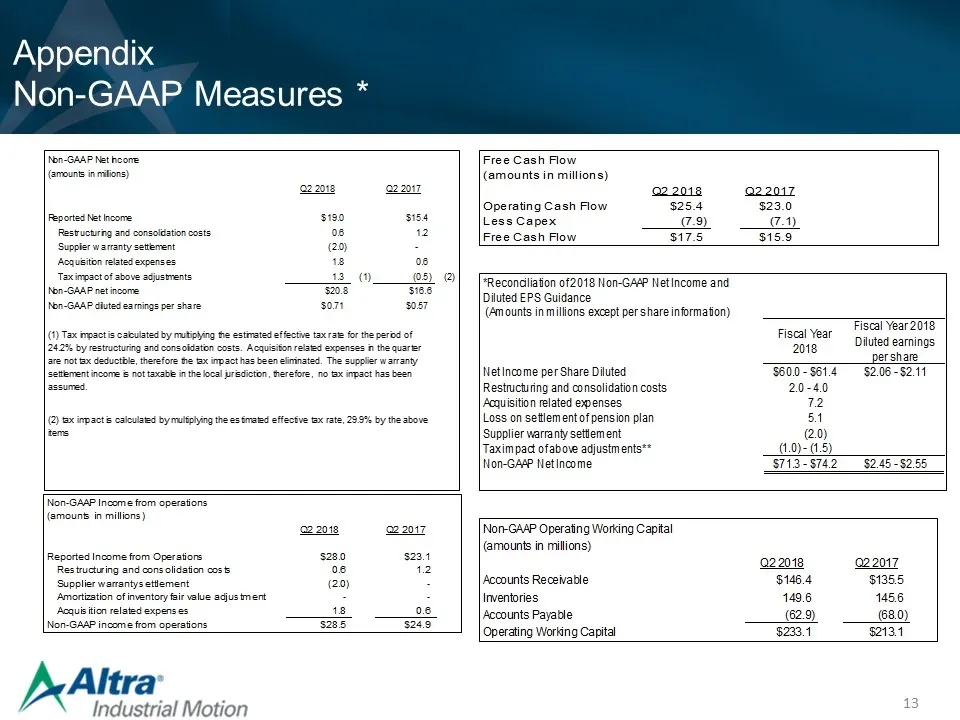
Appendix Non-GAAP Measures * Appendix Non-GAAP Measures * Non-GAAP Net Income (amounts in millions) Q2 2018 Q2 2017 Reported Net Income $19 $15.4 Restructuring and consolidation costs 0.6 1.2 Supplier warranty settlement -2 - Acquisition related expenses 1.8 0.6 Tax impact of above adjustments 1.3 -
Slide 14: Appendix Non-GAAP EBITDA Reconciliation
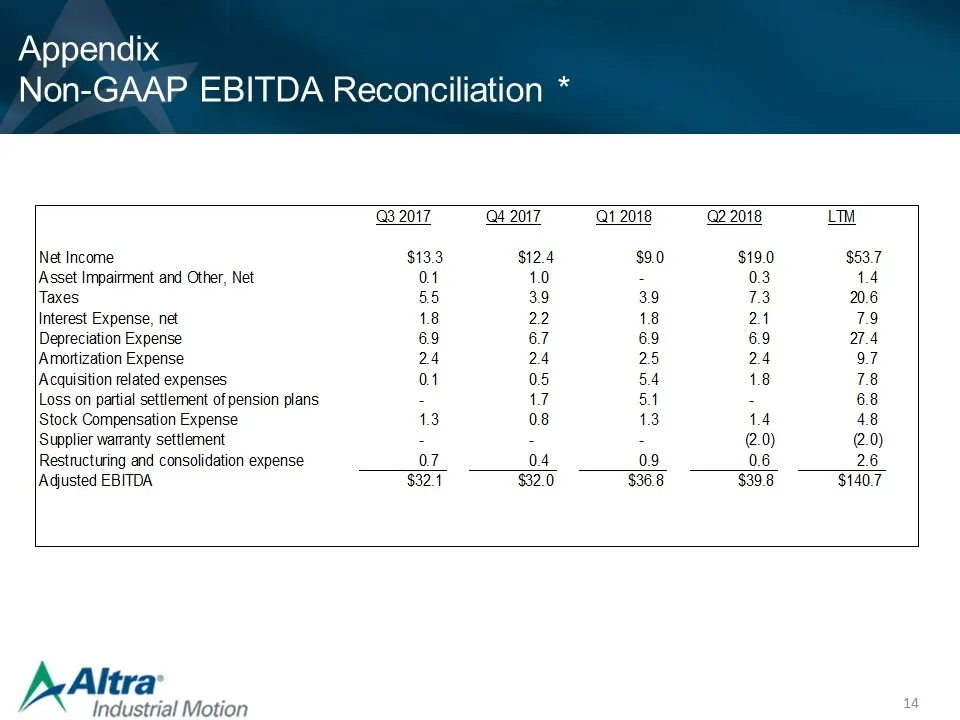
Appendix Non-GAAP EBITDA Reconciliation * EBITDA Reconciliation (amounts in millions) Q3 2017 Q4 2017 Q1 2018 Q2 2018 LTM Net Income $13.3 $12.4 $9 $19 $53.7 Asset Impairment and Other, Net 0.13600000000000001 1 0 0.3 1.4360000000000002 Taxes 5.5 3.9 3.9 7.3 20.6 Interest Expense, net 1.8 2.20000000
Source: SEC EDGAR · 425 filed Jul 26, 2018
More decks from Altra Industrial Motion Corp
 Q2 2022 Earnings Presentation25 slides · Jul 28, 2022
 Q1 2022 Earnings Presentation25 slides · Apr 28, 2022
 Investor Day (March 2022)135 slides · Mar 11, 2022
 Q4 2021 Earnings Presentation17 slides · Feb 16, 2022
 Q3 2021 Earnings Presentation16 slides · Oct 22, 2021
 Q2 2021 Earnings Presentation16 slides · Jul 23, 2021