Carolina Financial Corporation
Carolina Financial — Non-Deal Roadshow (January 2015)
31 slides from Carolina Financial's roadshow presentation, Jan 13, 2015
Slide 1: Presentation to KBW Sales Team
Presentation to KBW Sales Team January 13, 2015
Slide 2: Disclaimer
Disclaimer Certain statements in this presentation contain "forward-looking statements" within the meaning of the Private Securities Litigation Reform Act of 1995, such as statements relating to future plans and expectations, and are thus prospective. Such forward-looking statements include but are
Slide 3: Overview of Carolina Financial
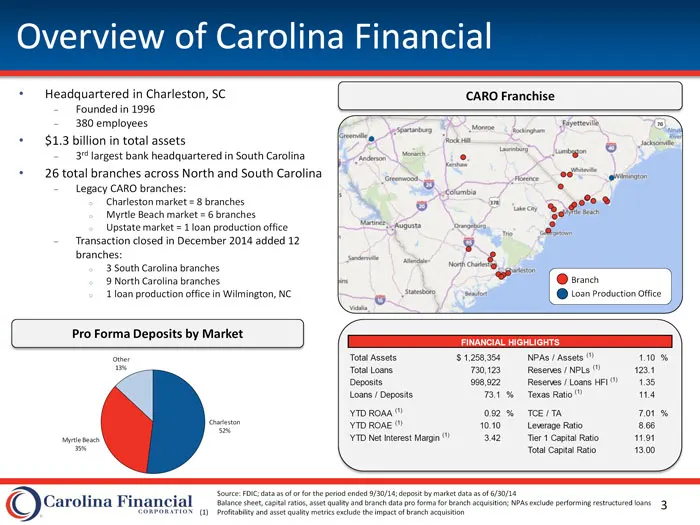
Overview of Carolina Financial Headquartered in Charleston, SC CARO Franchise Founded in 1996 380 employees $1.3 billion in total assets 3rd largest bank headquartered in South Carolina 26 total branches across North and South Carolina Legacy CARO branches: o Charleston market = 8 branches o Myrtle
Slide 4: Corporate Structure
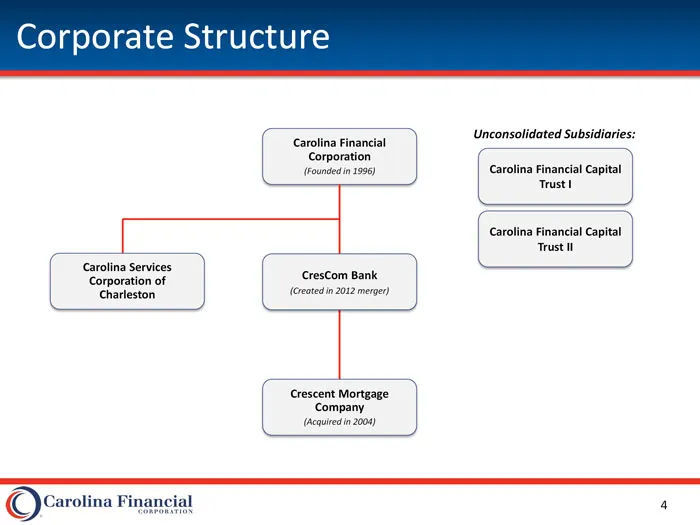
Corporate Structure Unconsolidated Subsidiaries: Carolina Financial Corporation (Founded in 1996) Carolina Financial Capital Trust I Carolina Financial Capital Trust II Carolina Services CresCom Bank Corporation of Charleston (Created in 2012 merger) Crescent Mortgage Company (Acquired in 2004) 4
Slide 5: Executive Management Team
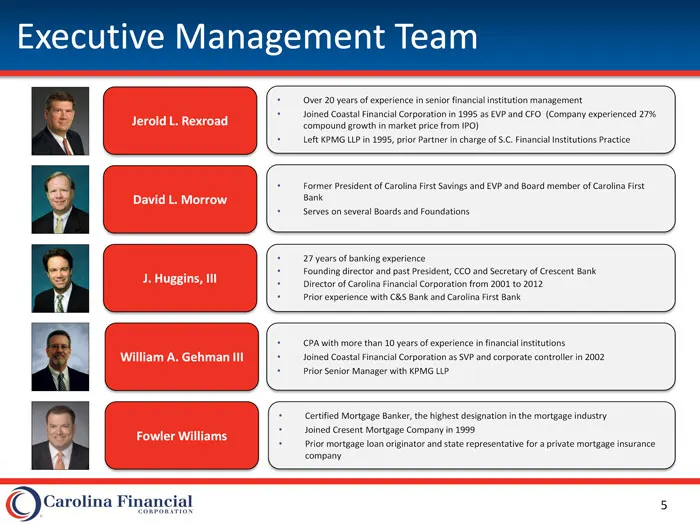
Executive Management Team Over 20 years of experience in senior financial institution management Joined Coastal Financial Corporation in 1995 as EVP and CFO (Company experienced 27% Jerold L. Rexroad compound growth in market price from IPO) Left KPMG LLP in 1995, prior Partner in charge of S.C. Fin
Slide 6: Our Culture and Company Goals
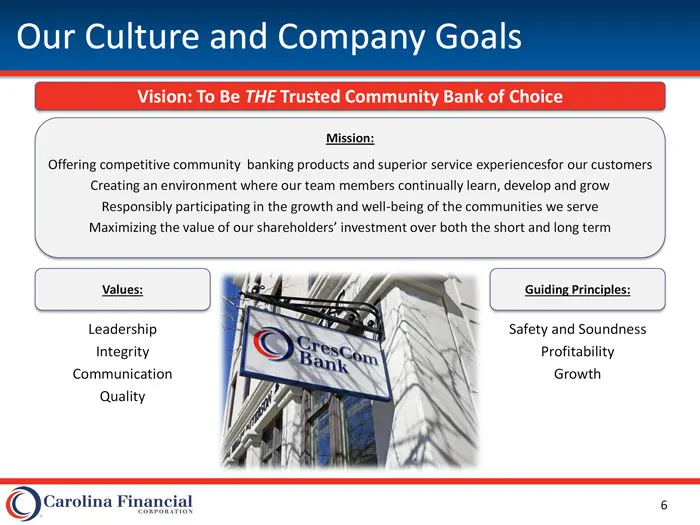
Our Culture and Company Goals Vision: To Be THE Trusted Community Bank of Choice Mission: Offering competitive community banking products and superior service experiencesfor our customers Creating an environment where our team members continually learn, develop and grow Responsibly participating in
Slide 7: Accolades and Recognition
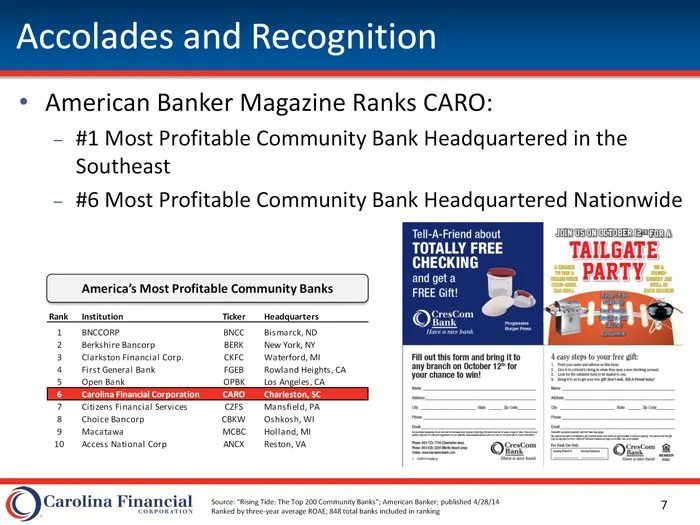
Accolades and Recognition American Banker Magazine Ranks CARO: #1 Most Profitable Community Bank Headquartered in the Southeast #6 Most Profitable Community Bank Headquartered Nationwide America's Most Profitable Community Banks Rank Institution Ticker Headquarters 1 BNCCORP BNCC Bismarck, ND 2 Berk
Slide 8: Price Performance
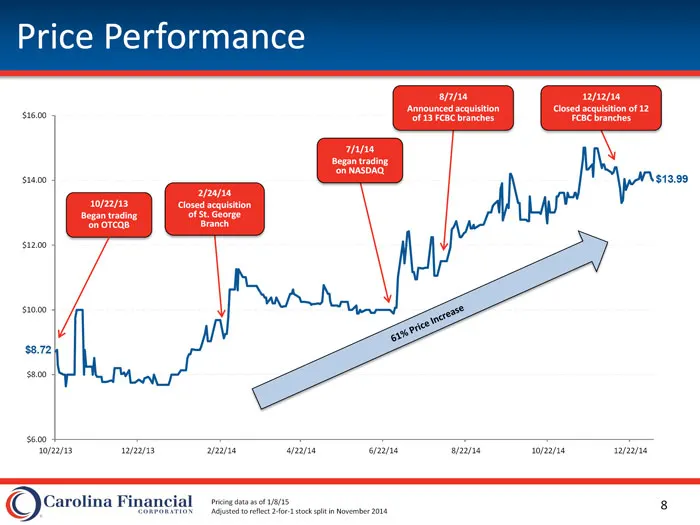
Price Performance 8/7/14 12/12/14 Announced acquisition Closed acquisition of 12 $16.00 of 13 FCBC branches FCBC branches 7/1/14 Began trading on NASDAQ $14.00 $13.99 2/24/14 10/22/13 Closed acquisition Began trading of St. George on OTCQB Branch $12.00 $10.00 $8.72 $8.00 $6.00 10/22/13 12/22/13 2/2
Slide 9: Recent Major Events
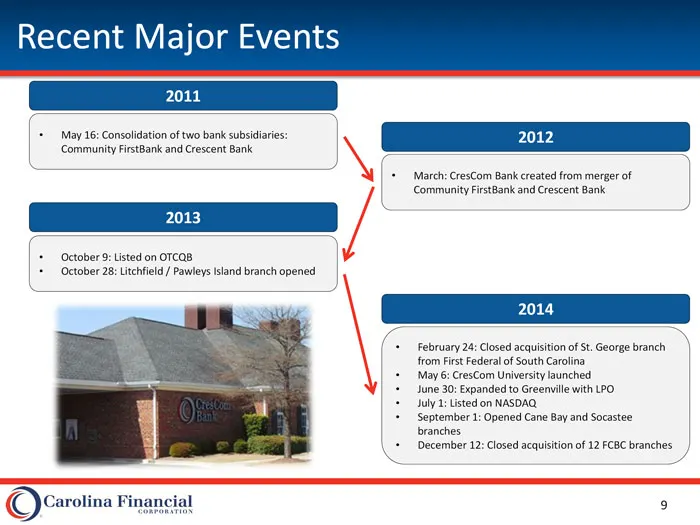
Recent Major Events 2011 May 16: Consolidation of two bank subsidiaries: 2012 Community FirstBank and Crescent Bank March: CresCom Bank created from merger of Community FirstBank and Crescent Bank 2013 October 9: Listed on OTCQB October 28: Litchfield / Pawleys Island branch opened 2014 February 24:
Slide 10: Attractive Markets of Operation
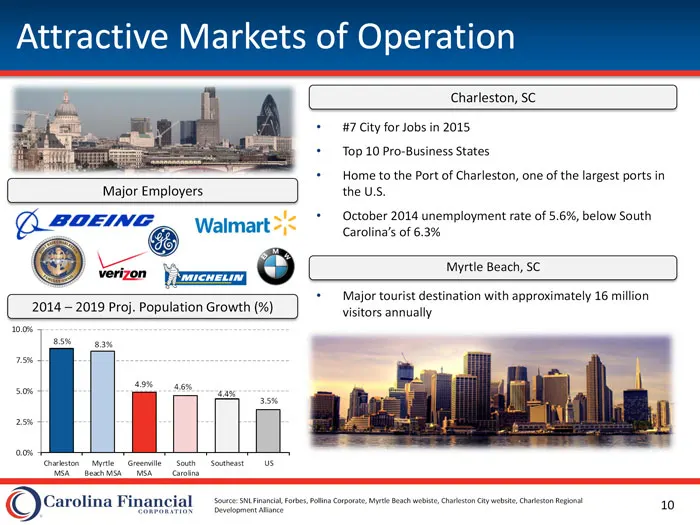
Attractive Markets of Operation Charleston, SC #7 City for Jobs in 2015 Top 10 Pro-Business States Home to the Port of Charleston, one of the largest ports in Major Employers the U.S. October 2014 unemployment rate of 5.6%, below South Carolina's of 6.3% Myrtle Beach, SC Major tourist destination wi
Slide 11: Expanding A Valuable Franchise
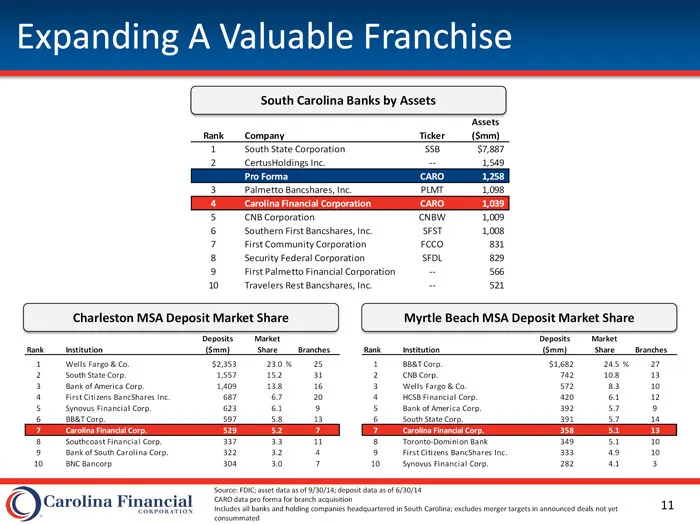
Expanding A Valuable Franchise South Carolina Banks by Assets Assets Rank Company Ticker ($mm) 1 South State Corporation SSB $7,887 2 CertusHoldings Inc. -- 1,549 Pro Forma CARO 1,258 3 Palmetto Bancshares, Inc. PLMT 1,098 4 Carolina Financial Corporation CARO 1,039 5 CNB Corporation CNBW 1,009 6 So
Slide 12: 2014 Branch Acquisition
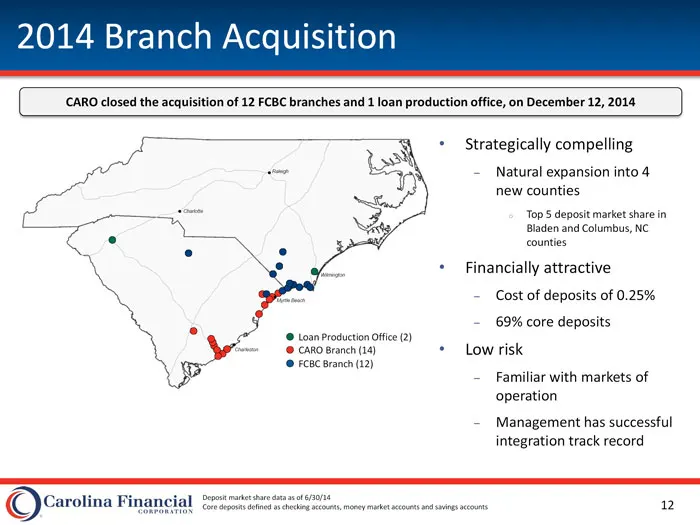
2014 Branch Acquisition CARO closed the acquisition of 12 FCBC branches and 1 loan production office, on December 12, 2014 Strategically compelling Raleigh Natural expansion into 4 new counties Charlotte o Top 5 deposit market share in Bladen and Columbus, NC counties Financially attractive Wilmingt
Slide 13: Financially Attractive Transaction
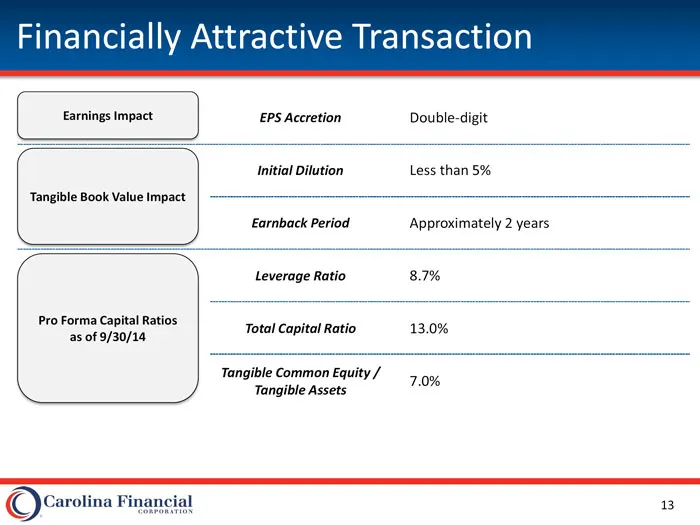
Financially Attractive Transaction Earnings Impact EPS Accretion Double-digit Initial Dilution Less than 5% Tangible Book Value Impact Earnback Period Approximately 2 years Leverage Ratio 8.7% Pro Forma Capital Ratios Total Capital Ratio 13.0% as of 9/30/14 Tangible Common Equity / 7.0% Tangible Ass
Slide 14: Strengthening Deposit Franchise
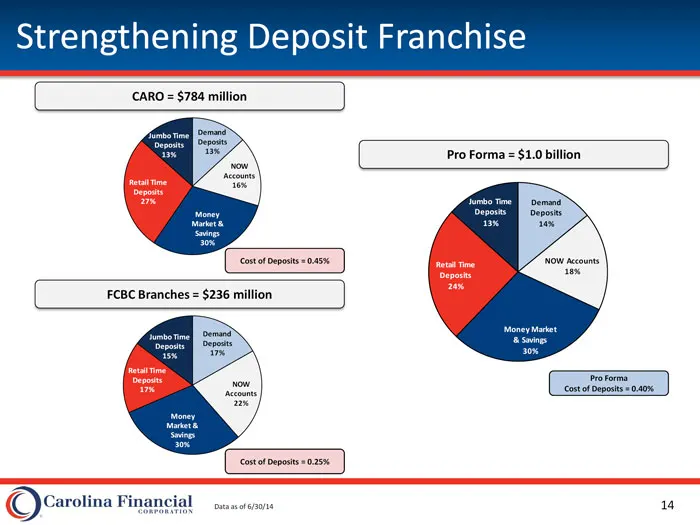
Strengthening Deposit Franchise CARO = $784 million Demand Jumbo Time Deposits Deposits 13% 13% Pro Forma = $1.0 billion NOW Accounts Retail Time 16% Deposits 27% Jumbo Time Demand Money Deposits Deposits Market & 13% 14% Savings 30% Cost of Deposits = 0.45% NOW Accounts Retail Time 18% Deposits 24%
Slide 15: Crescent Mortgage
CRESCENT \ORTGAGE.
Slide 16: Crescent Mortgage Operations
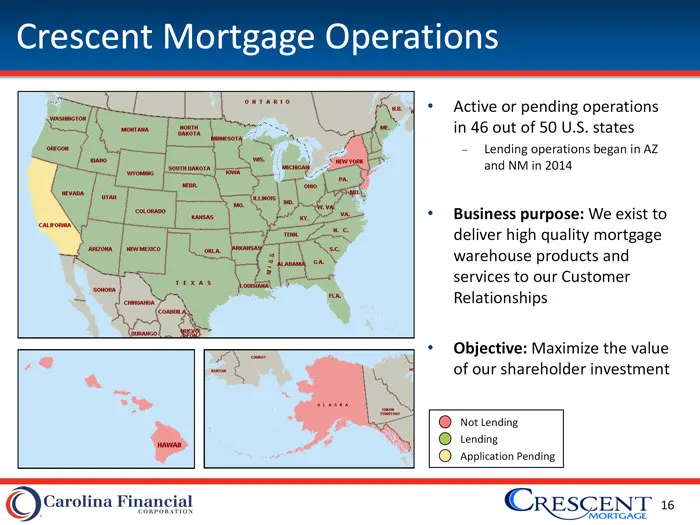
Crescent Mortgage Operations Active or pending operations in 46 out of 50 U.S. states Lending operations began in AZ and NM in 2014 Business purpose: We exist to deliver high quality mortgage warehouse products and services to our Customer Relationships Objective: Maximize the value of our sharehold
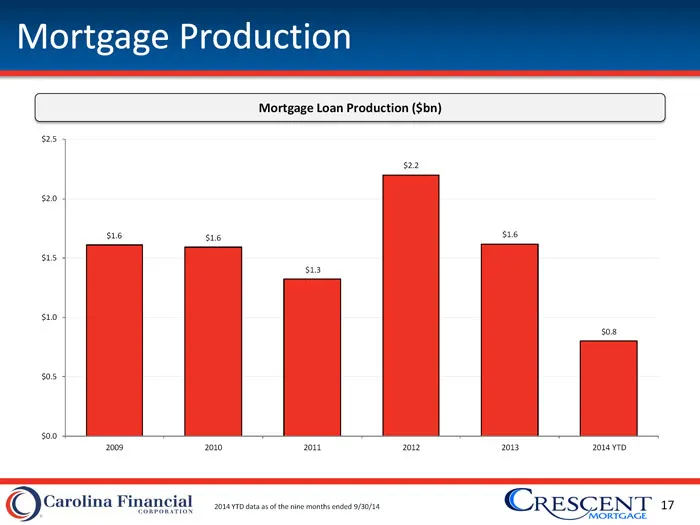
Slide 17: Mortgage Production
Mortgage Production Mortgage Loan Production ($bn) $2.5 $2.2 $2.0 $1.6 $1.6 $1.6 $1.5 $1.3 $1.0 $0.8 $0.5 $0.0 2009 2010 2011 2012 2013 2014 YTD 2014 YTD data as of the nine months ended 9/30/14 17
Slide 18: Recent Financial Highlights
Recent Financial Highlights
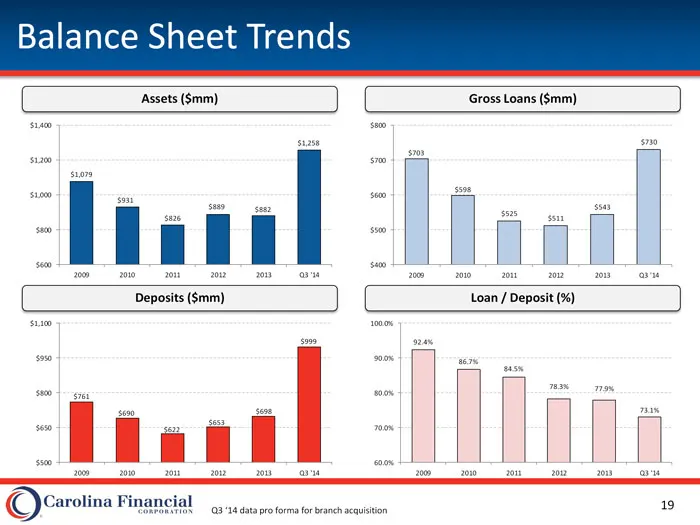
Slide 19: Balance Sheet Trends
Balance Sheet Trends Assets ($mm) Gross Loans ($mm) $1,400 $800 $1,258 $730 $703 $1,200 $700 $1,079 $598 $1,000 $600 $931 $889 $882 $543 $525 $826 $511 $800 $500 $600 $400 2009 2010 2011 2012 2013 Q3 '14 2009 2010 2011 2012 2013 Q3 '14 Deposits ($mm) Loan / Deposit (%) $1,100 100.0% $999 92.4% $950
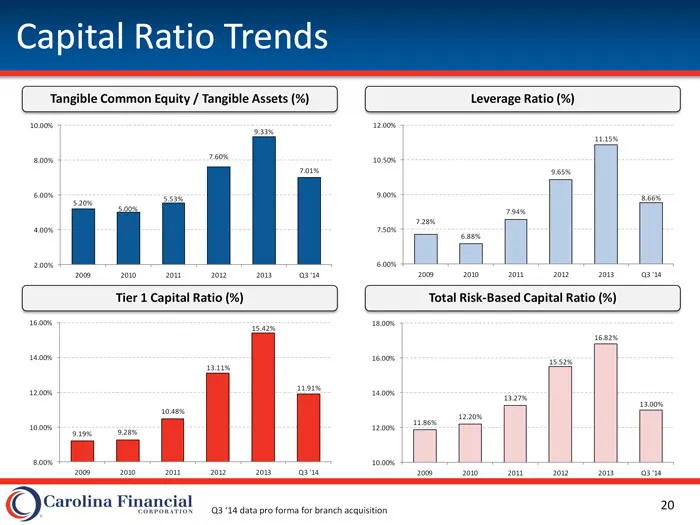
Slide 20: Capital Ratio Trends
Capital Ratio Trends Tangible Common Equity / Tangible Assets (%) Leverage Ratio (%) 10.00% 12.00% 9.33% 11.15% 7.60% 8.00% 10.50% 7.01% 9.65% 6.00% 9.00% 5.53% 8.66% 5.20% 5.00% 7.94% 7.28% 4.00% 7.50% 6.88% 2.00% 6.00% 2009 2010 2011 2012 2013 Q3 '14 2009 2010 2011 2012 2013 Q3 '14 Tier 1 Capital
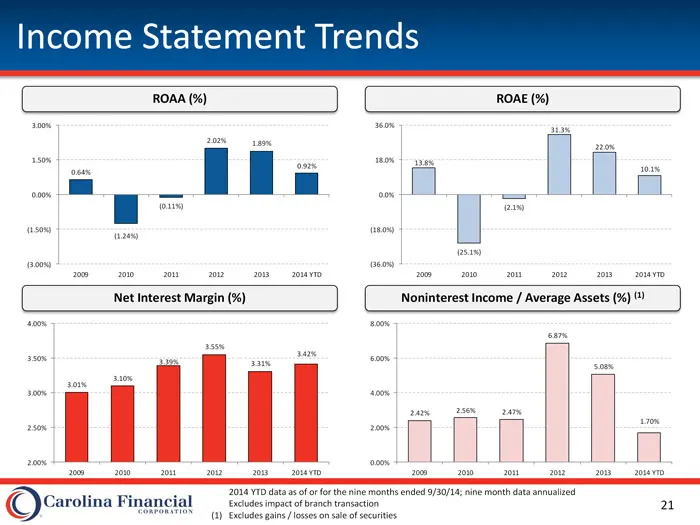
Slide 21: Income Statement Trends
Income Statement Trends ROAA (%) ROAE (%) 3.00% 36.0% 31.3% 2.02% 1.89% 22.0% 1.50% 18.0% 13.8% 0.92% 10.1% 0.64% 0.00% 0.0% (0.11%) (2.1%) (1.50%) (18.0%) (1.24%) (25.1%) (3.00%) (36.0%) 2009 2010 2011 2012 2013 2014 YTD 2009 2010 2011 2012 2013 2014 YTD Net Interest Margin (%) Noninterest Income /
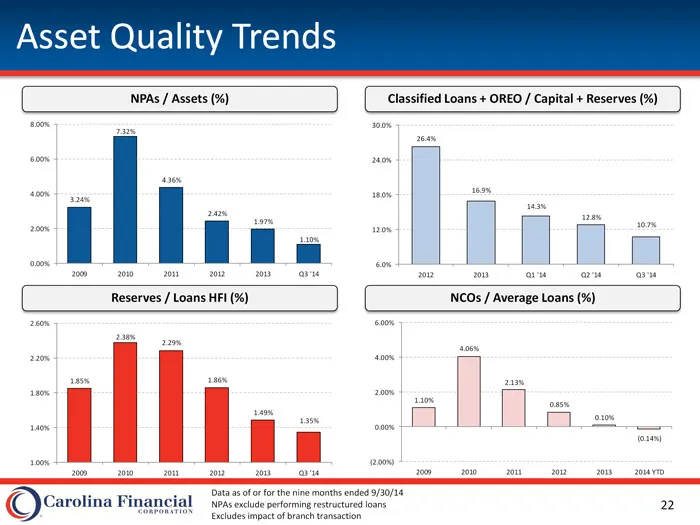
Slide 22: Asset Quality Trends
Asset Quality Trends NPAs / Assets (%) Classified Loans + OREO / Capital + Reserves (%) 8.00% 30.0% 7.32% 26.4% 6.00% 24.0% 4.36% 16.9% 4.00% 18.0% 3.24% 14.3% 2.42% 12.8% 1.97% 10.7% 2.00% 12.0% 1.10% 0.00% 6.0% 2009 2010 2011 2012 2013 Q3 '14 2012 2013 Q1 '14 Q2 '14 Q3 '14 Reserves / Loans HFI (%)
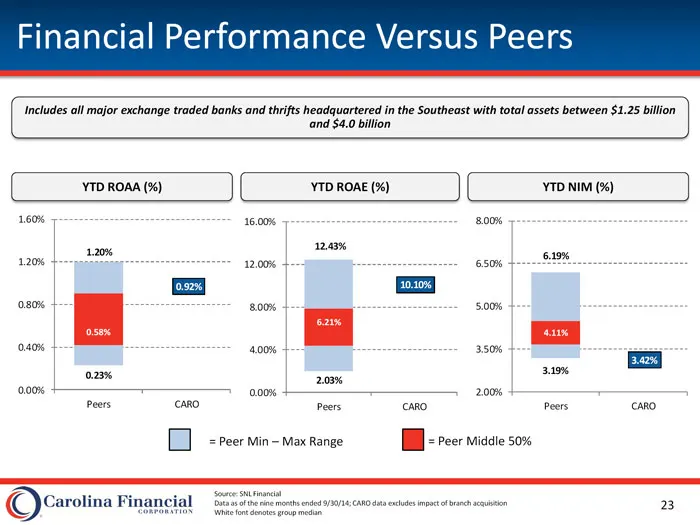
Slide 23: Financial Performance Versus Peers
Financial Performance Versus Peers Includes all major exchange traded banks and thrifts headquartered in the Southeast with total assets between $1.25 billion and $4.0 billion YTD ROAA (%) YTD ROAE (%) YTD NIM (%) 1.60% 16.00% 8.00% 12.43% 1.20% 6.19% 1.20% 12.00% 6.50% 0.92% 10.10% 0.80% 8.00% 5.00
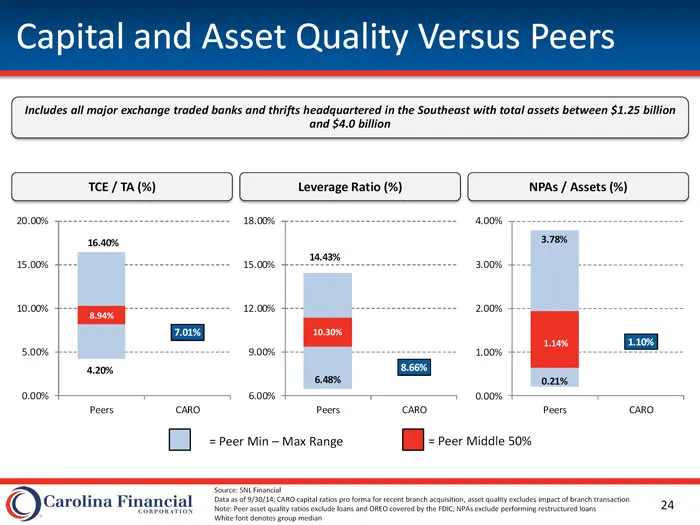
Slide 24: Capital and Asset Quality Versus Peers
Capital and Asset Quality Versus Peers Includes all major exchange traded banks and thrifts headquartered in the Southeast with total assets between $1.25 billion and $4.0 billion TCE / TA (%) Leverage Ratio (%) NPAs / Assets (%) 20.00% 18.00% 4.00% 16.40% 3.78% 14.43% 15.00% 15.00% 3.00% 10.00% 12.
Slide 25: Peer Trading Valuation
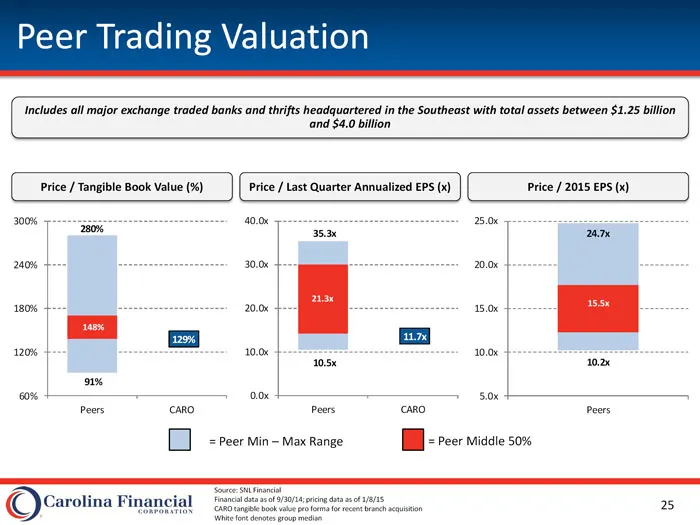
Peer Trading Valuation Includes all major exchange traded banks and thrifts headquartered in the Southeast with total assets between $1.25 billion and $4.0 billion Price / Tangible Book Value (%) Price / Last Quarter Annualized EPS (x) Price / 2015 EPS (x) 300% 40.0x 25.0x 280% 35.3x 24.7x 240% 30.0
Slide 26: Appendix I: Branch Detail
Appendix I: Branch Detail
Slide 27: Current CARO Branch Locations
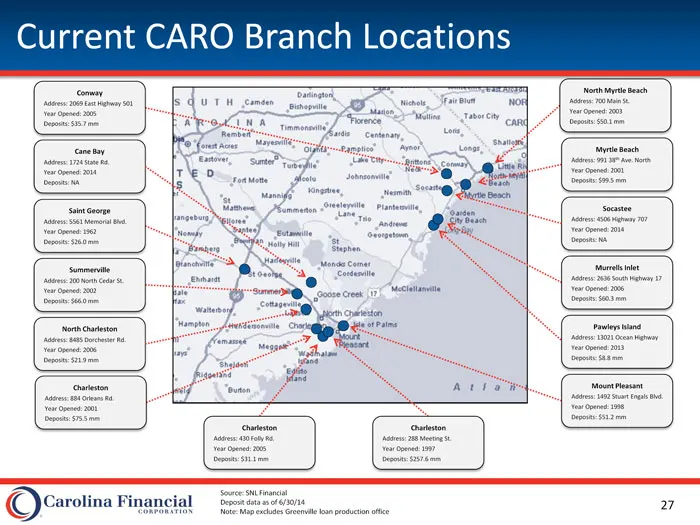
Current CARO Branch Locations Conway North Myrtle Beach Address: 2069 East Highway 501 Address: 700 Main St. Year Opened: 2005 Year Opened: 2003 Deposits: $35.7 mm Deposits: $50.1 mm Cane Bay Myrtle Beach Address: 1724 State Rd. Address: 991 38th Ave. North Year Opened: 2014 Year Opened: 2001 Deposi
Slide 28: Acquired FCBC Branch Locations
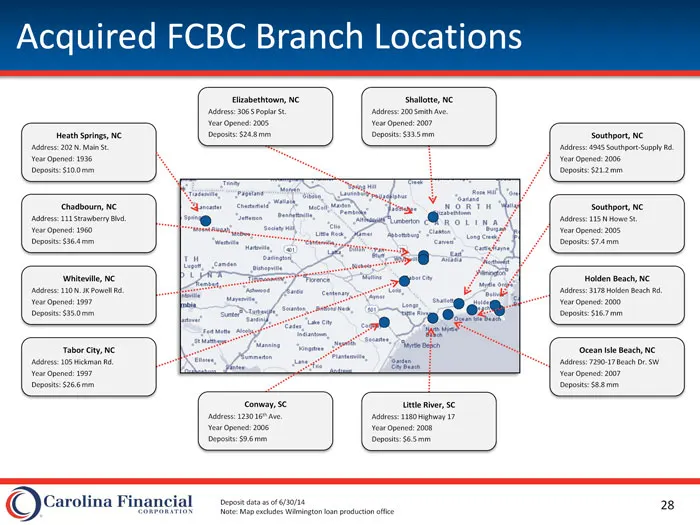
Acquired FCBC Branch Locations Elizabethtown, NC Shallotte, NC Address: 306 S Poplar St. Address: 200 Smith Ave. Year Opened: 2005 Year Opened: 2007 Heath Springs, NC Deposits: $24.8 mm Deposits: $33.5 mm Southport, NC Address: 202 N. Main St. Address: 4945 Southport-Supply Rd. Year Opened: 1936 Yea
Slide 29: Appendix II: Peer Comparison Detail
Appendix II: Peer Comparison Detail
Slide 30: Peer Comparison Financial Condition
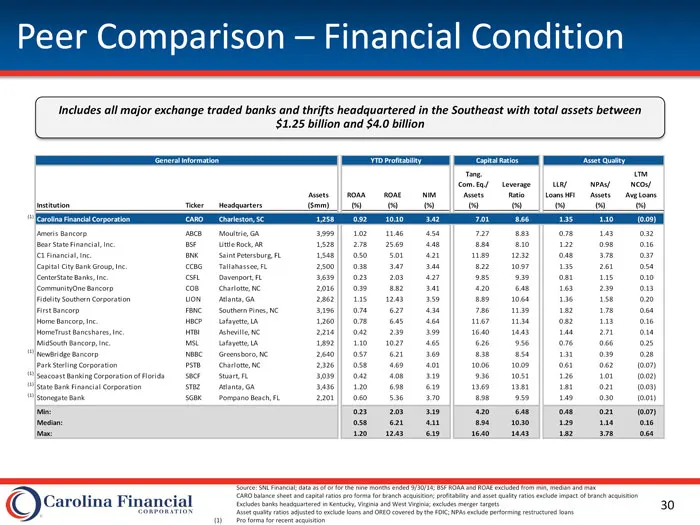
Peer Comparison Financial Condition Includes all major exchange traded banks and thrifts headquartered in the Southeast with total assets between $1.25 billion and $4.0 billion General Information YTD Profitability Capital Ratios Asset Quality Tang. LTM Com. Eq./ Leverage LLR/ NPAs/ NCOs/ Assets ROA
Slide 31: Peer Comparison Market Performance
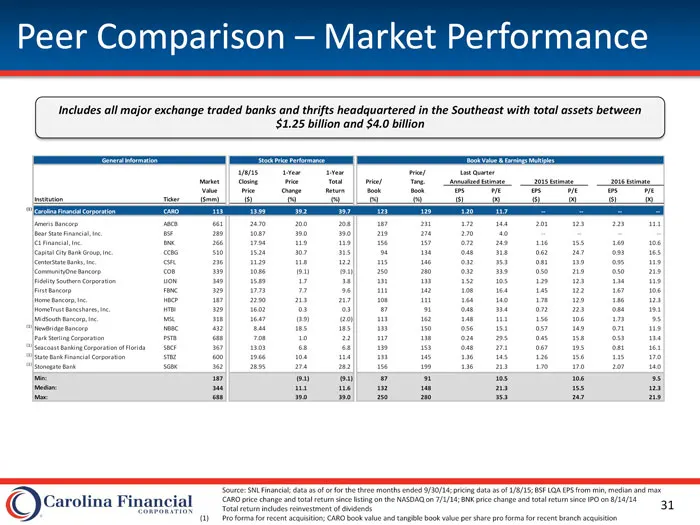
Peer Comparison Market Performance Includes all major exchange traded banks and thrifts headquartered in the Southeast with total assets between $1.25 billion and $4.0 billion General Information Stock Price Performance Book Value & Earnings Multiples 1/8/15 1-Year 1-Year Price/ Last Quarter Market
Source: SEC EDGAR · 8-K filed Jan 13, 2015
More decks from Carolina Financial Corporation
 Q4 2019 Earnings Presentation19 slides · Jan 29, 2020
 Merger or Acquisition (November 2019)13 slides · Nov 18, 2019
 Q3 2019 Earnings Presentation15 slides · Oct 24, 2019
 Q2 2019 Earnings Presentation18 slides · Jul 25, 2019
 Q1 2019 Earnings Presentation15 slides · Apr 24, 2019
 Q4 2018 Earnings Presentation13 slides · Jan 24, 2019