Steelcase — Q1 2026 Earnings Presentation
30 slides from Steelcase's earnings presentation, Jun 26, 2025
Slide 1: Investor Presentation
Investor Presentation FY2026 First Quarter FY 2023 Third Quarter
Slide 2: Investment Thesis
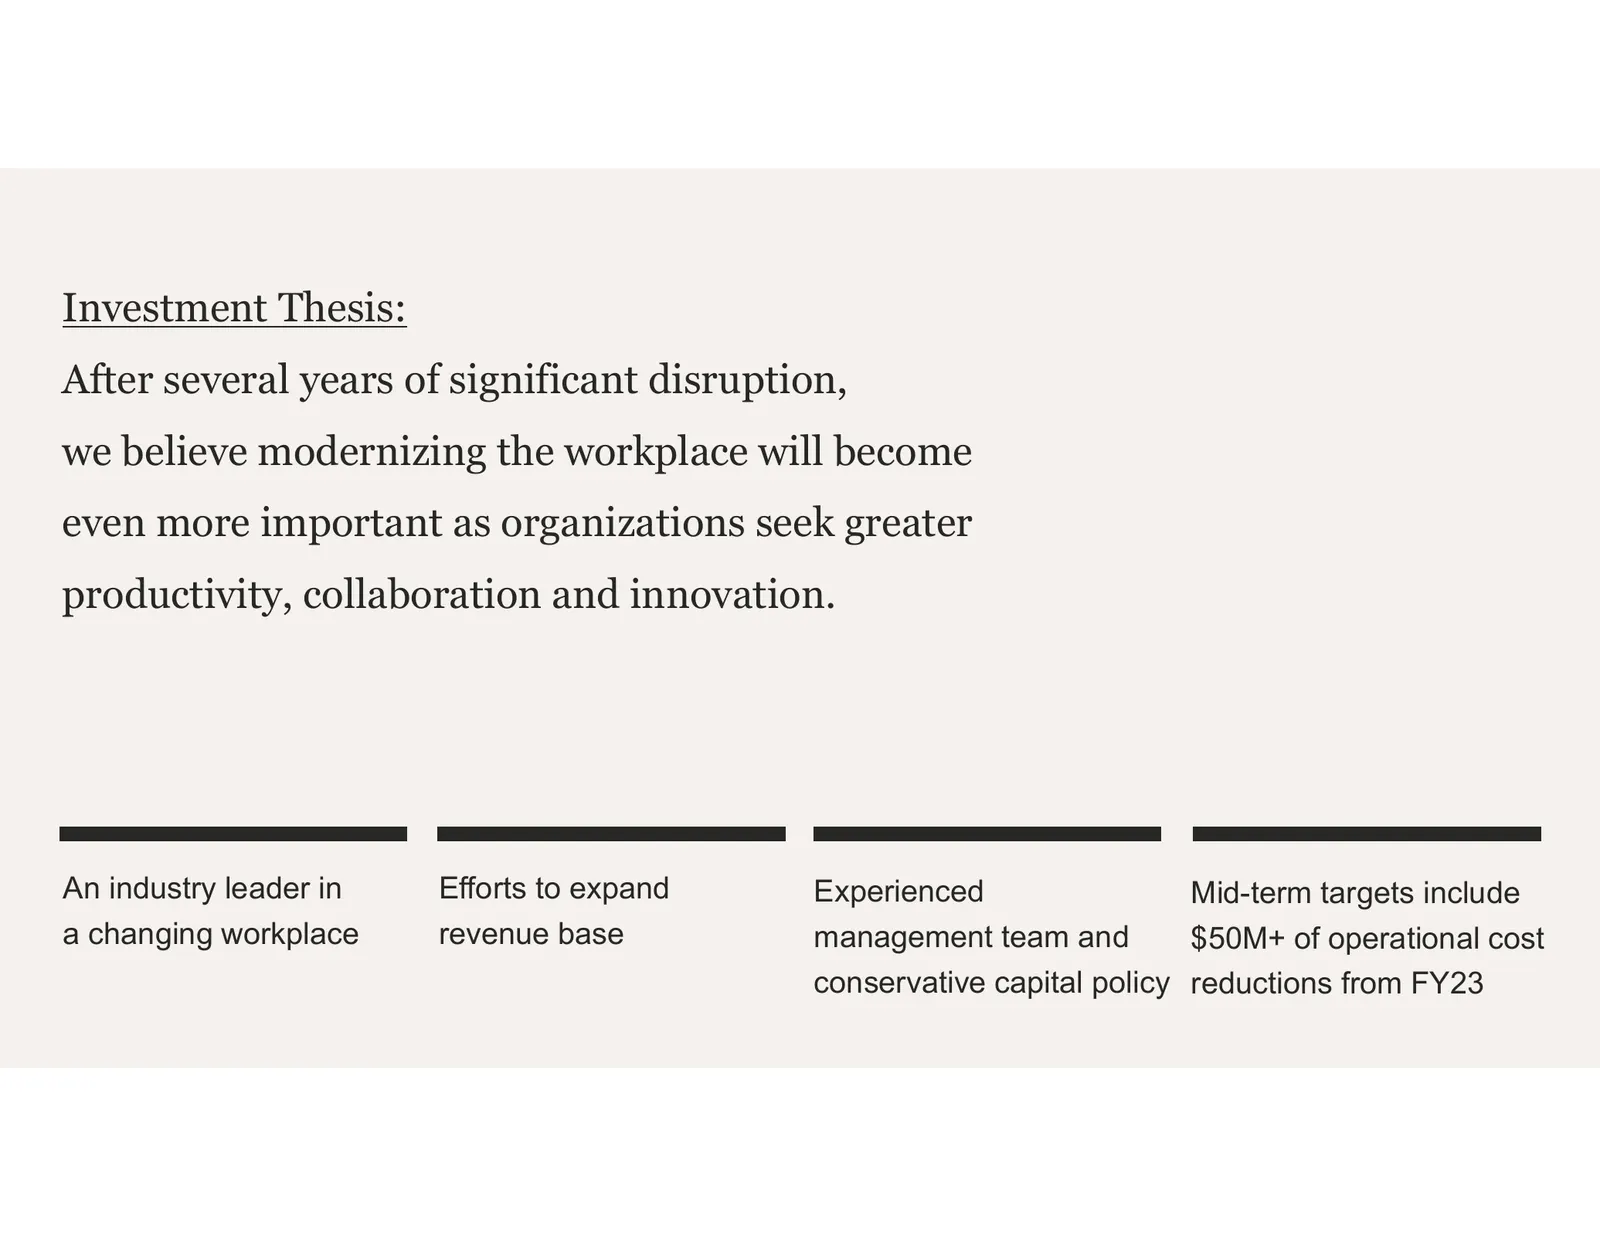
Investment Thesis: After several years of significant disruption, we believe modernizing the workplace will become even more important as organizations seek greater productivity, collaboration and innovation. An industry leader in Efforts to expand Experienced Mid-term targets include a changing wor
Slide 3: Mid-Term Financial Targets
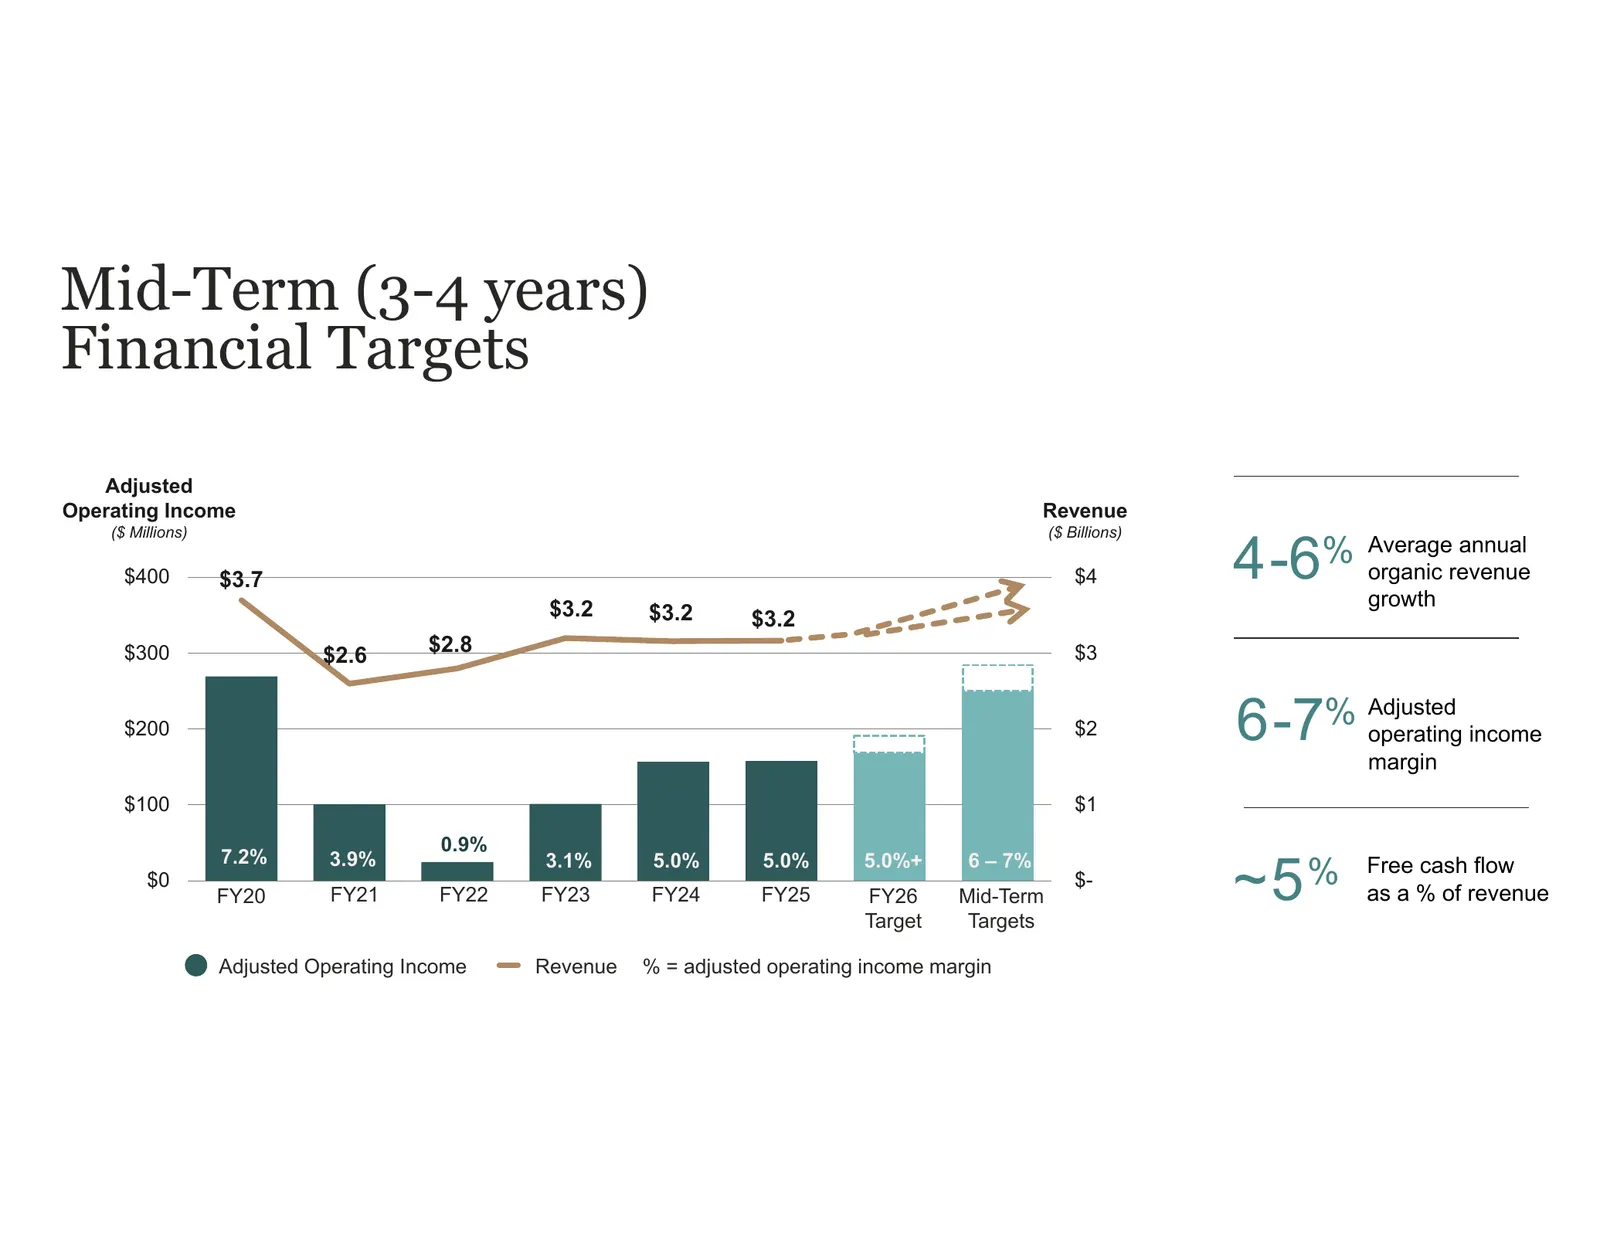
Mid-Term (3-4 years) Financial Targets Adjusted Operating Income Revenue ($ Millions) ($ Billions) $400 $3.7 $4 4-6% Average annual organic revenue growth $3.2 $3.2 $3.2 $300 $2.6 $2.8 $3 $200 $2 6-7% Adjusted operating income margin $100 $1 0.9% 7.2% ~5 % 3.9% 3.1% 5.0% 5.0% 5.0%+ 6 – 7% Free cash
Slide 4: Our Balance Sheet Provides Stability Through Business Cycles
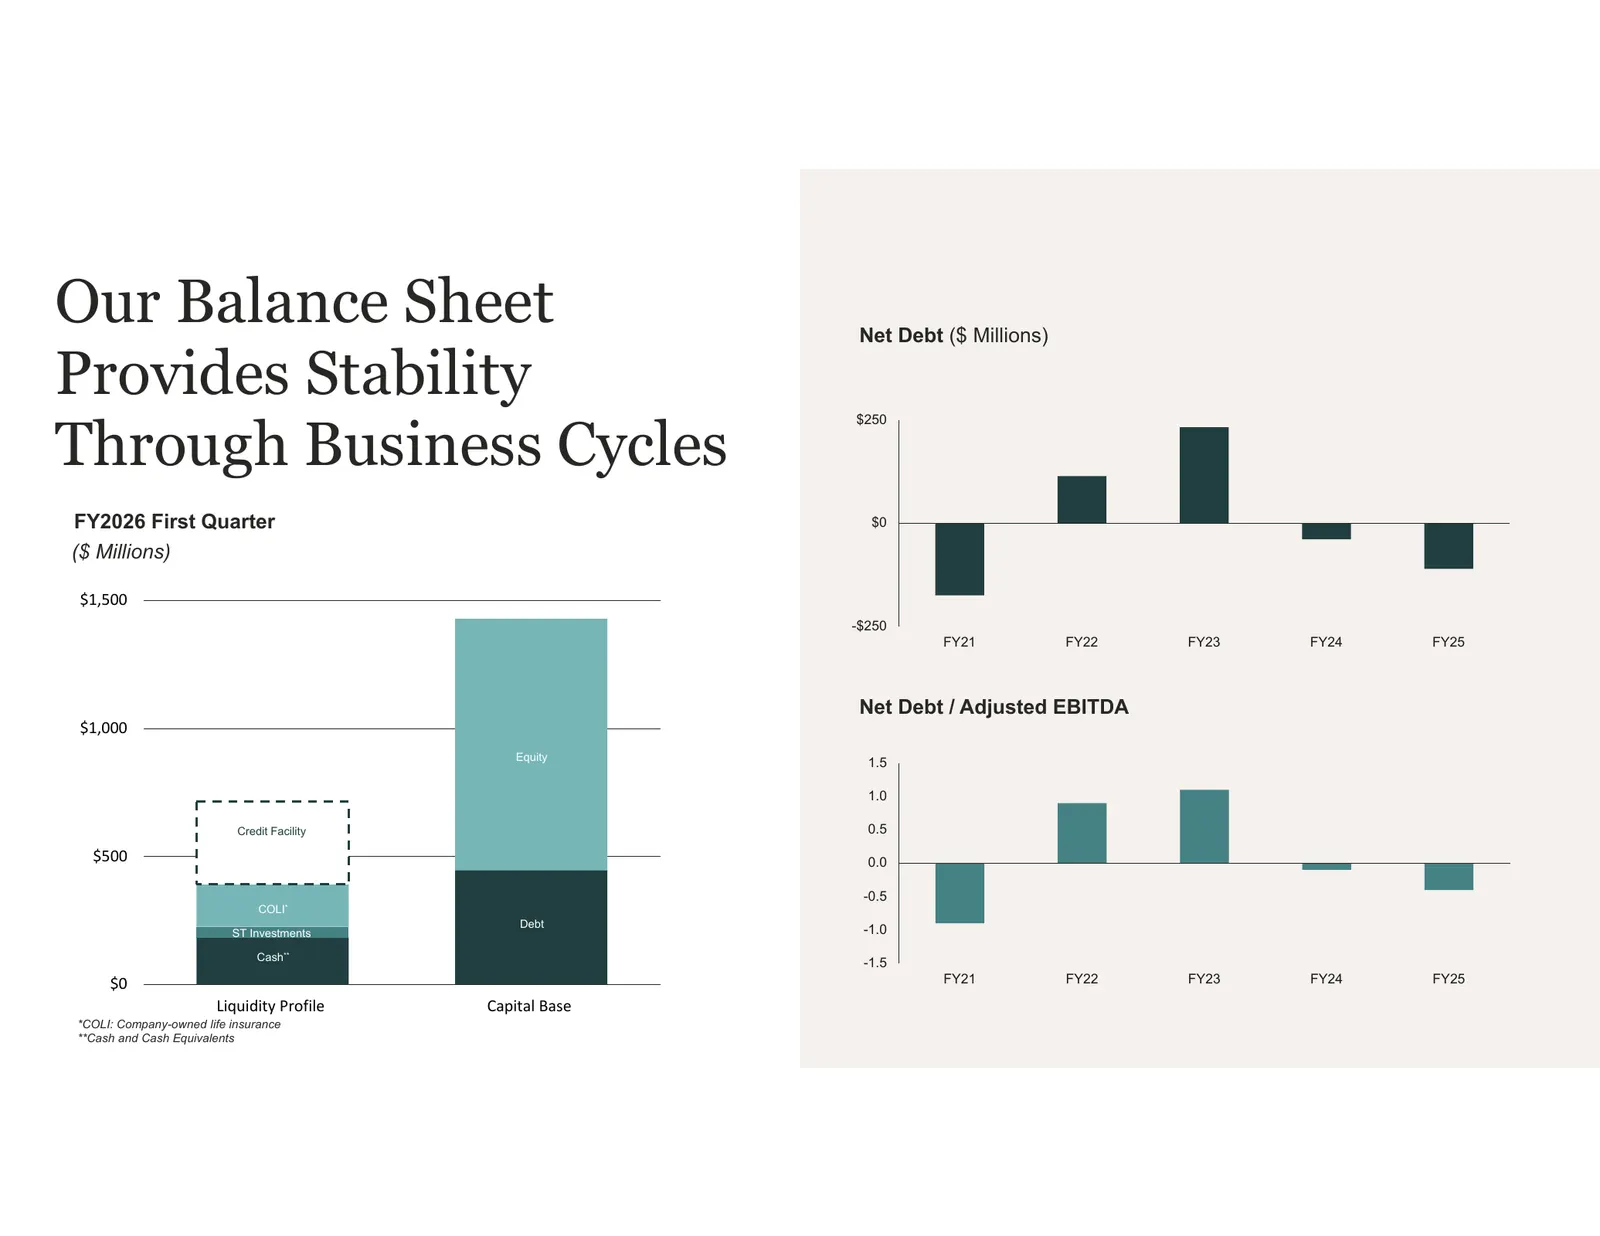
Our Balance Sheet Net Debt ($ Millions) Provides Stability Through Business Cycles $250 FY2026 First Quarter $0 ($ Millions) $1,500 -$250 FY21 FY22 FY23 FY24 FY25 Net Debt / Adjusted EBITDA $1,000 Equity 1.5 1.0 Credit Facility 0.5 $500 COLI* 0.0 -0.5 COLI* Debt ST Investments -1.0 Cash** -1.5 $0 FY
Slide 5: A respected leader with strong global market share
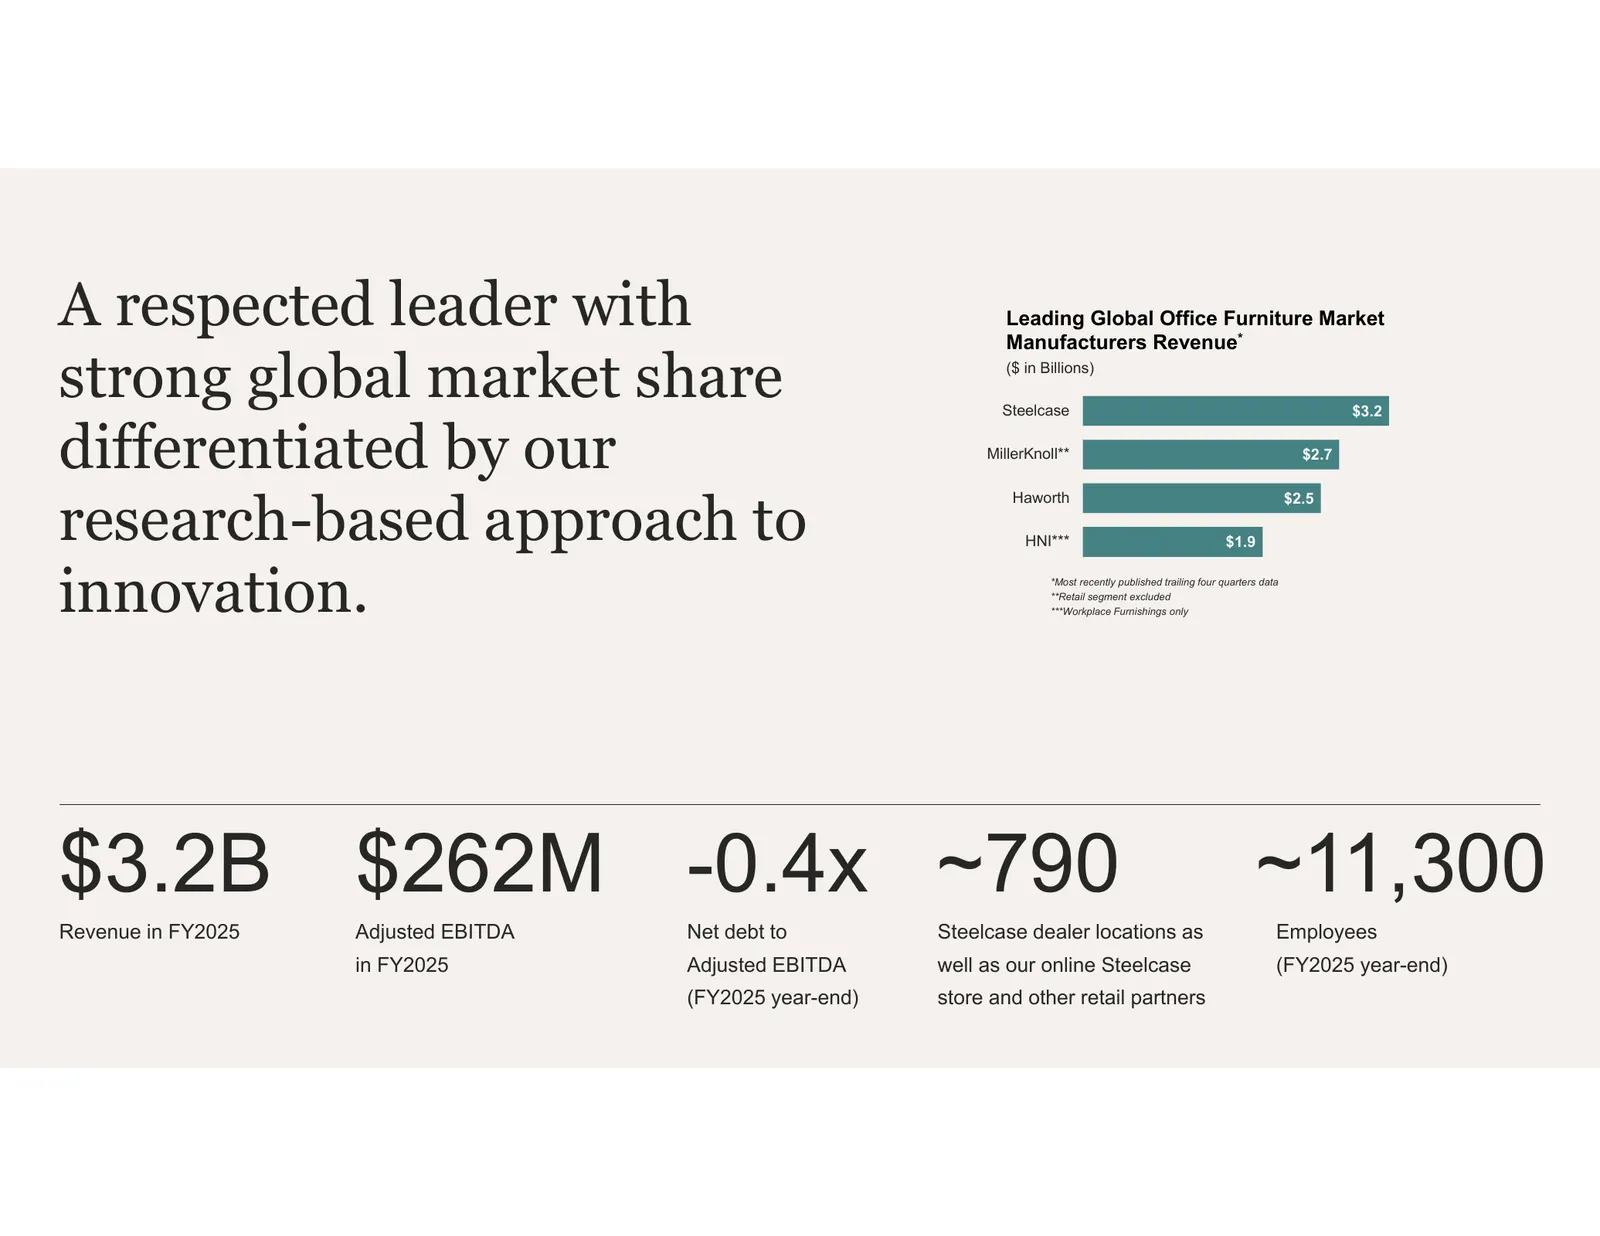
A respected leader with Leading Global Office Furniture Market Manufacturers Revenue* strong global market share ($ in Billions) Steelcase $3.2 differentiated by our MillerKnoll** $2.7 research-based approach to Haworth $2.5 HNI*** $1.9 innovation. *Most recently published trailing four quarters dat
Slide 6: Unique Global Capabilities
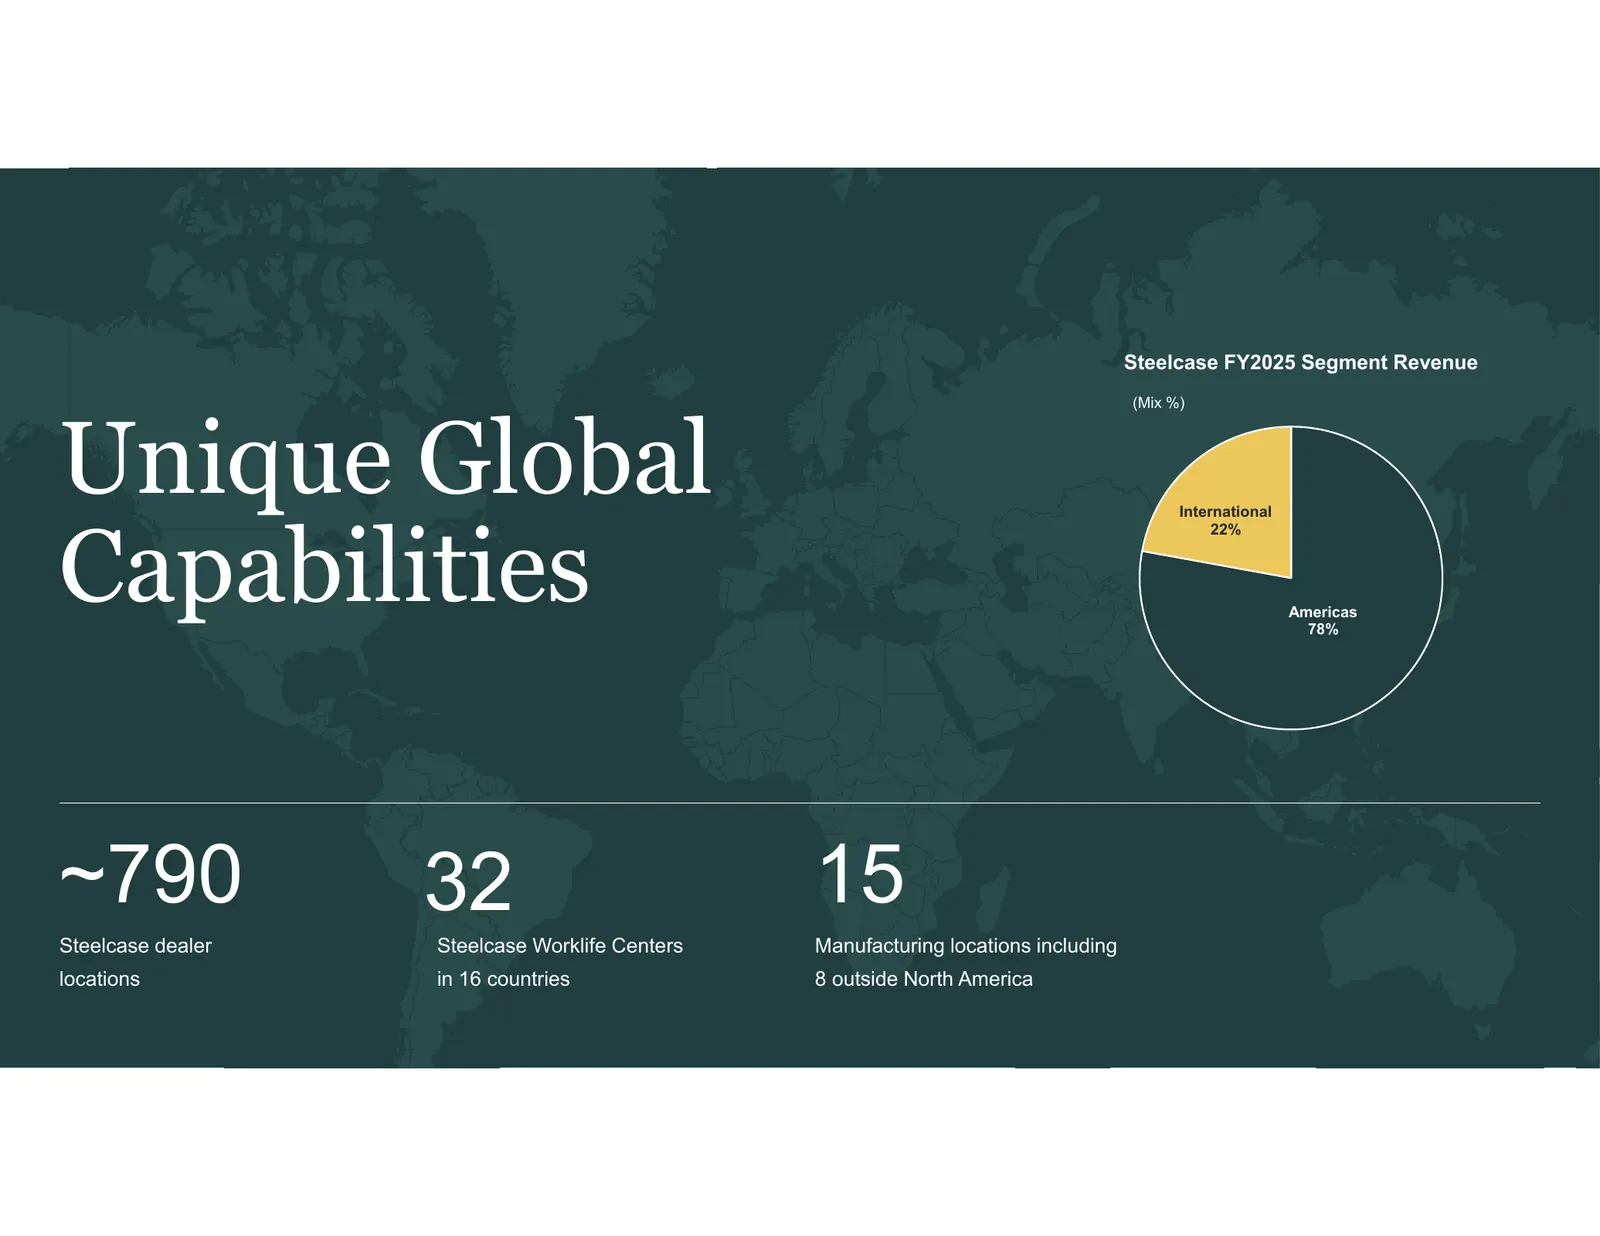
Steelcase FY2025 Segment Revenue (Mix %) Unique Global International Capabilities 22% Americas 78% ~790 32 15 Steelcase dealer Steelcase Worklife Centers Manufacturing locations including locations in 16 countries 8 outside North America
Slide 7: Research Drives Innovation and Breakthrough Design
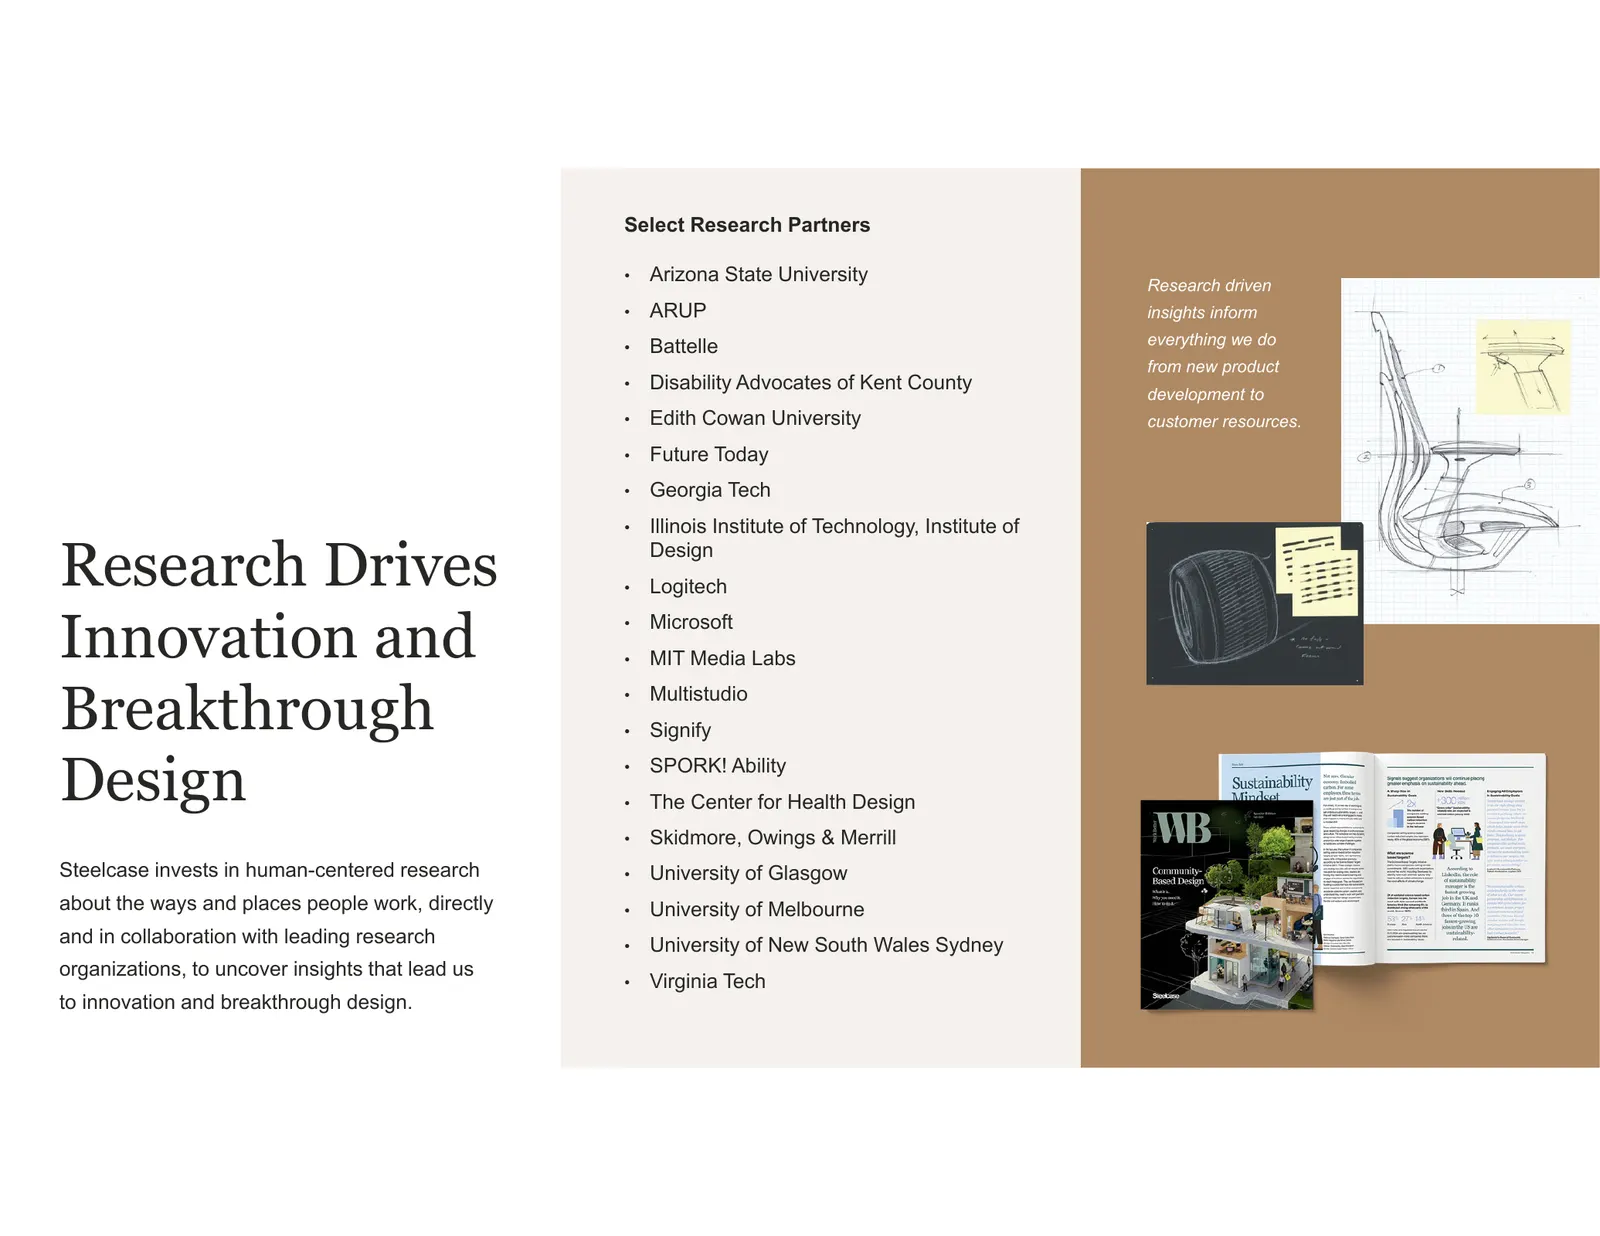
Select Research Partners • Arizona State University Research driven • ARUP insights inform • Battelle everything we do from new product • Disability Advocates of Kent County development to • Edith Cowan University customer resources. • Future Today • Georgia Tech • Illinois Institute of Technology,
Slide 8: What People Want
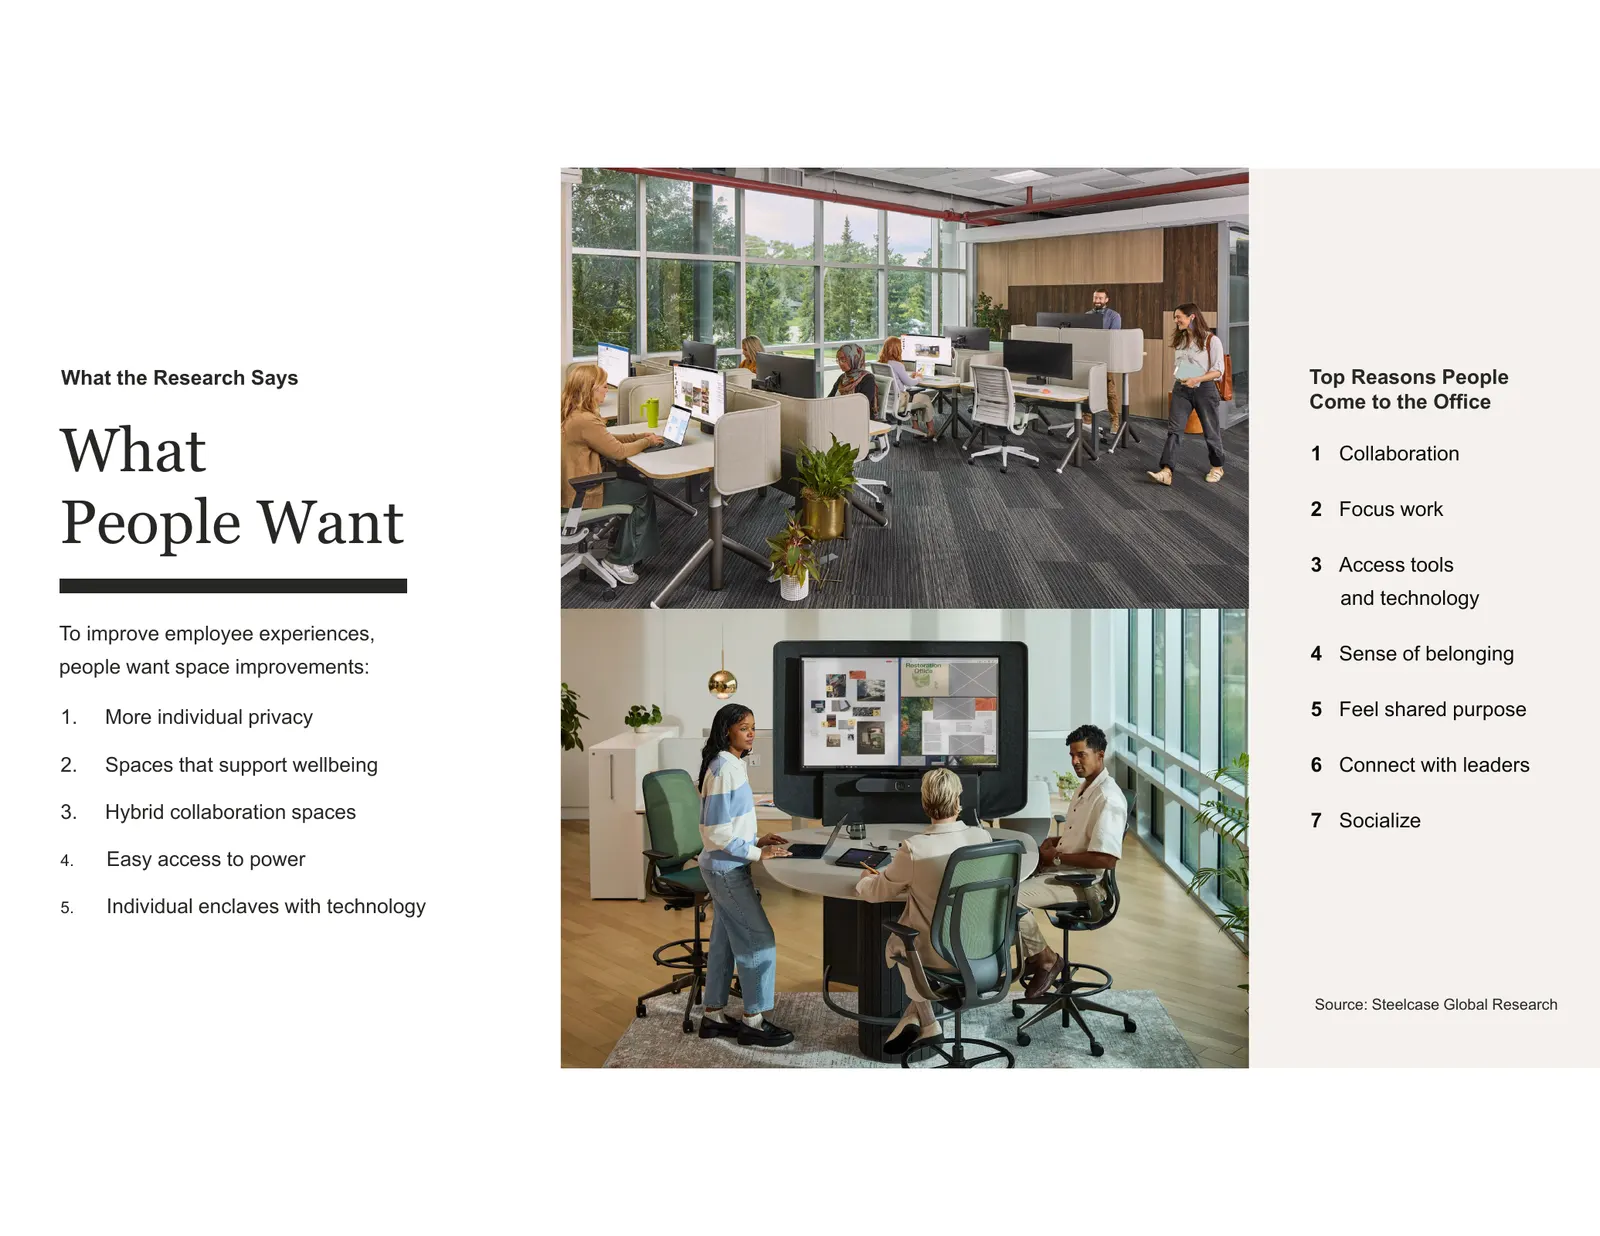
What the Research Says Top Reasons People Come to the Office What 1 Collaboration People Want 2 Focus work 3 Access tools and technology To improve employee experiences, 4 Sense of belonging people want space improvements: 1. More individual privacy 5 Feel shared purpose 2. Spaces that support wellb
Slide 9: Helping the world work better
Our Purpose Helping the world work better Steelcase serves leading organizations with furnishings and solutions for many of the places where work happens — including offices, homes, and learning and health environments. Our solutions come to life through our community of expert Steelcase dealers, st
Slide 10: Revenue Mix by Customer Segment
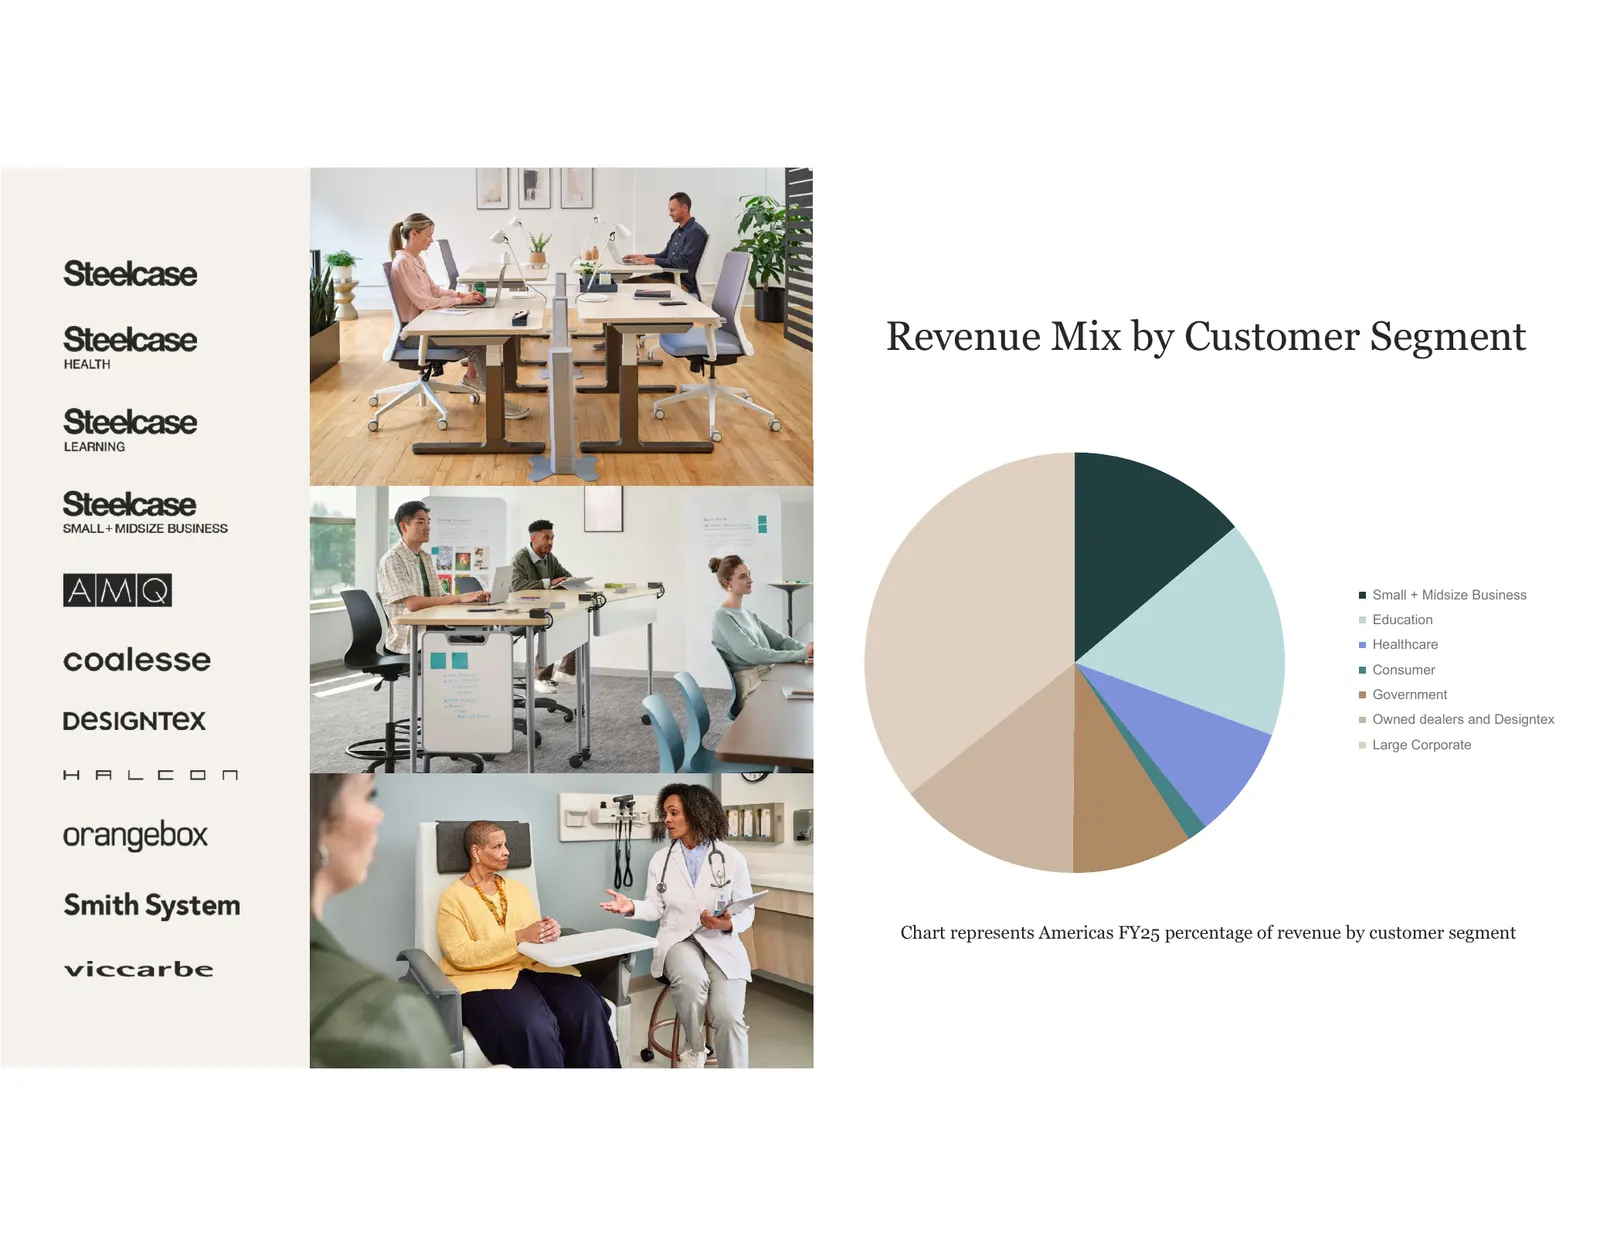
Revenue Mix by Customer Segment Small + Midsize Business Education Healthcare Consumer Government Owned dealers and Designtex Large Corporate Chart represents Americas FY25 percentage of revenue by customer segment
Slide 11: Our Strategic Direction
Our Strategic Direction Our strategy is designed to drive profitable growth by staying close to our customers and helping them adapt, succeed and create better experiences. Lead the Expand our reach Strengthen transformation within markets profitability and of the workplace reinvest in the business
Slide 12: Lead the transformation of the workplace
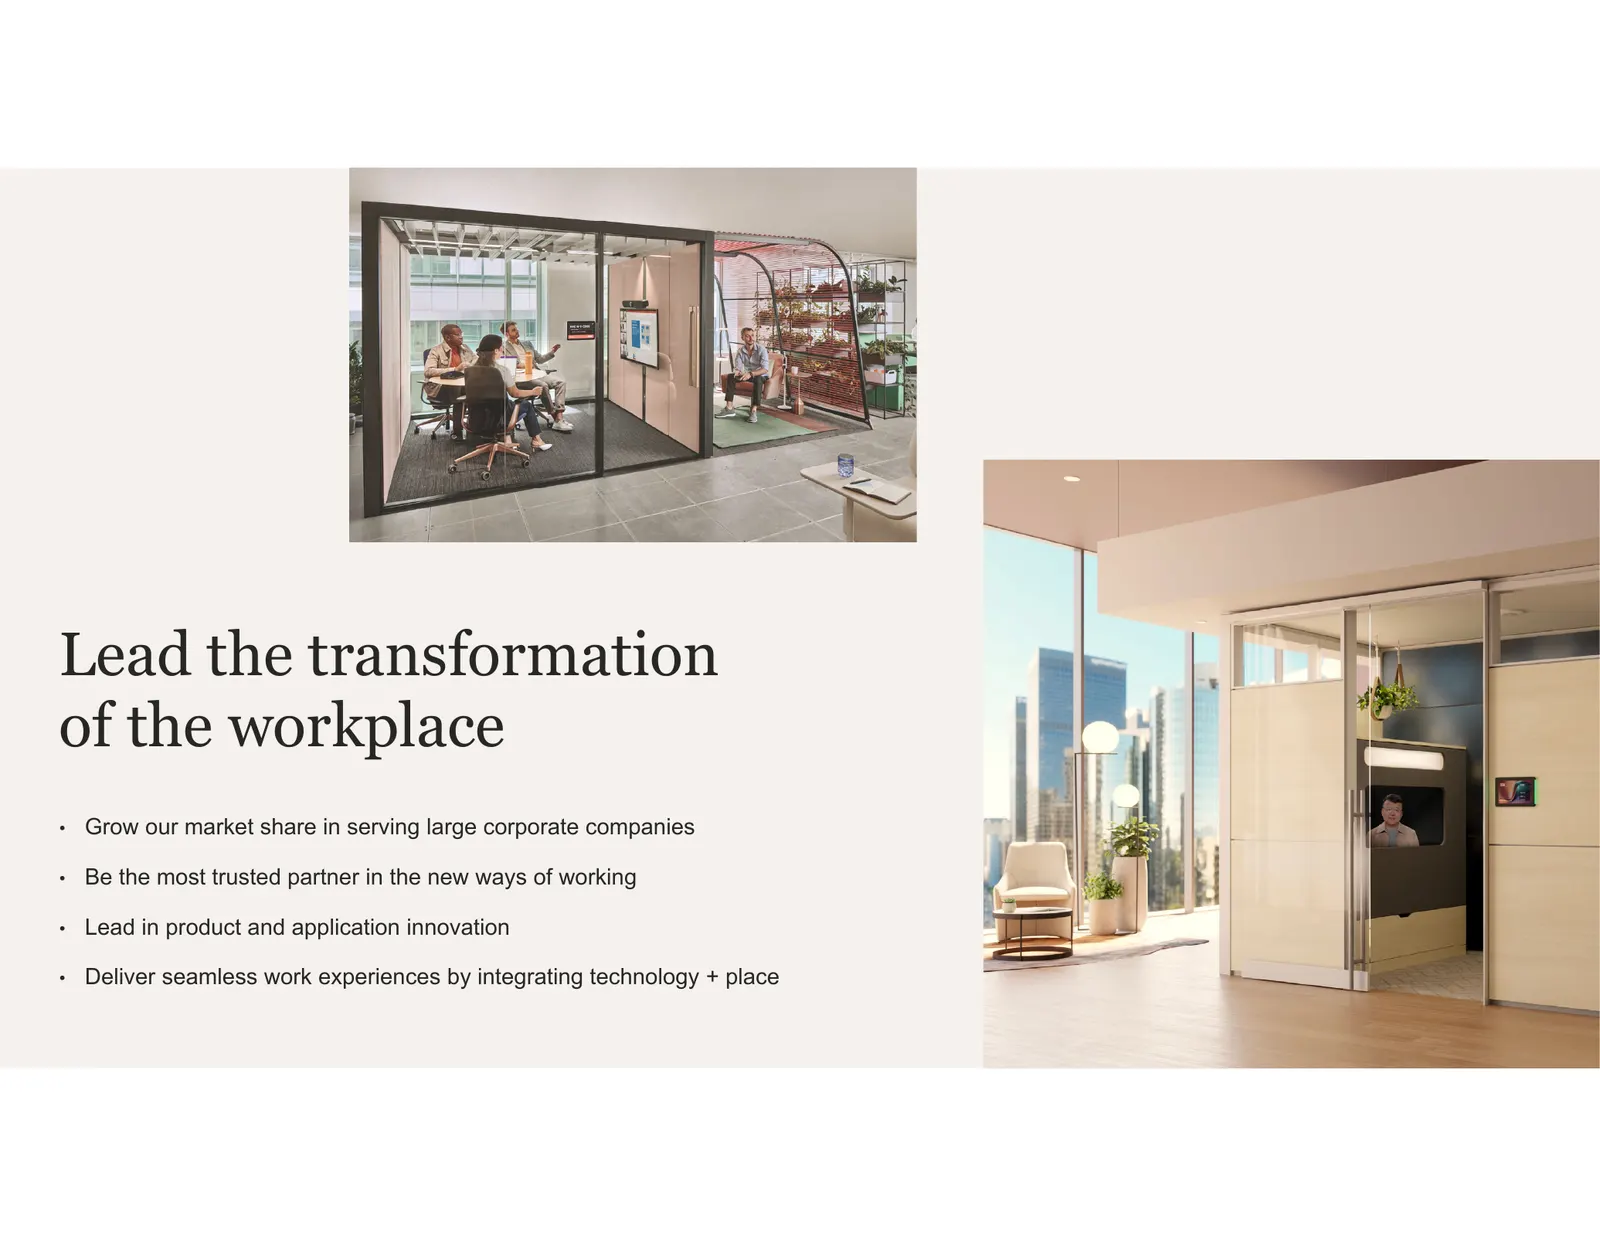
Lead the transformation of the workplace • Grow our market share in serving large corporate companies • Be the most trusted partner in the new ways of working • Lead in product and application innovation • Deliver seamless work experiences by integrating technology + place
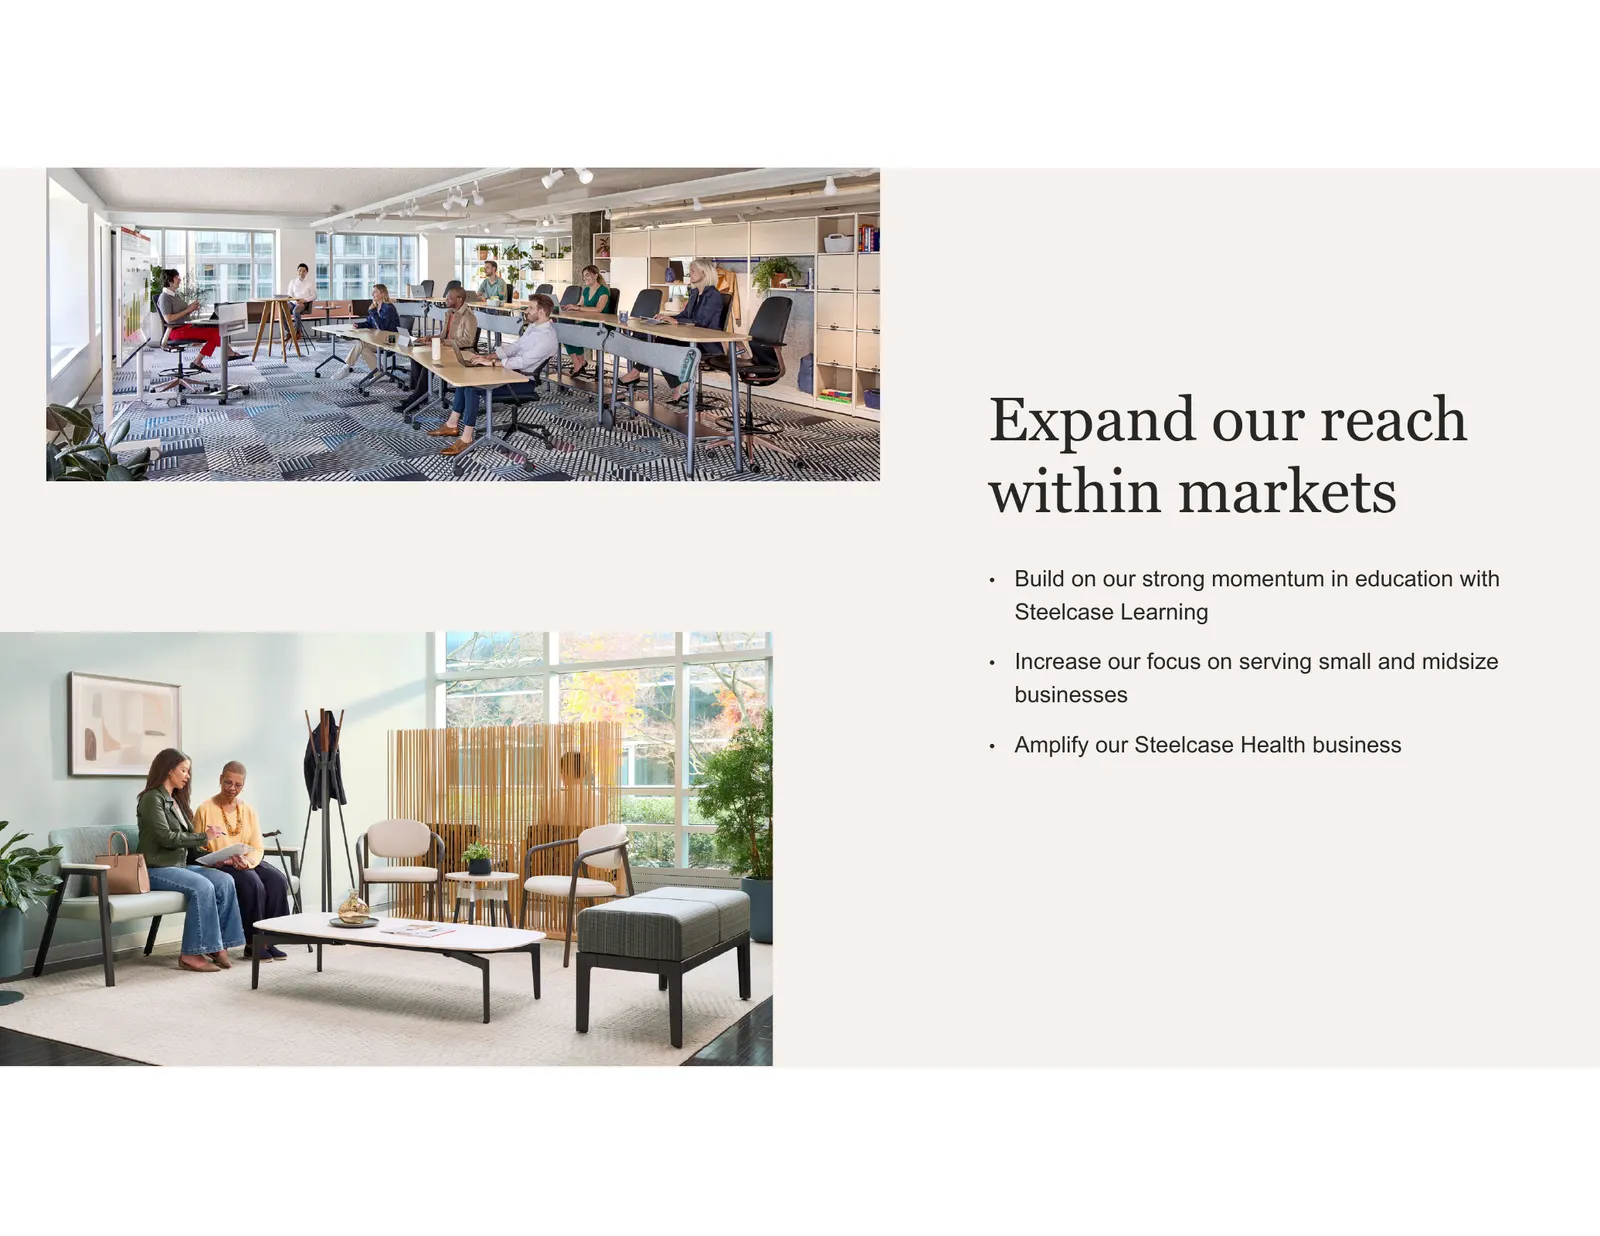
Slide 13: Expand our reach within markets
Expand our reach within markets • Build on our strong momentum in education with Steelcase Learning • Increase our focus on serving small and midsize businesses • Amplify our Steelcase Health business
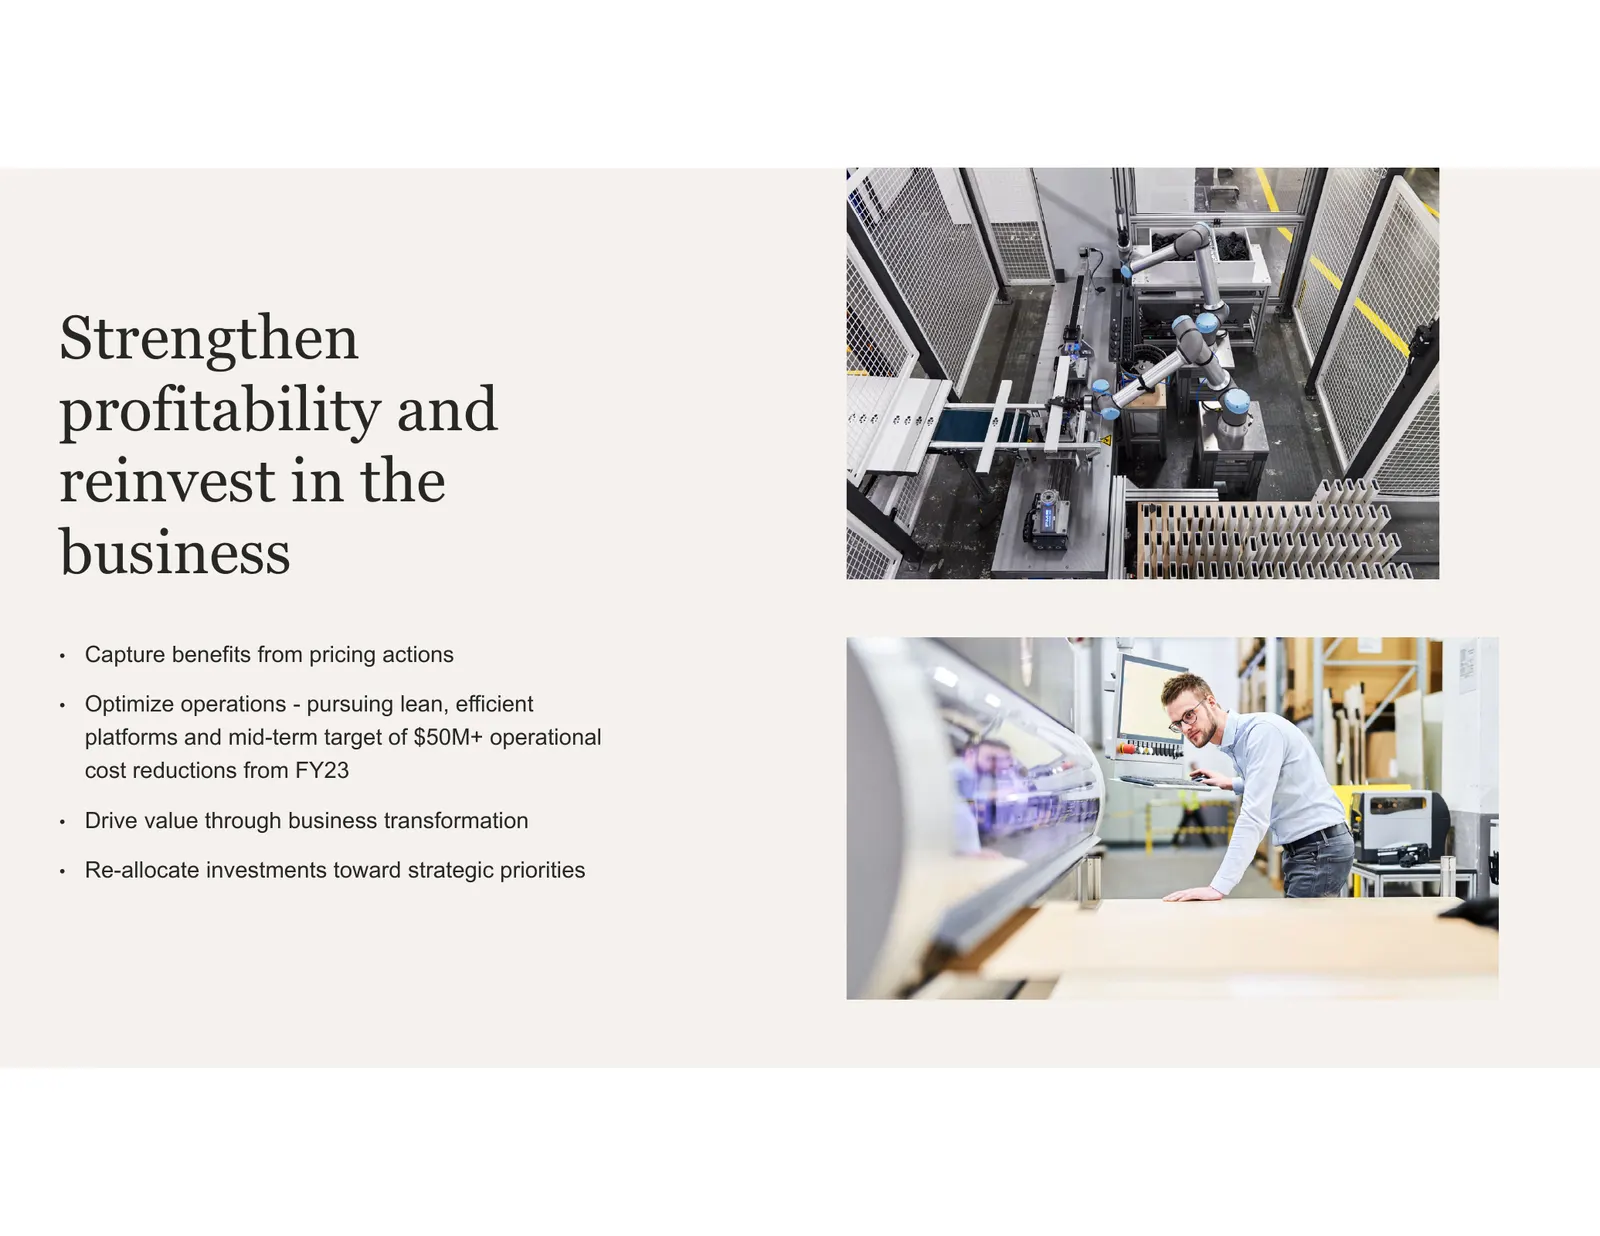
Slide 14: Strengthen profitability and reinvest in the business
Strengthen profitability and reinvest in the business • Capture benefits from pricing actions • Optimize operations - pursuing lean, efficient platforms and mid-term target of $50M+ operational cost reductions from FY23 • Drive value through business transformation • Re-allocate investments toward s

Slide 15: People + Planet
Doing our best work for the places we all share starts with designing better futures for the wellbeing of people and the planet. People + Planet We’re doing better for We’re doing better for people by building the planet by community and belonging transforming our business where everyone feels and c
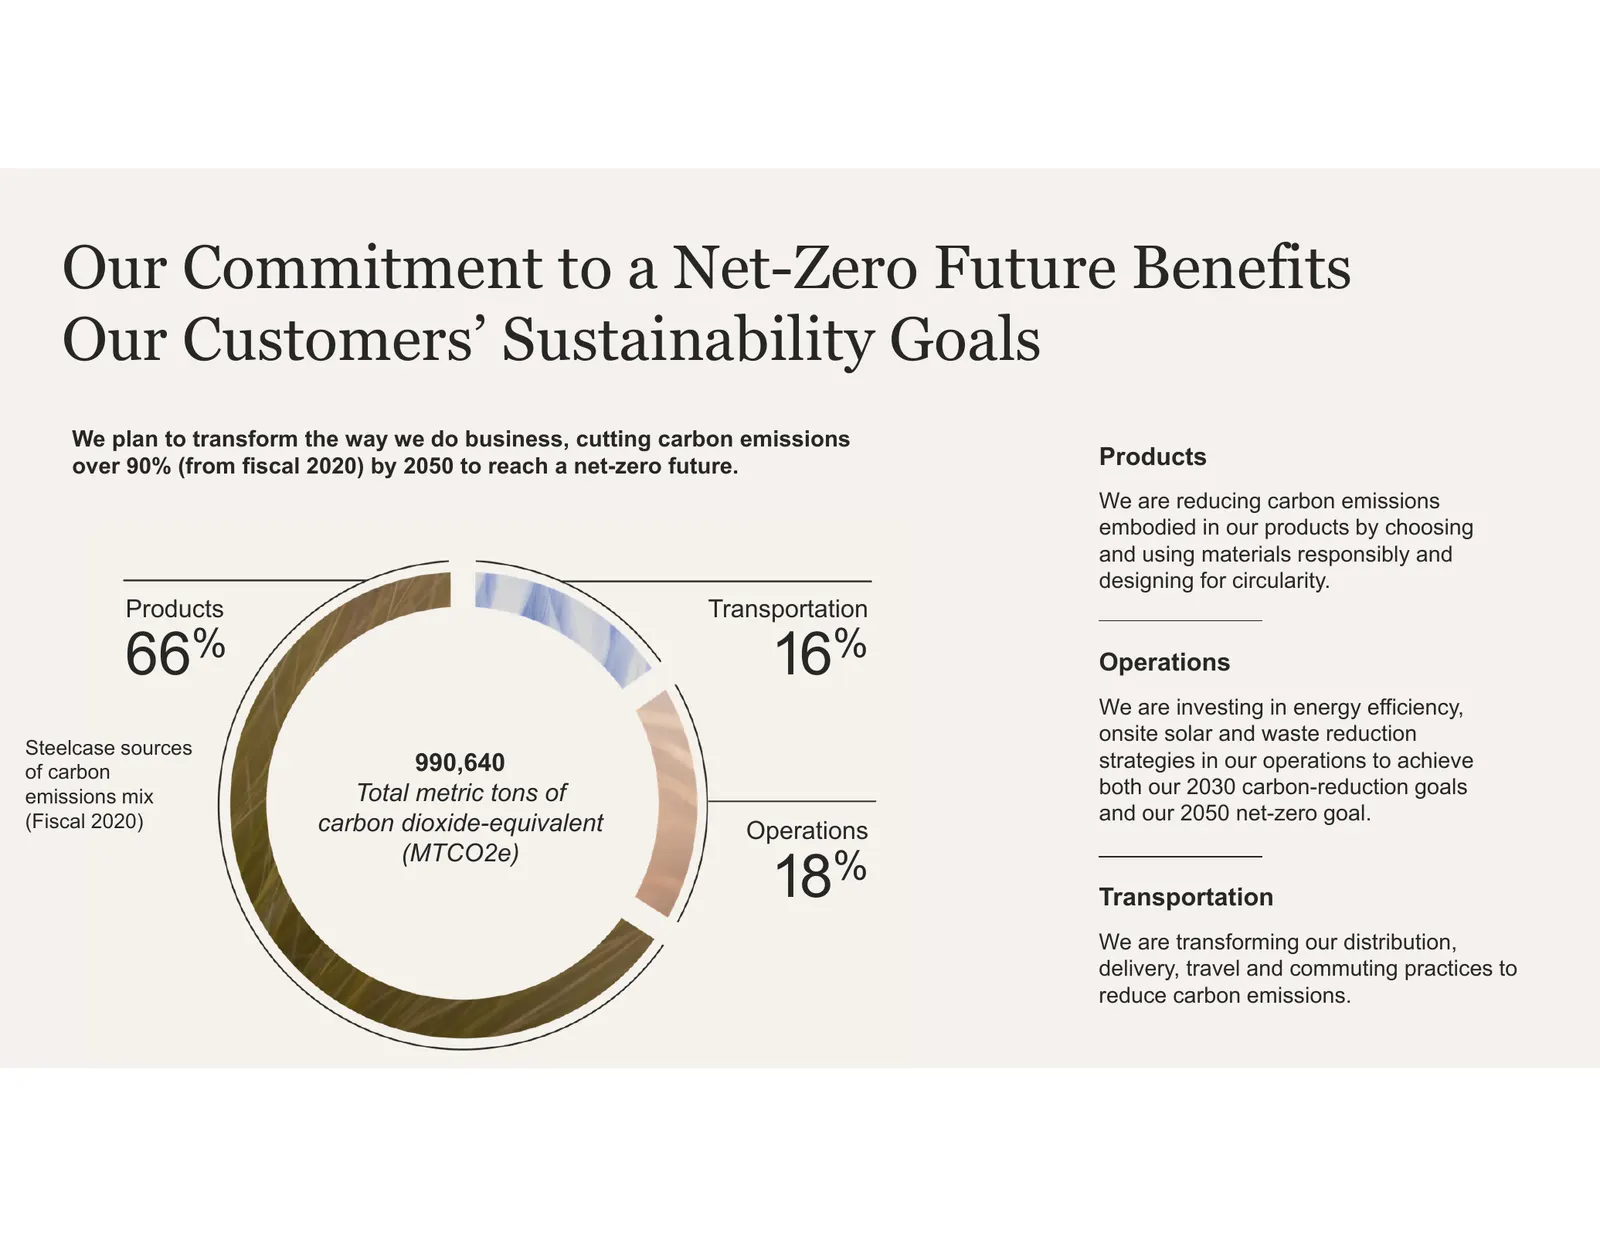
Slide 16: Our Commitment to a Net-Zero Future
Our Commitment to a Net-Zero Future Benefits Our Customers’ Sustainability Goals We plan to transform the way we do business, cutting carbon emissions over 90% (from fiscal 2020) by 2050 to reach a net-zero future. Products We are reducing carbon emissions embodied in our products by choosing and us
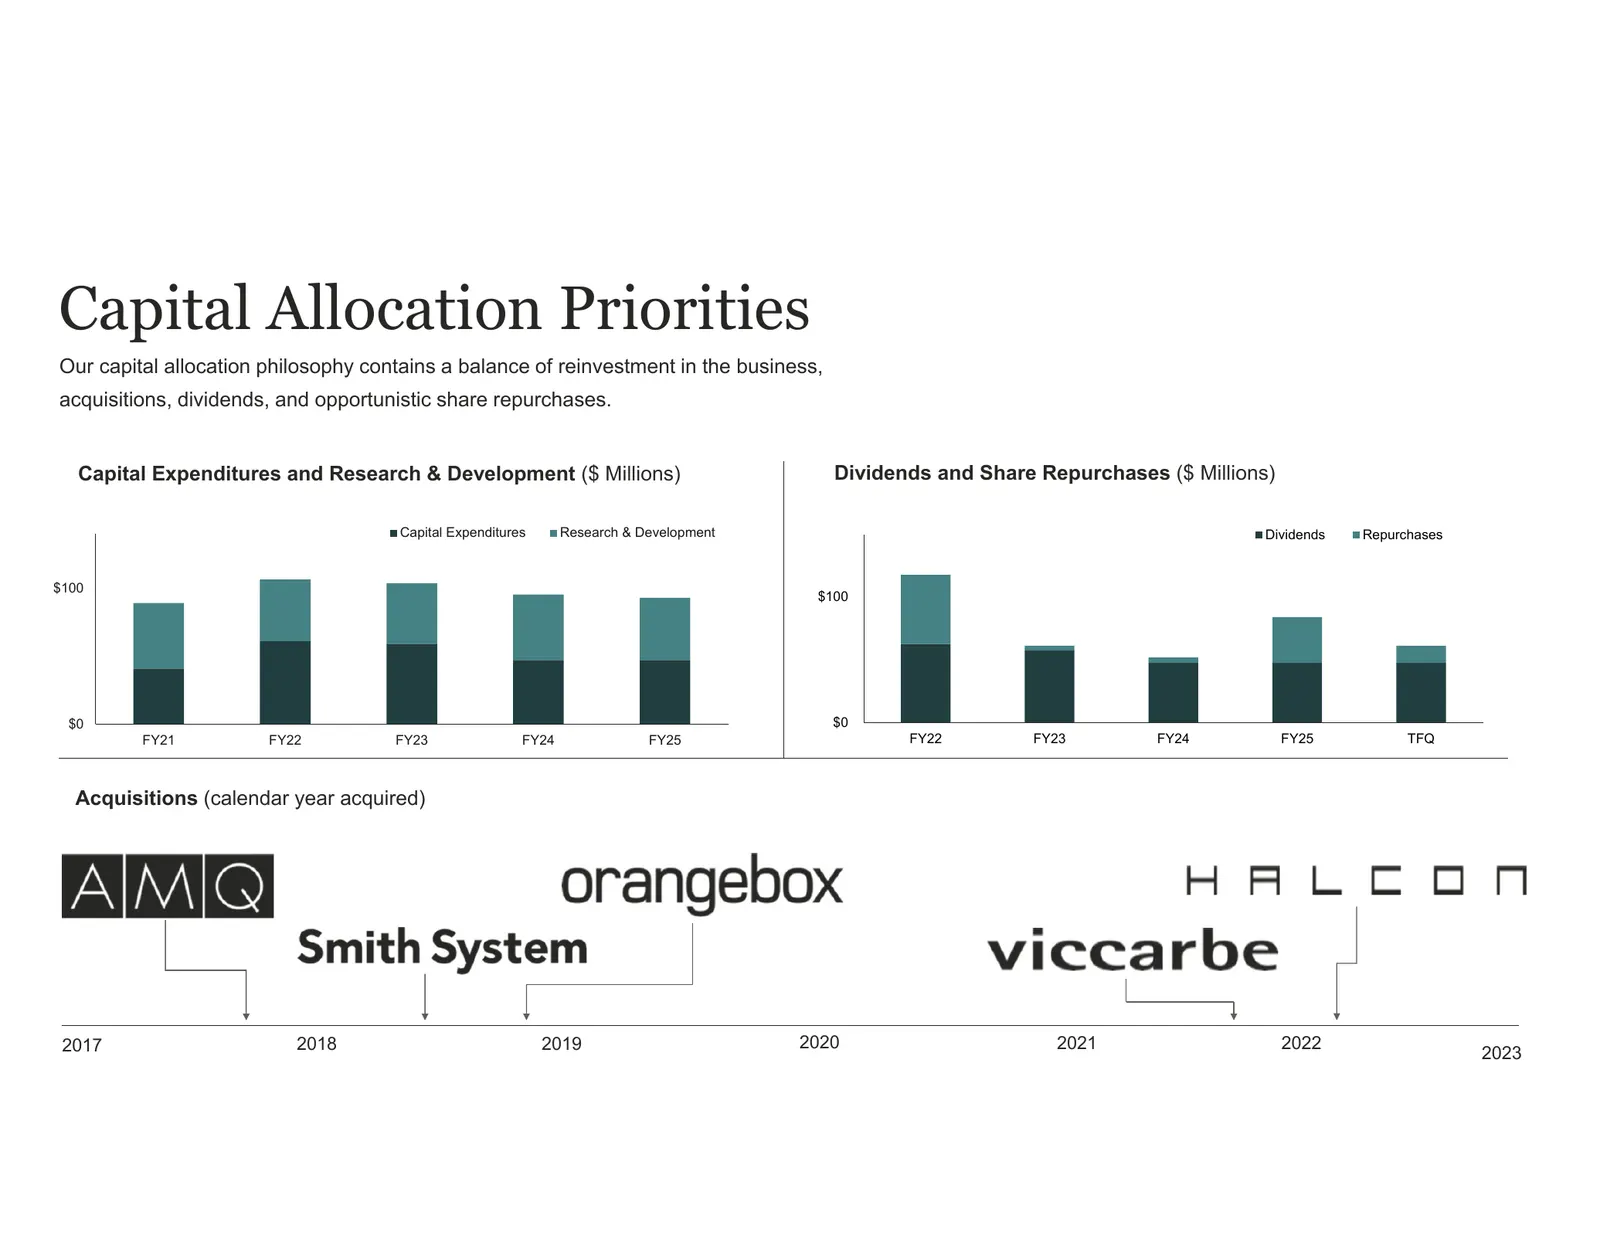
Slide 17: Capital Allocation Priorities
Capital Allocation Priorities Our capital allocation philosophy contains a balance of reinvestment in the business, acquisitions, dividends, and opportunistic share repurchases. Capital Expenditures and Research & Development ($ Millions) Dividends and Share Repurchases ($ Millions) Capital Expendit

Slide 18: Appendix
Appendix
Slide 19: Forward Looking Statements
Forward Looking These forward-looking statements discuss Forward-looking statements involve a number of goals, intentions and expectations as to future risks and uncertainties that could cause actual trends, plans, events, results of operations or results to differ materially from those in the State
Slide 20: Segment Revenue, Adjusted OI Margin and Select Statistics
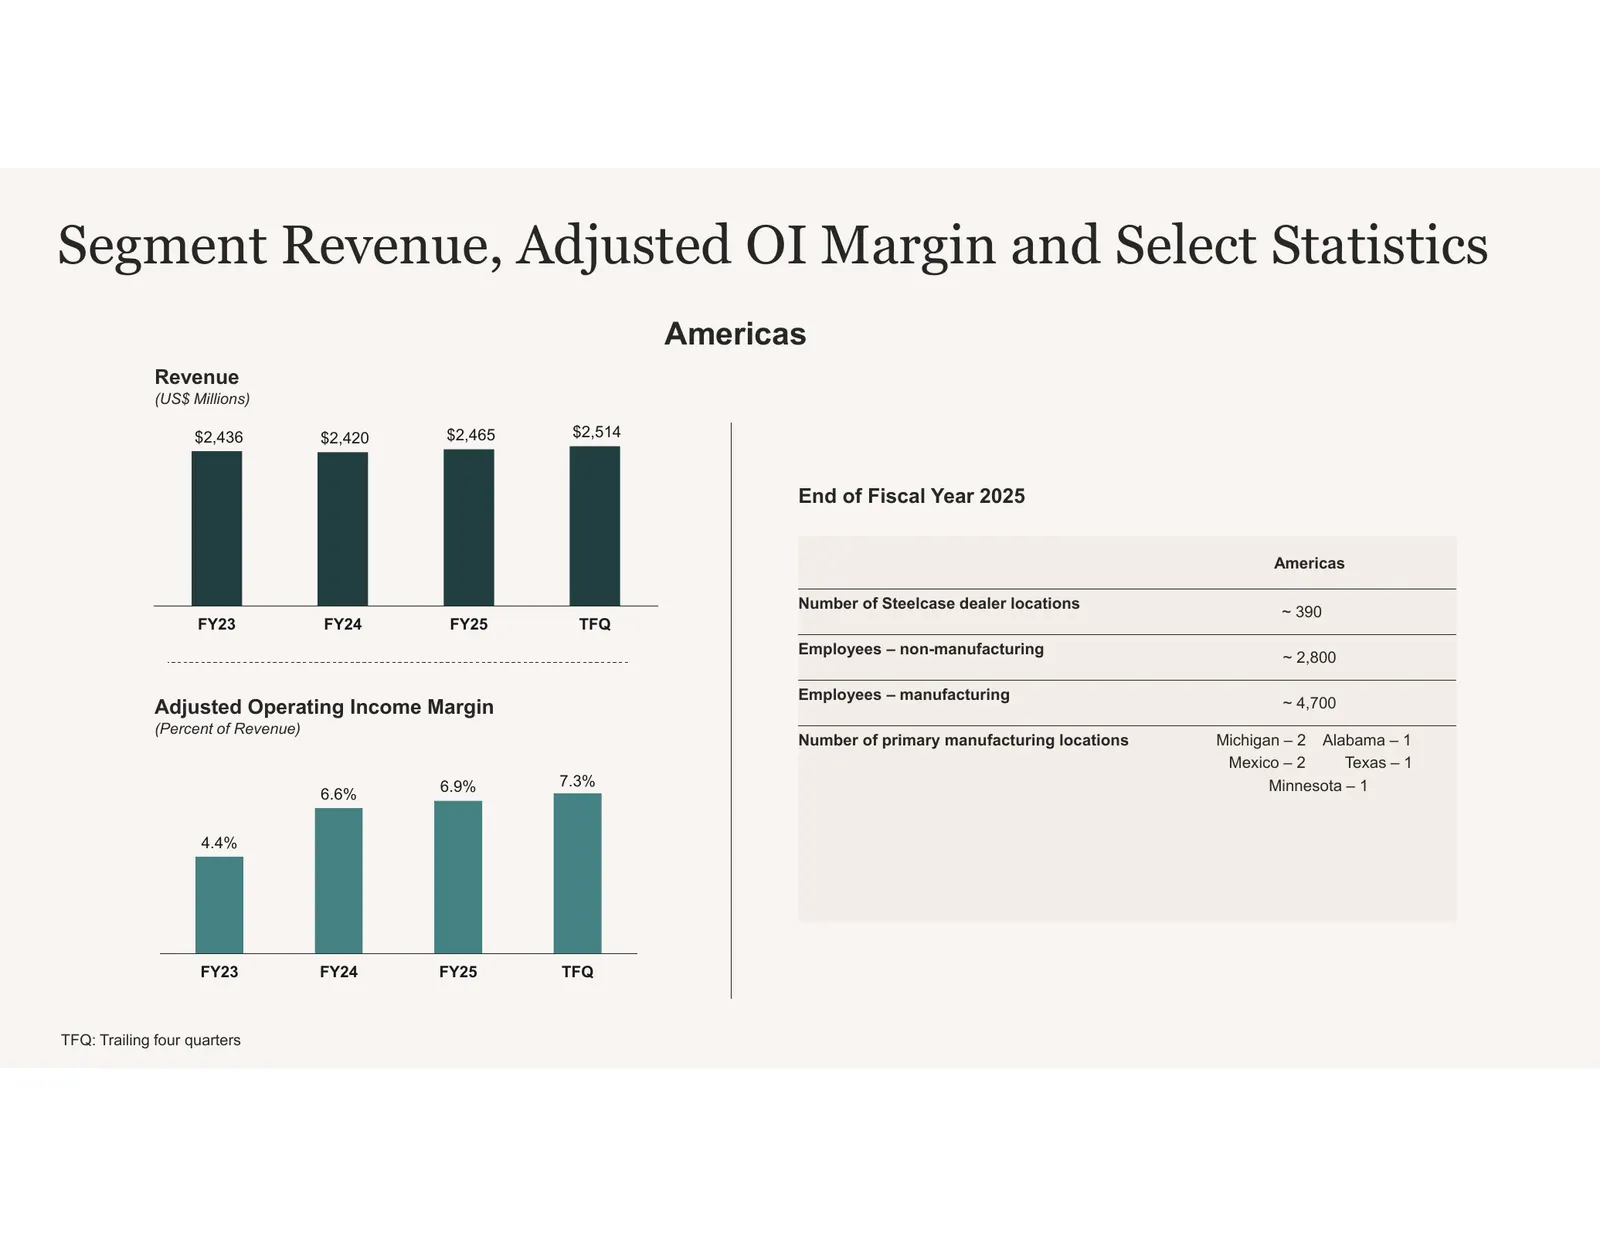
Segment Revenue, Adjusted OI Margin and Select Statistics Americas Revenue (US$ Millions) $2,436 $2,420 $2,465 $2,514 End of Fiscal Year 2025 Americas Number of Steelcase dealer locations ~ 390 FY23 FY24 FY25 TFQ Employees – non-manufacturing ~ 2,800 Employees – manufacturing Adjusted Operating Inco
Slide 21: U.S. Industry Macro-Factors
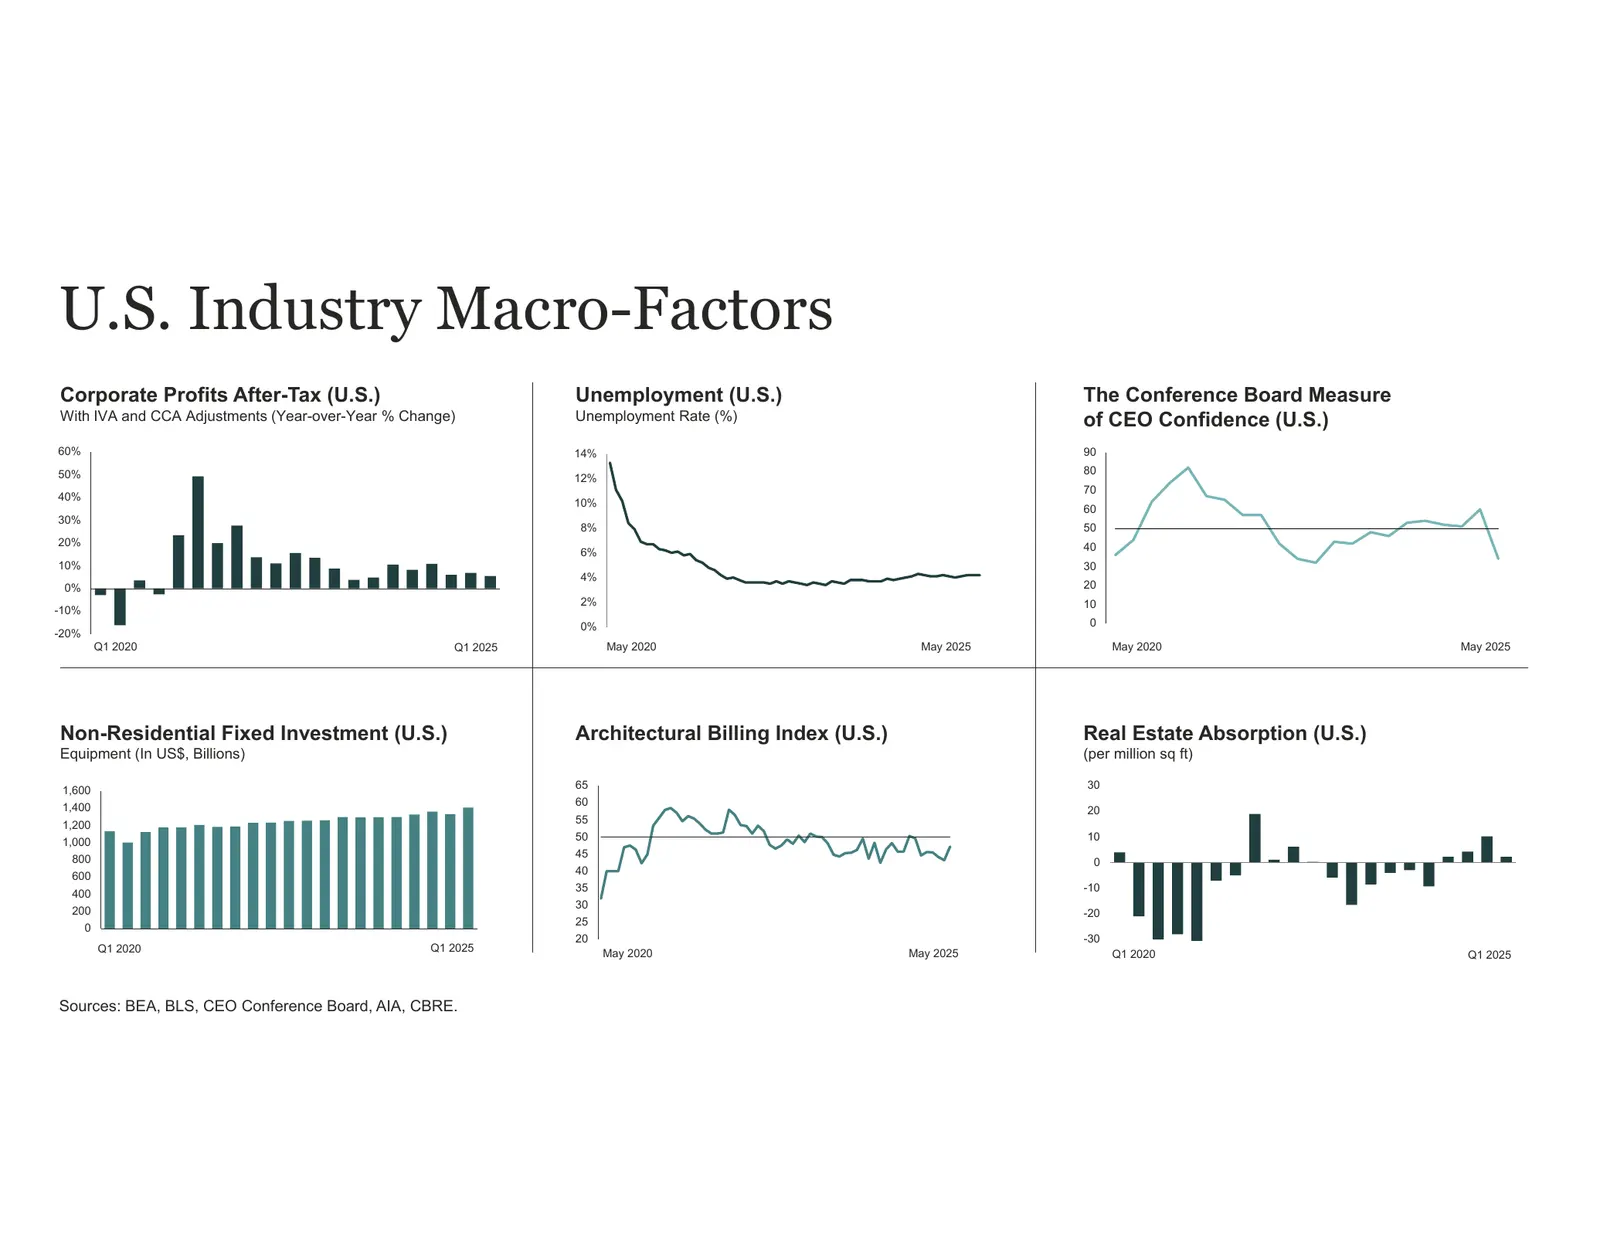
U.S. Industry Macro-Factors Corporate Profits After-Tax (U.S.) Unemployment (U.S.) The Conference Board Measure With IVA and CCA Adjustments (Year-over-Year % Change) Unemployment Rate (%) of CEO Confidence (U.S.) 60% 14% 90 50% 80 12% 70 40% 10% 60 30% 8% 50 20% 40 6% 10% 30 4% 0% 20 2% 10 -10% 0%
Slide 22: Segment Revenue, Adjusted OI Margin and Select Statistics
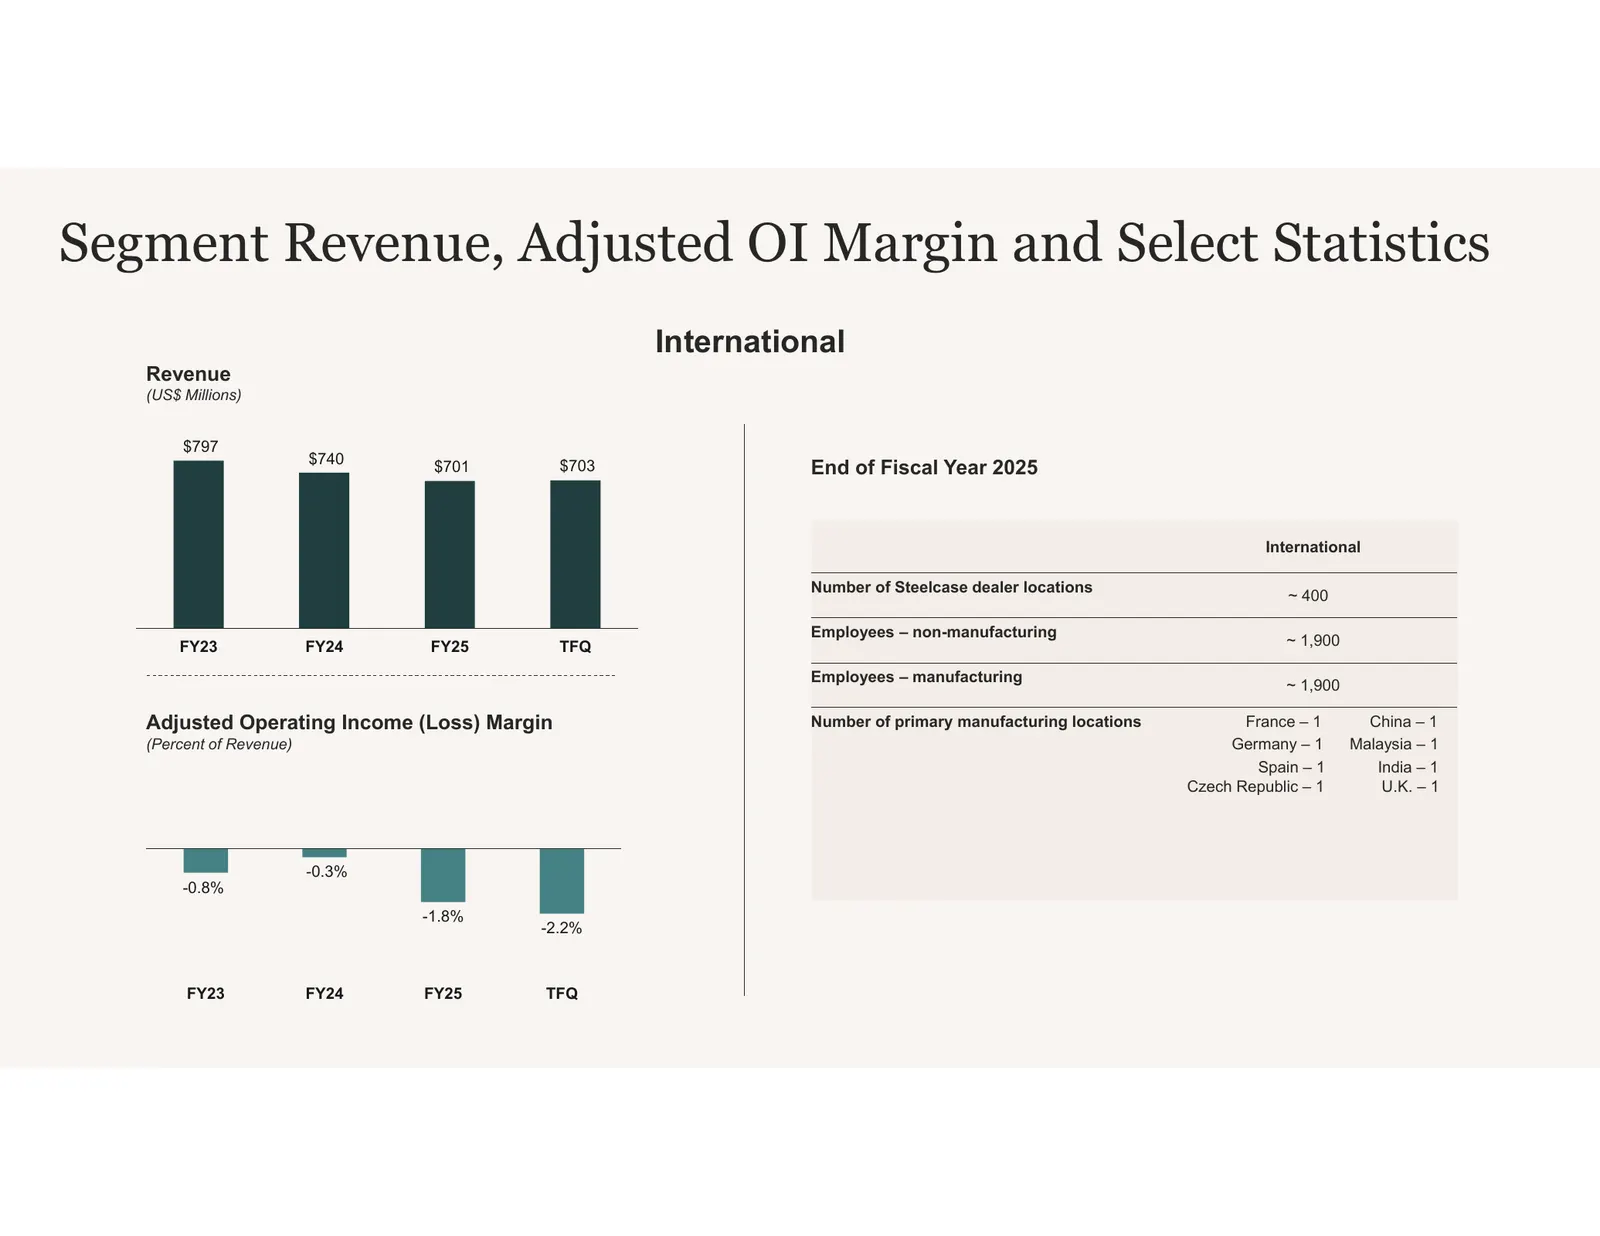
Segment Revenue, Adjusted OI Margin and Select Statistics International Revenue (US$ Millions) $797 $740 $701 $703 End of Fiscal Year 2025 International Number of Steelcase dealer locations ~ 400 Employees – non-manufacturing FY23 FY24 FY25 TFQ ~ 1,900 Employees – manufacturing ~ 1,900 Adjusted Oper
Slide 23: International Industry Macro-Factors
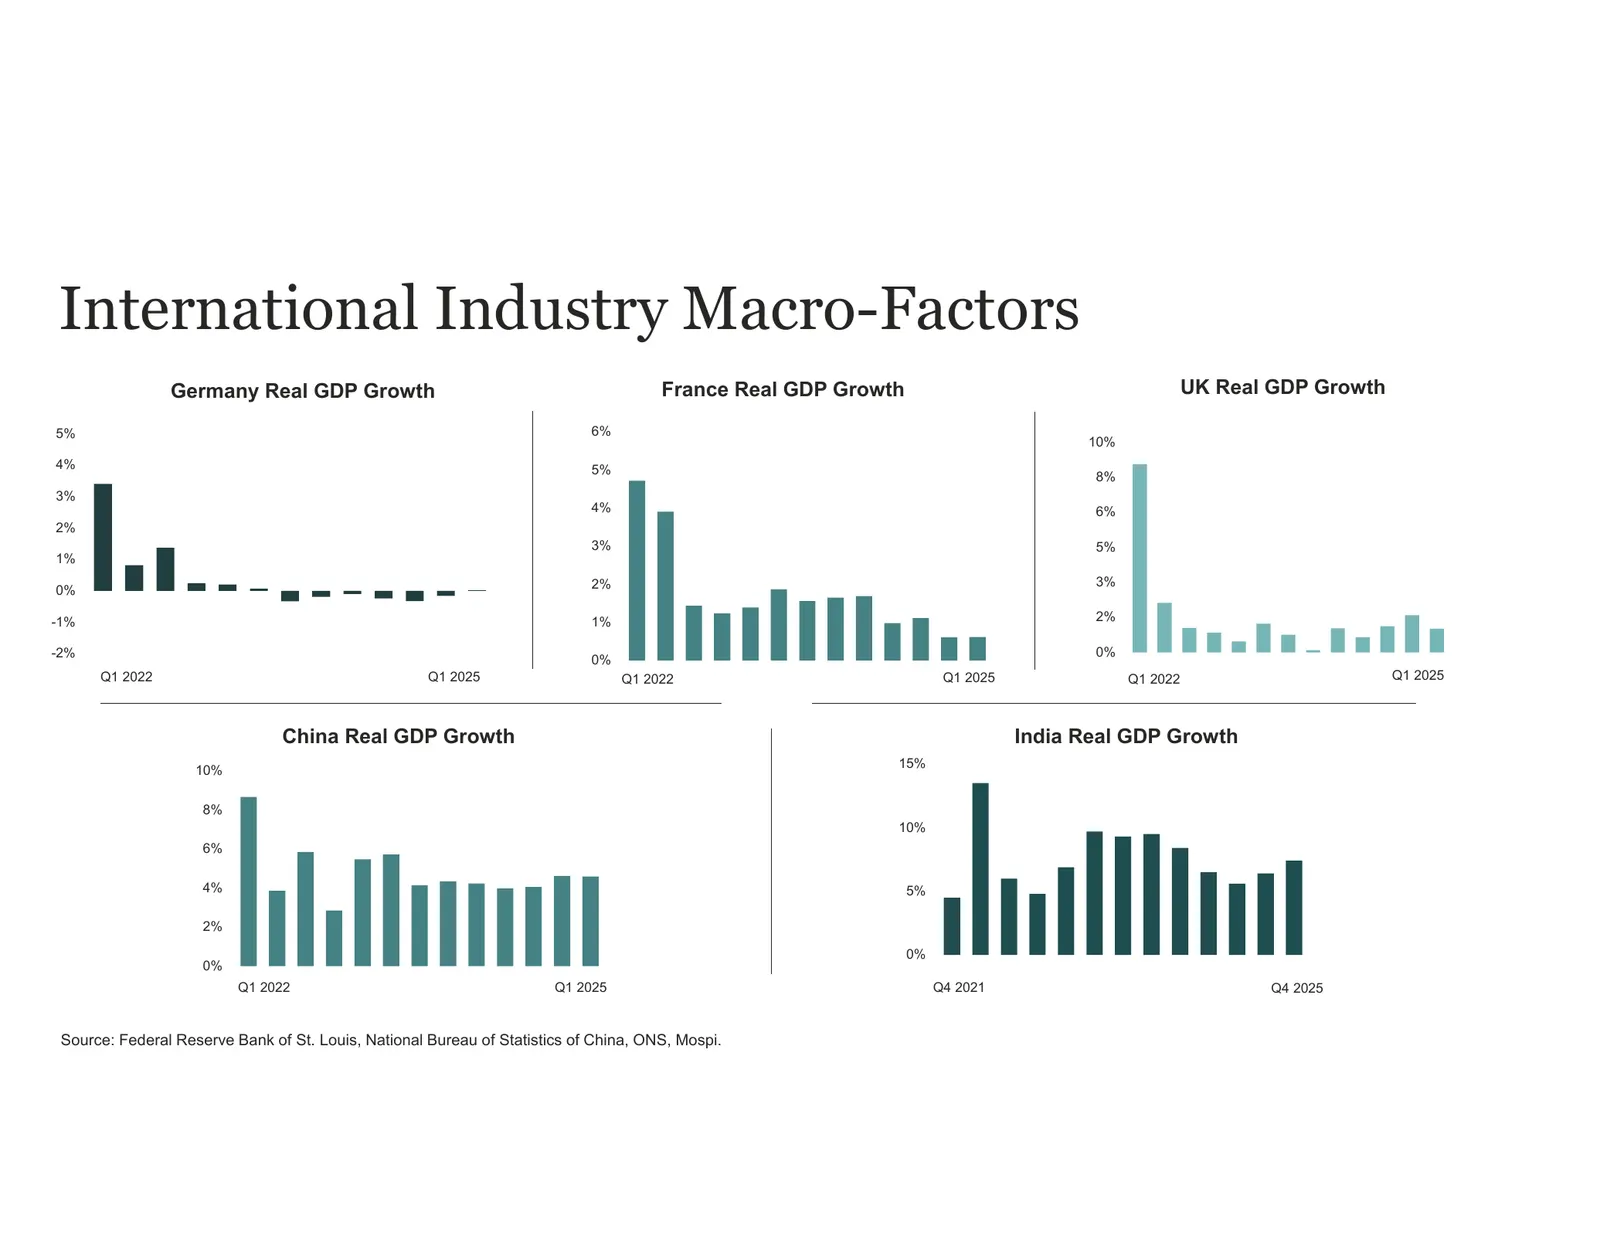
International Industry Macro-Factors Germany Real GDP Growth France Real GDP Growth UK Real GDP Growth 5% 6% 10% 4% 5% 8% 3% 4% 6% 2% 3% 5% 1% 2% 3% 0% -1% 1% 2% -2% 0% 0% Q1 2022 Q1 2025 Q1 2022 Q1 2025 Q1 2022 Q1 2025 China Real GDP Growth India Real GDP Growth 15% 10% 8% 10% 6% 4% 5% 2% 0% 0% Q1
Slide 24: Historical Shares Outstanding
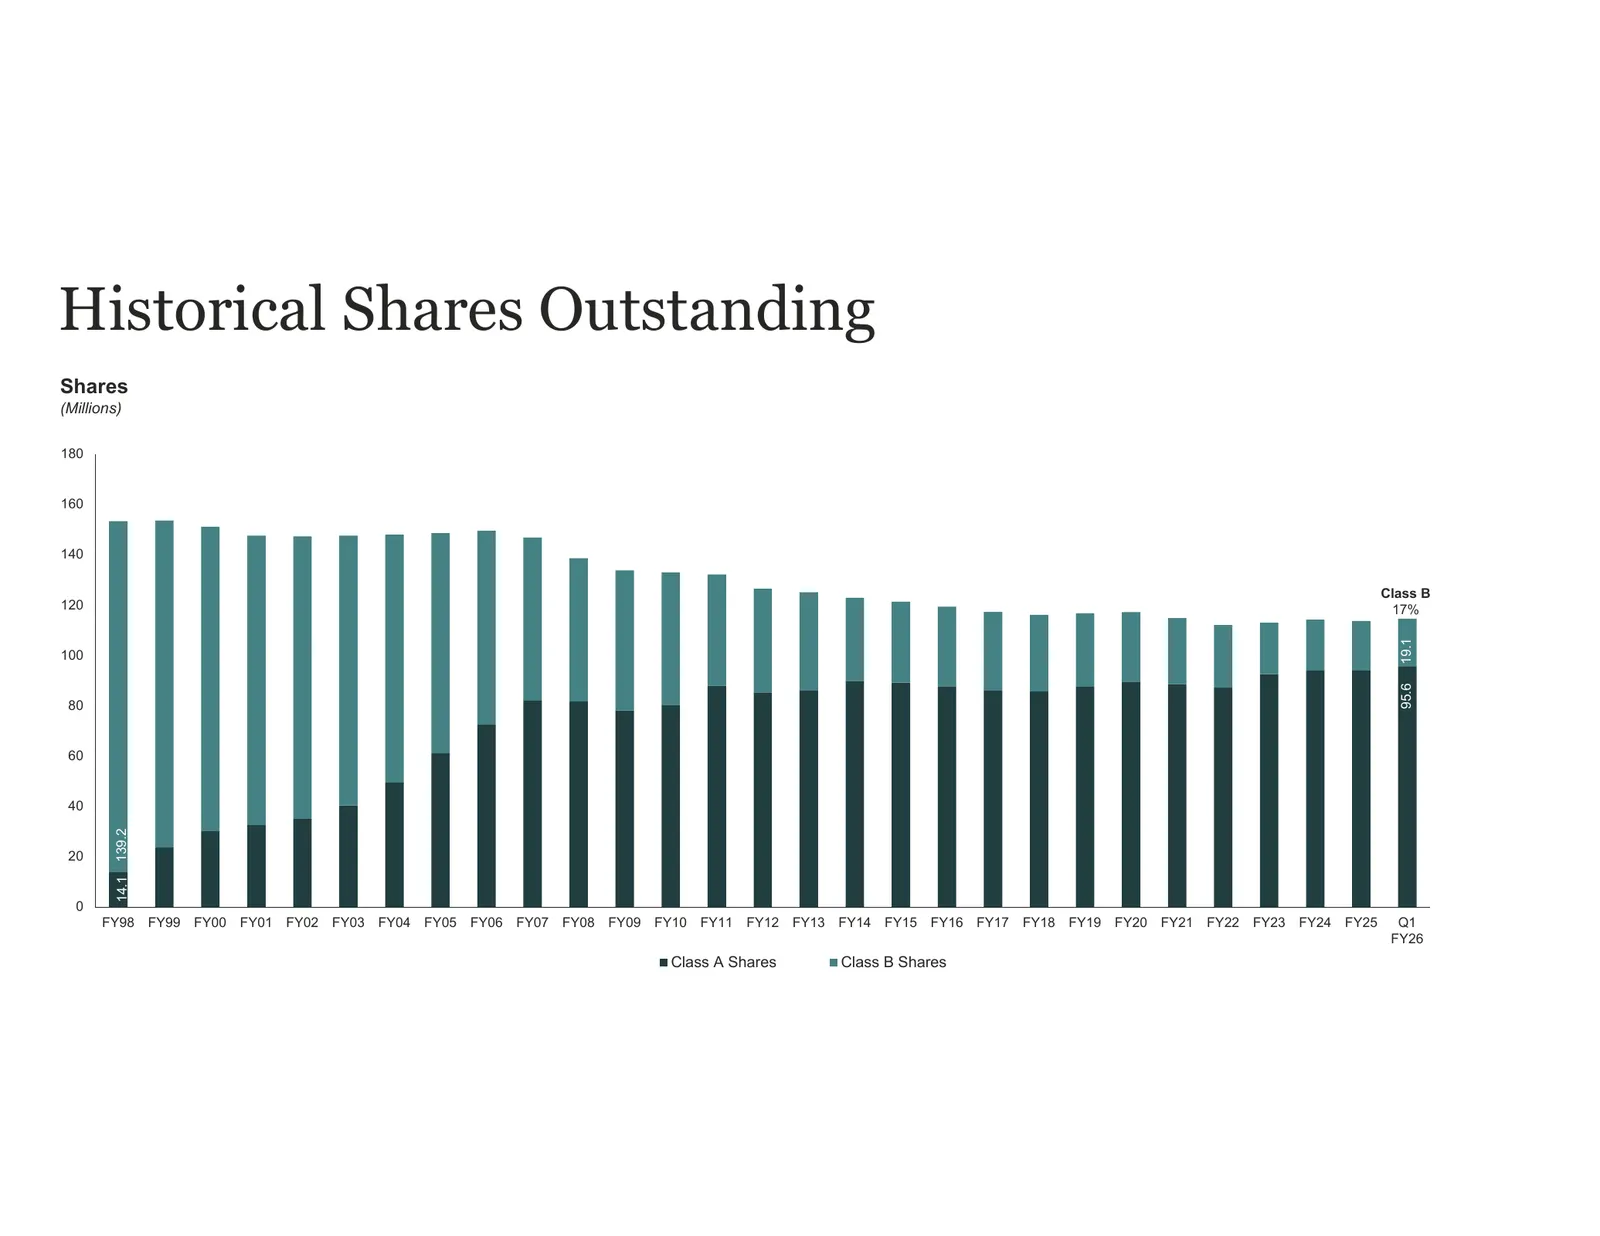
Historical Shares Outstanding Shares (Millions) 180 160 140 Class B 120 17% 19.1 100 95.6 80 60 40 139.2 20 14.1 0 FY98 FY99 FY00 FY01 FY02 FY03 FY04 FY05 FY06 FY07 FY08 FY09 FY10 FY11 FY12 FY13 FY14 FY15 FY16 FY17 FY18 FY19 FY20 FY21 FY22 FY23 FY24 FY25 Q1 FY26 Class A Shares Class B Shares
Slide 25: Non-GAAP Financial Measures
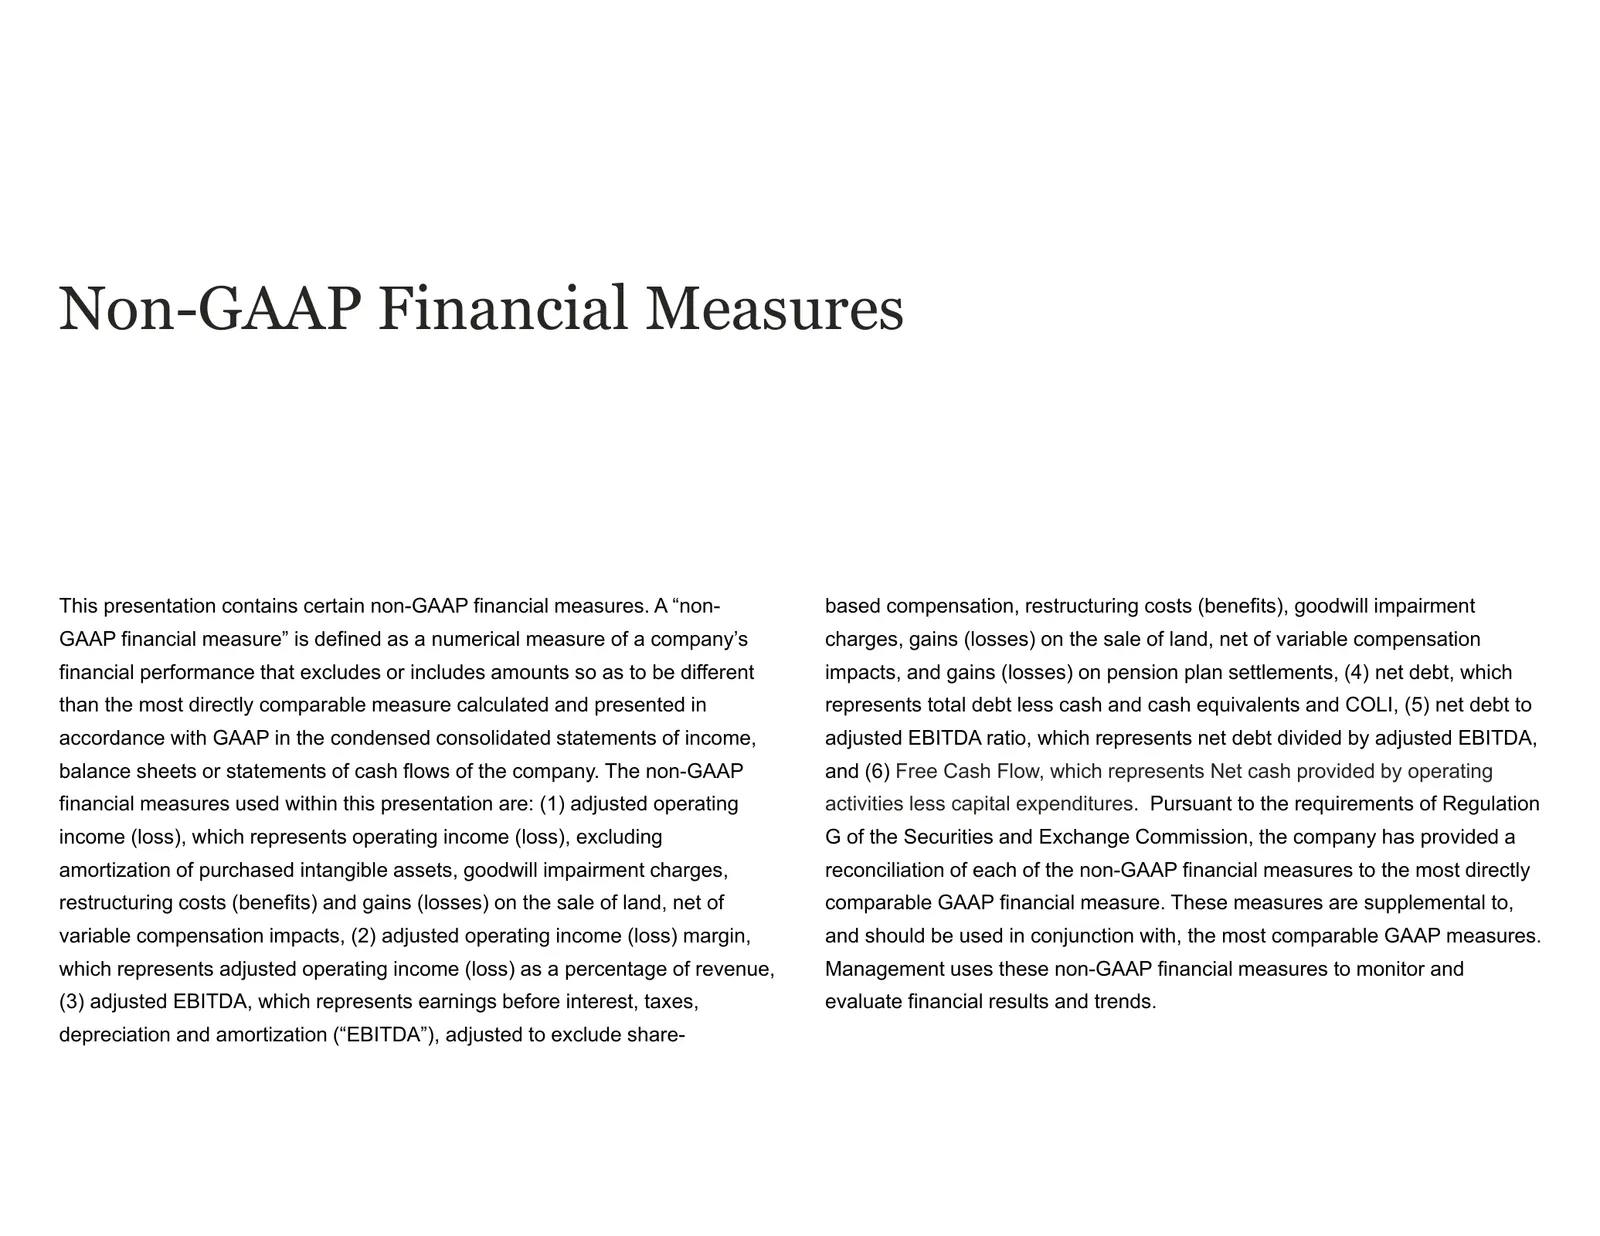
Non-GAAP Financial Measures This presentation contains certain non-GAAP financial measures. A “non- based compensation, restructuring costs (benefits), goodwill impairment GAAP financial measure” is defined as a numerical measure of a company’s charges, gains (losses) on the sale of land, net of var
Slide 26: Non-GAAP Financial Measures
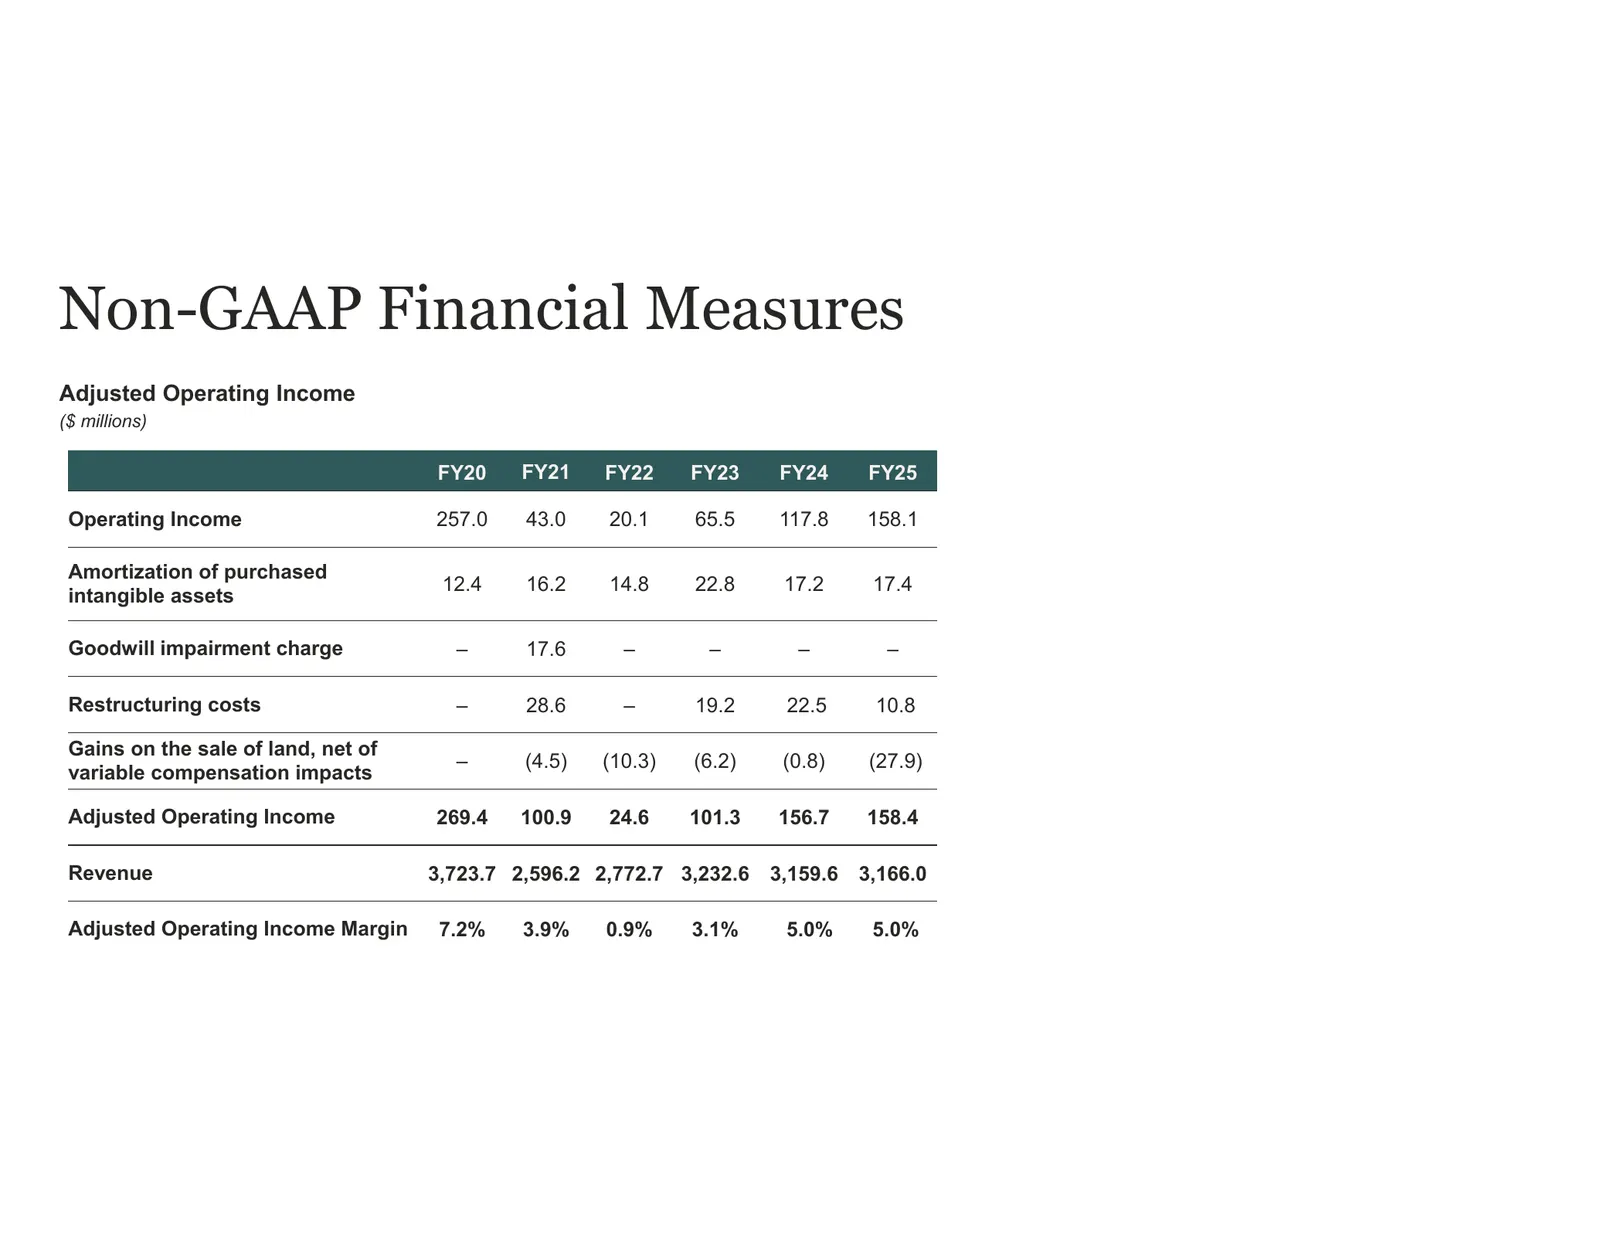
Non-GAAP Financial Measures Adjusted Operating Income ($ millions) FY20 FY21 FY22 FY23 FY24 FY25 Operating Income 257.0 43.0 20.1 65.5 117.8 158.1 Amortization of purchased 12.4 16.2 14.8 22.8 17.2 17.4 intangible assets Goodwill impairment charge – 17.6 – – – – Restructuring costs – 28.6 – 19.2 22.
Slide 27: Non-GAAP Financial Measures
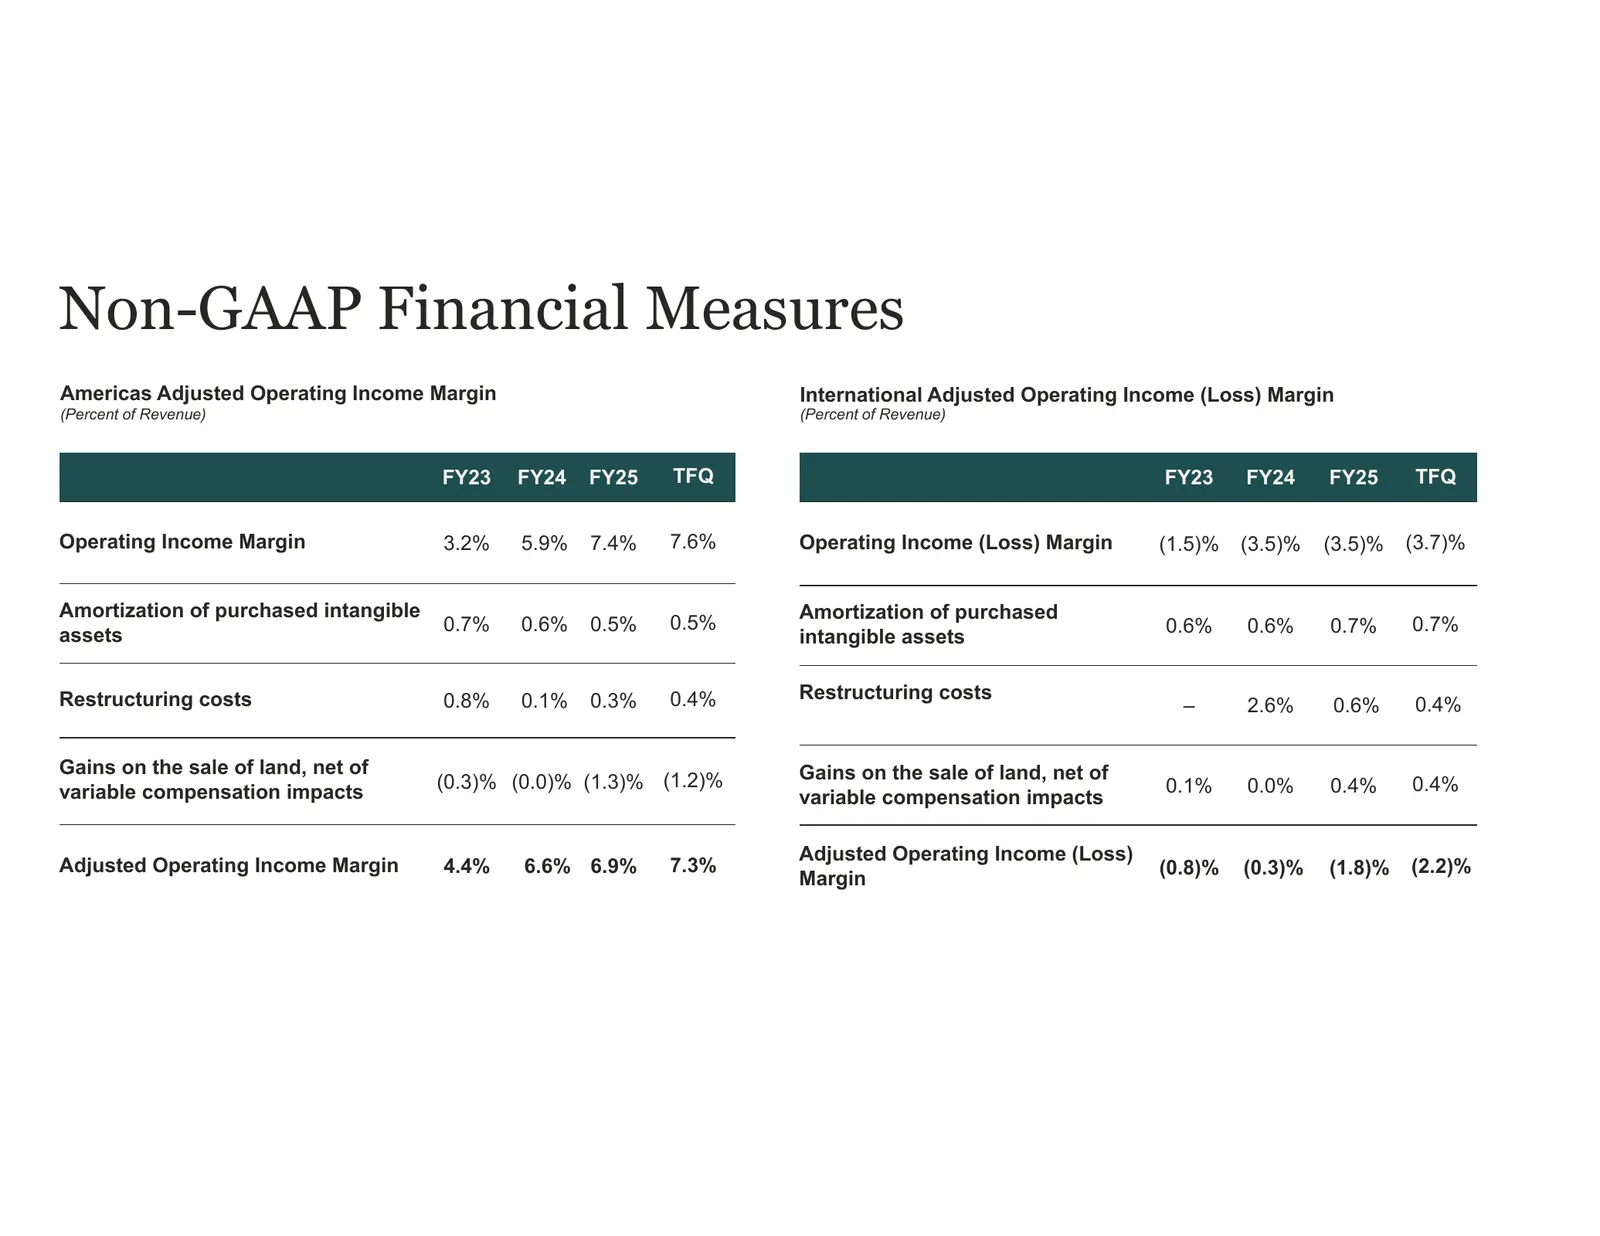
Non-GAAP Financial Measures Americas Adjusted Operating Income Margin International Adjusted Operating Income (Loss) Margin (Percent of Revenue) (Percent of Revenue) FY23 FY24 FY25 TFQ FY23 FY24 FY25 TFQ Operating Income Margin 3.2% 5.9% 7.4% 7.6% Operating Income (Loss) Margin (1.5)% (3.5)% (3.5)%
Slide 28: Non-GAAP Financial Measures
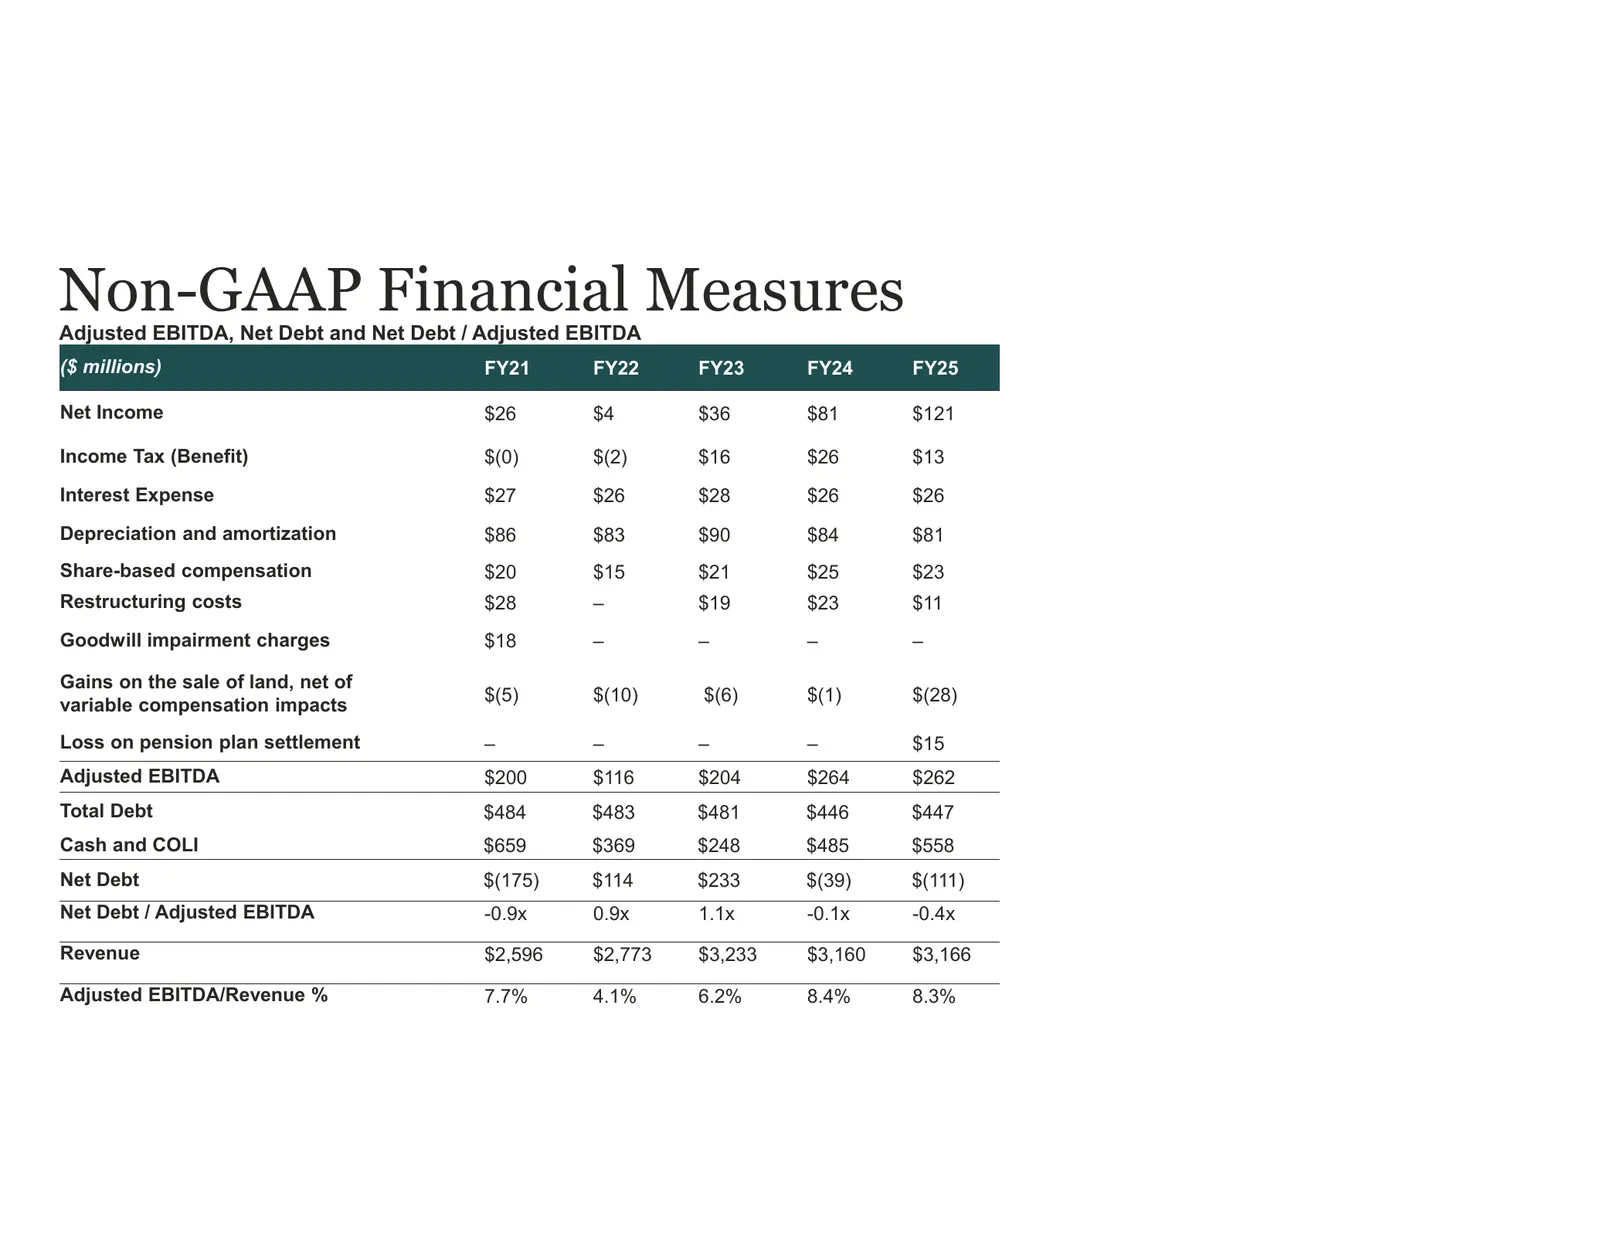
Non-GAAP Financial Measures Adjusted EBITDA, Net Debt and Net Debt / Adjusted EBITDA ($ millions) FY21 FY22 FY23 FY24 FY25 Net Income $26 $4 $36 $81 $121 Income Tax (Benefit) $(0) $(2) $16 $26 $13 Interest Expense $27 $26 $28 $26 $26 Depreciation and amortization $86 $83 $90 $84 $81 Share-based comp
Slide 29: Non-GAAP Financial Measures
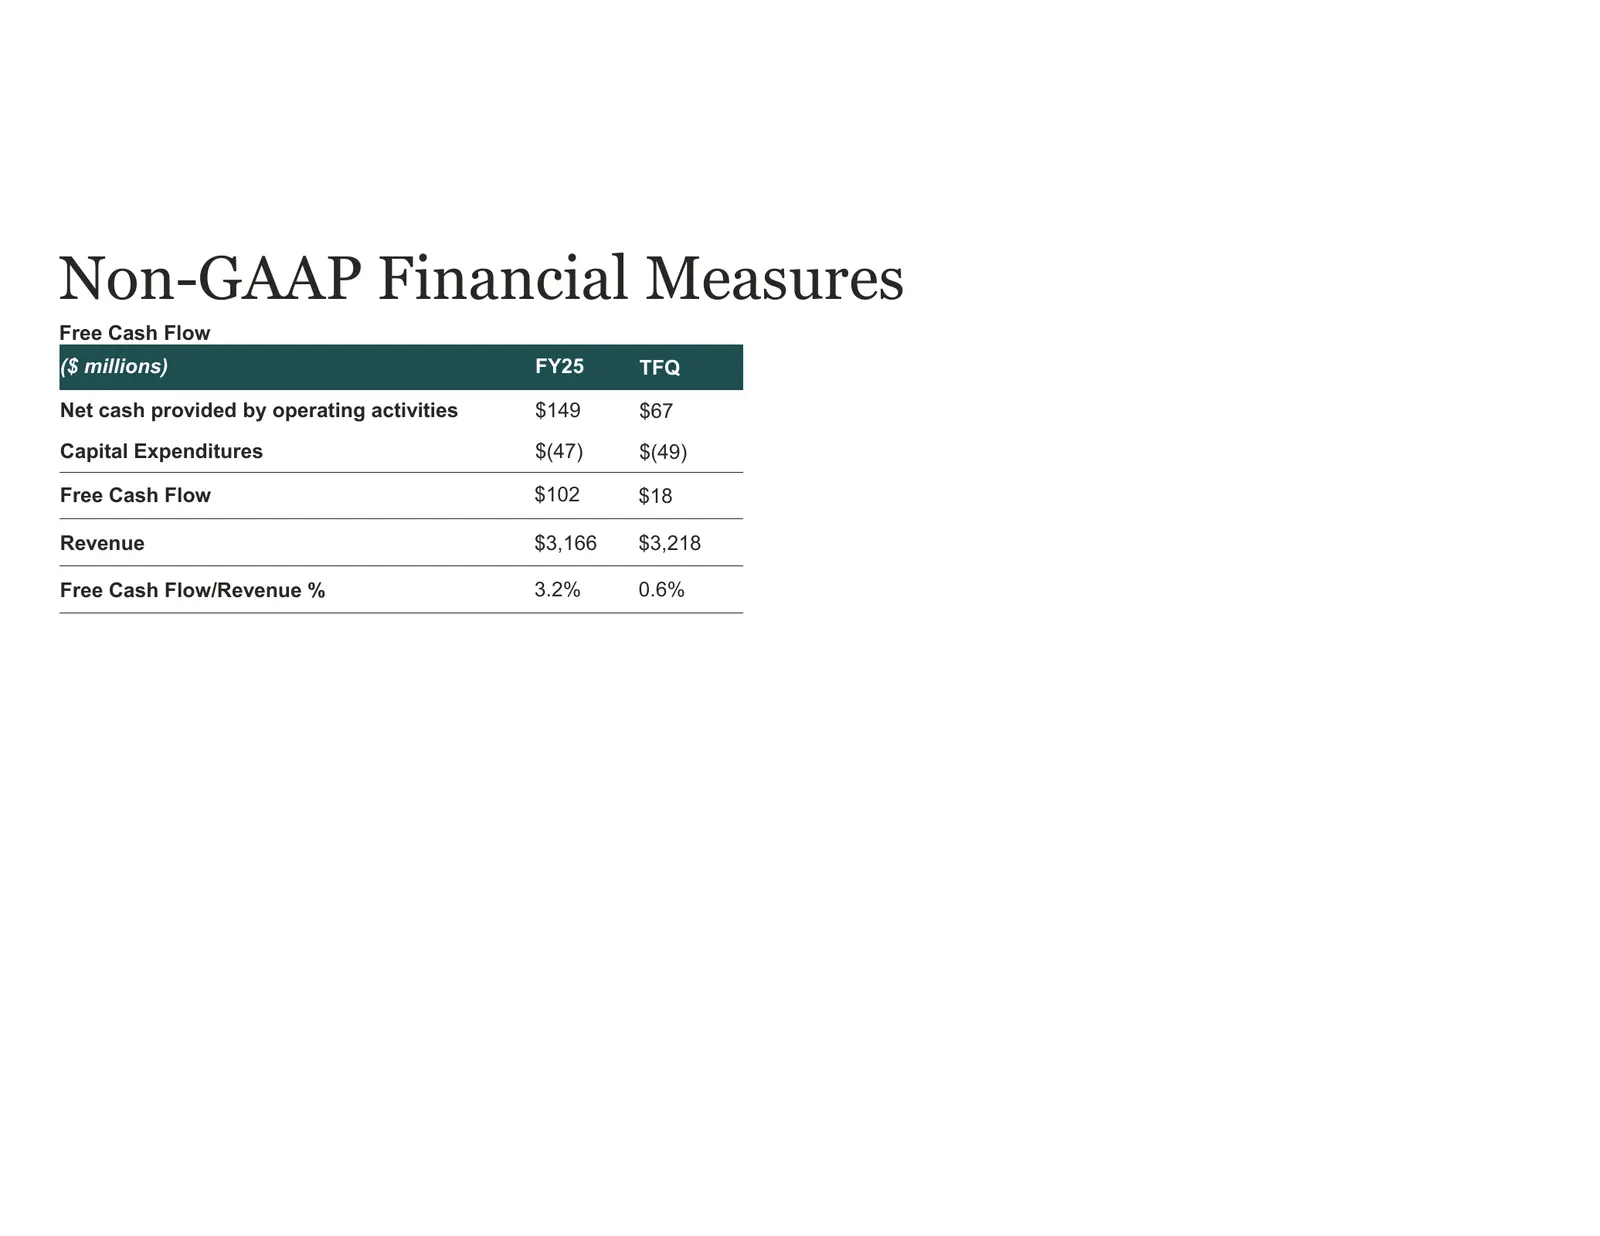
Non-GAAP Financial Measures Free Cash Flow ($ millions) FY25 TFQ Net cash provided by operating activities $149 $67 Capital Expenditures $(47) $(49) Free Cash Flow $102 $18 Revenue $3,166 $3,218 Free Cash Flow/Revenue % 3.2% 0.6%

Slide 30
Source: EarningsCall slides