Altra Industrial Motion — Q3 2019 Earnings Presentation
15 slides from Altra Industrial Motion's earnings presentation, Oct 24, 2019
Slide 1: Third-Quarter 2019 Results
Third-Quarter 2019 Results October 24, 2019 Exhibit 99.2
Slide 2: Q3 2019 Conference Call Details
Q3 2019 Conference Call Details Live Webcast October 24, 2019 10:00 AM ET Dial-In Number (866) 209-9085 Domestic (647) 689-5687 International Webcast at www.altramotion.com Replay Through November 7th (800) 585-8367 Domestic (416) 621-4642 International Conference ID: 6783259 Webcast Replay at www.a
Slide 3: Safe Harbor Statement
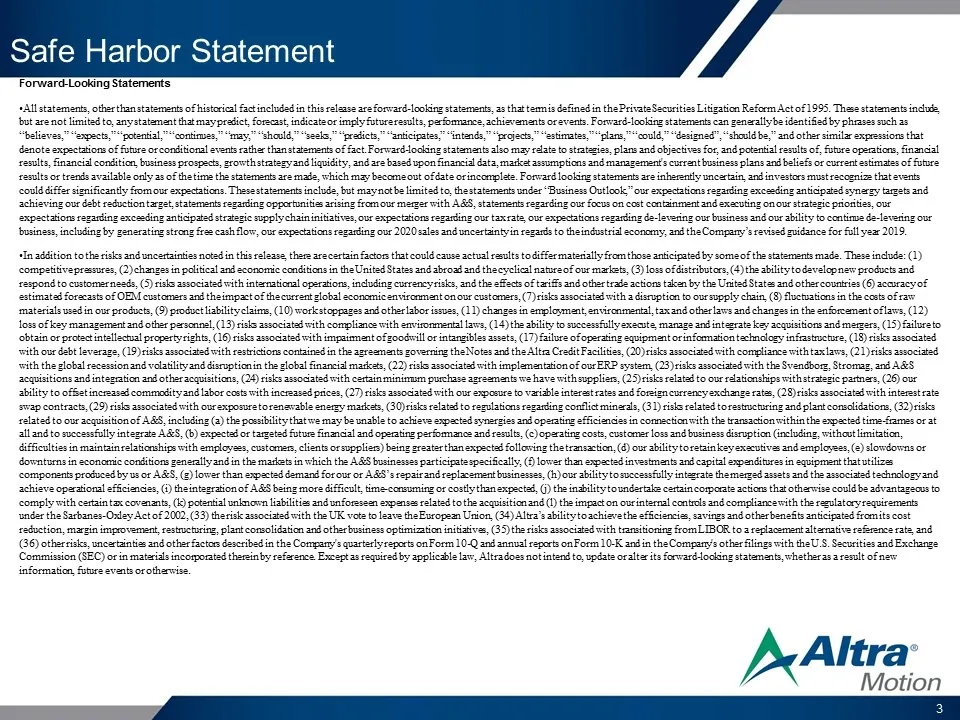
Safe Harbor Statement Forward-Looking Statements All statements, other than statements of historical fact included in this release are forward-looking statements, as that term is defined in the Private Securities Litigation Reform Act of 1995. These statements include, but are not limited to, any st

Slide 4: Agenda and Speakers
Agenda and Speakers Executive Overview Market Review Strategic Highlights Q3 Financial Review 2019 & 2020 Guidance Strategic Priorities Q&A Carl Christenson Chairman & Chief Executive Officer Christian Storch Vice President & Chief Financial Officer
Slide 5: Q3 Executive Overview
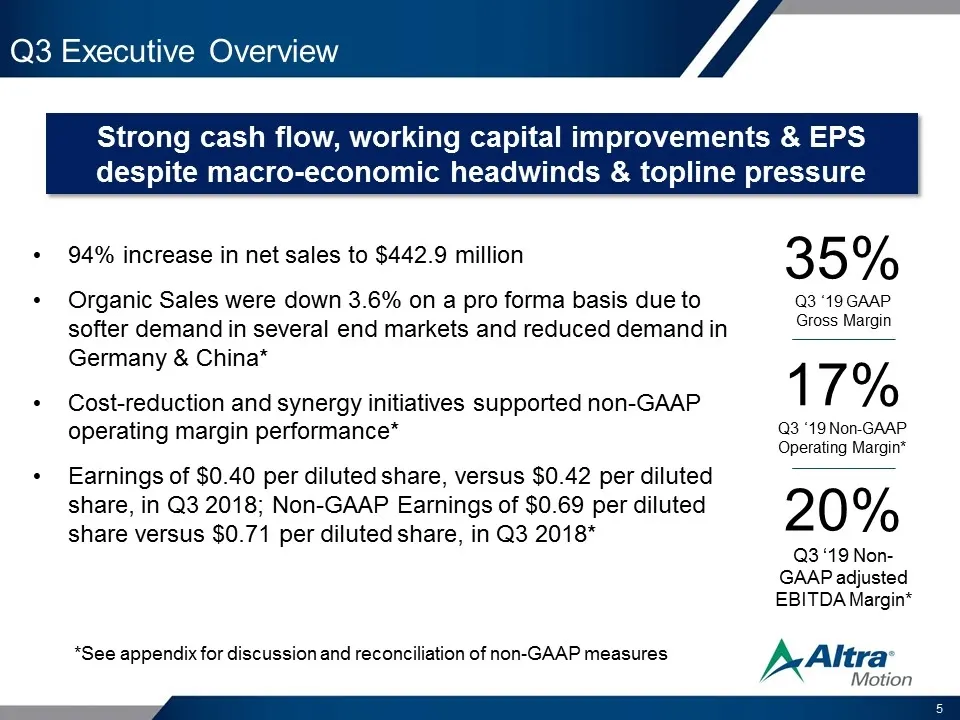
Q3 Executive Overview 94% increase in net sales to $442.9 million Organic Sales were down 3.6% on a pro forma basis due to softer demand in several end markets and reduced demand in Germany & China* Cost-reduction and synergy initiatives supported non-GAAP operating margin performance* Earnings of $
Slide 6: Q3 2019 Key End-Market Drivers
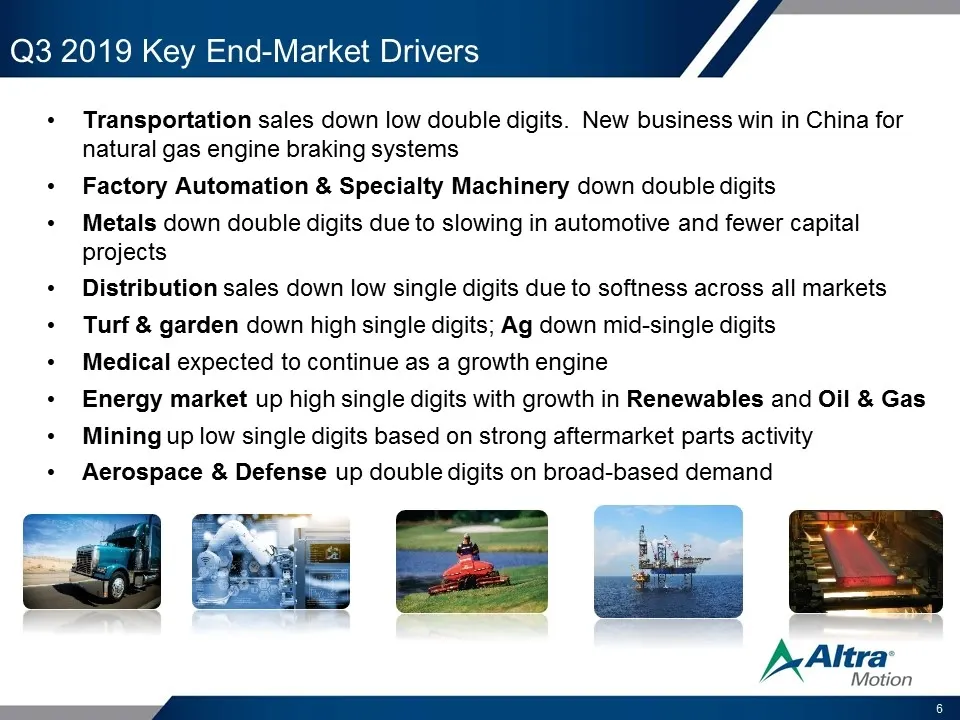
Q3 2019 Key End-Market Drivers Transportation sales down low double digits. New business win in China for natural gas engine braking systems Factory Automation & Specialty Machinery down double digits Metals down double digits due to slowing in automotive and fewer capital projects Distribution sale
Slide 7: Q3 2019 Strategic Highlights
Q3 2019 Strategic Highlights Focus on cash management yielded $71.5M Free Cash Flow in Q3* $143.5M Free Cash Flow year-to-date* Advanced goal of de-levering balance sheet $40M debt paid down in Q3; $110M debt paid since A&S merger Key strategic A&S integration activities on schedule Integrating ABS
Slide 8: Q3 2019 Financial Highlights
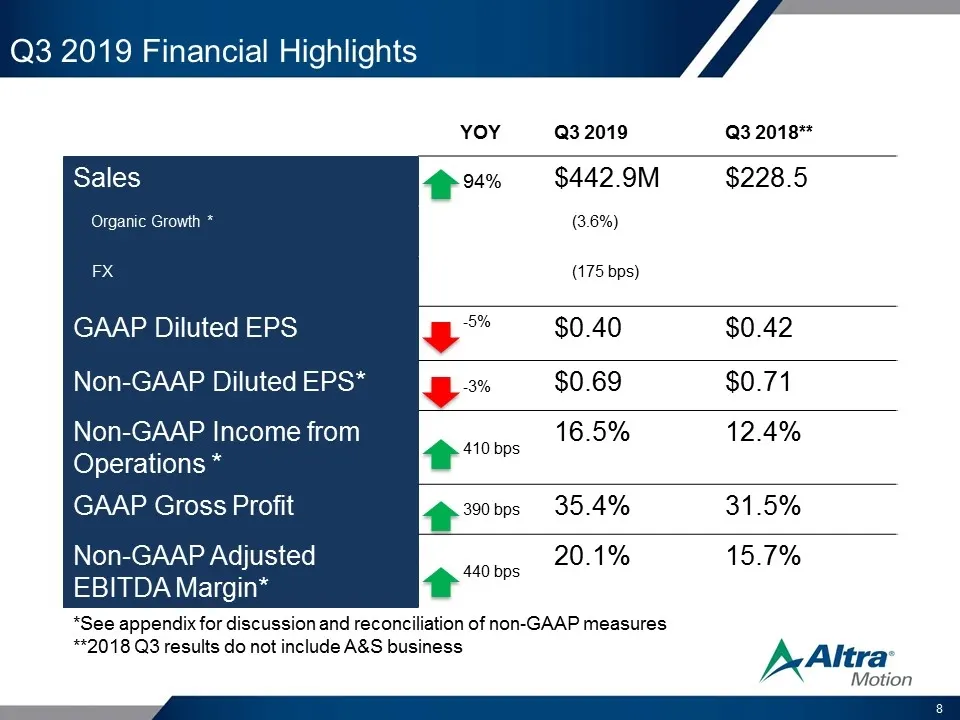
Q3 2019 Financial Highlights YOY Q3 2019 Q3 2018** Sales 94% $442.9M $228.5 Organic Growth * (3.6%) FX (175 bps) GAAP Diluted EPS -5% $0.40 $0.42 Non-GAAP Diluted EPS* -3% $0.69 $0.71 Non-GAAP Income from Operations * 410 bps 16.5% 12.4% GAAP Gross Profit 390 bps 35.4% 31.5% Non-GAAP Adjusted EBITDA
Slide 9: Balance Sheet Highlights
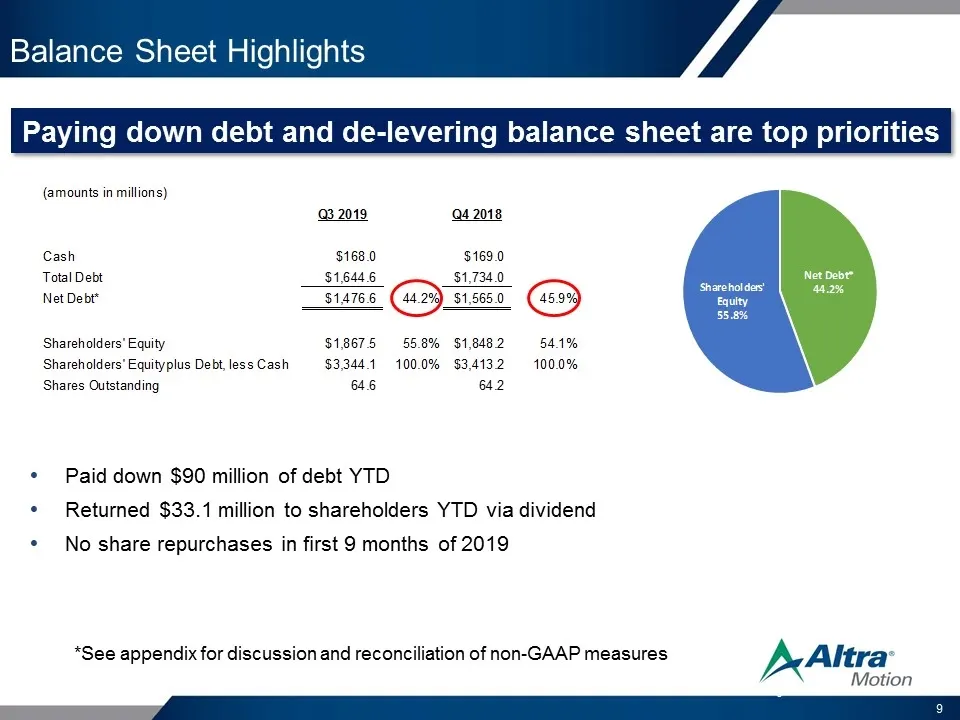
Balance Sheet Highlights Paid down $90 million of debt YTD Returned $33.1 million to shareholders YTD via dividend No share repurchases in first 9 months of 2019 Paying down debt and de-levering balance sheet are top priorities *See appendix for discussion and reconciliation of non-GAAP measures
Slide 10: Revising 2019 Guidance
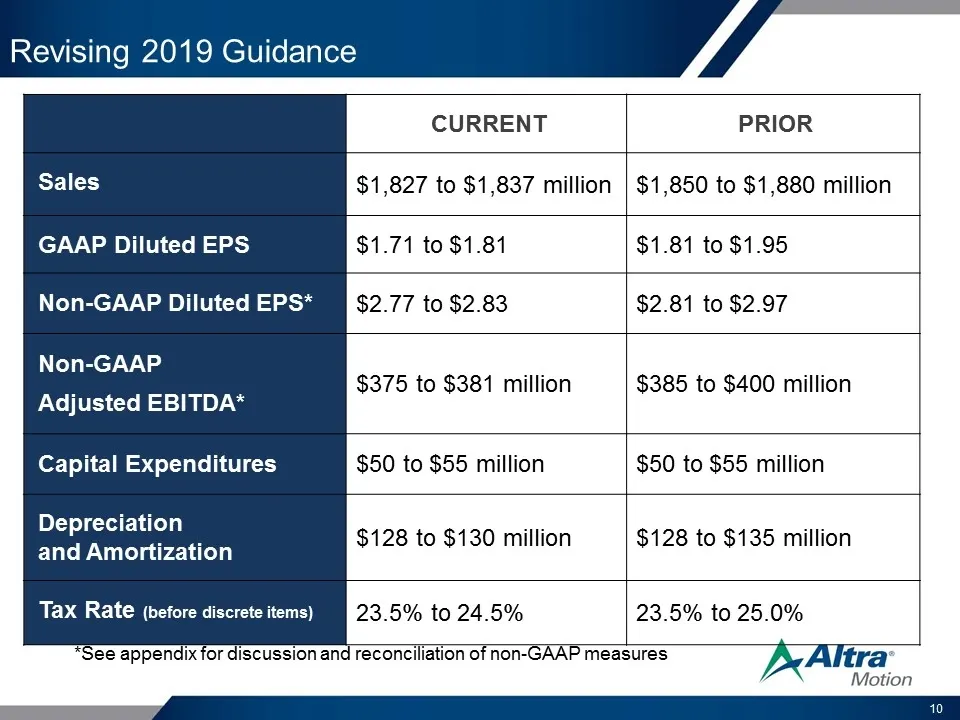
Revising 2019 Guidance CURRENT PRIOR Sales $1,827 to $1,837 million $1,850 to $1,880 million GAAP Diluted EPS $1.71 to $1.81 $1.81 to $1.95 Non-GAAP Diluted EPS* $2.77 to $2.83 $2.81 to $2.97 Non-GAAP Adjusted EBITDA* $375 to $381 million $385 to $400 million Capital Expenditures $50 to $55 million
Slide 11: Strategic Priorities to Drive Shareholder Value
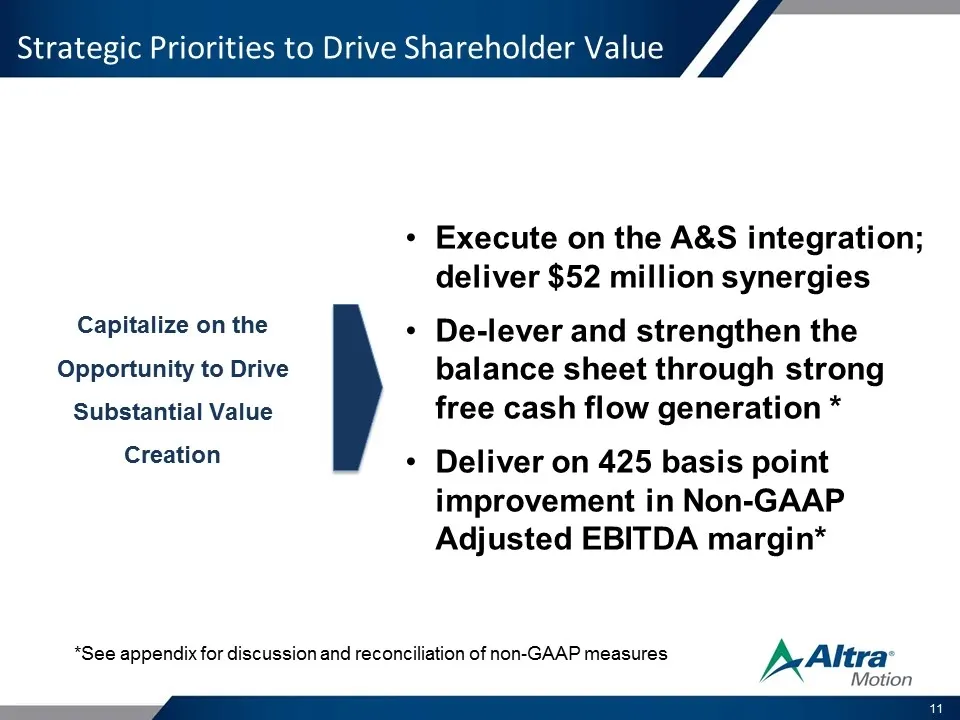
Strategic Priorities to Drive Shareholder Value Capitalize on the Opportunity to Drive Substantial Value Creation Execute on the A&S integration; deliver $52 million synergies De-lever and strengthen the balance sheet through strong free cash flow generation * Deliver on 425 basis point improvement
Slide 12: Discussion of Non-GAAP Measures
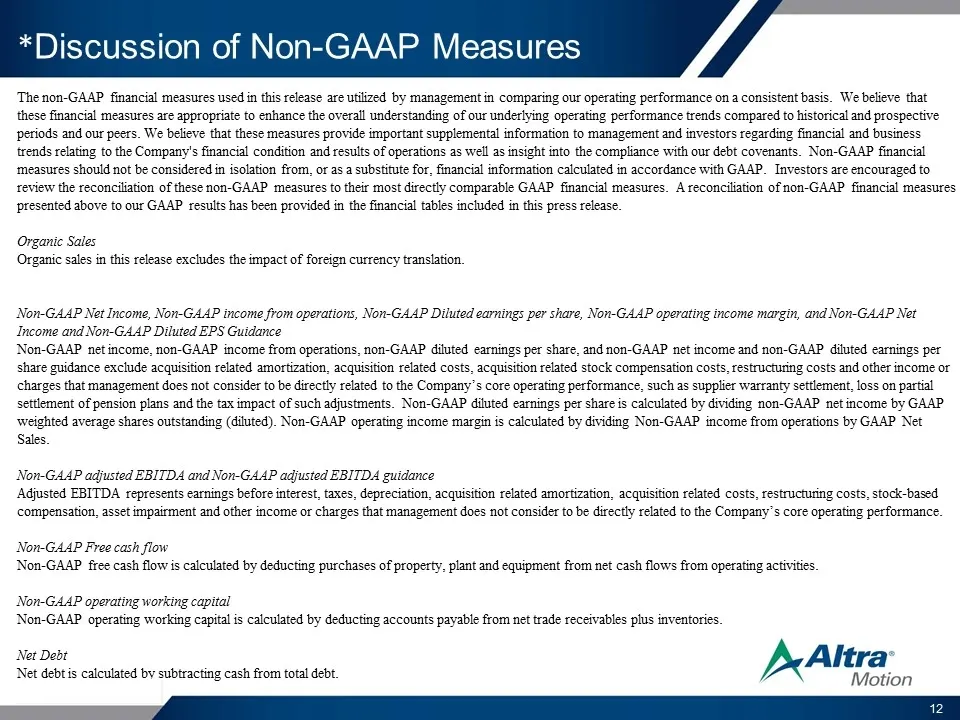
*Discussion of Non-GAAP Measures The non-GAAP financial measures used in this release are utilized by management in comparing our operating performance on a consistent basis. We believe that these financial measures are appropriate to enhance the overall understanding of our underlying operating per
Slide 13: Appendix Non-GAAP Measures
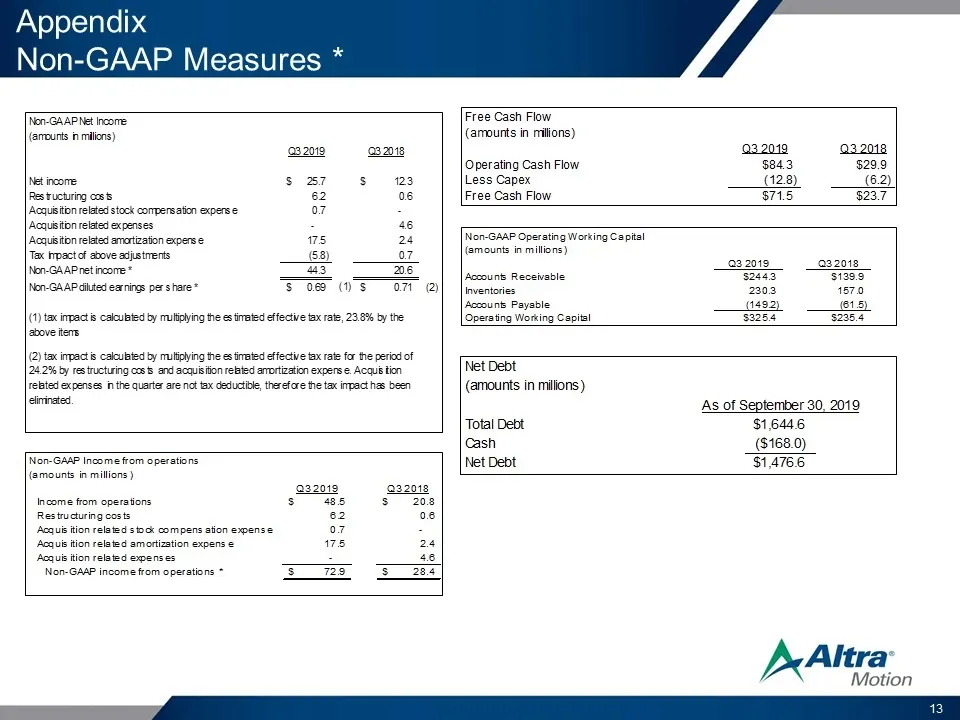
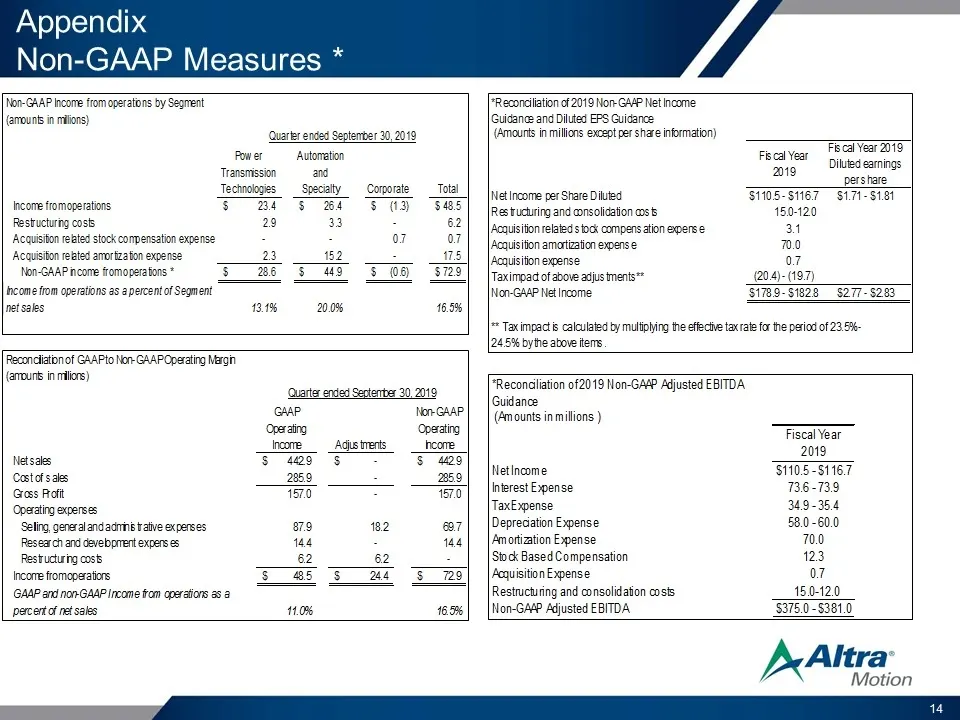
Appendix Non-GAAP Measures *
Slide 14: Appendix Non-GAAP Measures
Appendix Non-GAAP Measures *
Slide 15: EBITDA Reconciliation
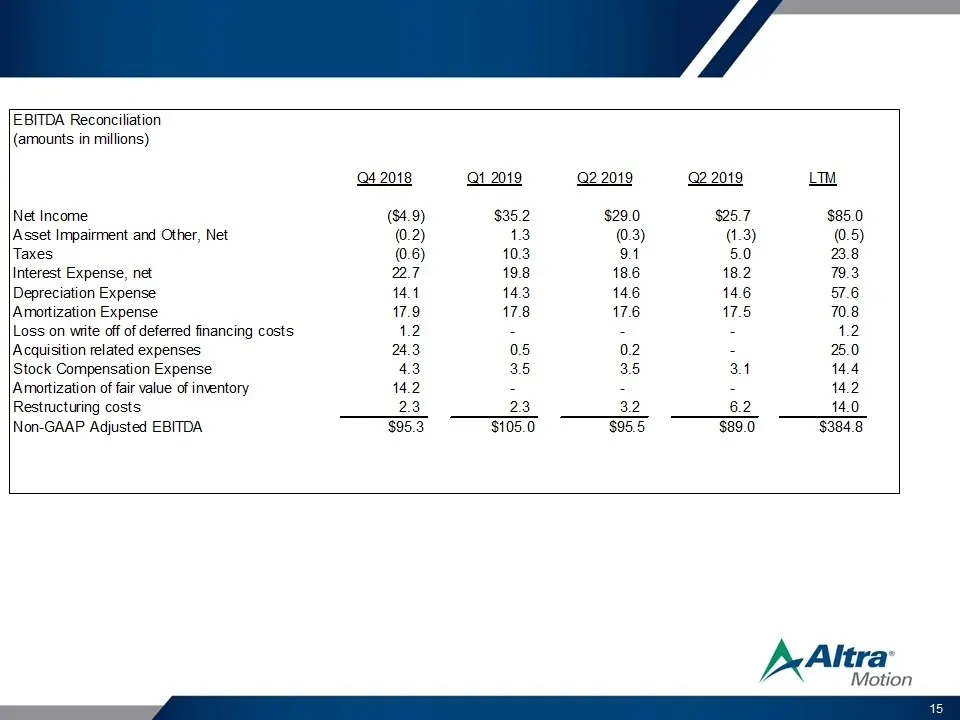
EBITDA Reconciliation (amounts in millions) 24 2018 12019 22 2019 22 2019 Liu Net Income ($4.9) $35.2 $29.0 $25.7 $85.0 Asset Impairment and Other, Net 13 (0.3) (1.3) (0.5) Taxes (0.6) 10.3 9.4 5.0 23.8 Interest Expense, net 22.7 19.8 18.6 18.2 79.3 Depreciation Expense 14.1 14.3 146 14.6 57.6 Amort
Source: SEC EDGAR · 8-K filed Oct 24, 2019
More decks from Altra Industrial Motion Corp
 Q2 2022 Earnings Presentation25 slides · Jul 28, 2022
 Q1 2022 Earnings Presentation25 slides · Apr 28, 2022
 Investor Day (March 2022)135 slides · Mar 11, 2022
 Q4 2021 Earnings Presentation17 slides · Feb 16, 2022
 Q3 2021 Earnings Presentation16 slides · Oct 22, 2021
 Q2 2021 Earnings Presentation16 slides · Jul 23, 2021