Cascade Bancorp — RBC Capital Markets Conference September 2007
39 slides from Cascade Bancorp's conference presentation, Sep 26, 2007
Slide 1: RBC Capital Markets Conference September 2007
NW Oregon Southern Oregon Idaho Central Oregon RBC Capital Markets Conference September 2007

Slide 2: Forward Looking Information
This presentation contains forward-looking statements, which are not historical facts and pertain to our future operating results. These statements include, but are not limited to, our plans, objectives, expectations and intentions and are not statements of historical fact. When used in this report,
Slide 3: CACB Profile
NASDAQ: CACB $2.3 Billion Assets 28.3 million Shares Outstanding $680 Million Market Capitalization Community Banking Regions: Central Oregon (Headquarters Bend, Oregon) Treasure Valley (Boise Idaho) Portland/Salem, Oregon Southwest Oregon (Medford) Financial Holding Co. for Bank of the Cascades Pub
Slide 4: Cascade Footprint
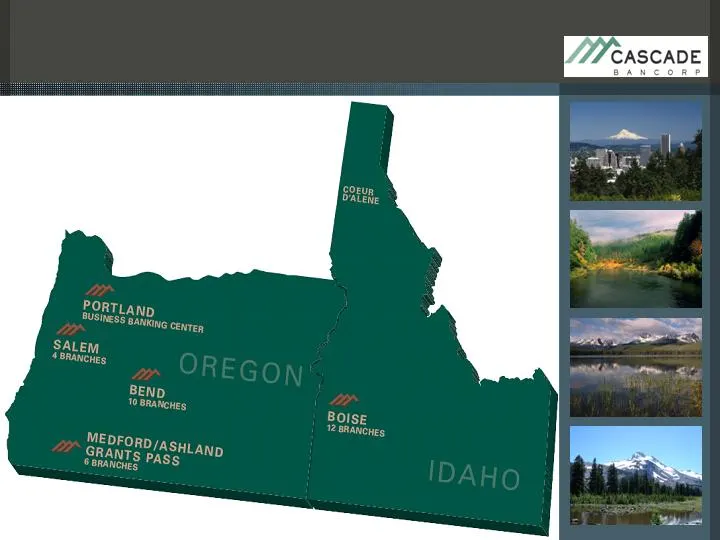
Cascade Footprint
Slide 5: Real Estate Exposure
Loan Portfolio Has Real Estate Concentration Reflective of Cascade Growth markets No Sub-Prime or Alt-A Mortgage Exposure Loan Portfolio Investment Portfolio Mortgage Originations Mortgage Servicing Portfolio: Less than .40% points delinquency Real Estate Exposure
Slide 6: Real Estate Update
Real Estate Market Loan Portfolio Profile Credit Risk Management Credit Quality Metrics Real Estate Update
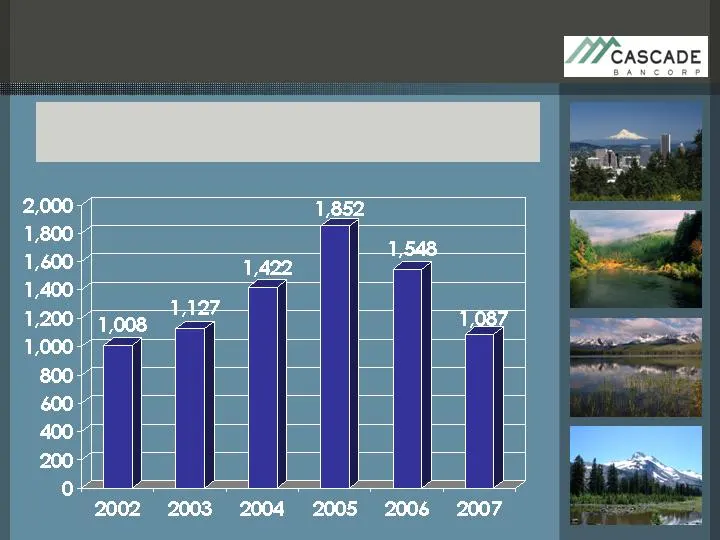
Slide 7: Real Estate Markets: Bend Home Sales
Real Estate Markets Bend Home Sales # of Home Sales Transactions (Jan through Aug): Bend, OR
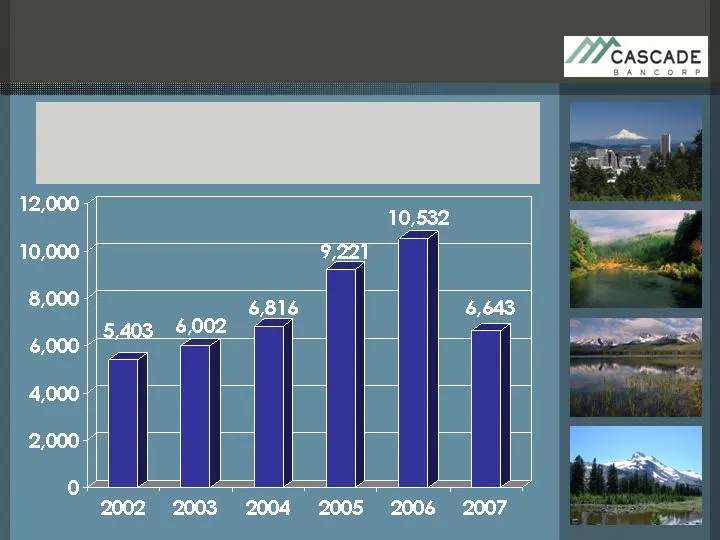
Slide 8: Real Estate Markets: Greater Boise Home Sales
Real Estate Markets Greater Boise Home Sales # of Home Sale Transactions Ada/Canyon Counties (January through July)
Slide 9: Real Estate Markets: Bend / Central Oregon
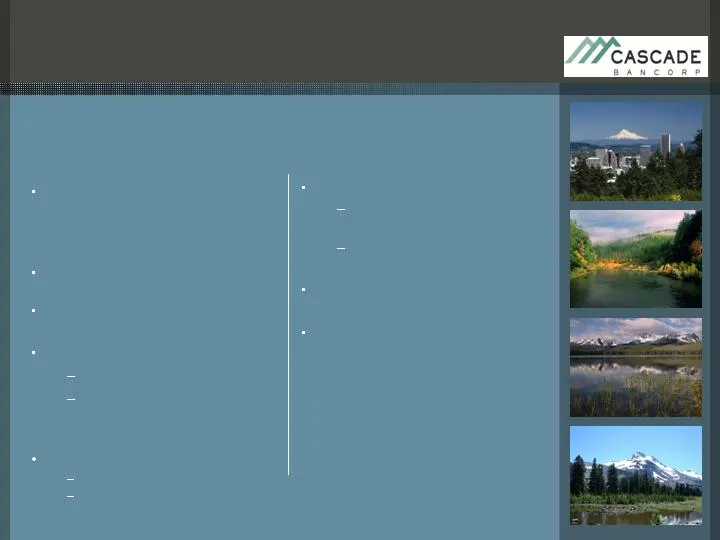
In-Migration Market 96 th Percentile Population Growth High Net Worth Strong Northwest Economy Median Price Below Metro Areas in West Real Estate Summary Mitigating Factors 1,600 Home Inventory = 12 Month Supply Sales @ 2002 Level Median Home Price $352,000 Extensive Land Use Laws Higher Land Prices
Slide 10: Real Estate Markets: Boise Market
In-Migration Market 97 th Percentile Population Growth Diverse Local Economy Strong Northwest Economy Pro-growth State Government 7,850 Home Inventory = 8 month supply Sales @ 2004 Level Median Home Price $236,000 Modest Land Use Restrictions Low land prices Low median home prices CACB Boise Portfol
Slide 11: Real Estate Markets: Western Oregon
Rapid Population Growth 93 rd Percentile Population Growth Strong Northwest Economy Diverse Local Economy Portland/Salem Trade & Technology Southern Oregon In-migration & Industry Portland Banking Focus C&I CRE S. Oregon First to Feel RE Slowing Median Home Price $250,000 Real Estate Summary Mitigat
Slide 12: Loan Portfolio Profile
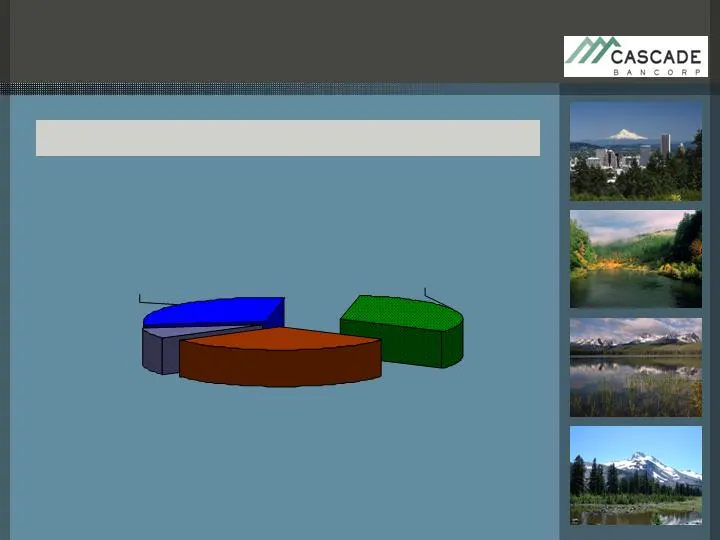
(1) Average high performing community banks in the west 26%. June 2007 Loan Portfolio Profile Reflects Cascade’s Growth Markets Const/Dev 32% (1) CRE 31% Other 7% Commercial 30%
Slide 13: Construction & Development Portfolio
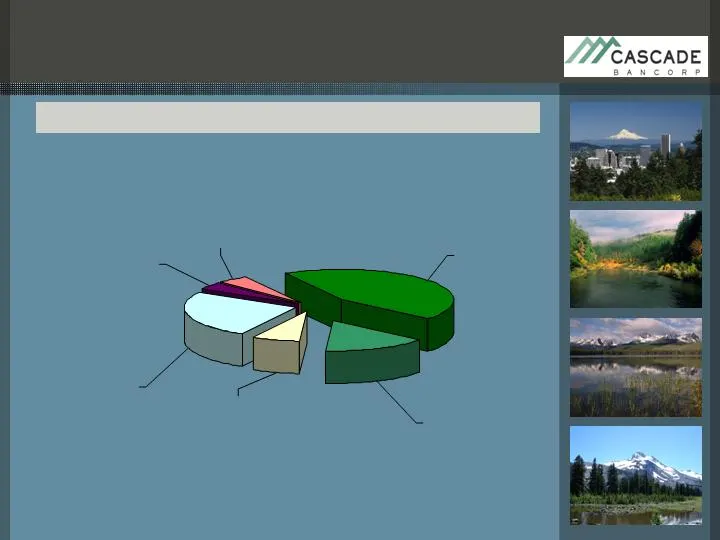
June 30 2007 Loan Portfolio Profile Construction & Development Portfolio 32% of Total Loans Residential Construction 4% 28 million Subdivision 44% 281 million Spec Residential Const/Land 15% 95 million Cml Lots 7% 44 million Cml Construction 25% 160 million Residential Lots 4% 24 million
Slide 14: Credit Risk Management: Disciplined Origination
Disciplined Origination: Discounted Cash Flow Underwriting A Recourse Lender Personal Guarantees Secondary Source of Repayment Debt Service not wholly dependent on interest reserve Not a Collateral Lender Credit Risk Management Construction & Development Portfolio
Slide 15: Credit Risk Management: Active Portfolio Management
Ongoing & Active Portfolio Management : Monthly Inspections Construction Progress Draw Tracking Monitor Absorption and Pricing Re-calculate DCF Early Warning / Identification Utilization of Interest Reserve Establish Obligor Plan of Action Early Access to Secondary Sources Credit Risk Management Con
Slide 16: Credit Quality Metrics: Reserve for Credit Losses
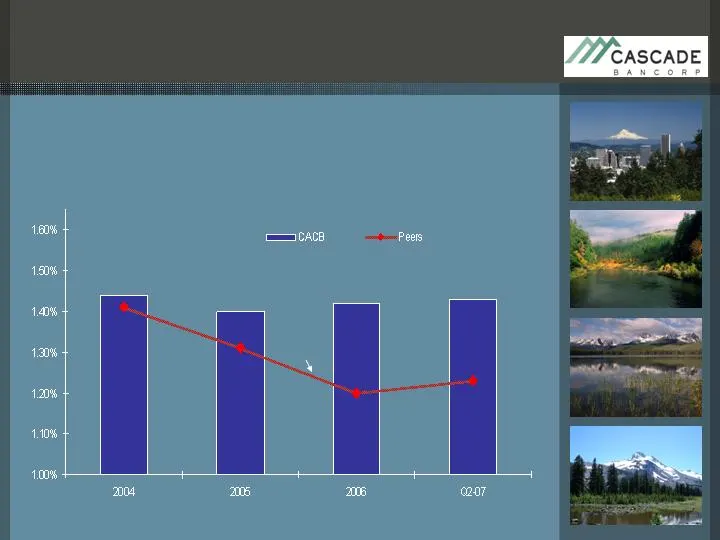
Peer: 15 High performing community banks in the west. Credit Quality Metrics Reserve for Credit Losses % Loans CACB PEER
Slide 17: Credit Quality Metrics: NPA / Assets
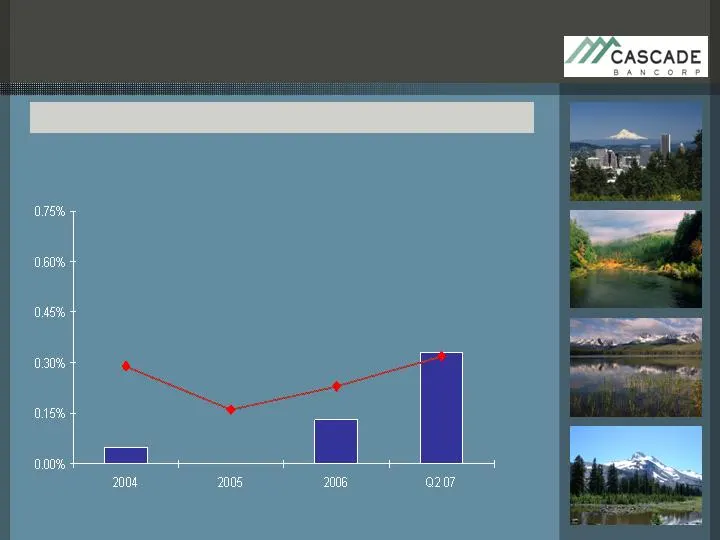
Peer: 15 High performing community banks in the west. CACB PEER NPA / Assets CACB Target < 0.50% Credit Quality Metrics
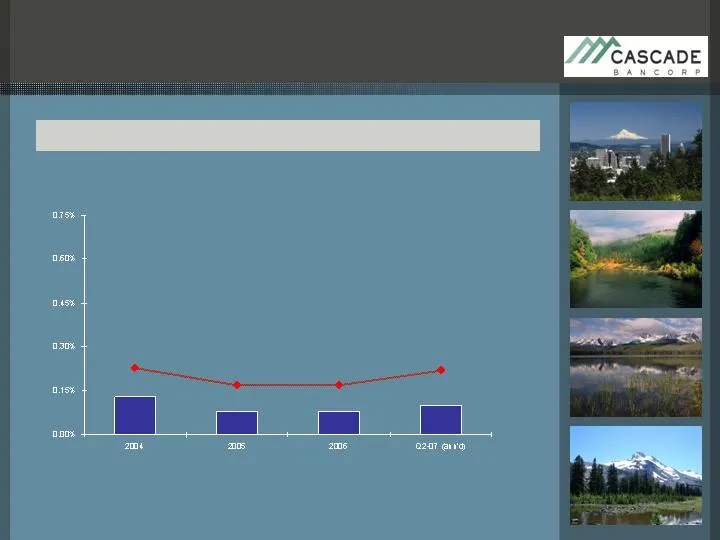
Slide 18: Credit Quality Metrics: Charge-Offs to Loans
Peer: 15 High performing community banks in the west. Credit Quality Metrics Charge-Off to Loans PEER CACB
Slide 19: RE Exposure Summary
No Exposure to Sub-Prime/Alt-A Related Issues Mitigating Credit Quality Risk Strong NW Economy Cash Flow Based Underwriting Credit Origination Discipline Active Monitoring Strong Credit Metrics Positioned to Maximize Returns as Emerge from Down-cycle RE Exposure Summary

Slide 20: Cascade Bancorp: A High Performance Franchise
Cascade Bancorp: A High Performance Franchise
Slide 21: CACB: Core Holding
Sustained High Performance Leading Bank in Growth Markets Accretive Potential in New Markets CACB: Core Holding
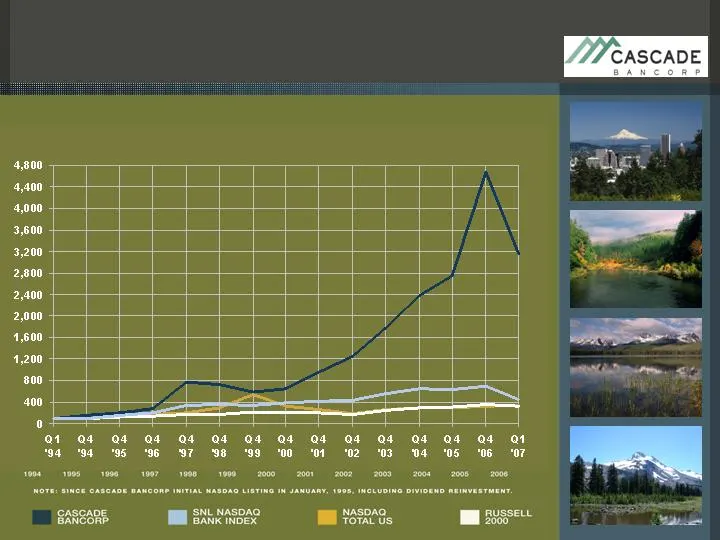
Slide 22: Cumulative Total Return
Through Quarter Ended March 31, 2007 Cumulative Total Return Total Return on $100

Slide 23: Sustained High Performance
23.0% 26.9% Earnings Per Share Growth 33.2% 38.4% Loan Growth 31.6% 32.6% Deposit Growth 17.8% 19.3% Cash Dividend Growth 16.8% 17.8% Stock Price Appreciation 5 year 3 year Sustained Growth Shareholder Return COMPOUND GROWTH As of 6/30/07 Sustained High Performance

Slide 24: Key Strategies
1. Top Tier Markets 2. Top Tier Bankers 3. Top Tier Deposit Franchise Key Strategies
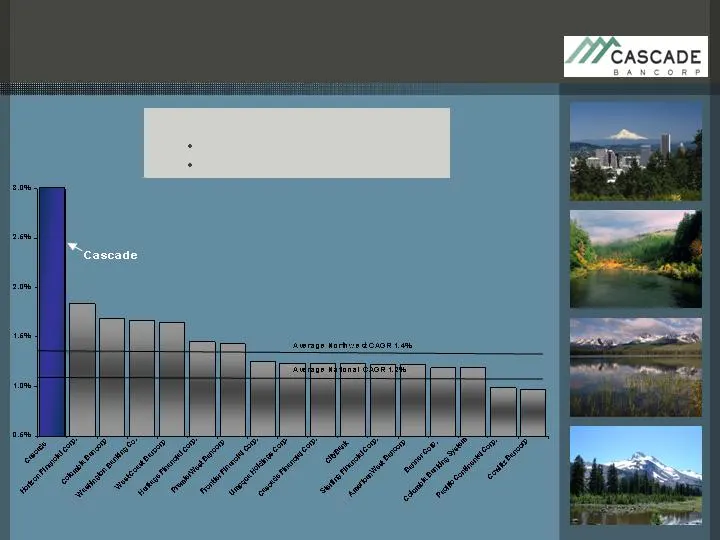
Slide 25: Top Tier Markets: Growth Market Footprint
Comparative Growth Footprint Northwest Peer Banks (2) (Deposit - Weighted Population CAGR 2005-2010) (1) All public banks nationally excluding M&A targets with assets in the range $2B - $10B, franchise footprint population growth by MSA weighted by franchise deposits; Source SNL Financial LC / ESRI
Slide 26: Top Tier Markets
Central Oregon (11 branches) 96 th percentile population growth 156,000 Population 2007 Boise/Treasure Valley, Idaho (12 branches) 97 th percentile population growth 551,000 Population 2007 Northwest Oregon (5 branches) 93 rd percentile population growth 2 Million Population 2007 (Portland Metro Are
Slide 27: Top Tier Bankers
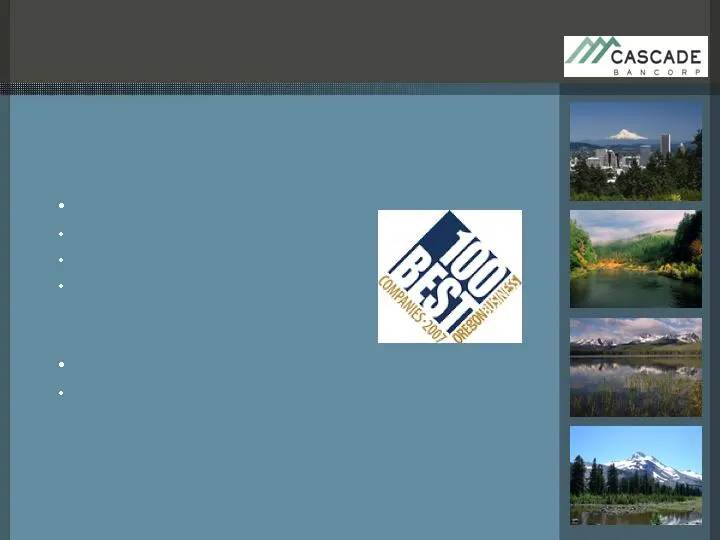
Top Tier Bankers Customer & Market Knowledge Decision Making Authority Commitment to Value Proposition Pay for Performance Employer of Choice Attracting & Retaining Top Tier Bankers Repeatedly Named One of Best Places to Work in Oregon Top Tier Bankers
Slide 28: Top Tier Deposit Franchise
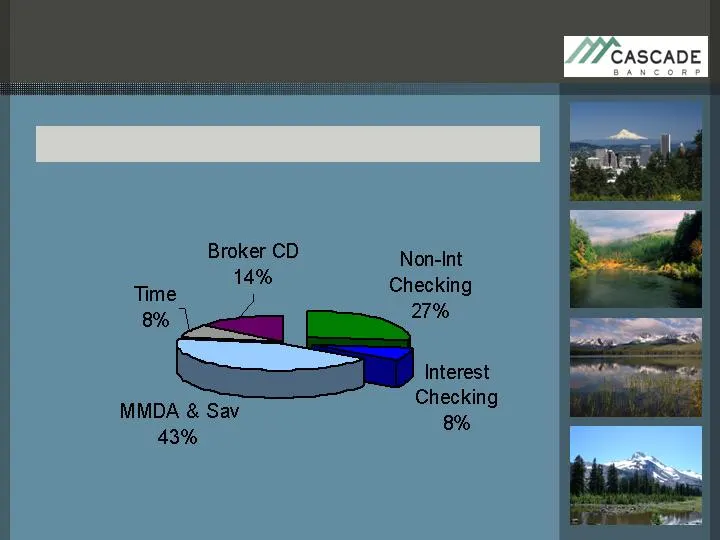
At June 30, 2007 High Proportion Demand Deposits Top Tier Deposit Franchise
Slide 29: Top Tier Deposit Franchise: Relationship Deposits
DDA Focused Chief Deposit Officer Appointed 2006 Organized Similar to Credit Function Long-Term Investment in Deposit Bankers PBO Team Increase from 3 to 25 in 4 Years 1 PBO Team Member per 3 LO’s Direct Accountability for 50% of Deposits Top Tier Deposit Franchise Long-Term Commitment to Relationsh

Slide 30: Cascade Bancorp: A High Performance Franchise
Cascade Bancorp: A High Performance Franchise
Slide 31: Loan & Deposit Growth
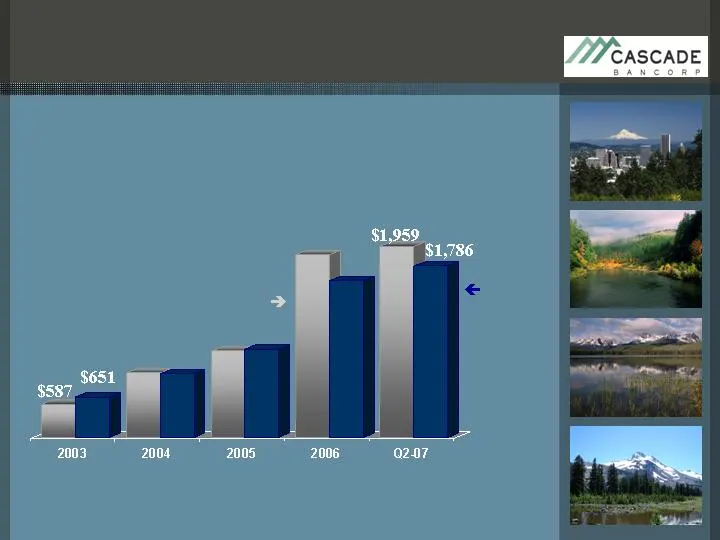
Compound Growth Loans: 34.9% Deposits: 31.3% Loan & Deposit Growth Deposits Loans
Slide 32: Net-Interest Margin
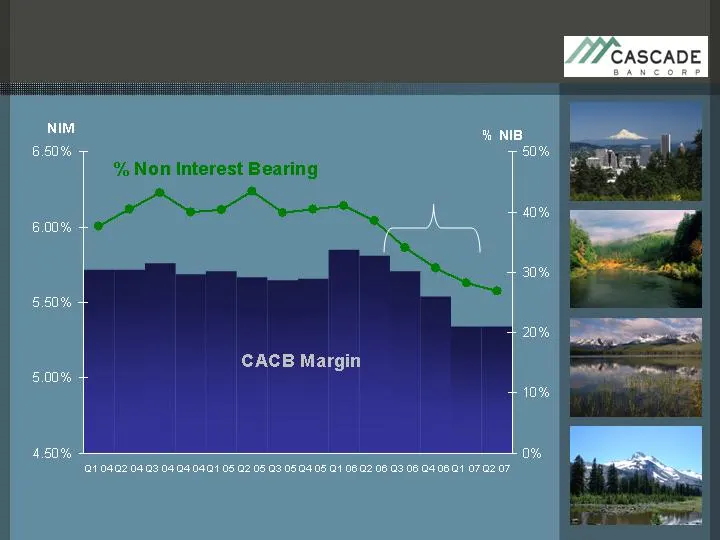
Q2 06 = First Quarter with acquisition of F&M Slowing RE Related Deposits Net-Interest Margin
Slide 33: Financial Performance: Consistently Outperforming Peers
1.23% Reserve for Credit Losses 58.99% Efficiency 4.99% NIM 12.8% ROE 1.27% ROA PEER* Peer: High performing community banks in the west. 1.43% 47.38% 5.34% 14.1% 1.76% CACB Financial Performance Consistently Outperforming Peers Q2 2007
Slide 34: Financial Performance: Expense Management
* (NIE-Non II) / Net II Peer: High performing community banks in the west. 49.68% OVERHEAD RATIO * 3.01% NIE / ASSETS 58.99% EFFICIENCY RATIO PEER Financial Performance Expense Management Q2 2007 35.74% 2.71% 47.38% CACB
Slide 35: Q2 2007 Linked Quarter Comparison
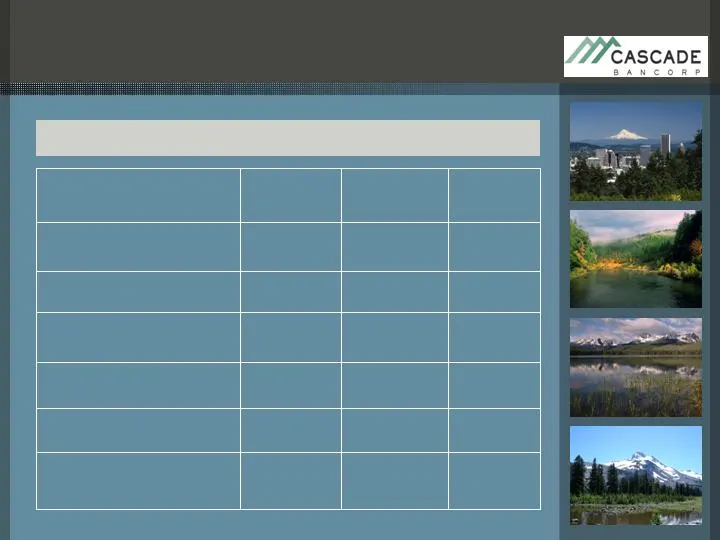
2.0% 1,464 1,493 Average Relationship Deposits 0.0% 5.34% 5.34% Net Interest Margin 7.2% $0.33 $0.36 Earnings Per Share 6.9% $ 9.5 $10.2 Net Income -1.4% 1,565 1,543 Relationship Deposits 1.4% $1,932 $1,959 Loans % Change Mar 2007 Jun 2007 $ Millions Second Quarter 2007 Q2 2007 – Linked Quarter Comp
Slide 36: Double Digit EPS Growth
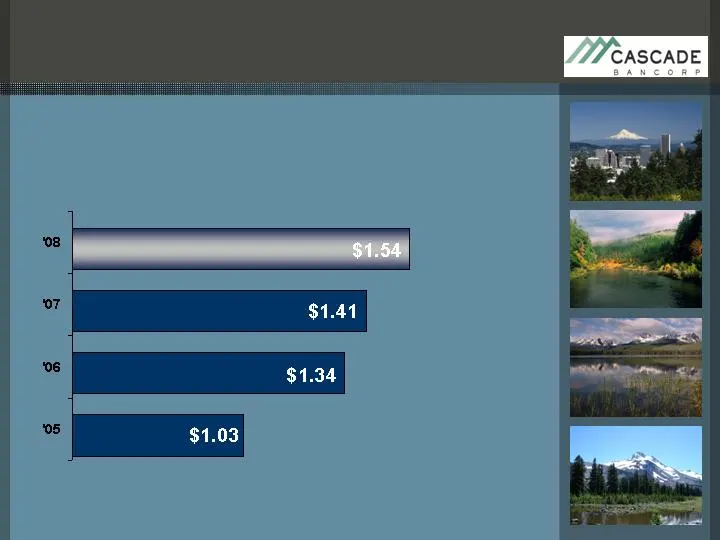
* 2006 includes non-recurring state tax credits $.02 EPS 5.2% YOY 3 Year CAGR EPS 24.8% 5 Year EPS CAGR 24.5% 9.2% YOY 30.1% YOY * 39.2% YOY Double Digit EPS Growth Consensus Estimate Consensus Estimate
Slide 37: Acquirer of Choice
Acquirer Of Choice: Enhance Top Tier Footprint Accretive to EPS Community Bank Niche Market Share Opportunity Market Diversification Acquirer of Choice Top Bank Footprint for the Future
Slide 38: Priorities: Building for a Strong Future
Above Peer Growth Rate: Expand Share in Fast Growth Markets Targeted Customer Prospecting Leverage Top Tier Bankers Focus on Business Relationship Deposits Disciplined Pricing Diversify with C&I + CRE Priorities Building for a Strong Future

Slide 39: Patricia L. Moss, Chief Executive Officer
Nasdaq: CACB Patricia L. Moss Chief Executive Officer NW Oregon Southern Oregon Idaho Central Oregon
Source: SEC EDGAR · 8-K filed Sep 26, 2007
More decks from Cascade Bancorp
 Shareholder Meeting (May 2017)19 slides · May 24, 2017
 Merger or Acquisition (November 2016)14 slides · Nov 17, 2016
 Merger or Acquisition (November 2016)14 slides · Nov 17, 2016
 D.A. Davidson – Denver (May 10-11, 2016)24 slides · May 9, 2016
 Investor Presentation (December 2015)20 slides · Dec 7, 2015
 Merger or Acquisition (October 2015)6 slides · Oct 29, 2015