Chaparral Energy — Wells Fargo Energy Conference 2011
38 slides from Chaparral Energy's conference presentation, Dec 7, 2011
Slide 1: Wells Fargo Energy Conference December 7, 2011
Wells Fargo Energy Conference December 7, 2011
Slide 2: Chaparral Overview
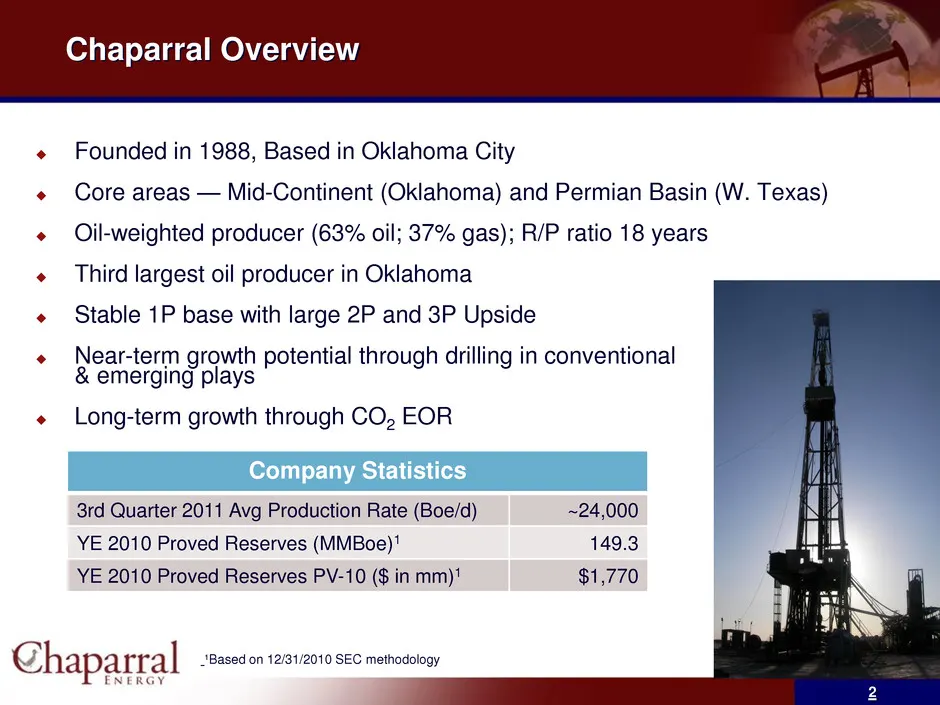
Chaparral Overview Founded in 1988, Based in Oklahoma City Core areas — Mid-Continent (Oklahoma) and Permian Basin (W. Texas) Oil-weighted producer (63% oil; 37% gas); R/P ratio 18 years Third largest oil producer in Oklahoma Stable 1P base with large 2P and 3P Upside Near-term growth po
Slide 3: Operating Areas
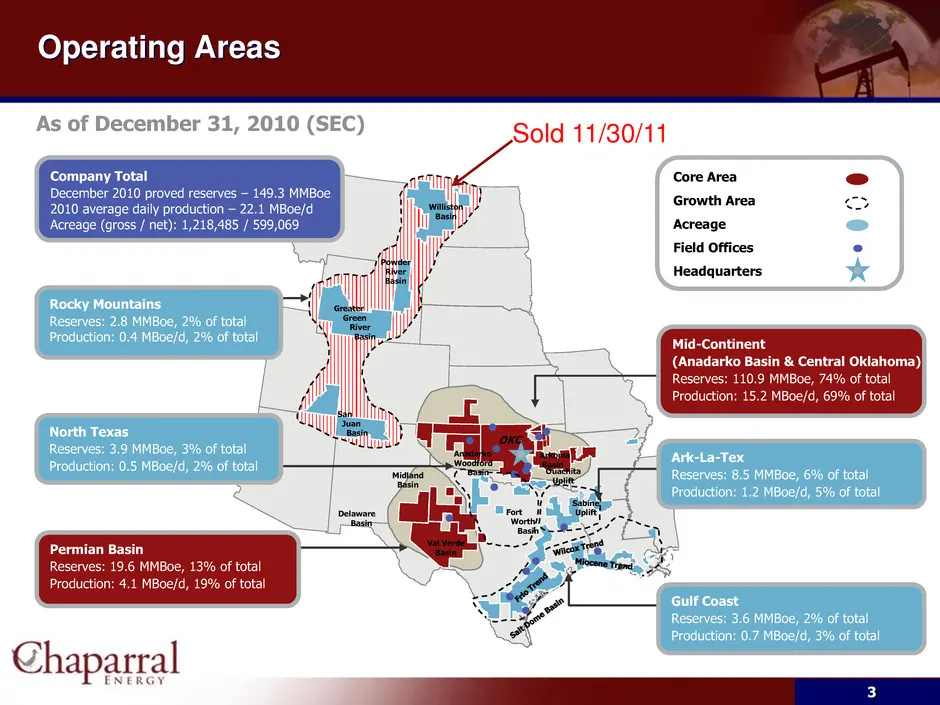
3 Operating Areas As of December 31, 2010 (SEC) Core Area Growth Area Acreage Field Offices Headquarters North Texas Reserves: 3.9 MMBoe, 3% of total Production: 0.5 MBoe/d, 2% of total Permian Basin Reserves: 19.6 MMBoe, 13% of total Production: 4.1 MBoe/d, 19% of total Rocky Mountains Reserves: 2.
Slide 4: Strong Record of Reserve and Production Growth
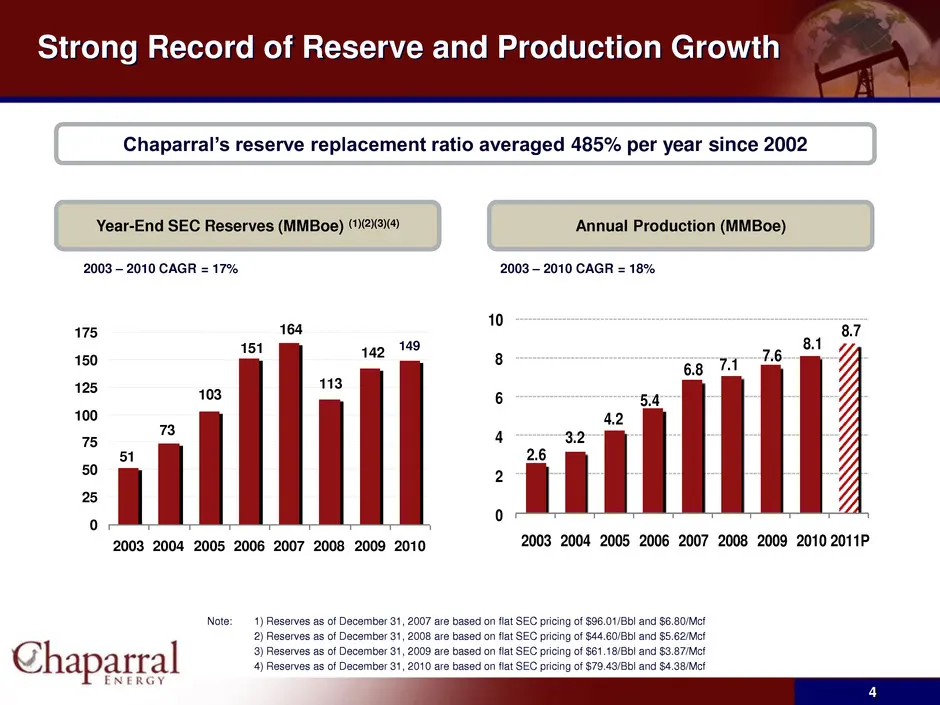
Strong Record of Reserve and Production Growth Year-End SEC Reserves (MMBoe) (1)(2)(3)(4) 2003 – 2010 CAGR = 17% Annual Production (MMBoe) 2003 – 2010 CAGR = 18% 142 113 164 151 103 73 51 0 25 50 75 100 125 150 175 2003 2004 2005 2006 2007 2008 2009 2010 149 Note: 1) Reserves as of December 31, 2007
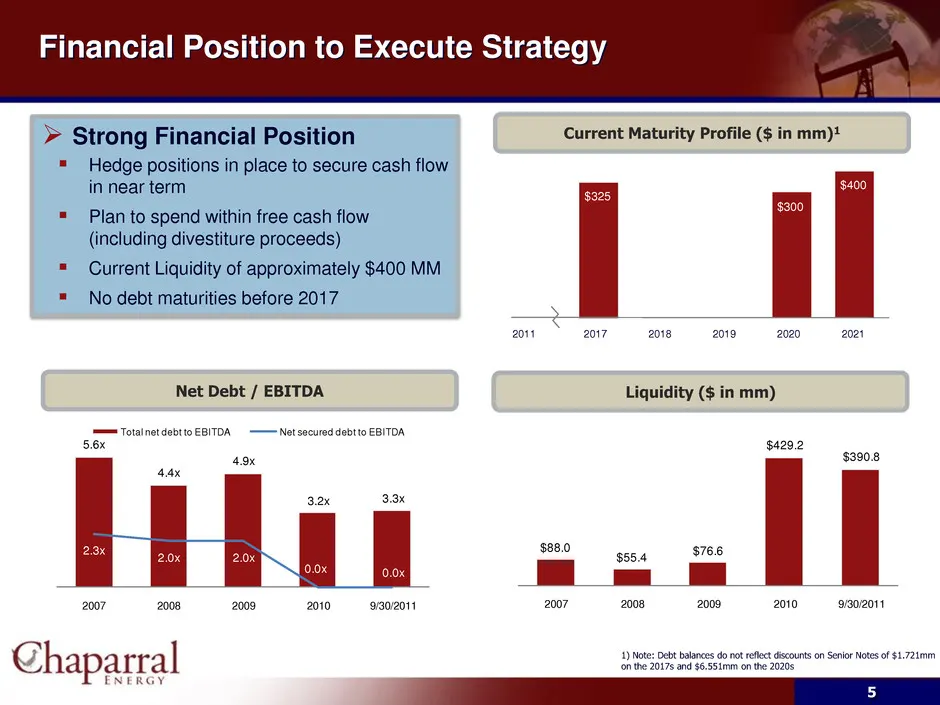
Slide 5: Financial Position to Execute Strategy
Net Debt / EBITDA Liquidity ($ in mm) 5.6x 4.4x 4.9x 3.2x 3.3x 2.3x 2.0x 2.0x 0.0x 0.0x 2007 2008 2009 2010 9/30/2011 Total net debt to EBITDA Net secured debt to EBITDA $88.0 $55.4 $76.6 $429.2 $390.8 2007 2008 2009 2010 9/30/2011 Financial Position to Execute Strategy 5 1) Note: Debt balances do n
Slide 6: Resource Potential
Resource Potential Chaparra
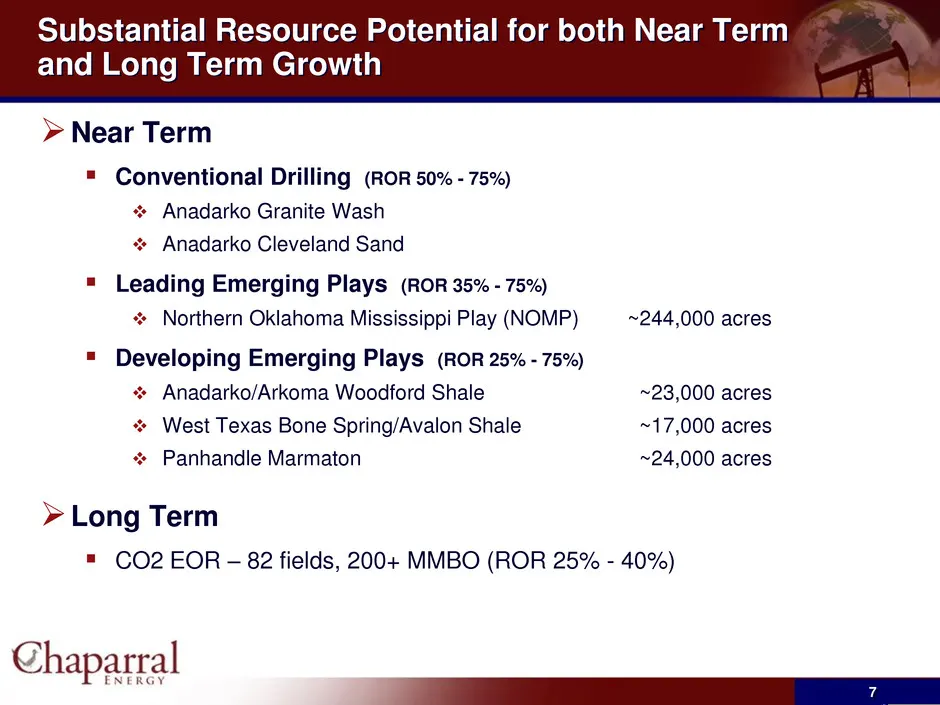
Slide 7: Substantial Resource Potential for both Near Term and Long Term Growth
Substantial Resource Potential for both Near Term and Long Term Growth 7 Near Term Conventional Drilling (ROR 50% - 75%) Anadarko Granite Wash Anadarko Cleveland Sand Leading Emerging Plays (ROR 35% - 75%) Northern Oklahoma Mississippi Play (NOMP) ~244,000 acres Developing Emerging Play
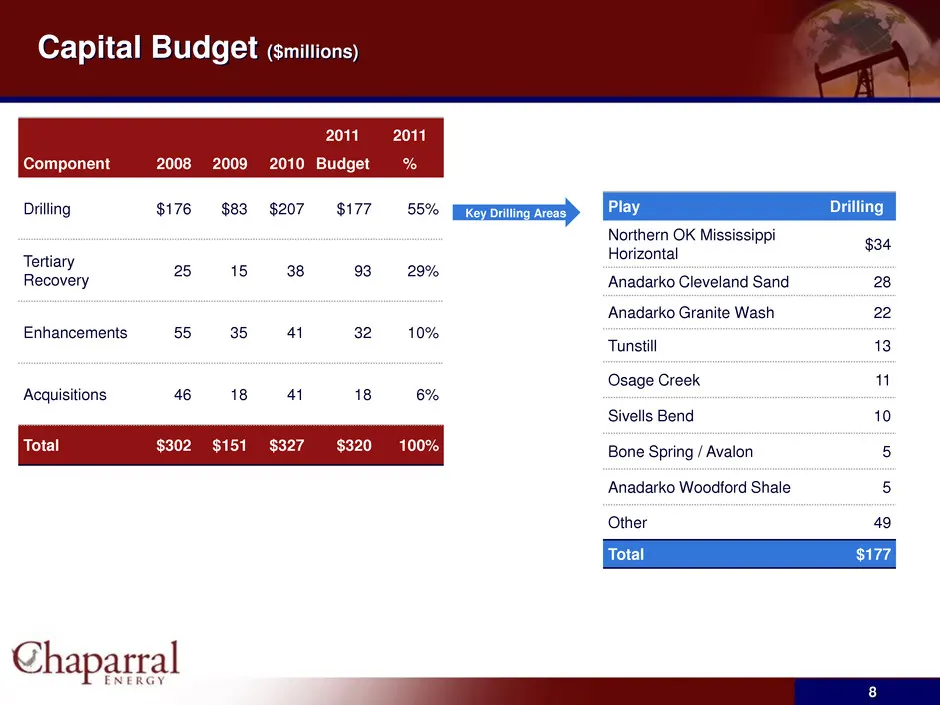
Slide 8: Capital Budget
Capital Budget ($millions) Component 2008 2009 2010 2011 Budget 2011 % Drilling $176 $83 $207 $177 55% Tertiary Recovery 25 15 38 93 29% Enhancements 55 35 41 32 10% Acquisitions 46 18 41 18 6% Total $302 $151 $327 $320 100% 85% 7% Play Drilling Northern OK Mississippi Horizontal $34 Anadarko Clevel
Slide 9: Well Positioned for Near-Term and Long Term Growth
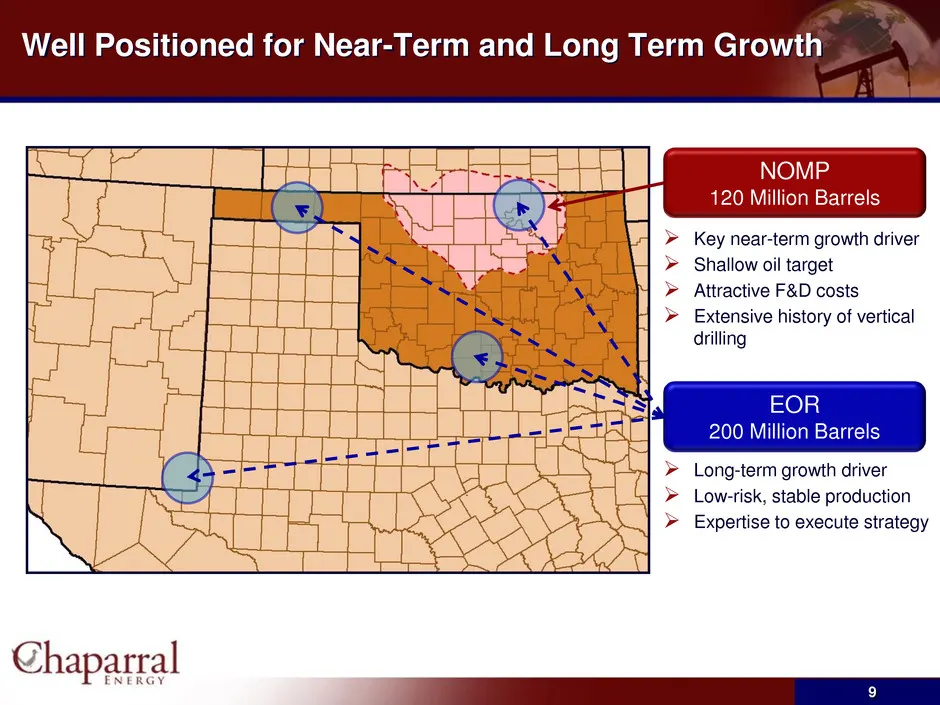
9 Well Positioned for Near-Term and Long Term Growth NOMP 120 Million Barrels EOR 200 Million Barrels Key near-term growth driver Shallow oil target Attractive F&D costs Extensive history of vertical drilling Long-term growth driver Low-risk, stable production Expertise to execute stra
Slide 10: NOMP: A Key Near-Term Focus Area
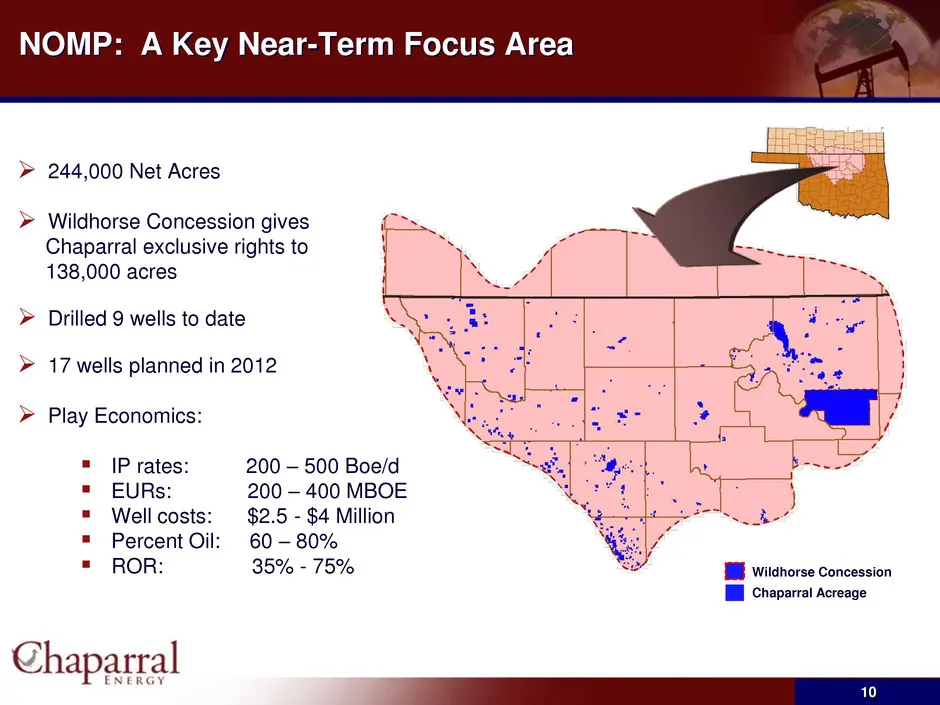
10 NOMP: A Key Near-Term Focus Area 244,000 Net Acres Wildhorse Concession gives Chaparral exclusive rights to 138,000 acres Drilled 9 wells to date 17 wells planned in 2012 Play Economics: IP rates: 200 – 500 Boe/d EURs: 200 – 400 MBOE Well costs: $2.5 - $4 Million Percent Oil: 60
Slide 11: Northern Oklahoma Mississippi Play (NOMP)
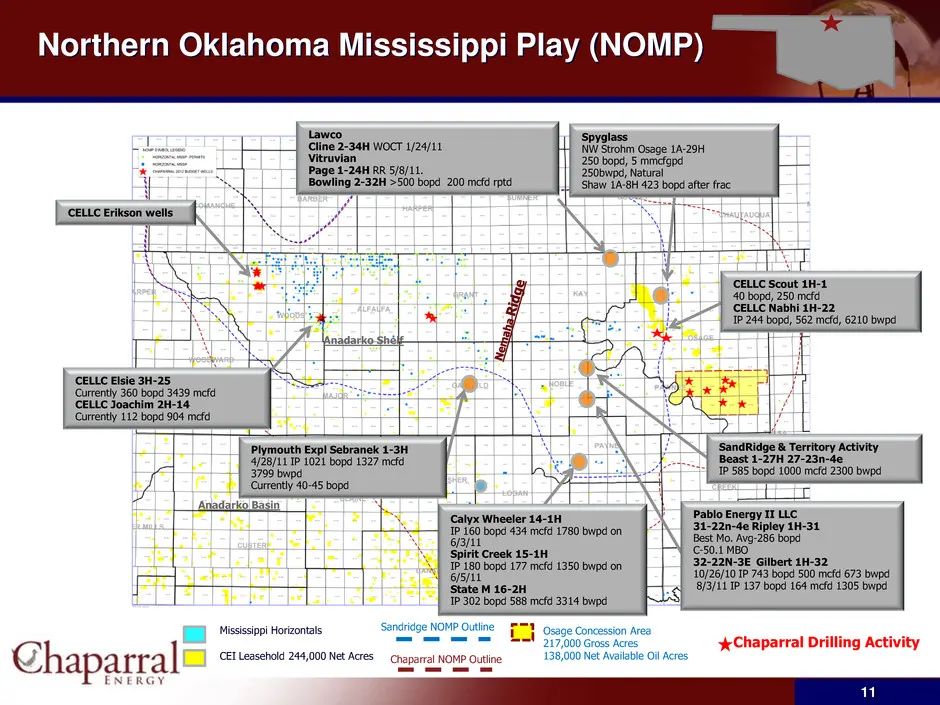
Northern Oklahoma Mississippi Play (NOMP) 11 Mississippi Horizontals CEI Leasehold 244,000 Net Acres Anadarko Basin Anadarko Shelf Chaparral NOMP Outline Sandridge NOMP Outline Osage Concession Area 217,000 Gross Acres 138,000 Net Available Oil Acres Plymouth Expl Sebranek 1-3H 4/28/11 IP 1021 bopd
Slide 12: Northern Oklahoma Mississippi Type Curve Comparison
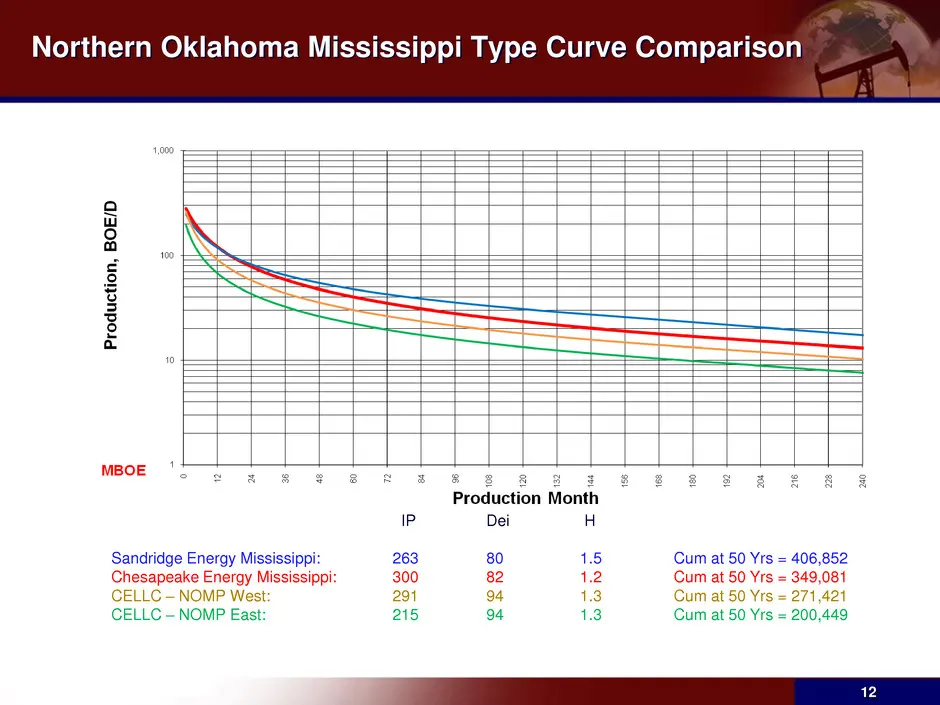
Northern Oklahoma Mississippi Type Curve Comparison IP Dei H Sandridge Energy Mississippi: 263 80 1.5 Cum at 50 Yrs = 406,852 Chesapeake Energy Mississippi: 300 82 1.2 Cum at 50 Yrs = 349,081 CELLC – NOMP West: 291 94 1.3 Cum at 50 Yrs = 271,421 CELLC – NOMP East: 215 94 1.3 Cum at 50 Yrs = 200,449
Slide 13: Chaparral: A Growing Mid-Continent CO2 EOR Company
13 Chaparral: A Growing Mid-Continent CO2 EOR Company
Slide 14: Advantages of CO2 EOR
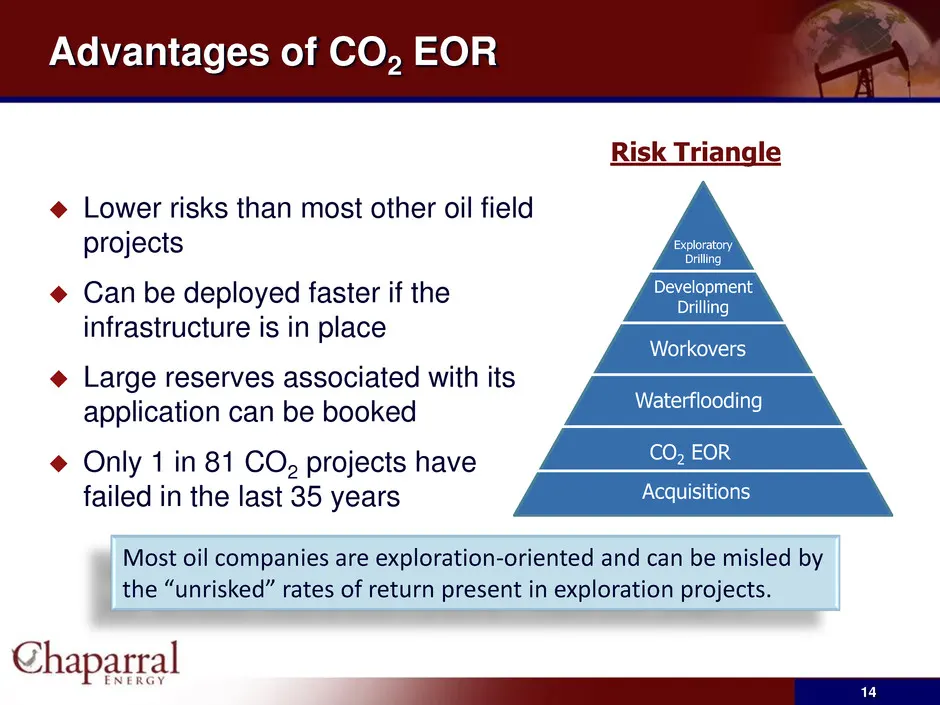
Advantages of CO2 EOR Lower risks than most other oil field projects Can be deployed faster if the infrastructure is in place Large reserves associated with its application can be booked Only 1 in 81 CO2 projects have failed in the last 35 years Most oil companies are exploration-oriented an
Slide 15: Long Life EOR Assets in Four Key Growth Areas
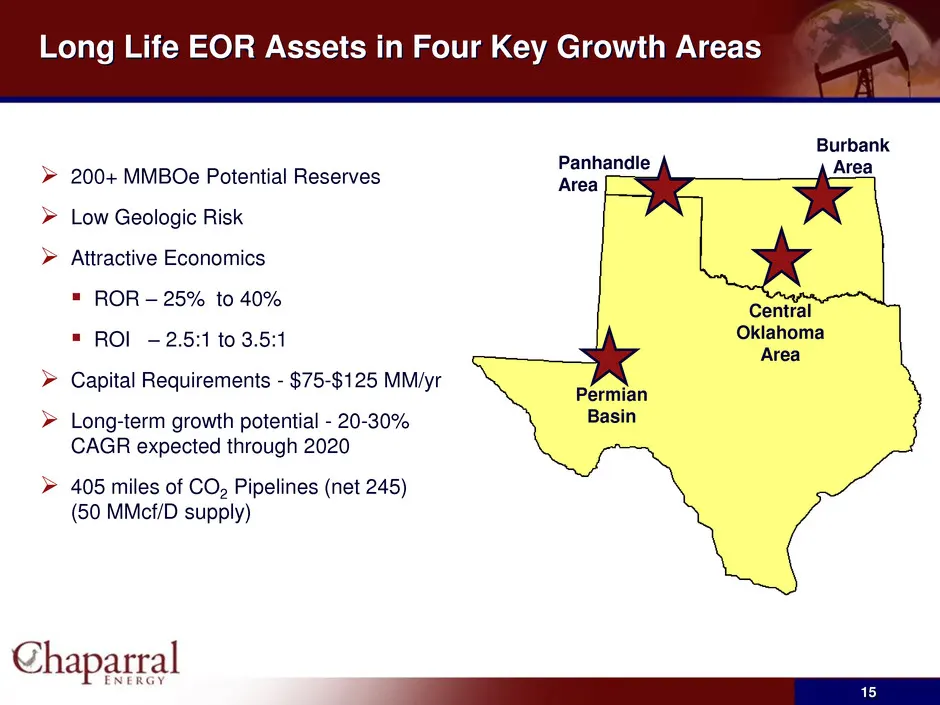
15 Long Life EOR Assets in Four Key Growth Areas Panhandle Area Permian Basin Central Oklahoma Area Burbank Area 200+ MMBOe Potential Reserves Low Geologic Risk Attractive Economics ROR – 25% to 40% ROI – 2.5:1 to 3.5:1 Capital Requirements - $75-$125 MM/yr Long-term growth potential -
Slide 16: Currently Owned CO2 Development Potential and Infrastructure
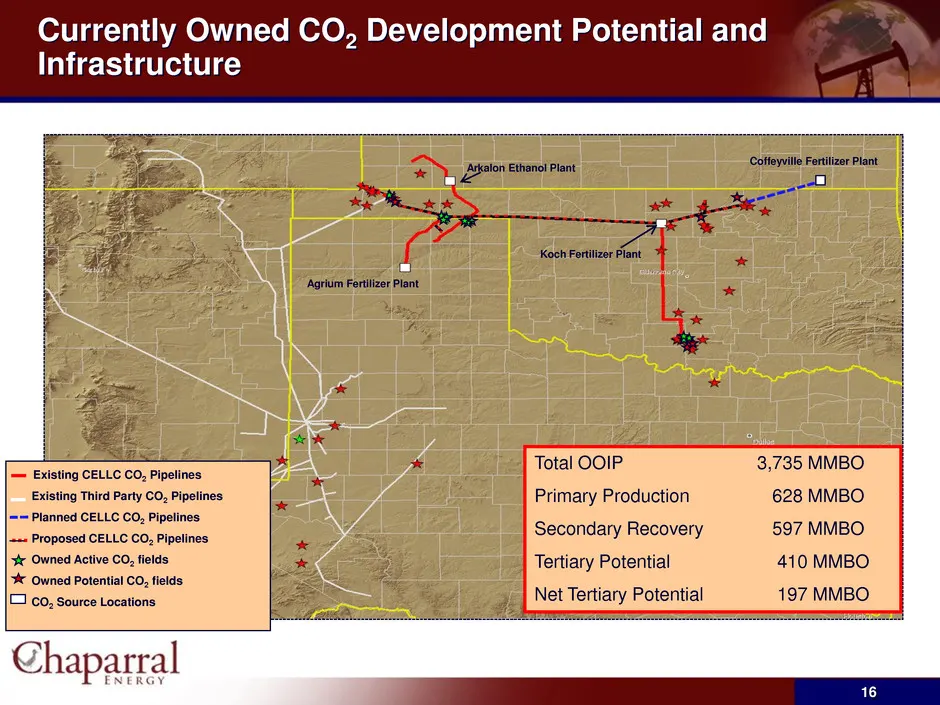
16 Currently Owned CO2 Development Potential and Infrastructure Total OOIP 3,735 MMBO Primary Production 628 MMBO Secondary Recovery 597 MMBO Tertiary Potential 410 MMBO Net Tertiary Potential 197 MMBO Existing CELLC CO2 Pipelines Existing Third Party CO2 Pipelines Planned CELLC CO2 Pipelines Propos
Slide 17: EOR 2011 Capital Budget
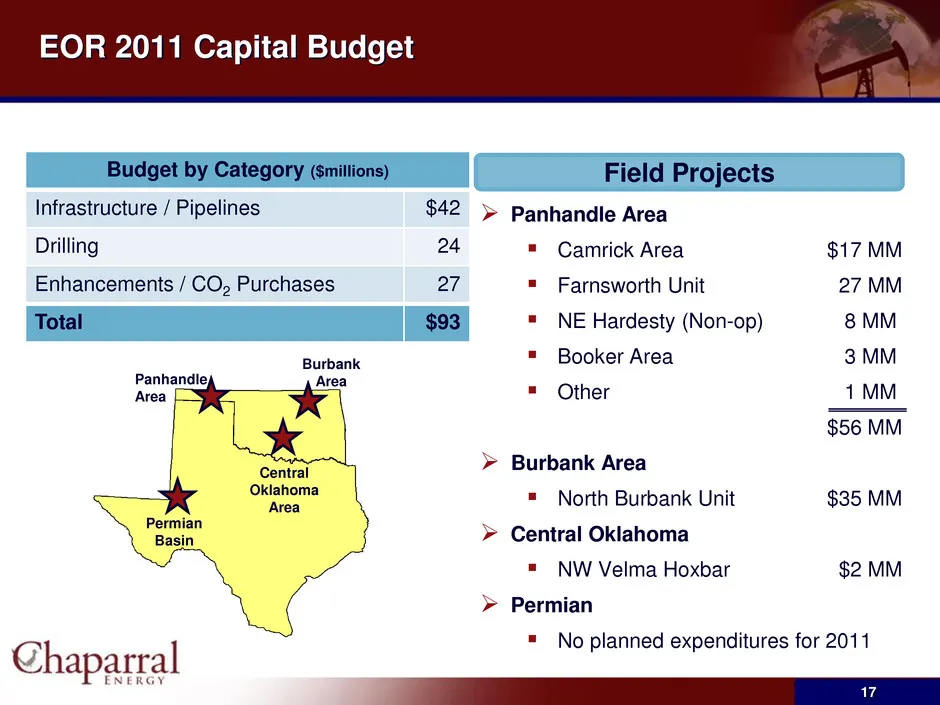
EOR 2011 Capital Budget 17 Budget by Category ($millions) Infrastructure / Pipelines $42 Drilling 24 Enhancements / CO2 Purchases 27 Total $93 Panhandle Area Camrick Area $17 MM Farnsworth Unit 27 MM NE Hardesty (Non-op) 8 MM Booker Area 3 MM Other 1 MM $56 MM Burbank Area North Burb
Slide 18: Processing Rate: The Key to Improved Rate of Return
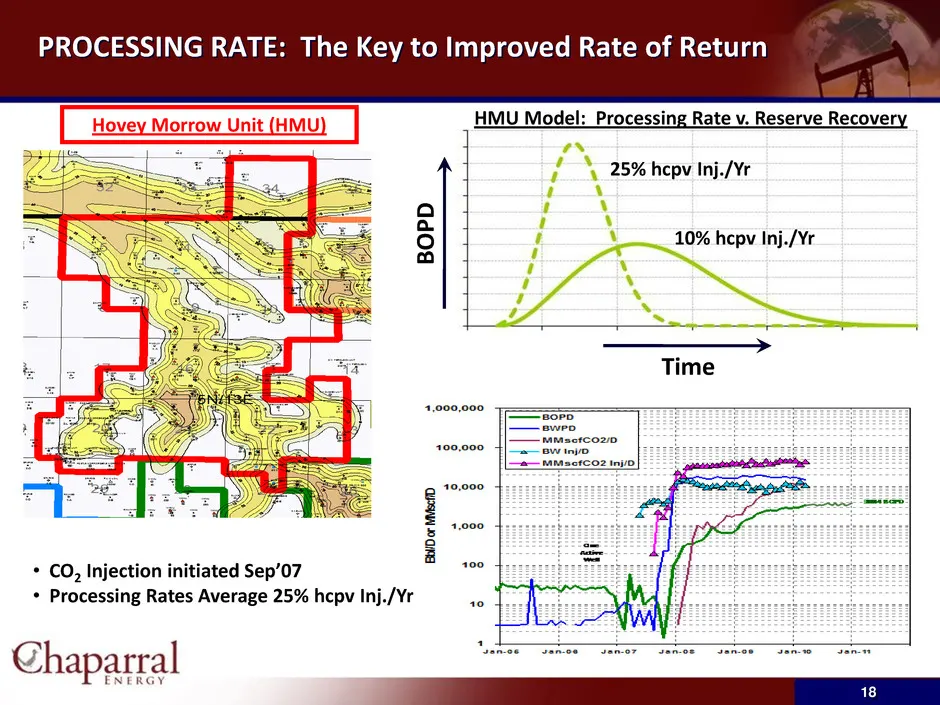
PROCESSING RATE: The Key to Improved Rate of Return 18 Hovey Morrow Unit (HMU) Time BO P D 25% hcpv Inj./Yr 10% hcpv Inj./Yr HMU Model: Processing Rate v. Reserve Recovery • CO2 Injection initiated Sep’07 • Processing Rates Average 25% hcpv Inj./Yr
Slide 19: Contracted CO2 Supply
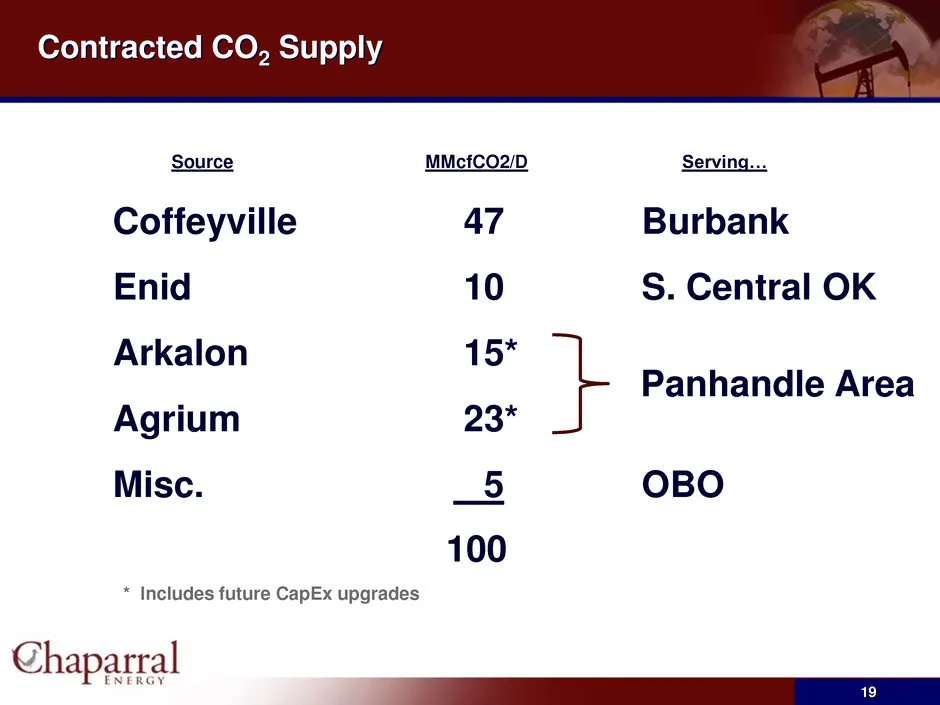
Contracted CO2 Supply 19 Source MMcfCO2/D Serving… Coffeyville 47 Burbank Enid 10 S. Central OK Arkalon 15* Agrium 23* Misc. 5 OBO 100 * Includes future CapEx upgrades Panhandle Area
Slide 20: CO2 Infrastructure & Resource Potential
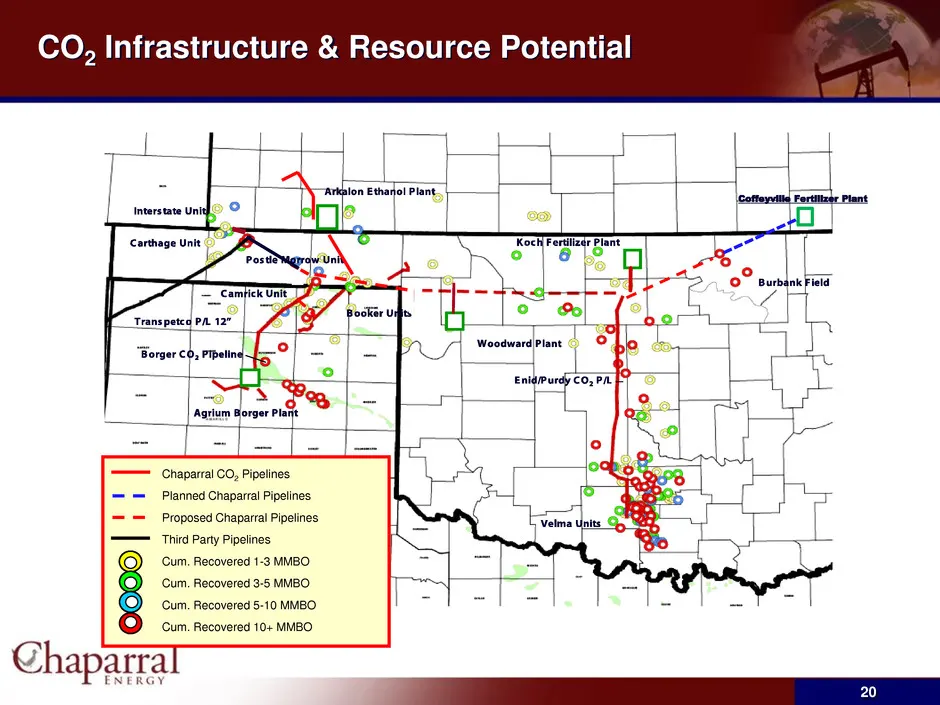
CO2 Infrastructure & Resource Potential 20 Chaparral CO2 Pipelines Planned Chaparral Pipelines Proposed Chaparral Pipelines Third Party Pipelines Cum. Recovered 1-3 MMBO Cum. Recovered 3-5 MMBO Cum. Recovered 5-10 MMBO Cum. Recovered 10+ MMBO Coffeyville Fertilizer Plant
Slide 21: DOE CO2-EOR Technically Recoverable Resource Potential
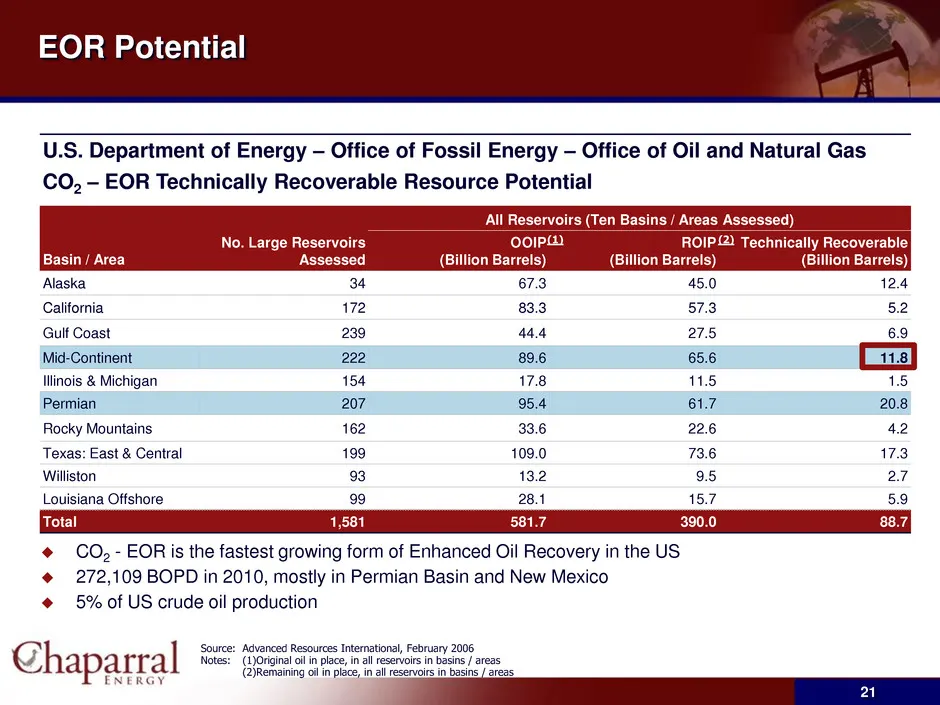
U.S. Department of Energy – Office of Fossil Energy – Office of Oil and Natural Gas CO2 – EOR Technically Recoverable Resource Potential Basin / Area No. Large Reservoirs Assessed All Reservoirs (Ten Basins / Areas Assessed) OOIP (Billion Barrels) ROIP (Billion Barrels) Technically Recoverable (Bill
Slide 22: North Burbank CO2 Development
22 North Burbank CO2 Development
Slide 23: Burbank Area Potential CO2 Projects
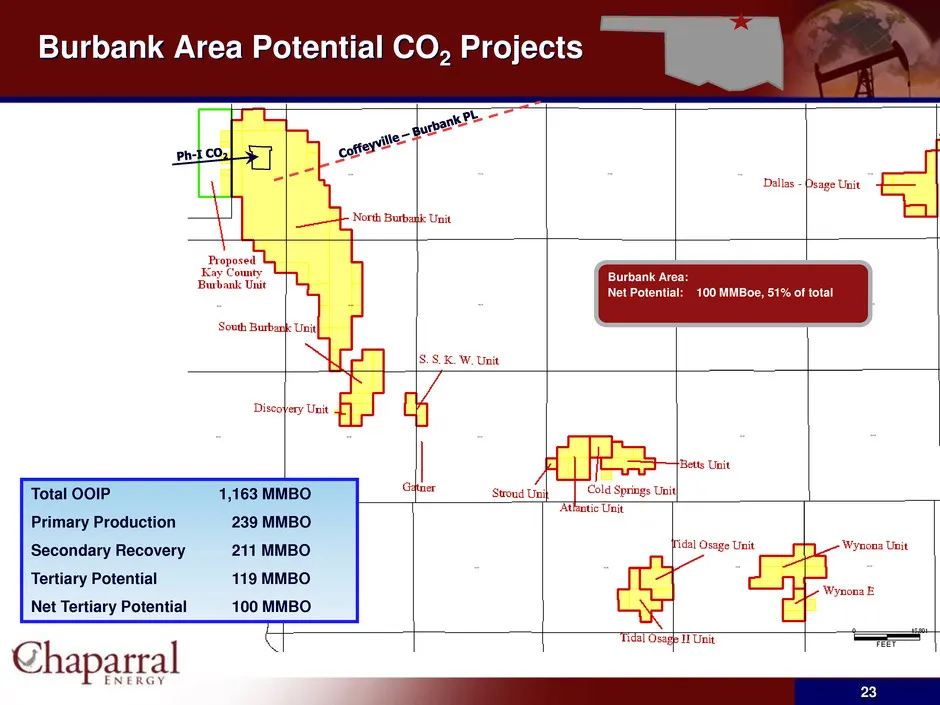
23 Burbank Area Potential CO2 Projects Total OOIP 1,163 MMBO Primary Production 239 MMBO Secondary Recovery 211 MMBO Tertiary Potential 119 MMBO Net Tertiary Potential 100 MMBO Burbank Area: Net Potential: 100 MMBoe, 51% of total
Slide 24: Business Plan: Economic Indices – Risk/Sensitivity
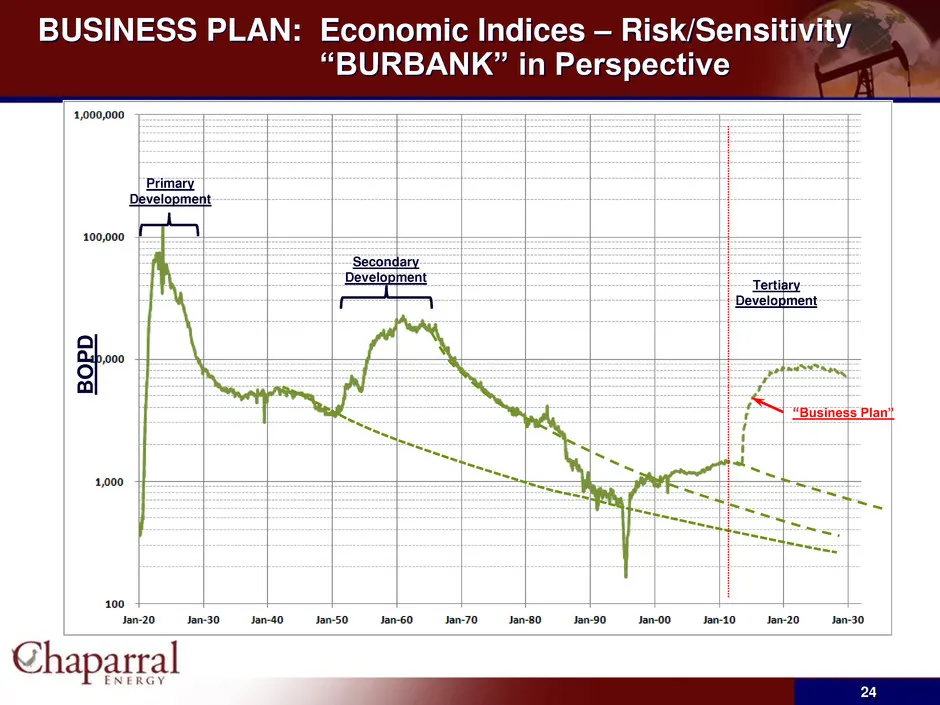
BUSINESS PLAN: Economic Indices – Risk/Sensitivity “BURBANK” in Perspective 24 Secondary Development Primary Development B O P D Tertiary Development “Business Plan”
Slide 25: Farnsworth Unit CO2 Development
25 Farnsworth Unit CO2 Development
Slide 26: Farnsworth Area Map
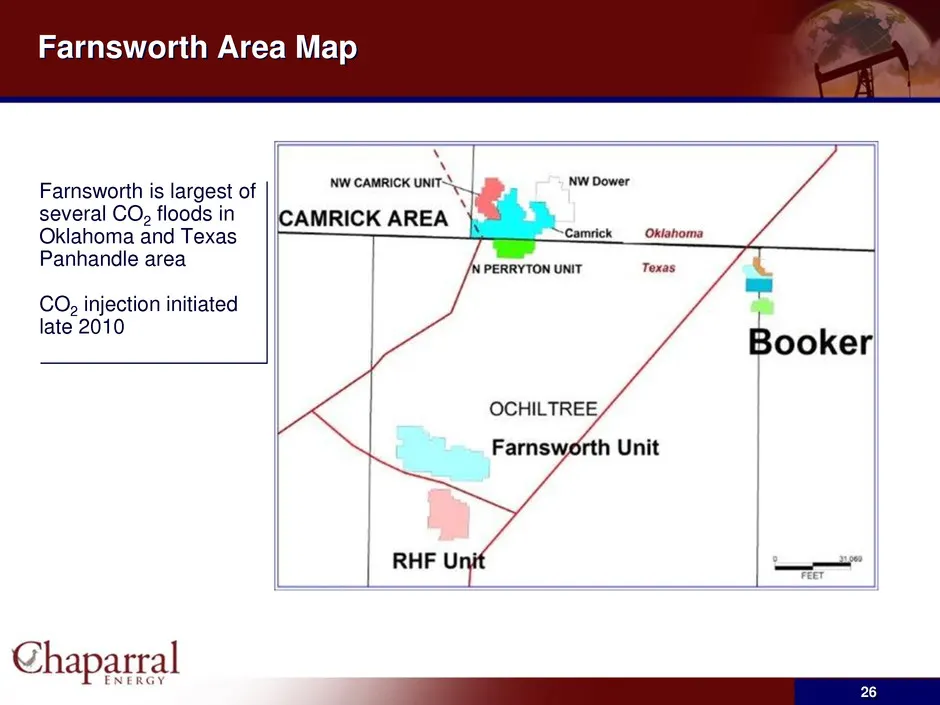
Farnsworth is largest of several CO2 floods in Oklahoma and Texas Panhandle area CO2 injection initiated late 2010 26 Farnsworth Area Map
Slide 27: Farnsworth Production Response
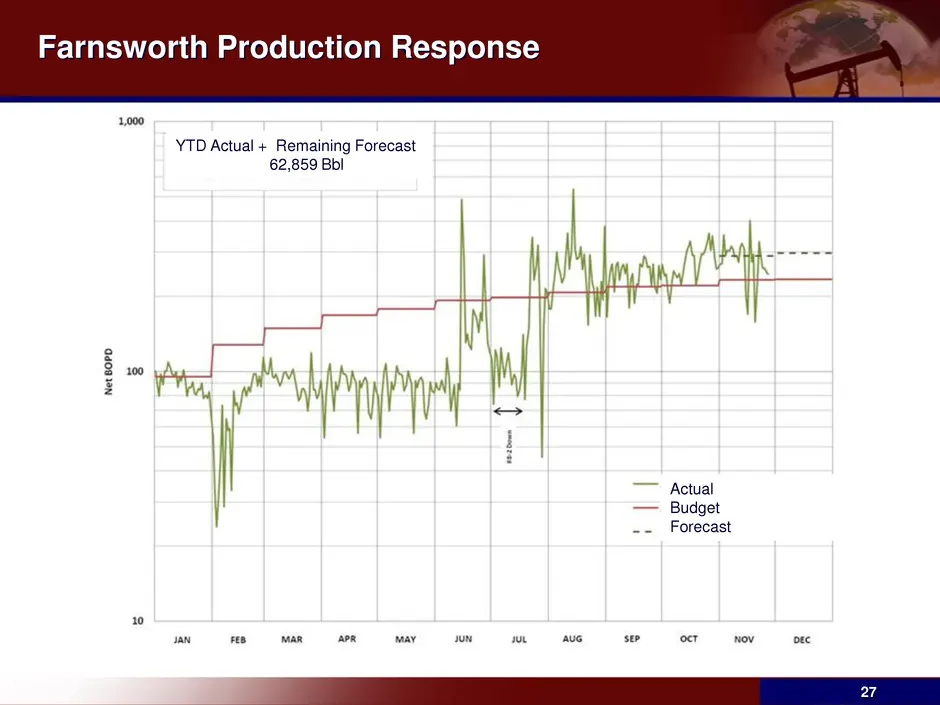
27 Farnsworth Production Response Actual Budget Forecast YTD Actual + Remaining Forecast 62,859 Bbl
Slide 28: Other Developing Drilling Plays
28 Other Developing Drilling Plays
Slide 29: Anadarko Basin - Woodford Shale
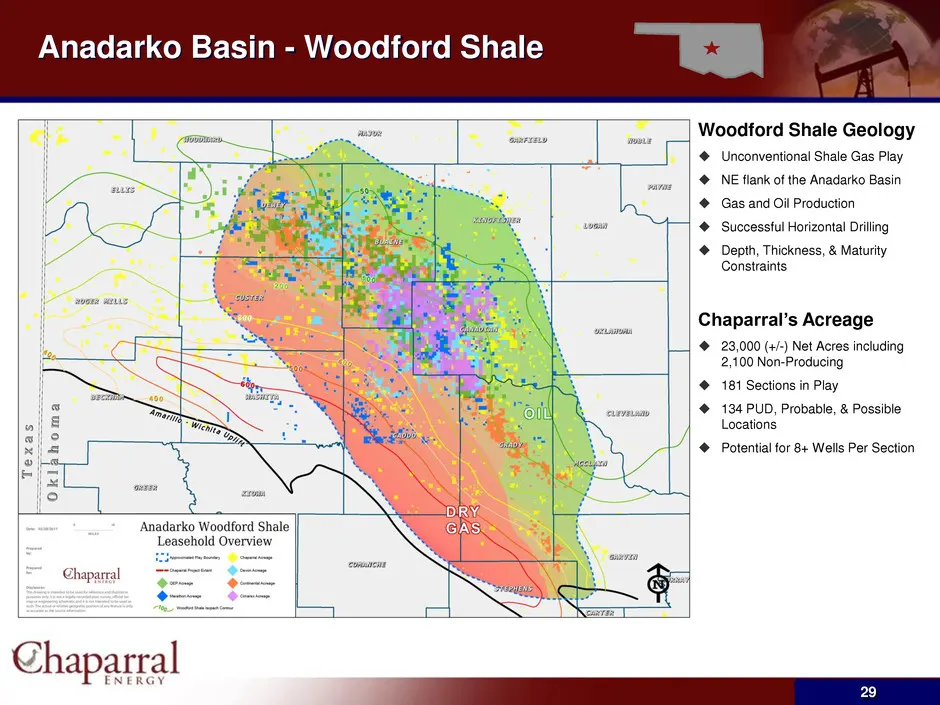
Anadarko Basin - Woodford Shale 29 Woodford Shale Geology Unconventional Shale Gas Play NE flank of the Anadarko Basin Gas and Oil Production Successful Horizontal Drilling Depth, Thickness, & Maturity Constraints Chaparral’s Acreage 23,000 (+/-) Net Acres including 2,100 Non-Producing
Slide 30: West Texas – Delaware Basin
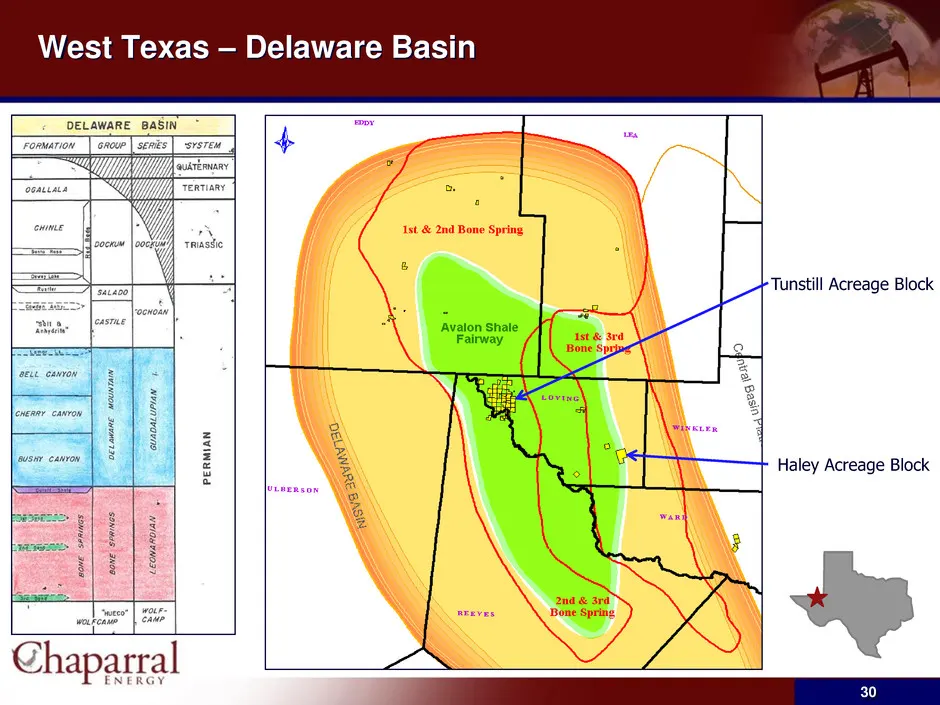
West Texas – Delaware Basin 30 Tunstill Acreage Block Haley Acreage Block
Slide 31: Avalon Shale Position
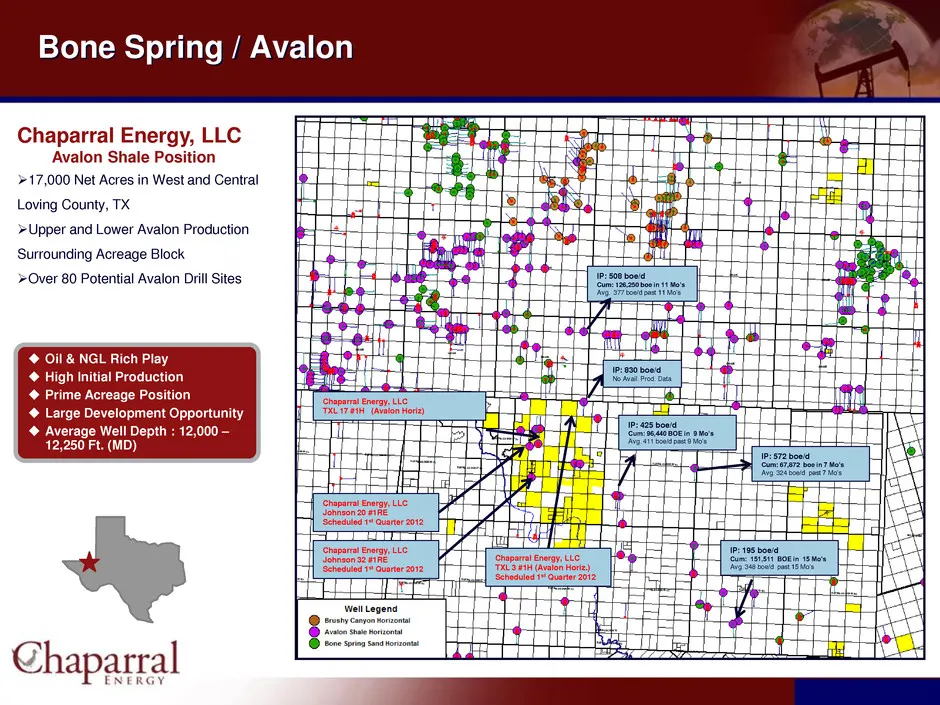
Chaparral Energy, LLC Avalon Shale Position 17,000 Net Acres in West and Central Loving County, TX Upper and Lower Avalon Production Surrounding Acreage Block Over 80 Potential Avalon Drill Sites Oil & NGL Rich Play High Initial Production Prime Acreage Position Large Development Opportun
Slide 32: Panhandle Marmaton
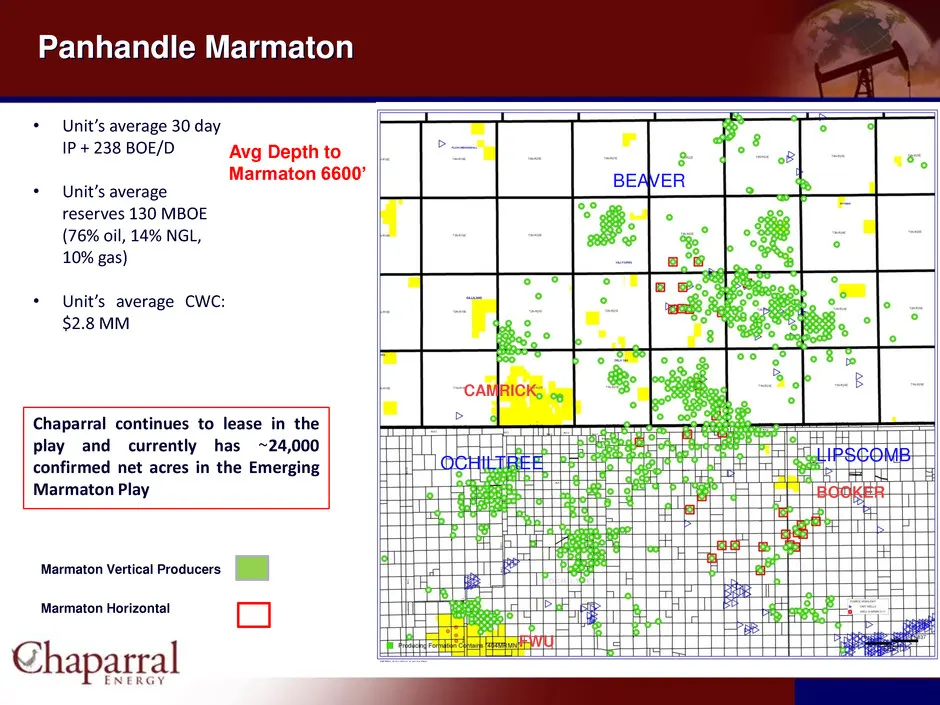
• Unit’s average 30 day IP + 238 BOE/D • Unit’s average reserves 130 MBOE (76% oil, 14% NGL, 10% gas) • Unit’s average CWC: $2.8 MM Chaparral continues to lease in the play and currently has ~24,000 confirmed net acres in the Emerging Marmaton Play Avg Depth to Marmaton 6600’ Marmaton Vertical Produ
Slide 33: Near-term + Long-term strategy yields significant value increase
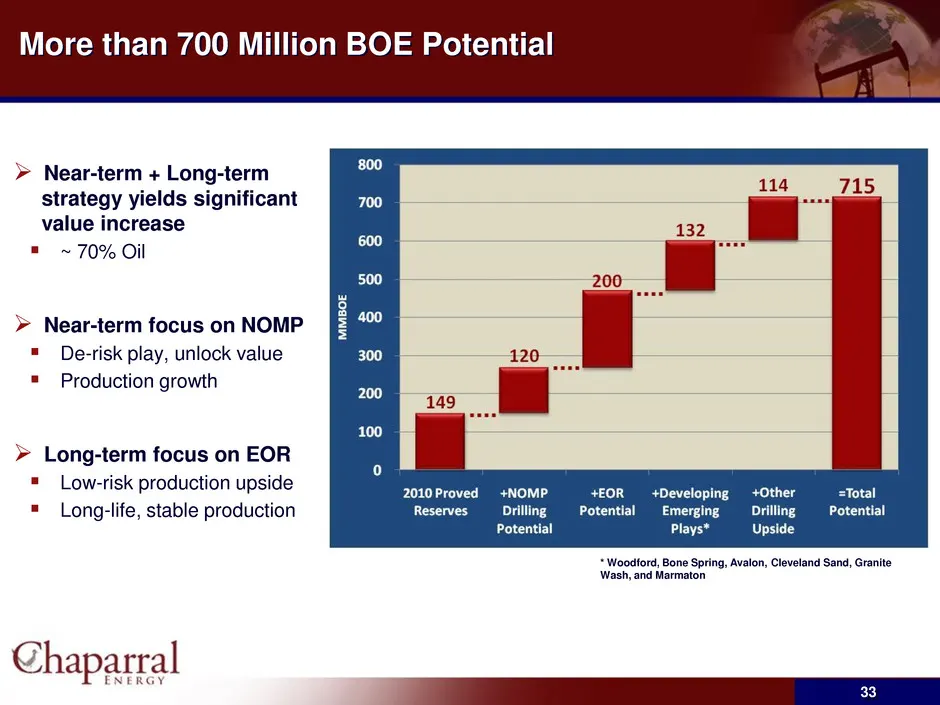
33 More than 700 Million BOE Potential Near-term + Long-term strategy yields significant value increase ~ 70% Oil Near-term focus on NOMP De-risk play, unlock value Production growth Long-term focus on EOR Low-risk production upside Long-life, stable production * Woodford, Bone Sprin
Slide 34: Financial Overview
Financial Overview Chaparra
Slide 35: Financials
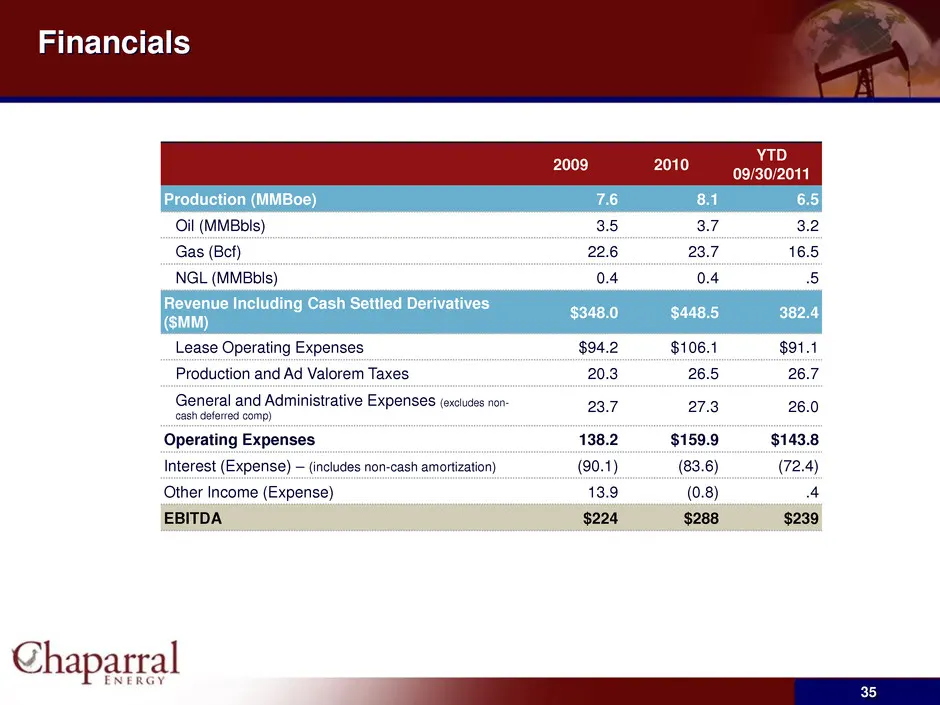
Financials 2009 2010 YTD 09/30/2011 Production (MMBoe) 7.6 8.1 6.5 Oil (MMBbls) 3.5 3.7 3.2 Gas (Bcf) 22.6 23.7 16.5 NGL (MMBbls) 0.4 0.4 .5 Revenue Including Cash Settled Derivatives ($MM) $348.0 $448.5 382.4 Lease Operating Expenses $94.2 $106.1 $91.1 Production and Ad Valorem Taxes 20.3 26.5 26.7
Slide 36: Financial Metrics per BOE
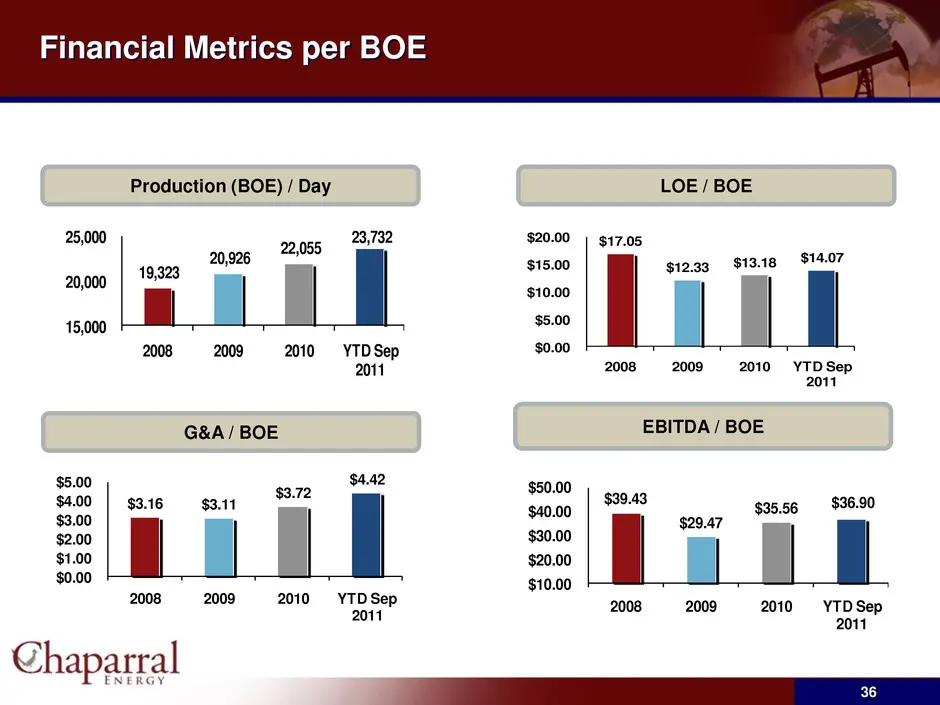
Financial Metrics per BOE Production (BOE) / Day LOE / BOE EBITDA / BOE G&A / BOE 19,323 20,926 22,055 23,732 15,000 20,000 25,000 2008 2009 2010 YTD Sep 2011 $17.05 $12.33 $13.18 $14.07 $0.00 $5.00 $10.0 $15.00 $20.00 2008 2009 2010 YTD Sep 2011$3.16 $3.11 $3.72 $4.42 $0.00 $1.00 $2.00 $3.00 $4.00
Slide 37: 2010 Results and 2011 Guidance
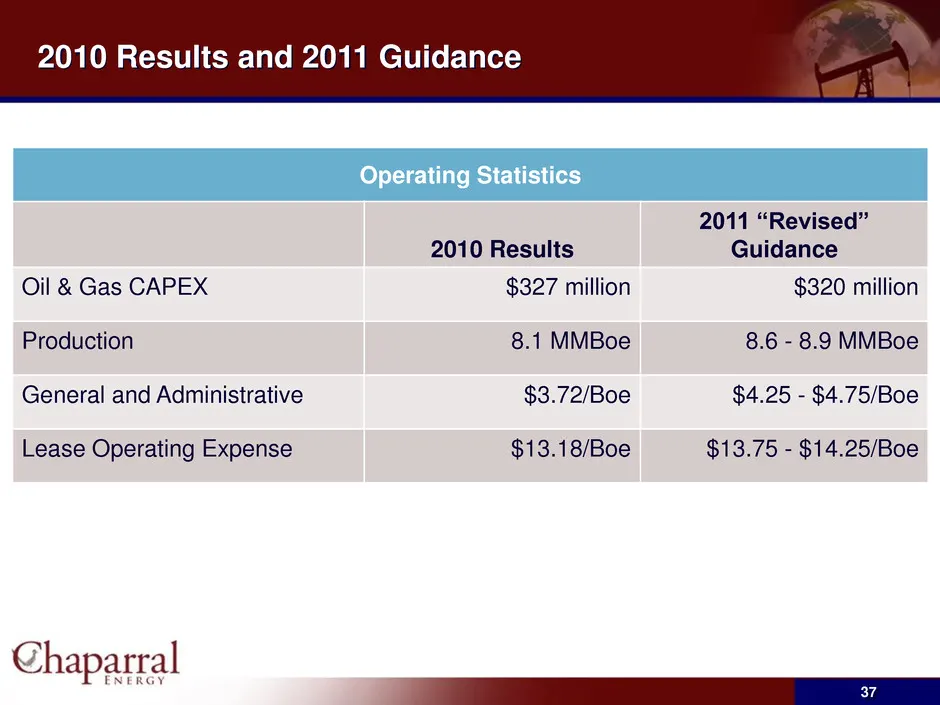
Operating Statistics 2010 Results 2011 “Revised” Guidance Oil & Gas CAPEX $327 million $320 million Production 8.1 MMBoe 8.6 - 8.9 MMBoe General and Administrative $3.72/Boe $4.25 - $4.75/Boe Lease Operating Expense $13.18/Boe $13.75 - $14.25/Boe 2010 Results and 2011 Guidance 37
Slide 38: Hedge Portfolio
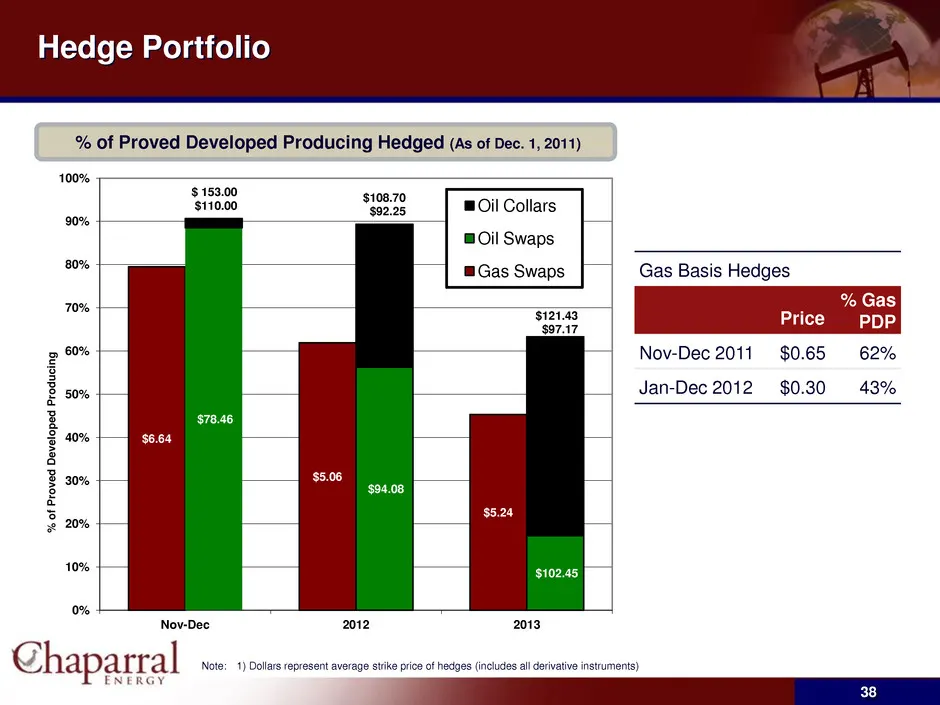
Hedge Portfolio Note: 1) Dollars represent average strike price of hedges (includes all derivative instruments) Gas Basis Hedges Price % Gas PDP Nov-Dec 2011 $0.65 62% Jan-Dec 2012 $0.30 43% $7.02 $7.24 $7.34 $69.10 $69.94 $68.40 $10.00 % of Proved Developed Producing Hedged (As of Dec. 1, 2011) $90
Source: SEC EDGAR · 8-K filed Dec 7, 2011
More decks from Chaparral Energy Inc
 Debt Investor Presentation (August 2020)10 slides · Aug 17, 2020
 Q1 2020 Earnings Presentation26 slides · May 12, 2020
 Investor Presentation (March 2020)30 slides · Mar 12, 2020
 Q3 2019 Earnings Presentation31 slides · Nov 12, 2019
 Q2 2019 Earnings Presentation33 slides · Aug 8, 2019
 Investor Presentation (May 2019)41 slides · May 28, 2019