STORE Capital — Q4 2016 Earnings Presentation
19 slides from STORE Capital's earnings presentation, Feb 23, 2017
Slide 1: Table of Contents
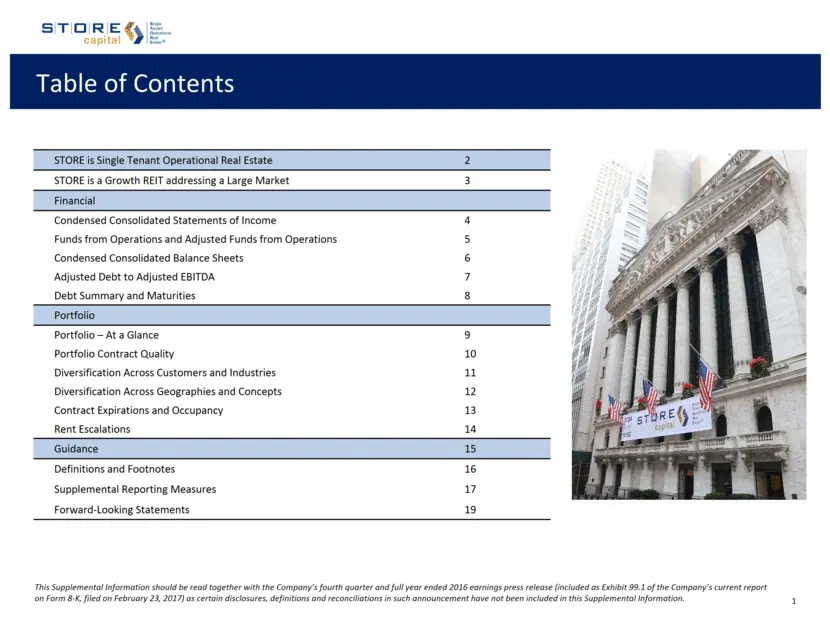
Table of Contents This Supplemental Information should be read together with the Company’s fourth quarter and full year ended 2016 earnings press release (included as Exhibit 99.1 of the Company’s current report on Form 8-K, filed on February 23, 2017) as certain disclosures, definitions and reconci
Slide 2: STORE is Single Tenant Operational Real Estate
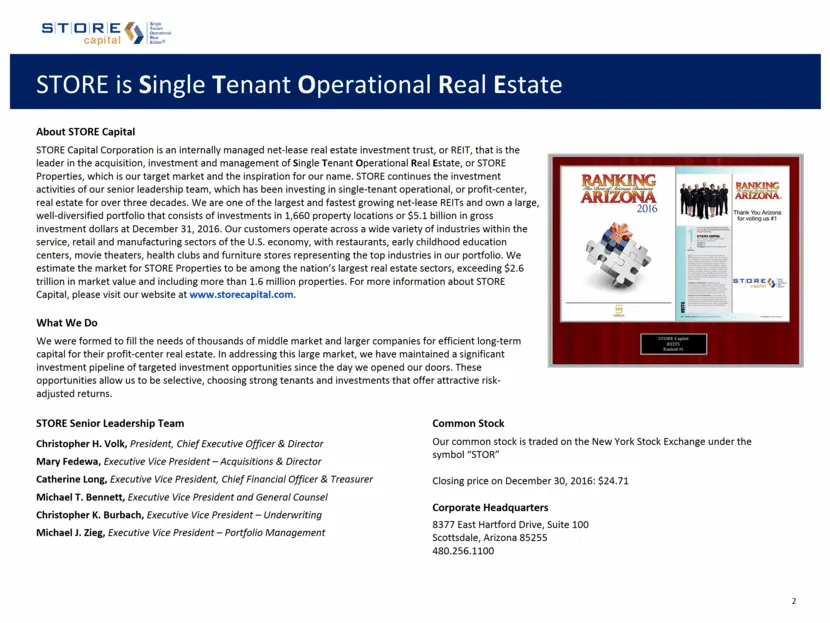
STORE is Single Tenant Operational Real Estate About STORE Capital STORE Capital Corporation is an internally managed net-lease real estate investment trust, or REIT, that is the leader in the acquisition, investment and management of Single Tenant Operational Real Estate, or STORE Properties, which
Slide 3: STORE is a Growth REIT addressing a Large Market
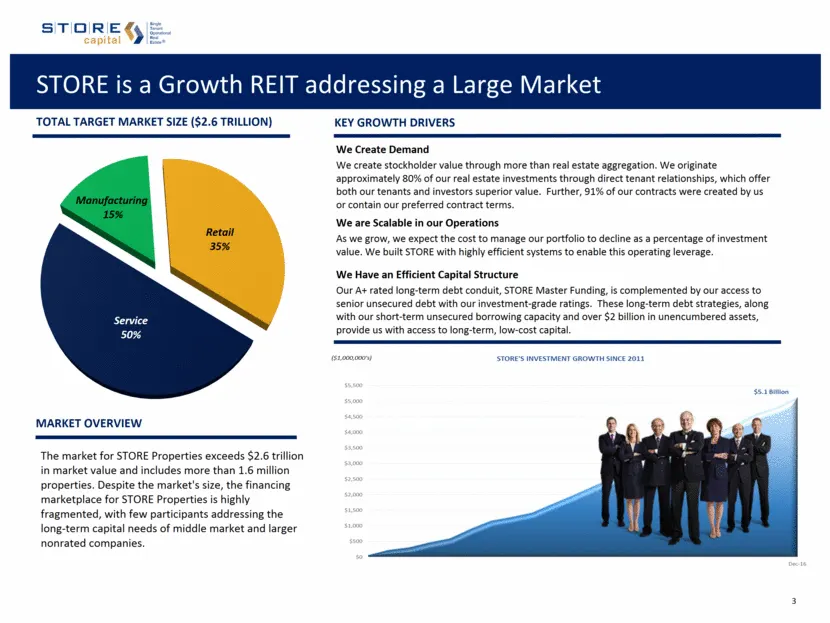
STORE is a Growth REIT addressing a Large Market The market for STORE Properties exceeds $2.6 trillion in market value and includes more than 1.6 million properties. Despite the market's size, the financing marketplace for STORE Properties is highly fragmented, with few participants addressing the l
Slide 4: Condensed Consolidated Statements of Income
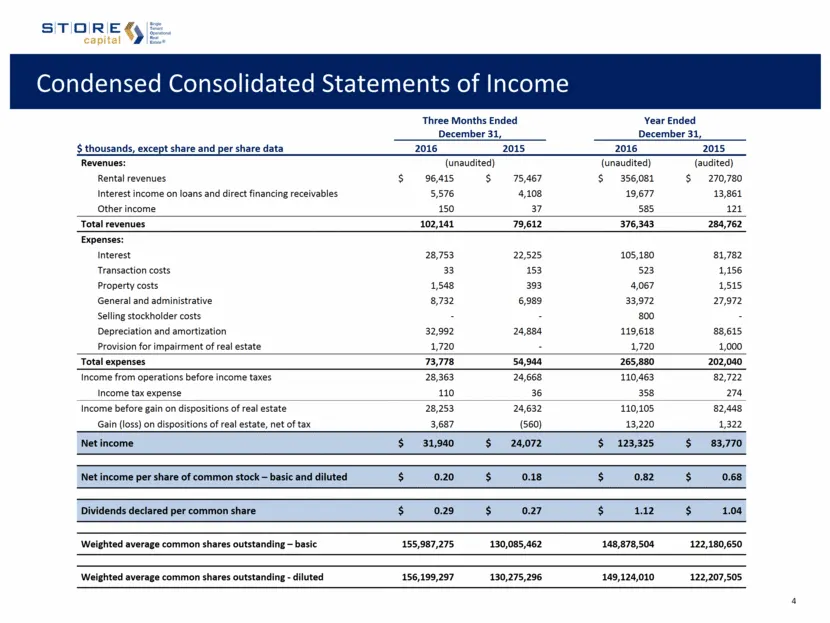
Condensed Consolidated Statements of Income Three Months Ended December 31, Year Ended December 31, $ thousands, except share and per share data 2016 2015 2016 2015 Revenues: (unaudited) (unaudited) (audited) Rental revenues $ 96,415 $ 75,467 $ 356,081 $ 270,780 Interest income on loans and direct f
Slide 5: Funds from Operations and Adjusted Funds from Operations
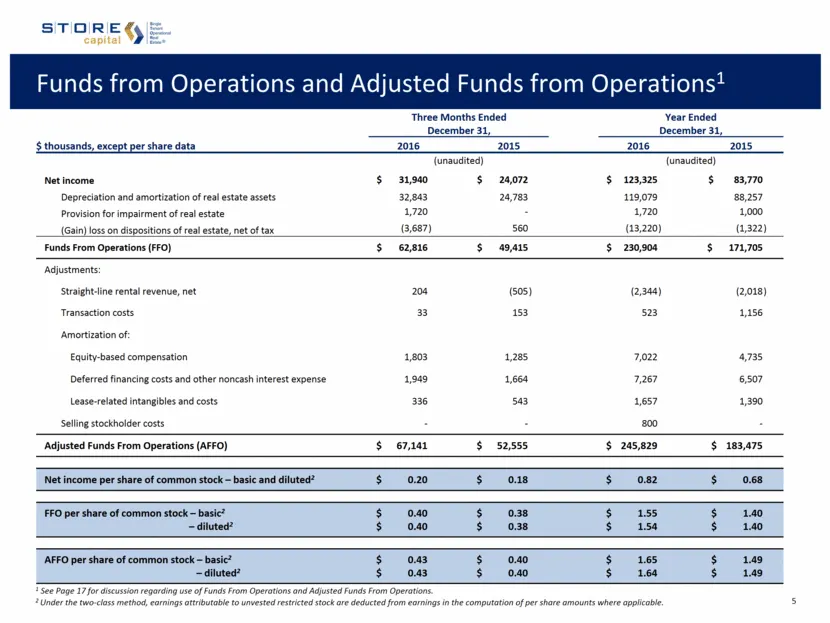
Funds from Operations and Adjusted Funds from Operations1 1 See Page 17 for discussion regarding use of Funds From Operations and Adjusted Funds From Operations. 2 Under the two-class method, earnings attributable to unvested restricted stock are deducted from earnings in the computation of per shar
Slide 6: Condensed Consolidated Balance Sheets
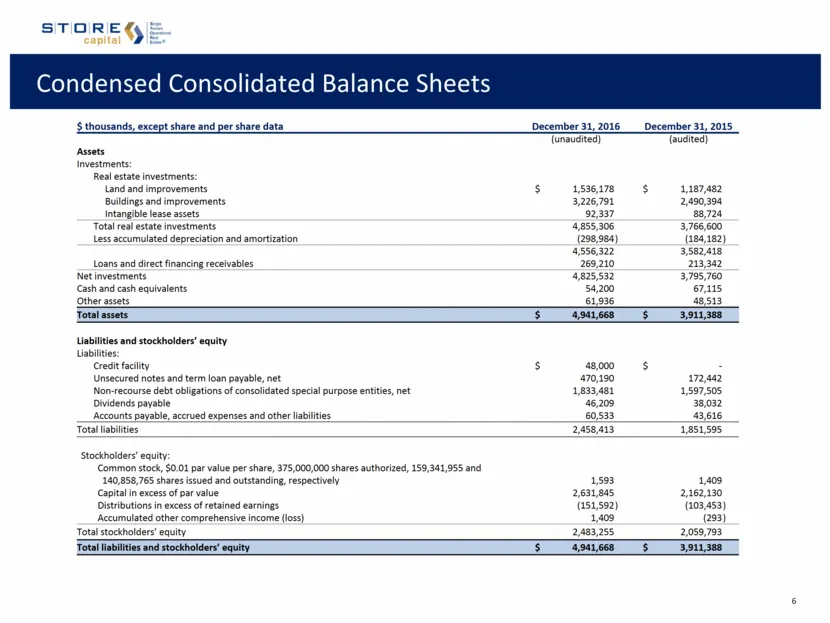
Condensed Consolidated Balance Sheets $ thousands, except share and per share data December 31, 2016 December 31, 2015 (unaudited) (audited) Assets Investments: Real estate investments: Land and improvements $ 1,536,178 $ 1,187,482 Buildings and improvements 3,226,791 2,490,394 Intangible lease asse
Slide 7: Adjusted Debt to Adjusted EBITDA
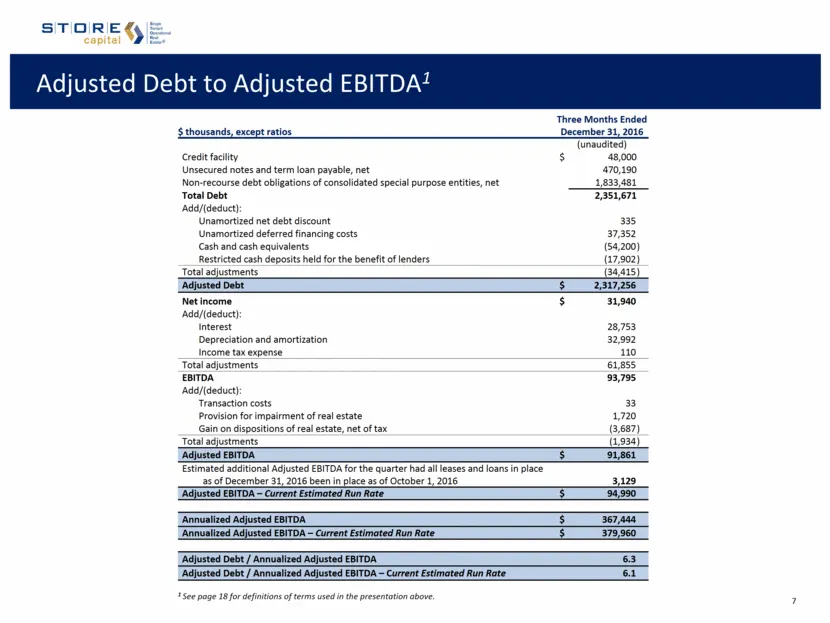
Adjusted Debt to Adjusted EBITDA1 $ thousands, except ratios Three Months Ended December 31, 2016 (unaudited) Credit facility $ 48,000 Unsecured notes and term loan payable, net 470,190 Non-recourse debt obligations of consolidated special purpose entities, net 1,833,481 Total Debt 2,351,671 Add/(de
Slide 8: Debt Summary and Maturities
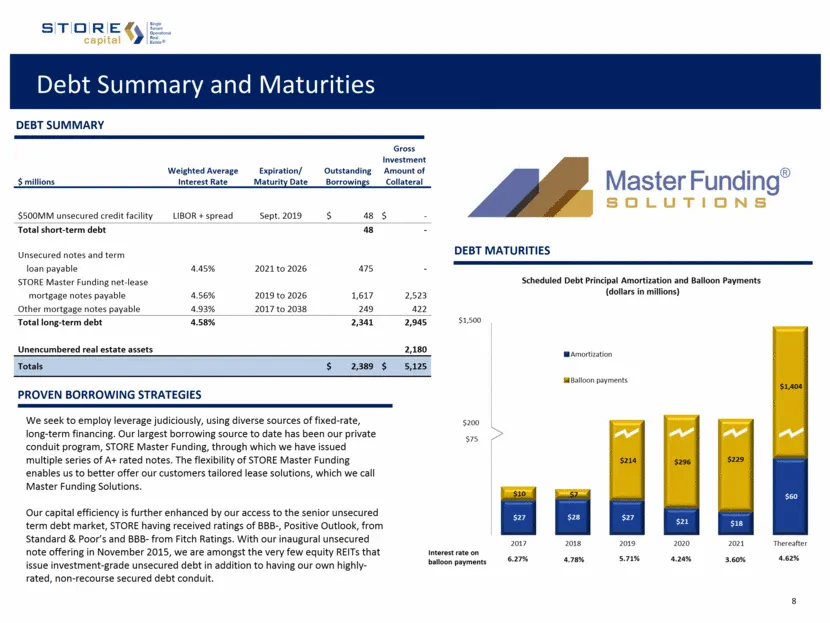
Debt Summary and Maturities Debt maturities Debt summary We seek to employ leverage judiciously, using diverse sources of fixed-rate, long-term financing. Our largest borrowing source to date has been our private conduit program, STORE Master Funding, through which we have issued multiple series of
Slide 9: Portfolio – At a Glance
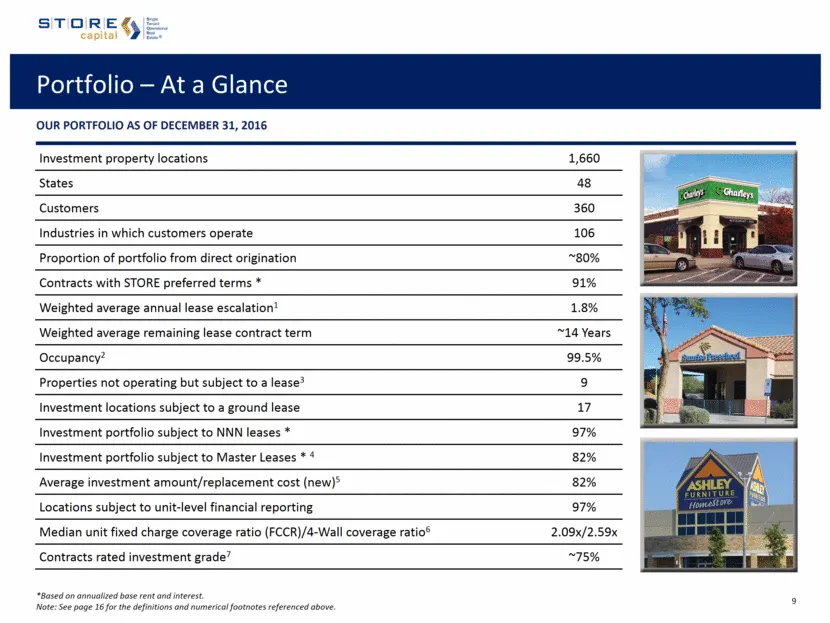
Portfolio – At a Glance OUR PORTFOLIO as of December 31, 2016 Investment property locations 1,660 States 48 Customers 360 Industries in which customers operate 106 Proportion of portfolio from direct origination ~80% Contracts with STORE preferred terms * 91% Weighted average annual lease escalation
Slide 10: Portfolio Contract Quality
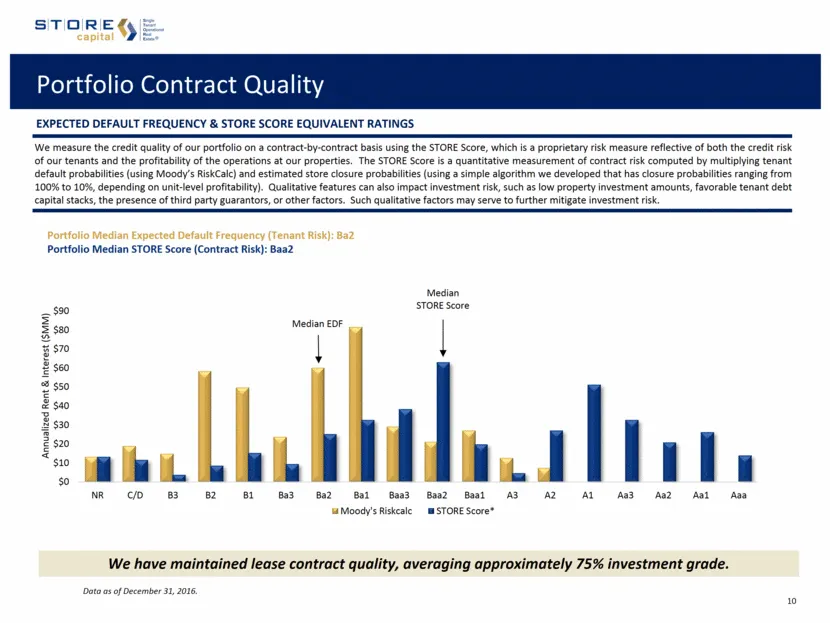
Portfolio Contract Quality Expected default frequency & STORE score equivalent Ratings Data as of December 31, 2016. We measure the credit quality of our portfolio on a contract-by-contract basis using the STORE Score, which is a proprietary risk measure reflective of both the credit risk of our ten
Slide 11: Diversification Across Customers and Industries
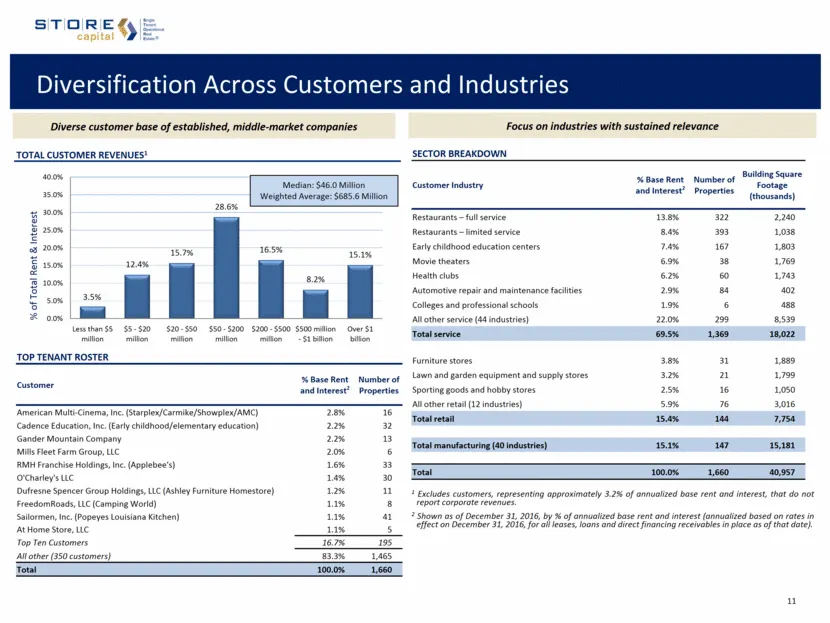
Diversification Across Customers and Industries Focus on industries with sustained relevance 1 Excludes customers, representing approximately 3.2% of annualized base rent and interest, that do not report corporate revenues. 2 Shown as of December 31, 2016, by % of annualized base rent and interest (
Slide 12: Diversification Across Geographies and Concepts
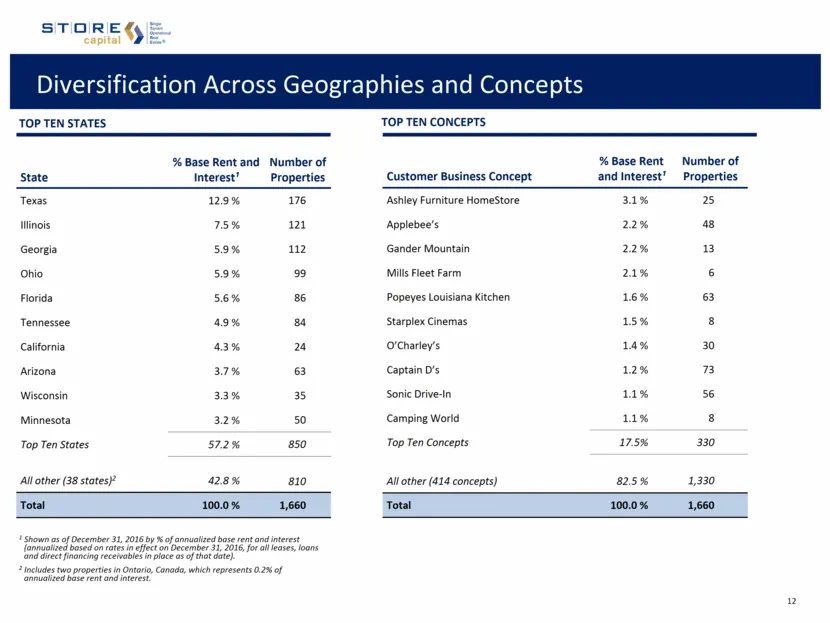
State % Base Rent and Interest¹ Number of Properties Texas 12.9 % 176 Illinois 7.5 % 121 Georgia 5.9 % 112 Ohio 5.9 % 99 Florida 5.6 % 86 Tennessee 4.9 % 84 California 4.3 % 24 Arizona 3.7 % 63 Wisconsin 3.3 % 35 Minnesota 3.2 % 50 Top Ten States 57.2 % 850 All other (38 states)2 42.8 % 810 Total 10
Slide 13: Contract Expirations and Occupancy
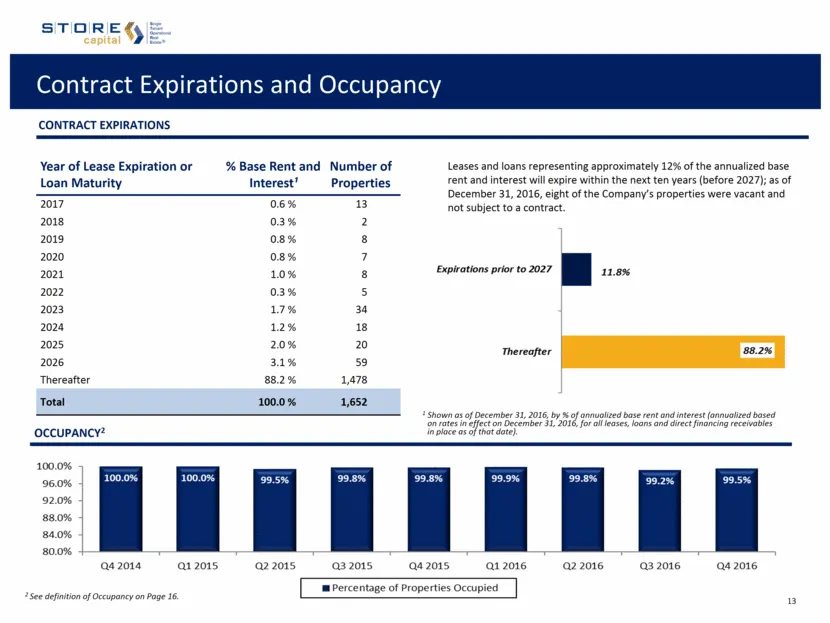
Year of Lease Expiration or Loan Maturity % Base Rent and Interest¹ Number of Properties 2017 0.6 % 13 2018 0.3 % 2 2019 0.8 % 8 2020 0.8 % 7 2021 1.0 % 8 2022 0.3 % 5 2023 1.7 % 34 2024 1.2 % 18 2025 2.0 % 20 2026 3.1 % 59 Thereafter 88.2 % 1,478 Total 100.0 % 1,652 Contract Expirations and Occupan
Slide 14: Rent Escalations
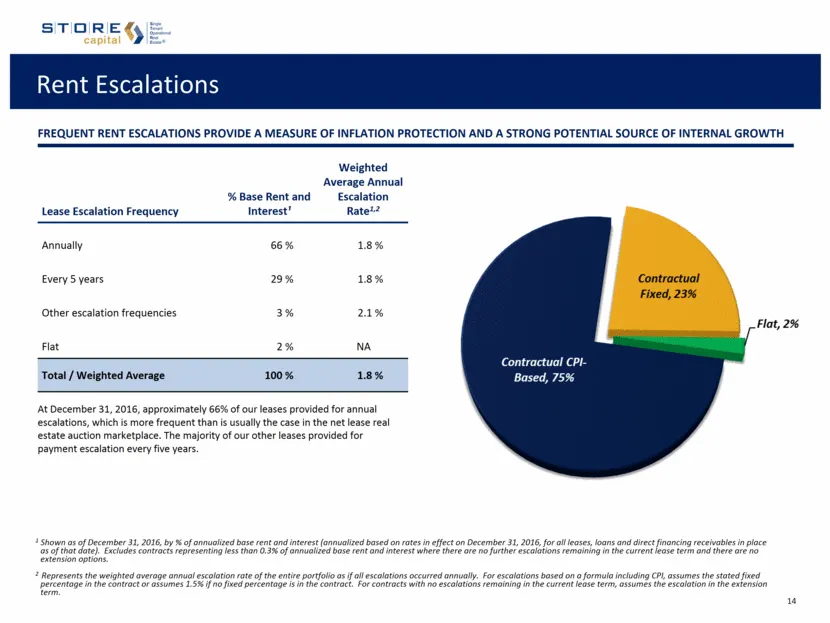
Rent Escalations Lease Escalation Frequency % Base Rent and Interest¹ Weighted Average Annual Escalation Rate1,2 Annually 66 % 1.8 % Every 5 years 29 % 1.8 % Other escalation frequencies 3 % 2.1 % Flat 2 % NA Total / Weighted Average 100 % 1.8 % At December 31, 2016, approximately 66% of our leases
Slide 15: Guidance
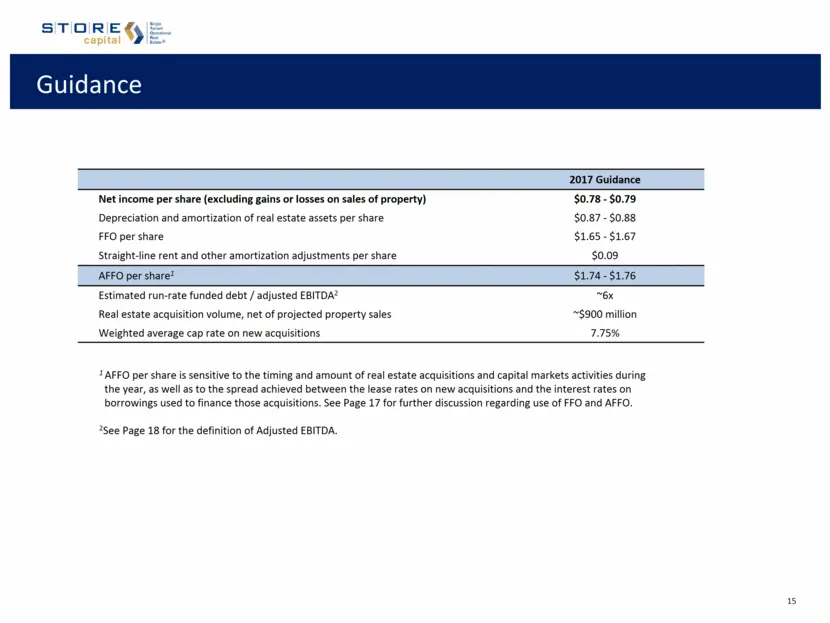
Guidance 2017 Guidance Net income per share (excluding gains or losses on sales of property) $0.78 - $0.79 Depreciation and amortization of real estate assets per share $0.87 - $0.88 FFO per share $1.65 - $1.67 Straight-line rent and other amortization adjustments per share $0.09 AFFO per share1 $1.
Slide 16: Definitions and Footnotes
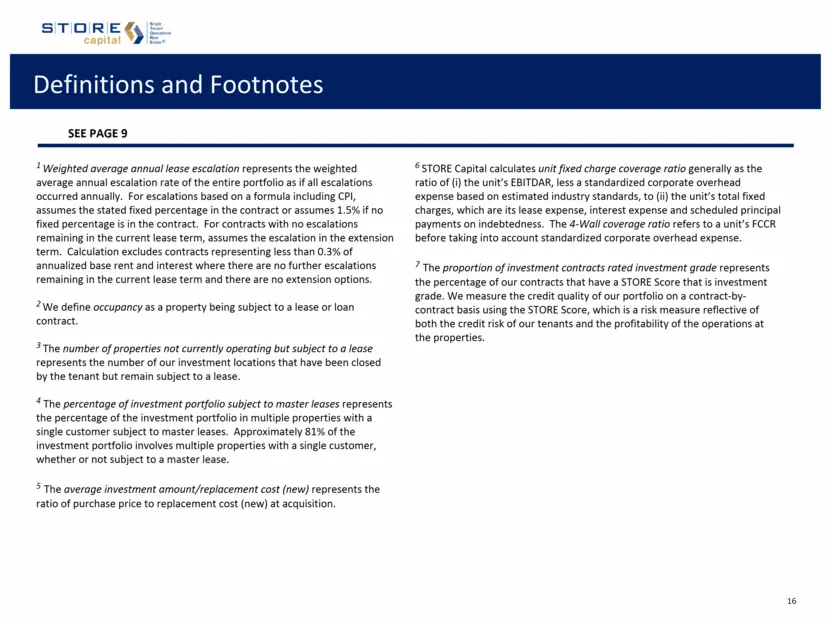
Definitions and Footnotes 1 Weighted average annual lease escalation represents the weighted average annual escalation rate of the entire portfolio as if all escalations occurred annually. For escalations based on a formula including CPI, assumes the stated fixed percentage in the contract or assume
Slide 17: Supplemental Reporting Measures
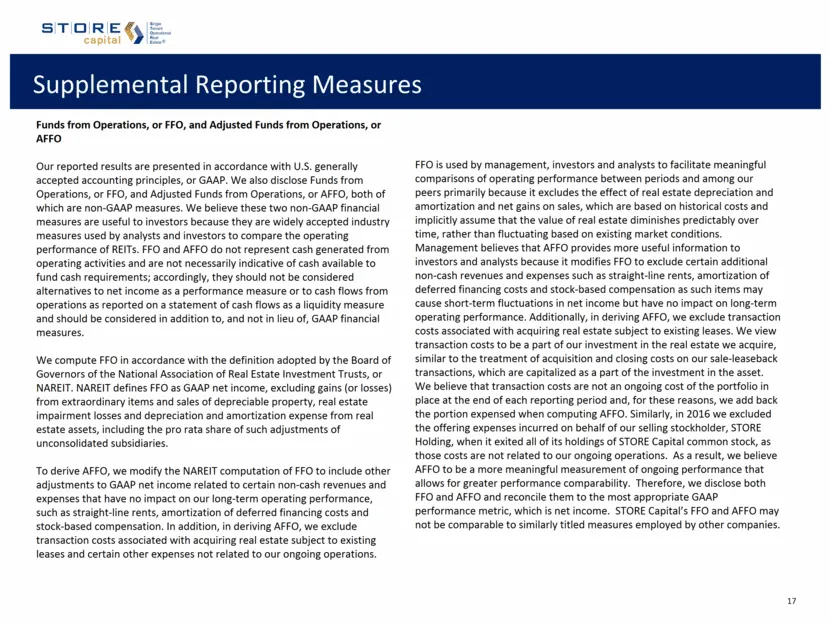
Supplemental Reporting Measures Funds from Operations, or FFO, and Adjusted Funds from Operations, or AFFO Our reported results are presented in accordance with U.S. generally accepted accounting principles, or GAAP. We also disclose Funds from Operations, or FFO, and Adjusted Funds from Operations,
Slide 18: Supplemental Reporting Measures
Supplemental Reporting Measures EBITDA, Adjusted EBITDA, Annualized Adjusted EBITDA and Adjusted Debt EBITDA represents earnings before interest, taxes, depreciation and amortization. Adjusted EBITDA represents EBITDA modified to include other adjustments to GAAP net income for transaction costs, no
Slide 19: Forward-Looking Statements
STORE (5 capital Forward-Looking Statements Certain statements contained inthis document that are not historical {acts contain forward-looking statements within the meaning of Section 27Aof the Securities Act of 1933, as amended, and within the meaning of Section 21€ ofthe Securities Exchange Act of
Source: SEC EDGAR · 8-K filed Feb 23, 2017
More decks from STORE Capital Corp
 Q2 2023 Earnings Presentation10 slides · Aug 4, 2023
 Q2 2022 Earnings Presentation26 slides · Aug 3, 2022
 Q2 2022 Earnings Presentation22 slides · Aug 3, 2022
 Q1 2022 Earnings Presentation26 slides · May 4, 2022
 Q1 2022 Earnings Presentation22 slides · May 4, 2022
 Q4 2021 Earnings Presentation33 slides · Feb 23, 2022