C&J Energy Services — Stephens Fall Investment Conference 2014
27 slides from C&J Energy Services's conference presentation, Nov 12, 2014
Slide 1: Stephens Fall Investment Conference
Exhibit 99.1 Stephens Fall Investment Conference November 11, 2014 © C&J Energy Services, Inc. 2014

Slide 2: Disclaimer: Important Information for Investors and Stockholders
Disclaimer Important Information for Investors and Stockholders This communication does not constitute an offer to sell or the solicitation of an offer to buy any securities or a solicitation of any vote or approval. In connection with the proposed merger between C&J Energy Services, Inc. (“C&J”) an
Slide 3: Cautionary Statement Regarding Forward-Looking Statements
Disclaimer Cautionary Statement Regarding Forward-Looking Statements Thiscommunicationcontains “forward-looking statements”within the meaningof Section27Aof the SecuritiesActof 1933 and Section21Eof the Securities and ExchangeAct of 1934. Theseinclude statements regarding the effects of the proposed
Slide 4: C&J Energy Services
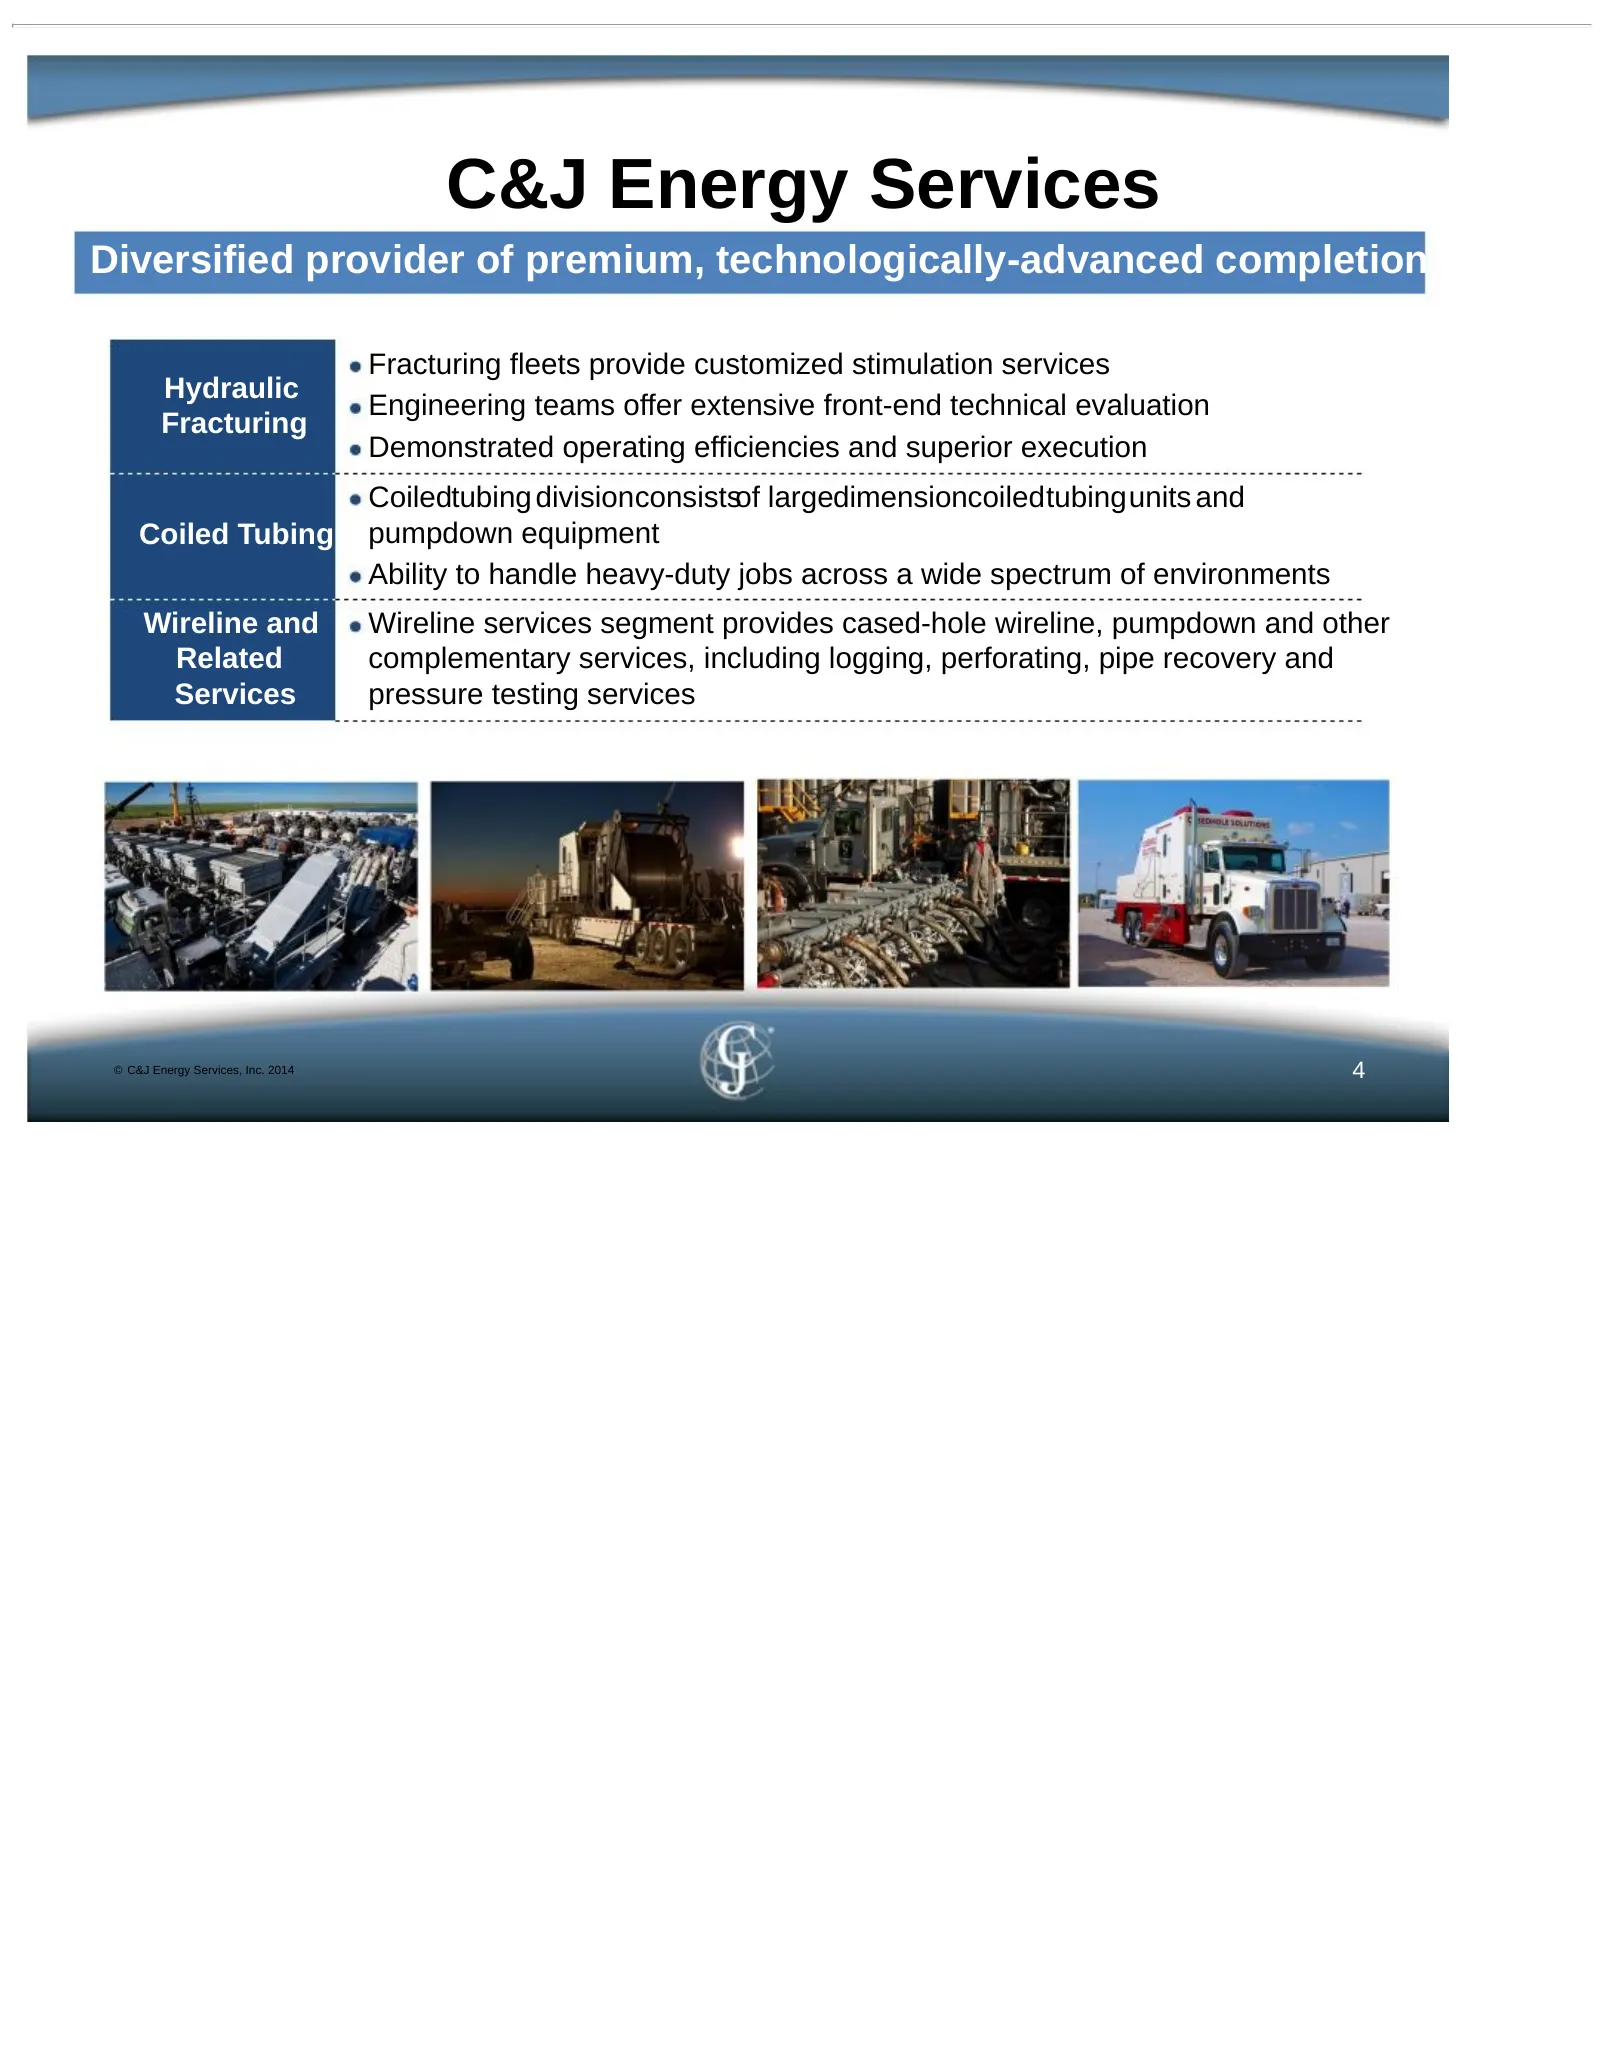
C&J Energy Services Diversified provider of premium, technologically-advanced completion services Fracturing fleets provide customized stimulation services Hydraulic Engineering teams offer extensive front-end technical evaluation Fracturing Demonstrated operating efficiencies and superior execution
Slide 5: Operational Model Drives Best-In-Class Performance
Operational Model Drives Best-In-Class Performance Operating efficiencies capitalize on targeted opportunities • Targethigh volume,highefficiencycustomerswho recognizethat the valuethat C&J provides through efficiency gains results in significant cost savings to them • Focused on complex, service in
Slide 6: Operational Model Driving Significant Growth and Margin Expansion
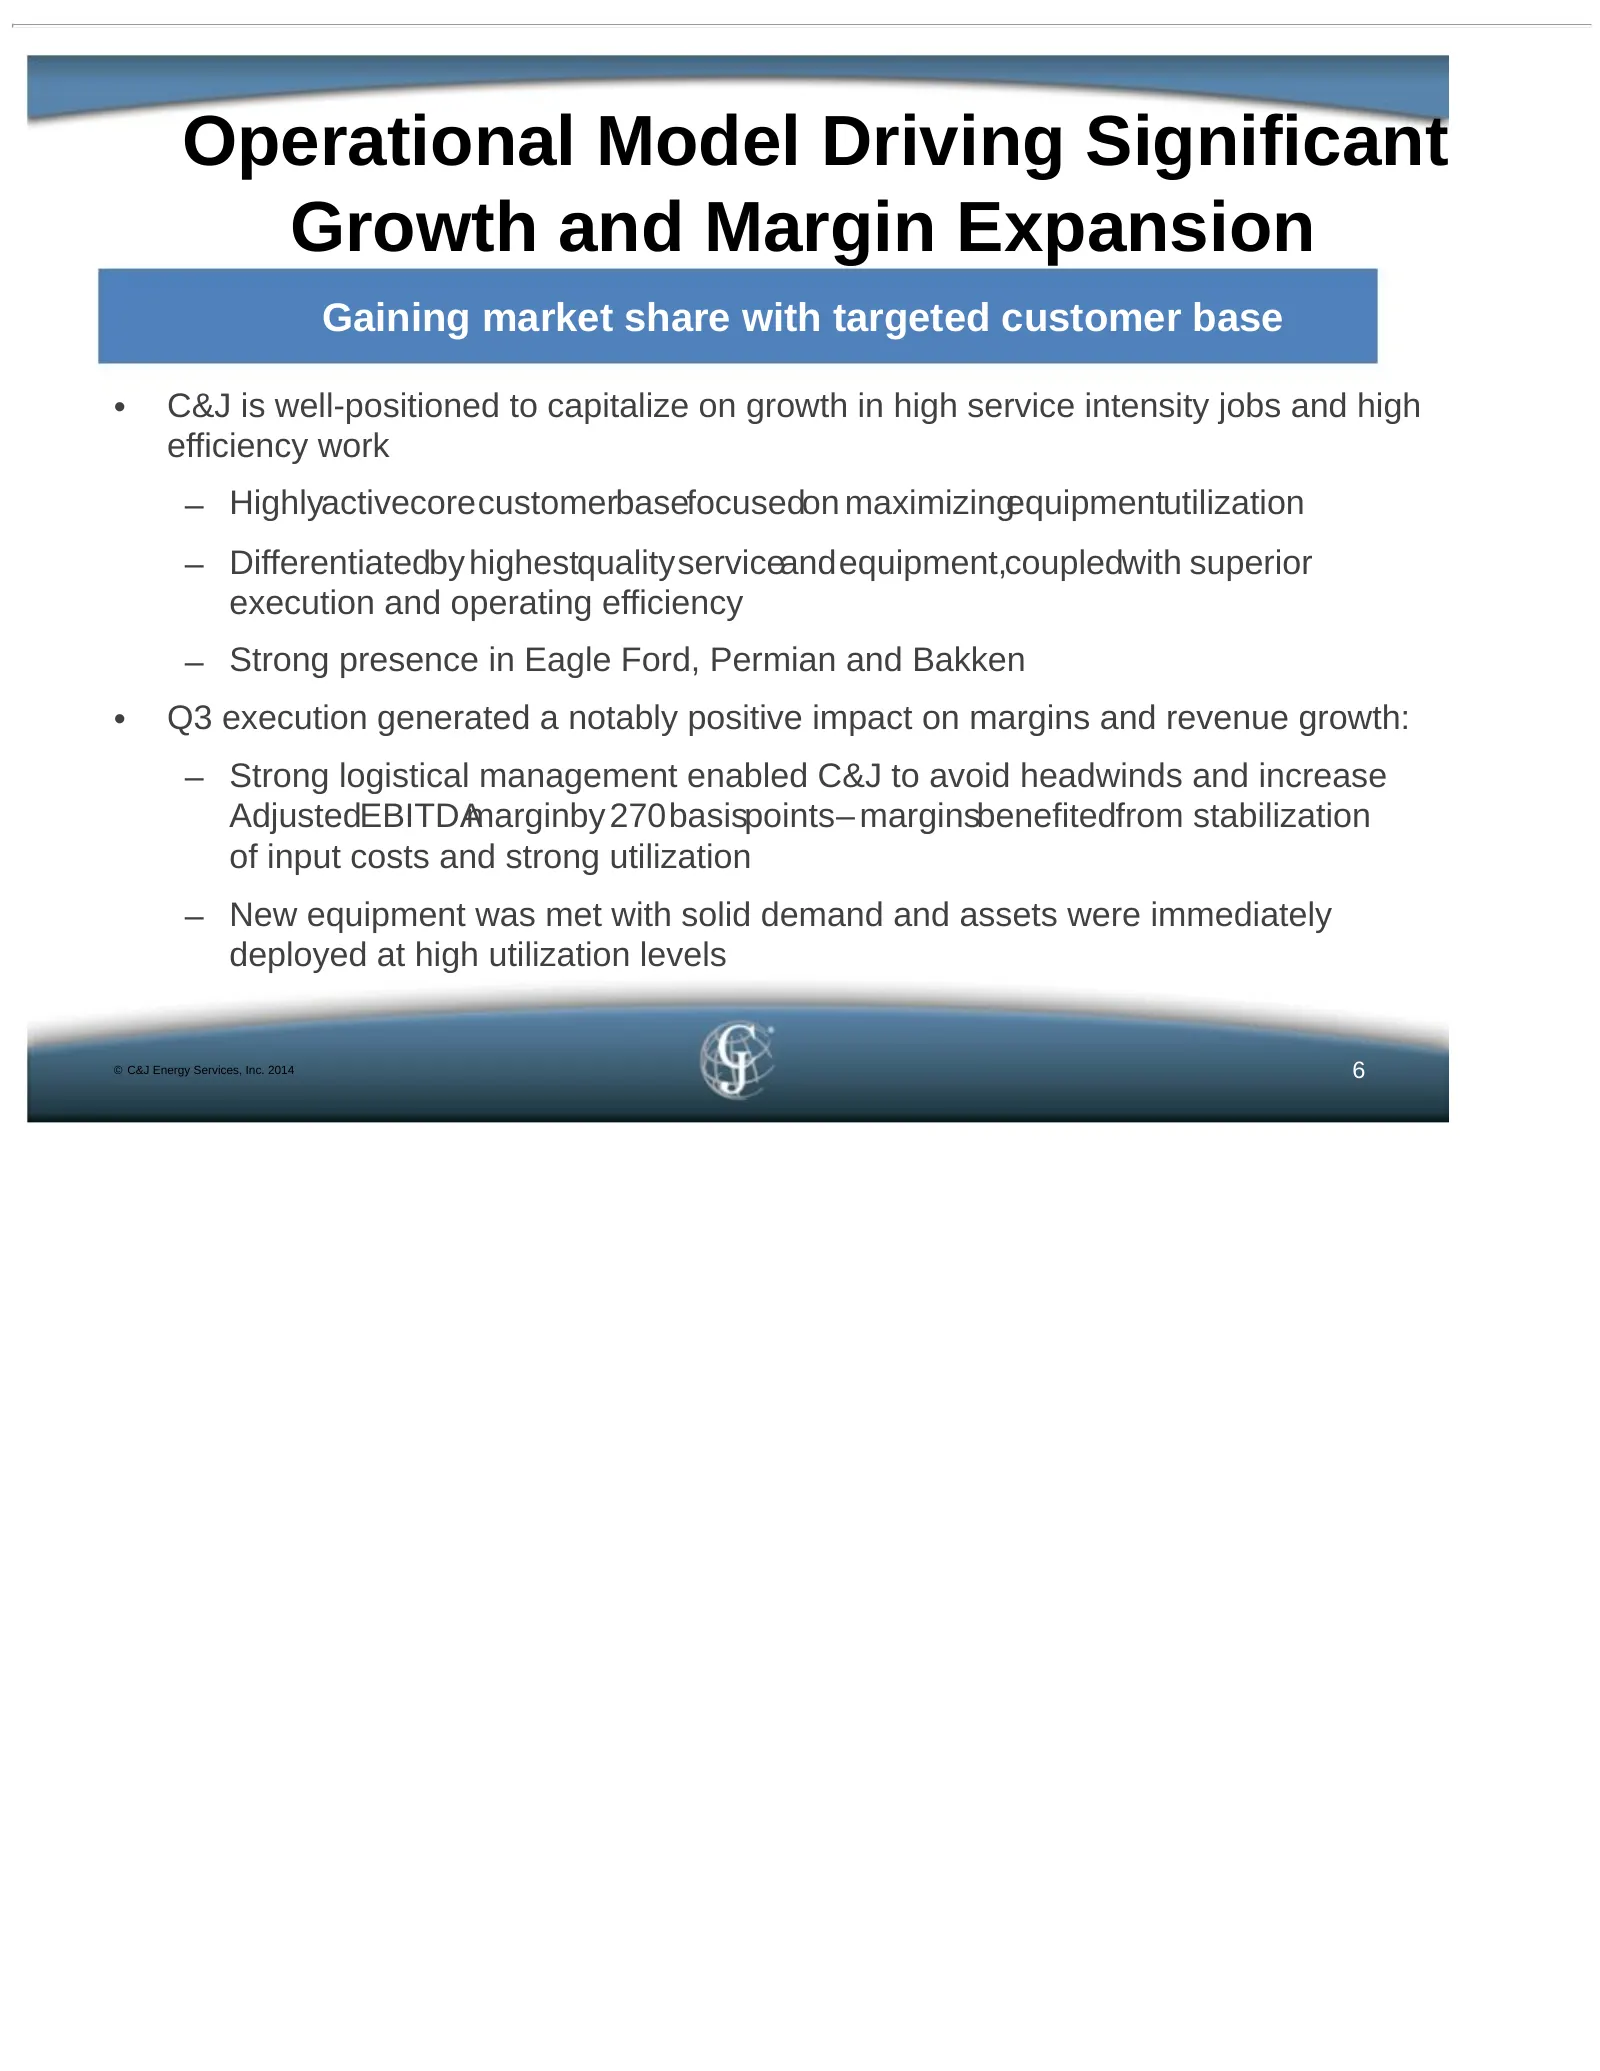
Operational Model Driving Significant Growth and Margin Expansion Gaining market share with targeted customer base • C&J is well-positioned to capitalize on growth in high service intensity jobs and high efficiency work – Highlyactivecorecustomerbasefocusedon maximizingequipmentutilization – Differe
Slide 7: Operational Model Driving Significant Growth and Margin Expansion
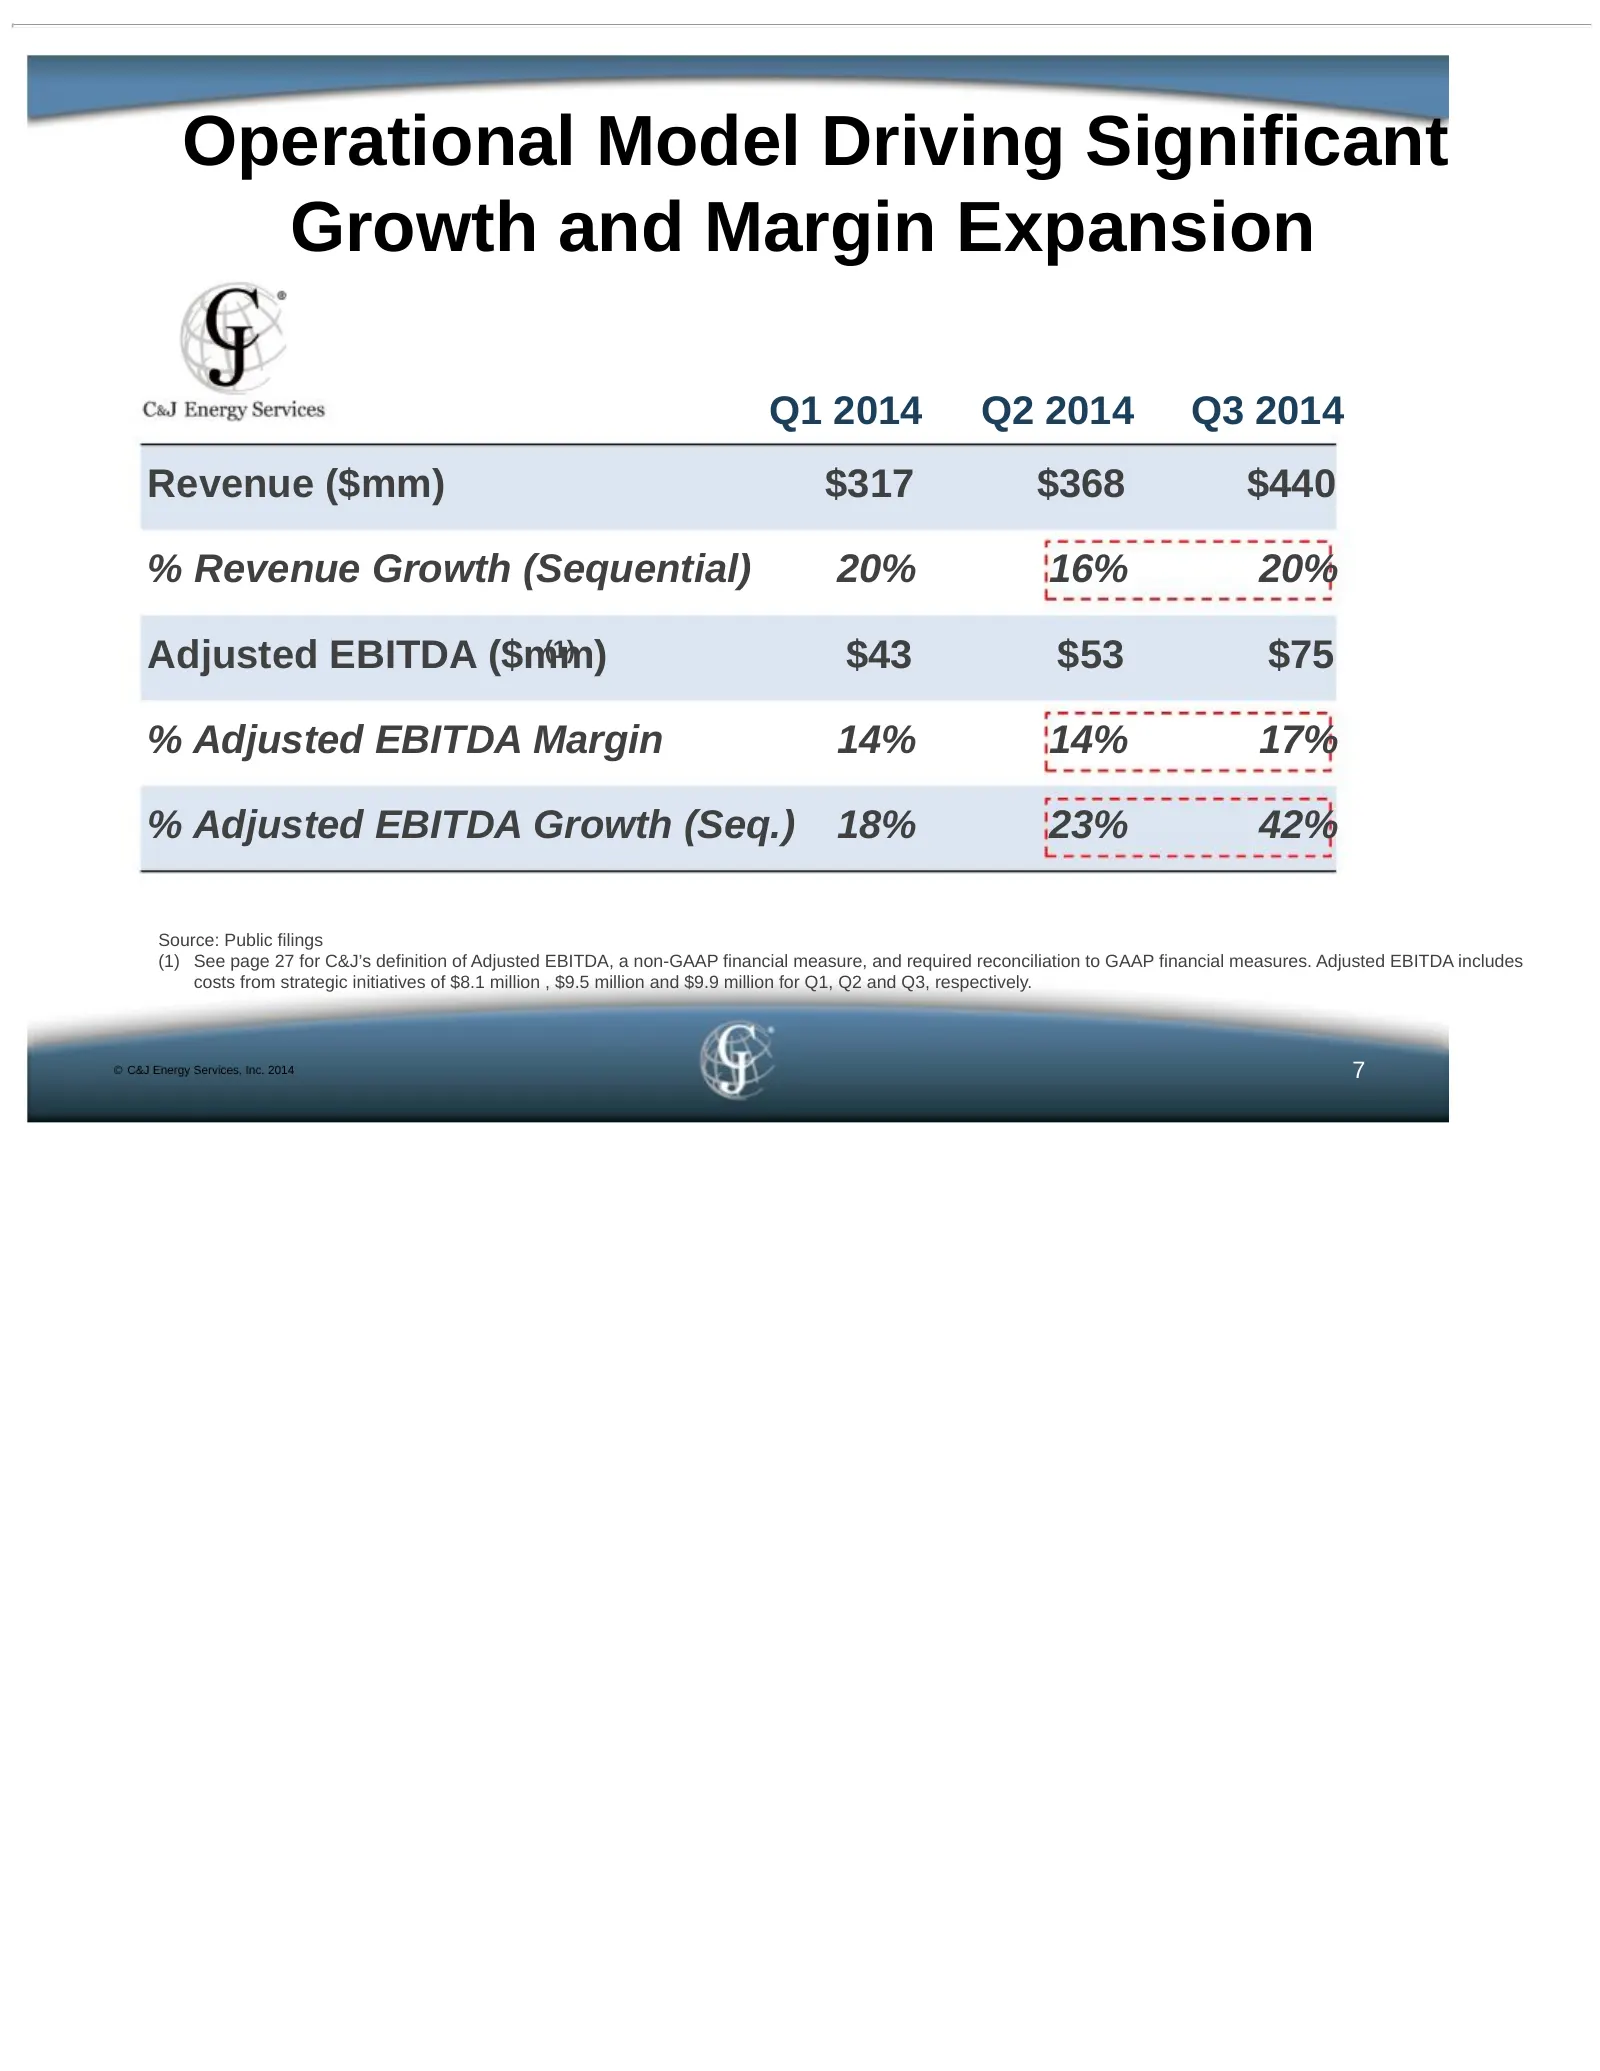
Operational Model Driving Significant Growth and Margin Expansion Q1 2014 Q2 2014 Q3 2014 Revenue ($mm) $317 $368 $440 % Revenue Growth (Sequential) 20% 16% 20% Adjusted EBITDA ($mm) (1) $43 $53 $75 % Adjusted EBITDA Margin 14% 14% 17% % Adjusted EBITDA Growth (Seq.) 18% 23% 42% Source: Public filin
Slide 8: Overview of Nabors Transaction
Overview of Nabors Transaction © C&J Energy Services, Inc. 2014
Slide 9: The Combined Company
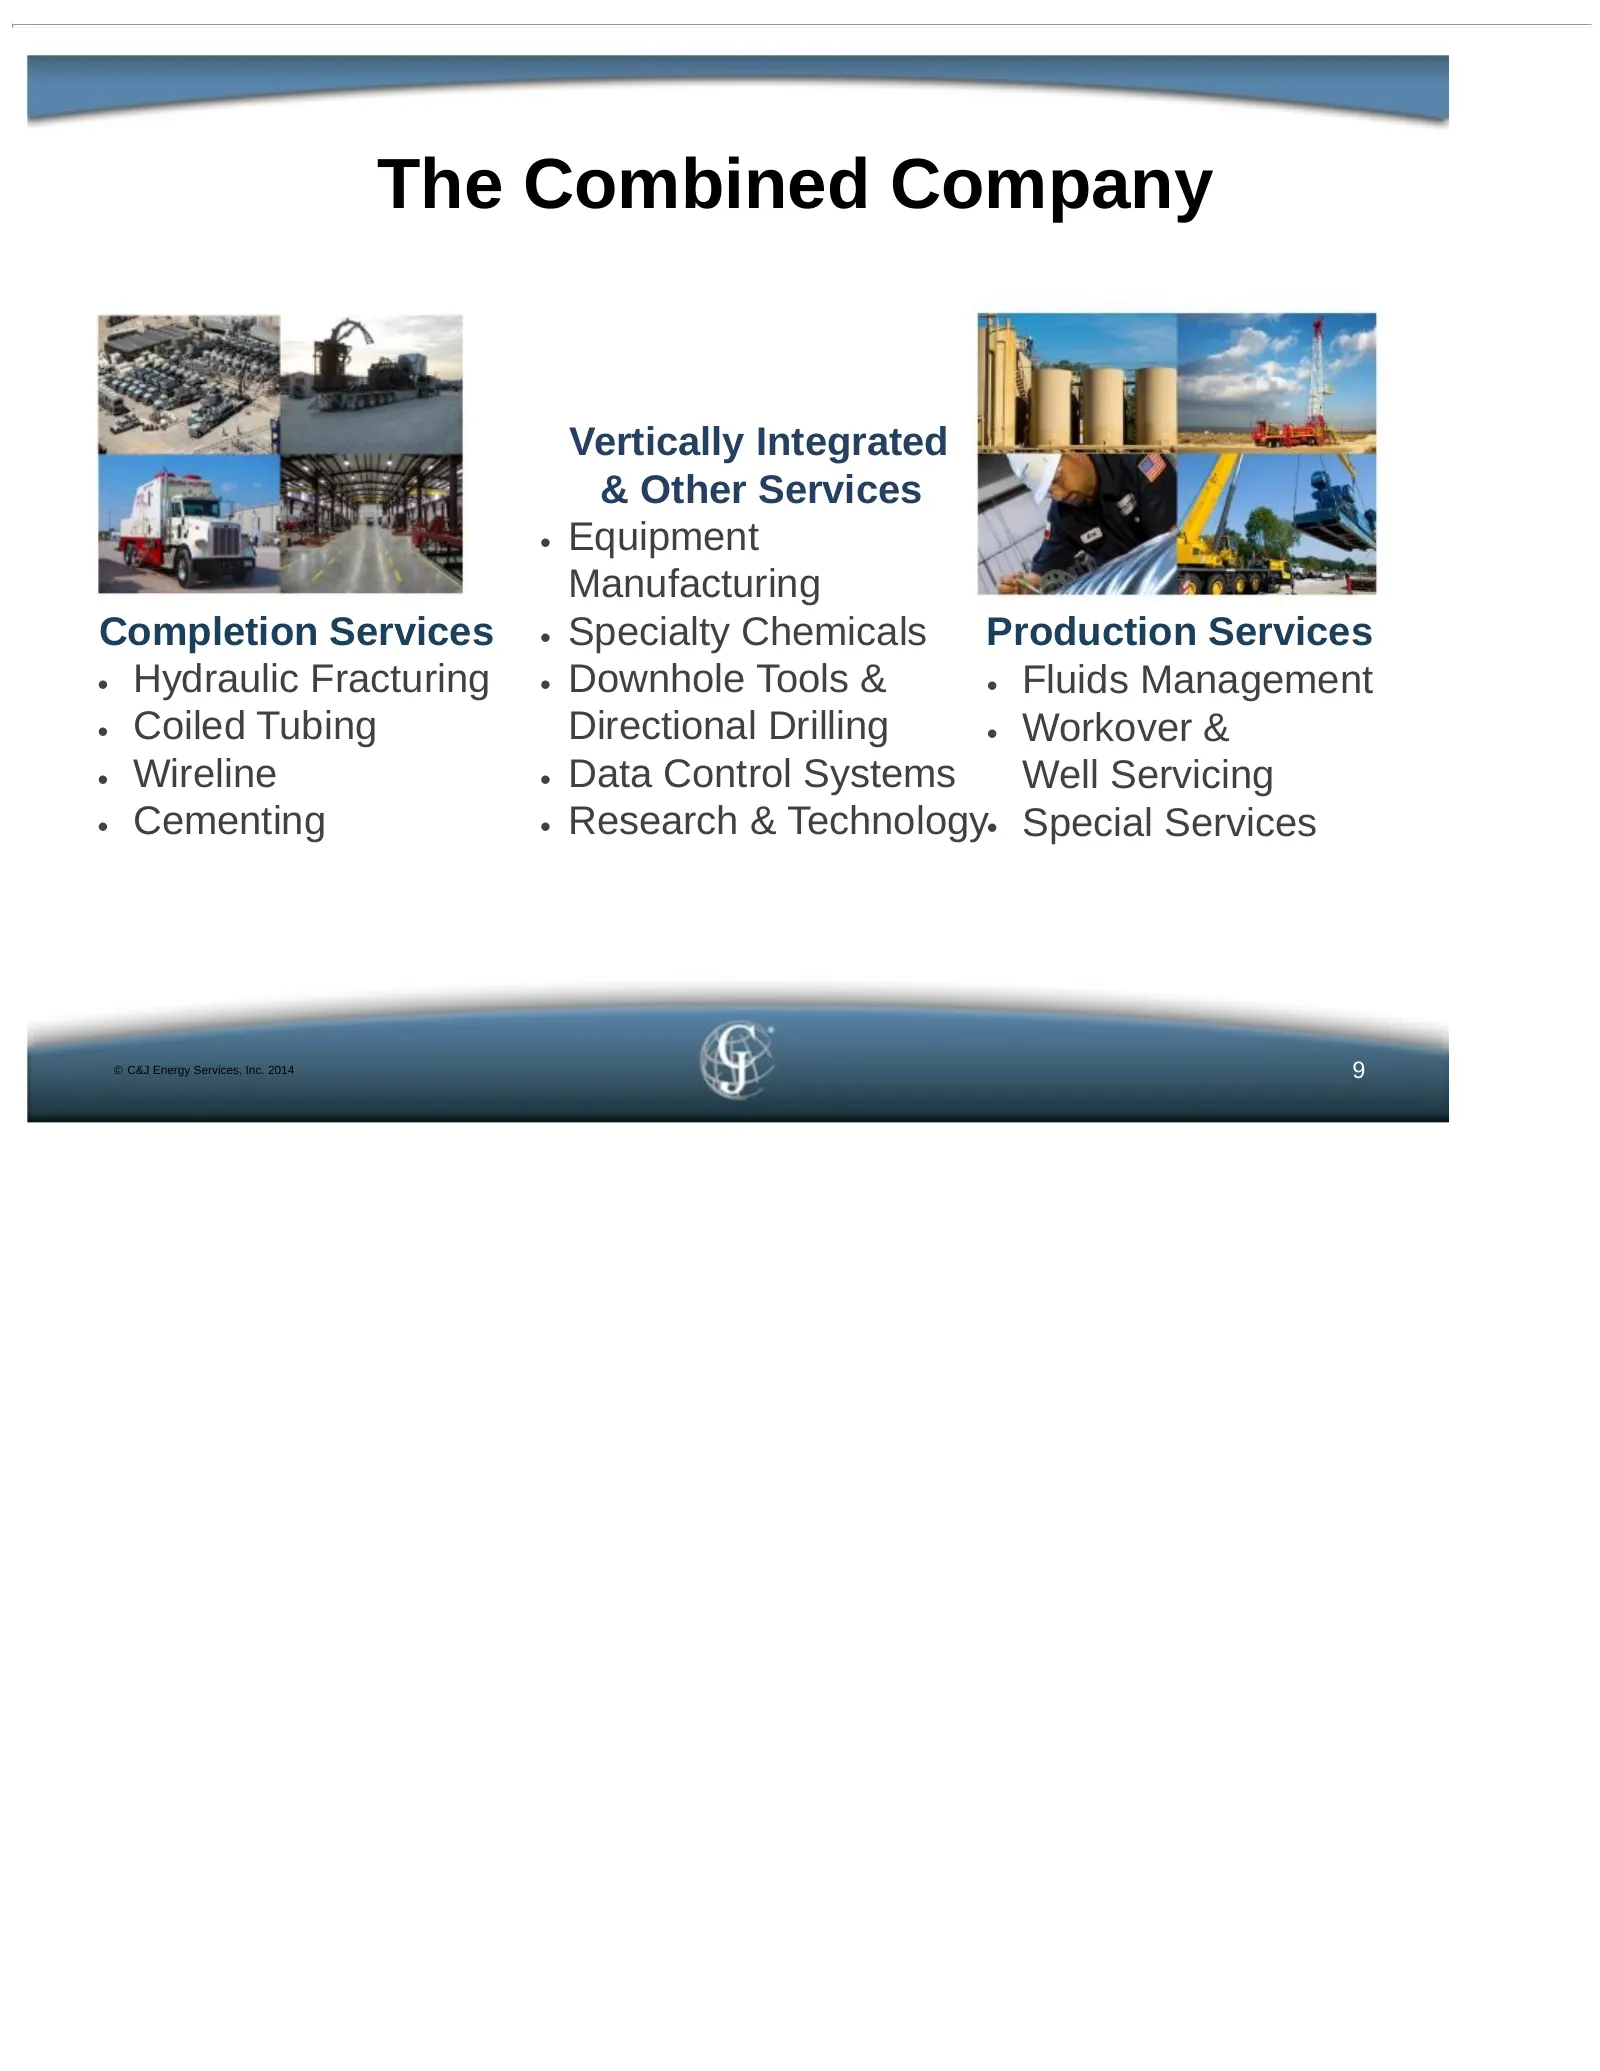
The Combined Company Vertically Integrated & Other Services • Equipment Manufacturing Completion Services • Specialty Chemicals Production Services • Hydraulic Fracturing • Downhole Tools & • Fluids Management • Coiled Tubing Directional Drilling • Workover & • Wireline • Data Control Systems Well S
Slide 10: A Powerful Combination of Complementary Businesses
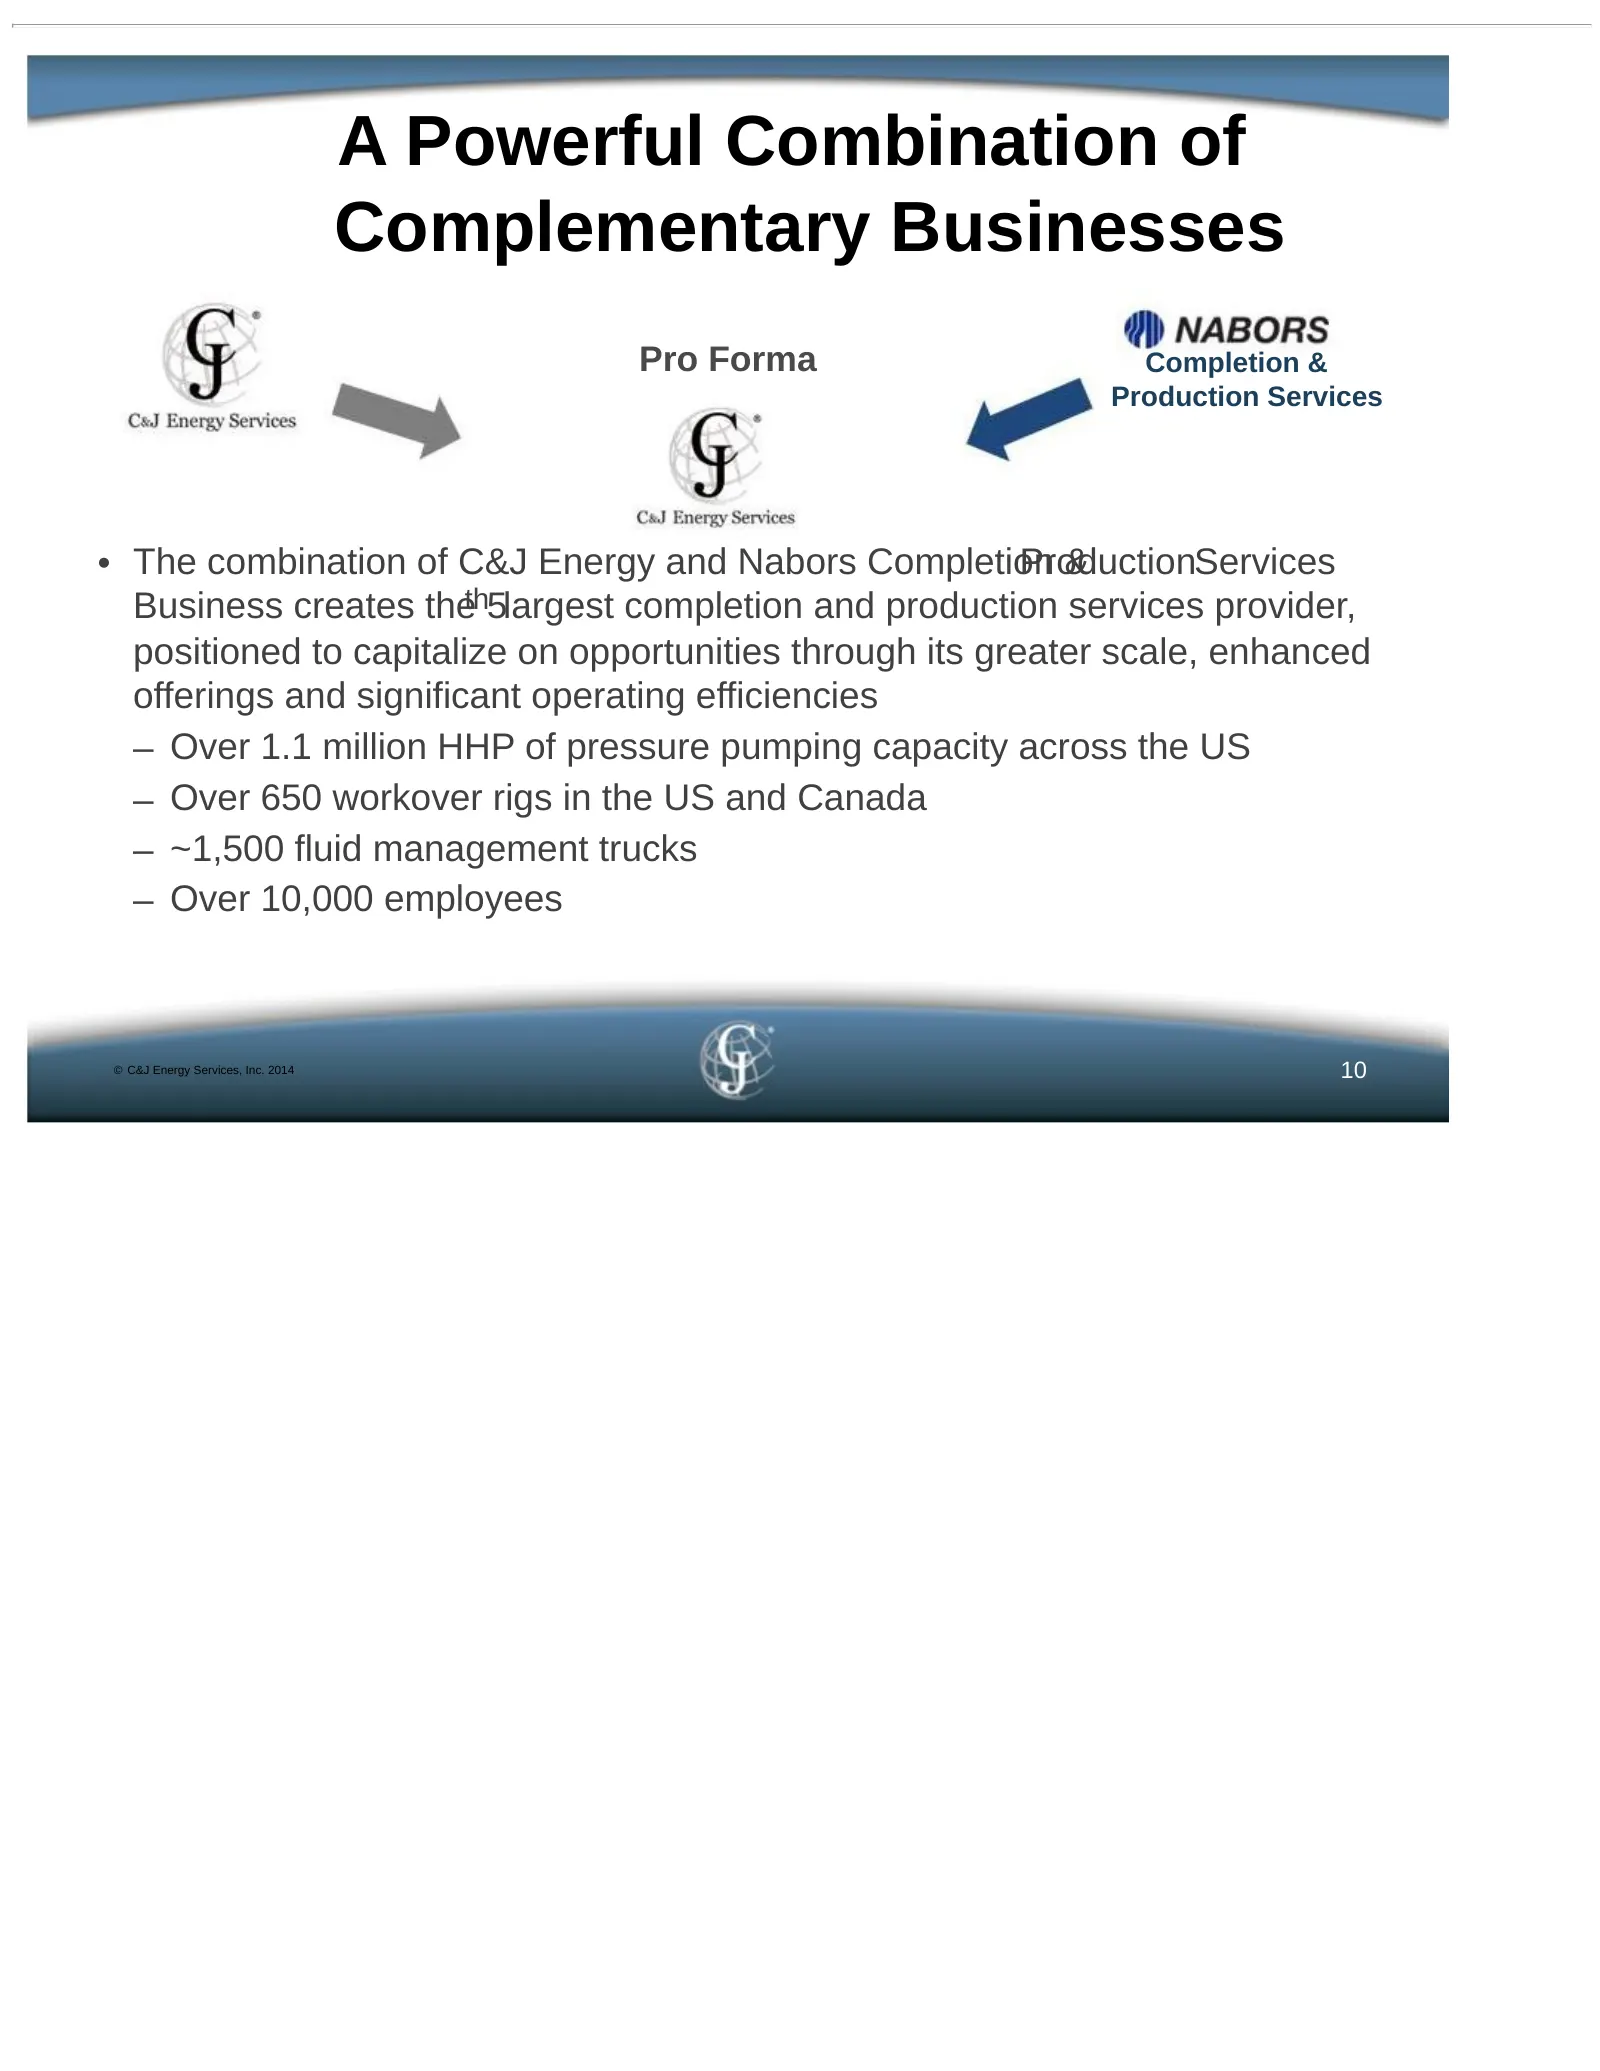
A Powerful Combination of Complementary Businesses Pro Forma Completion & Production Services • The combination of C&J Energy and Nabors Completion ProductionServices & Business creates theth5largest completion and production services provider, positioned to capitalize on opportunities through its g
Slide 11: Compelling Financial Benefits for Shareholders of Both Companies
Compelling Financial Benefits for Shareholders of Both Companies • Transaction expected to be accretive to C&J Energy's cash earnings for the first full year of combined operations • Annual run-rate synergies of more than $100 million are expected to be fully realized by 2017 • Combined company reta
Slide 12: Strategic Rationale
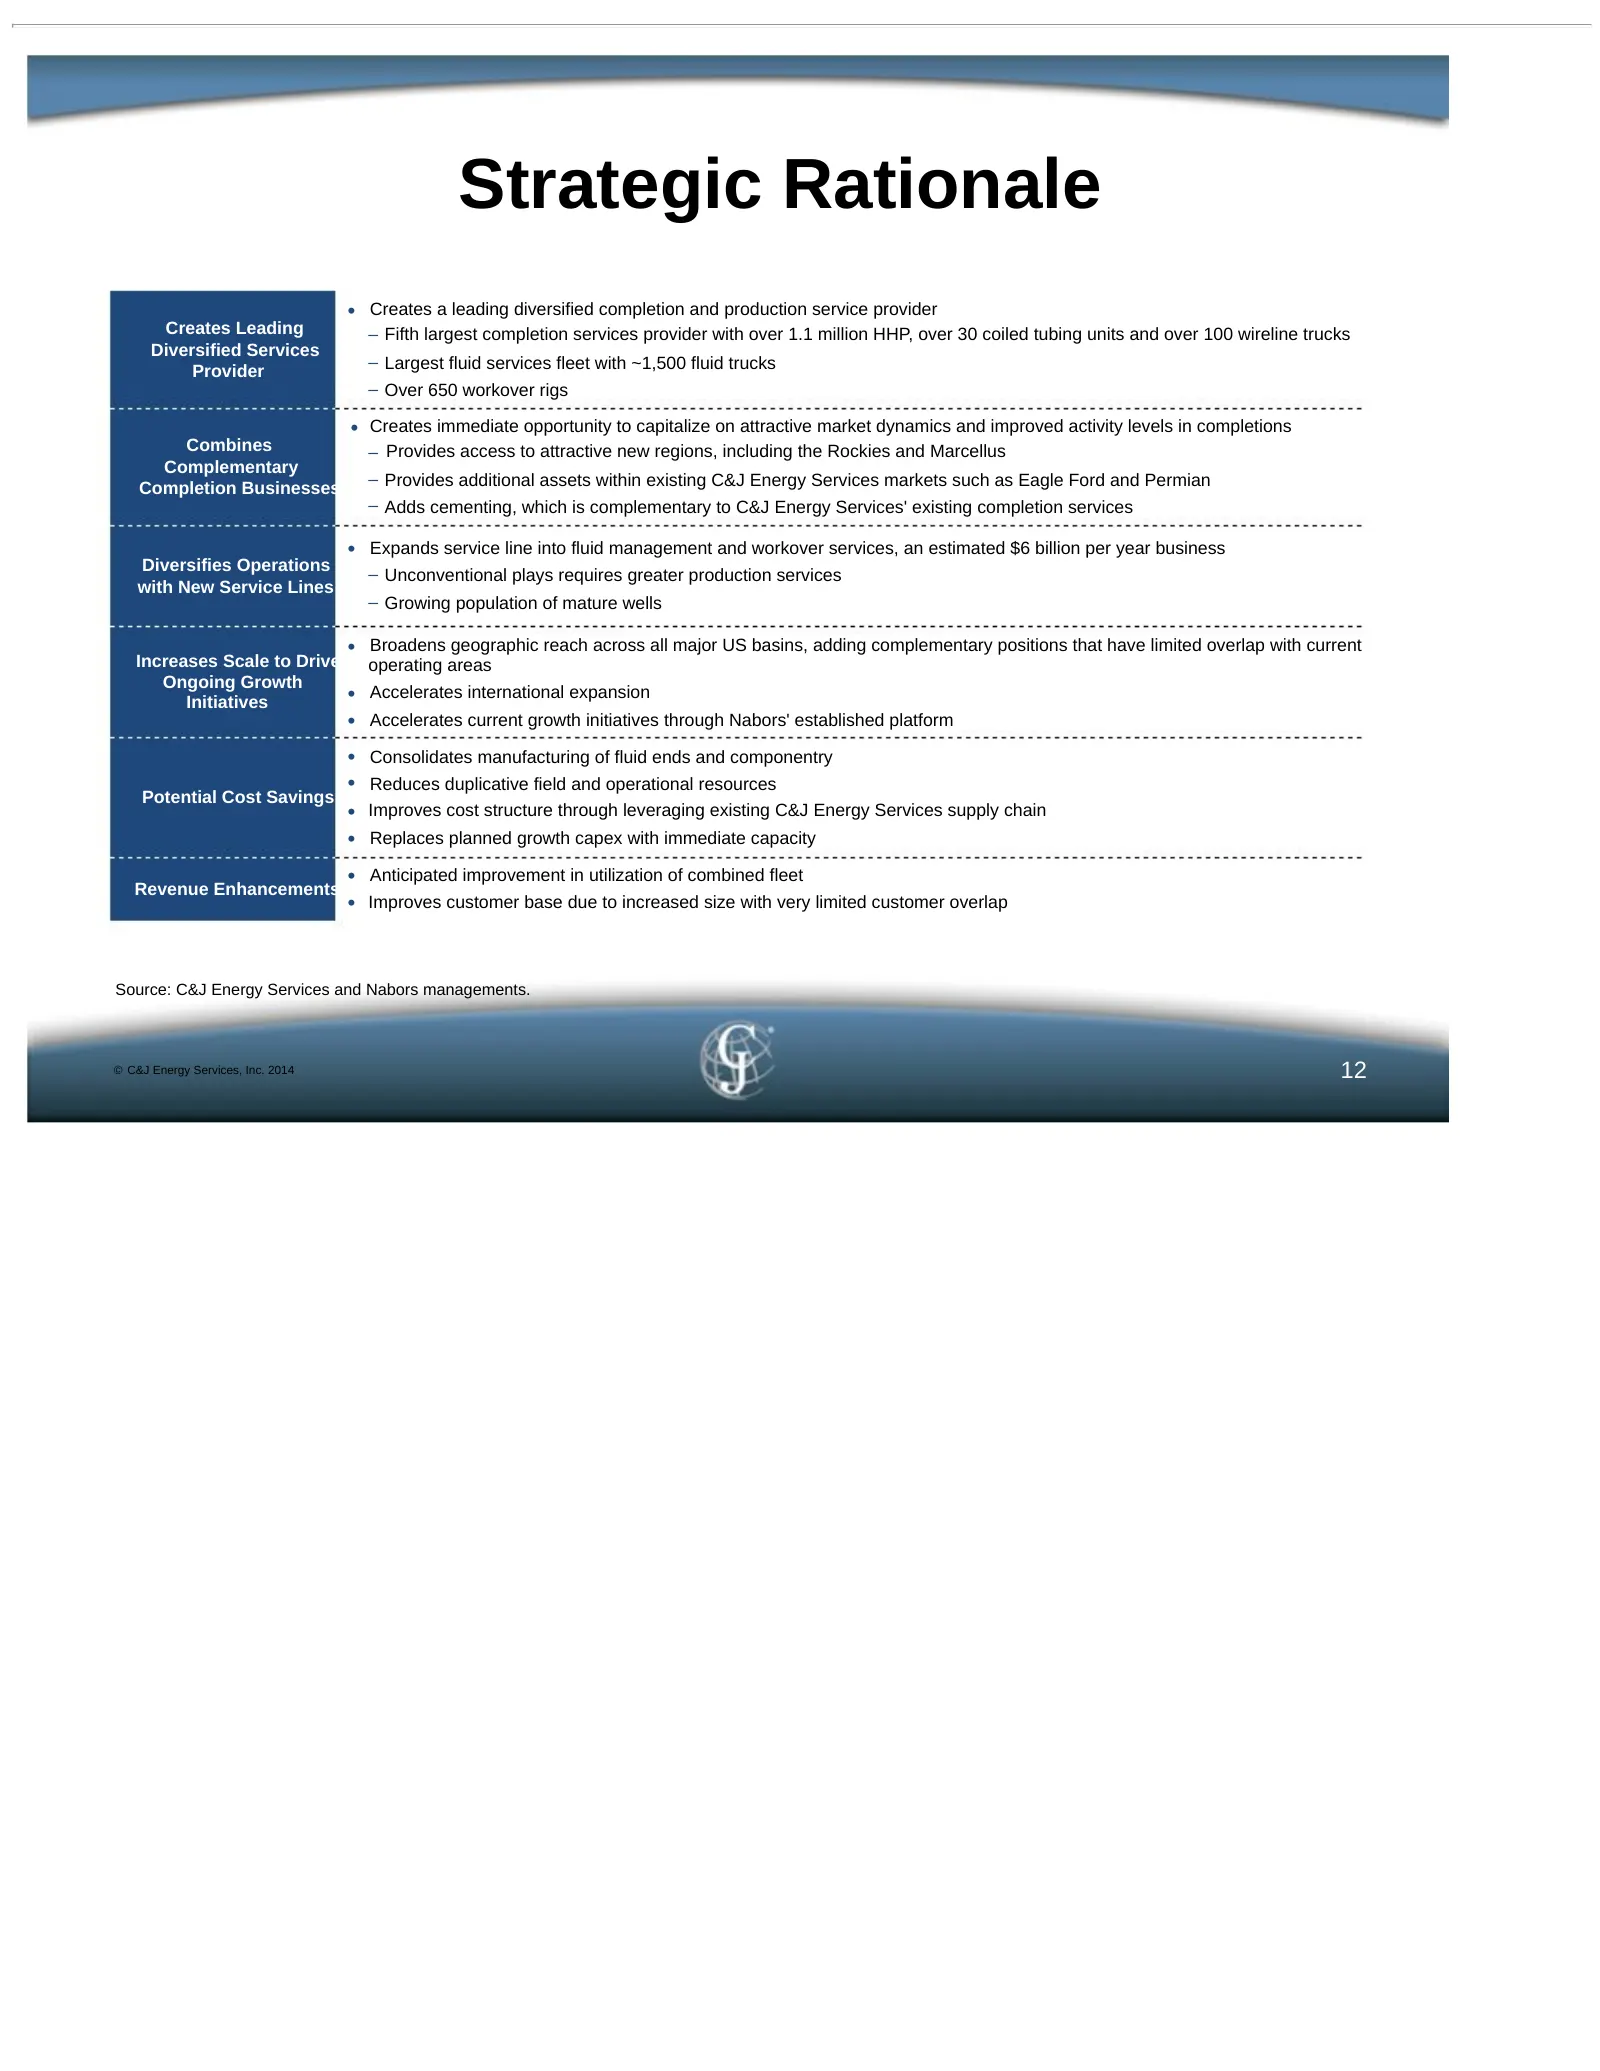
Strategic Rationale • Creates a leading diversified completion and production service provider Creates Leading – Fifth largest completion services provider with over 1.1 million HHP, over 30 coiled tubing units and over 100 wireline trucks Diversified Services – Largest fluid services fleet with ~1,
Slide 13: Acceleration of Long-Term Growth Strategy
Acceleration of Long-Term Growth Strategy • Ability to implement C&J’s targeted approach across larger asset base by deploying completion equipment to highly active customers to maximize utilization and profitability • Diversifies product and service offerings to serve customers better • Strengthens
Slide 14: A Combination of Two Premium Oilfield Service Providers
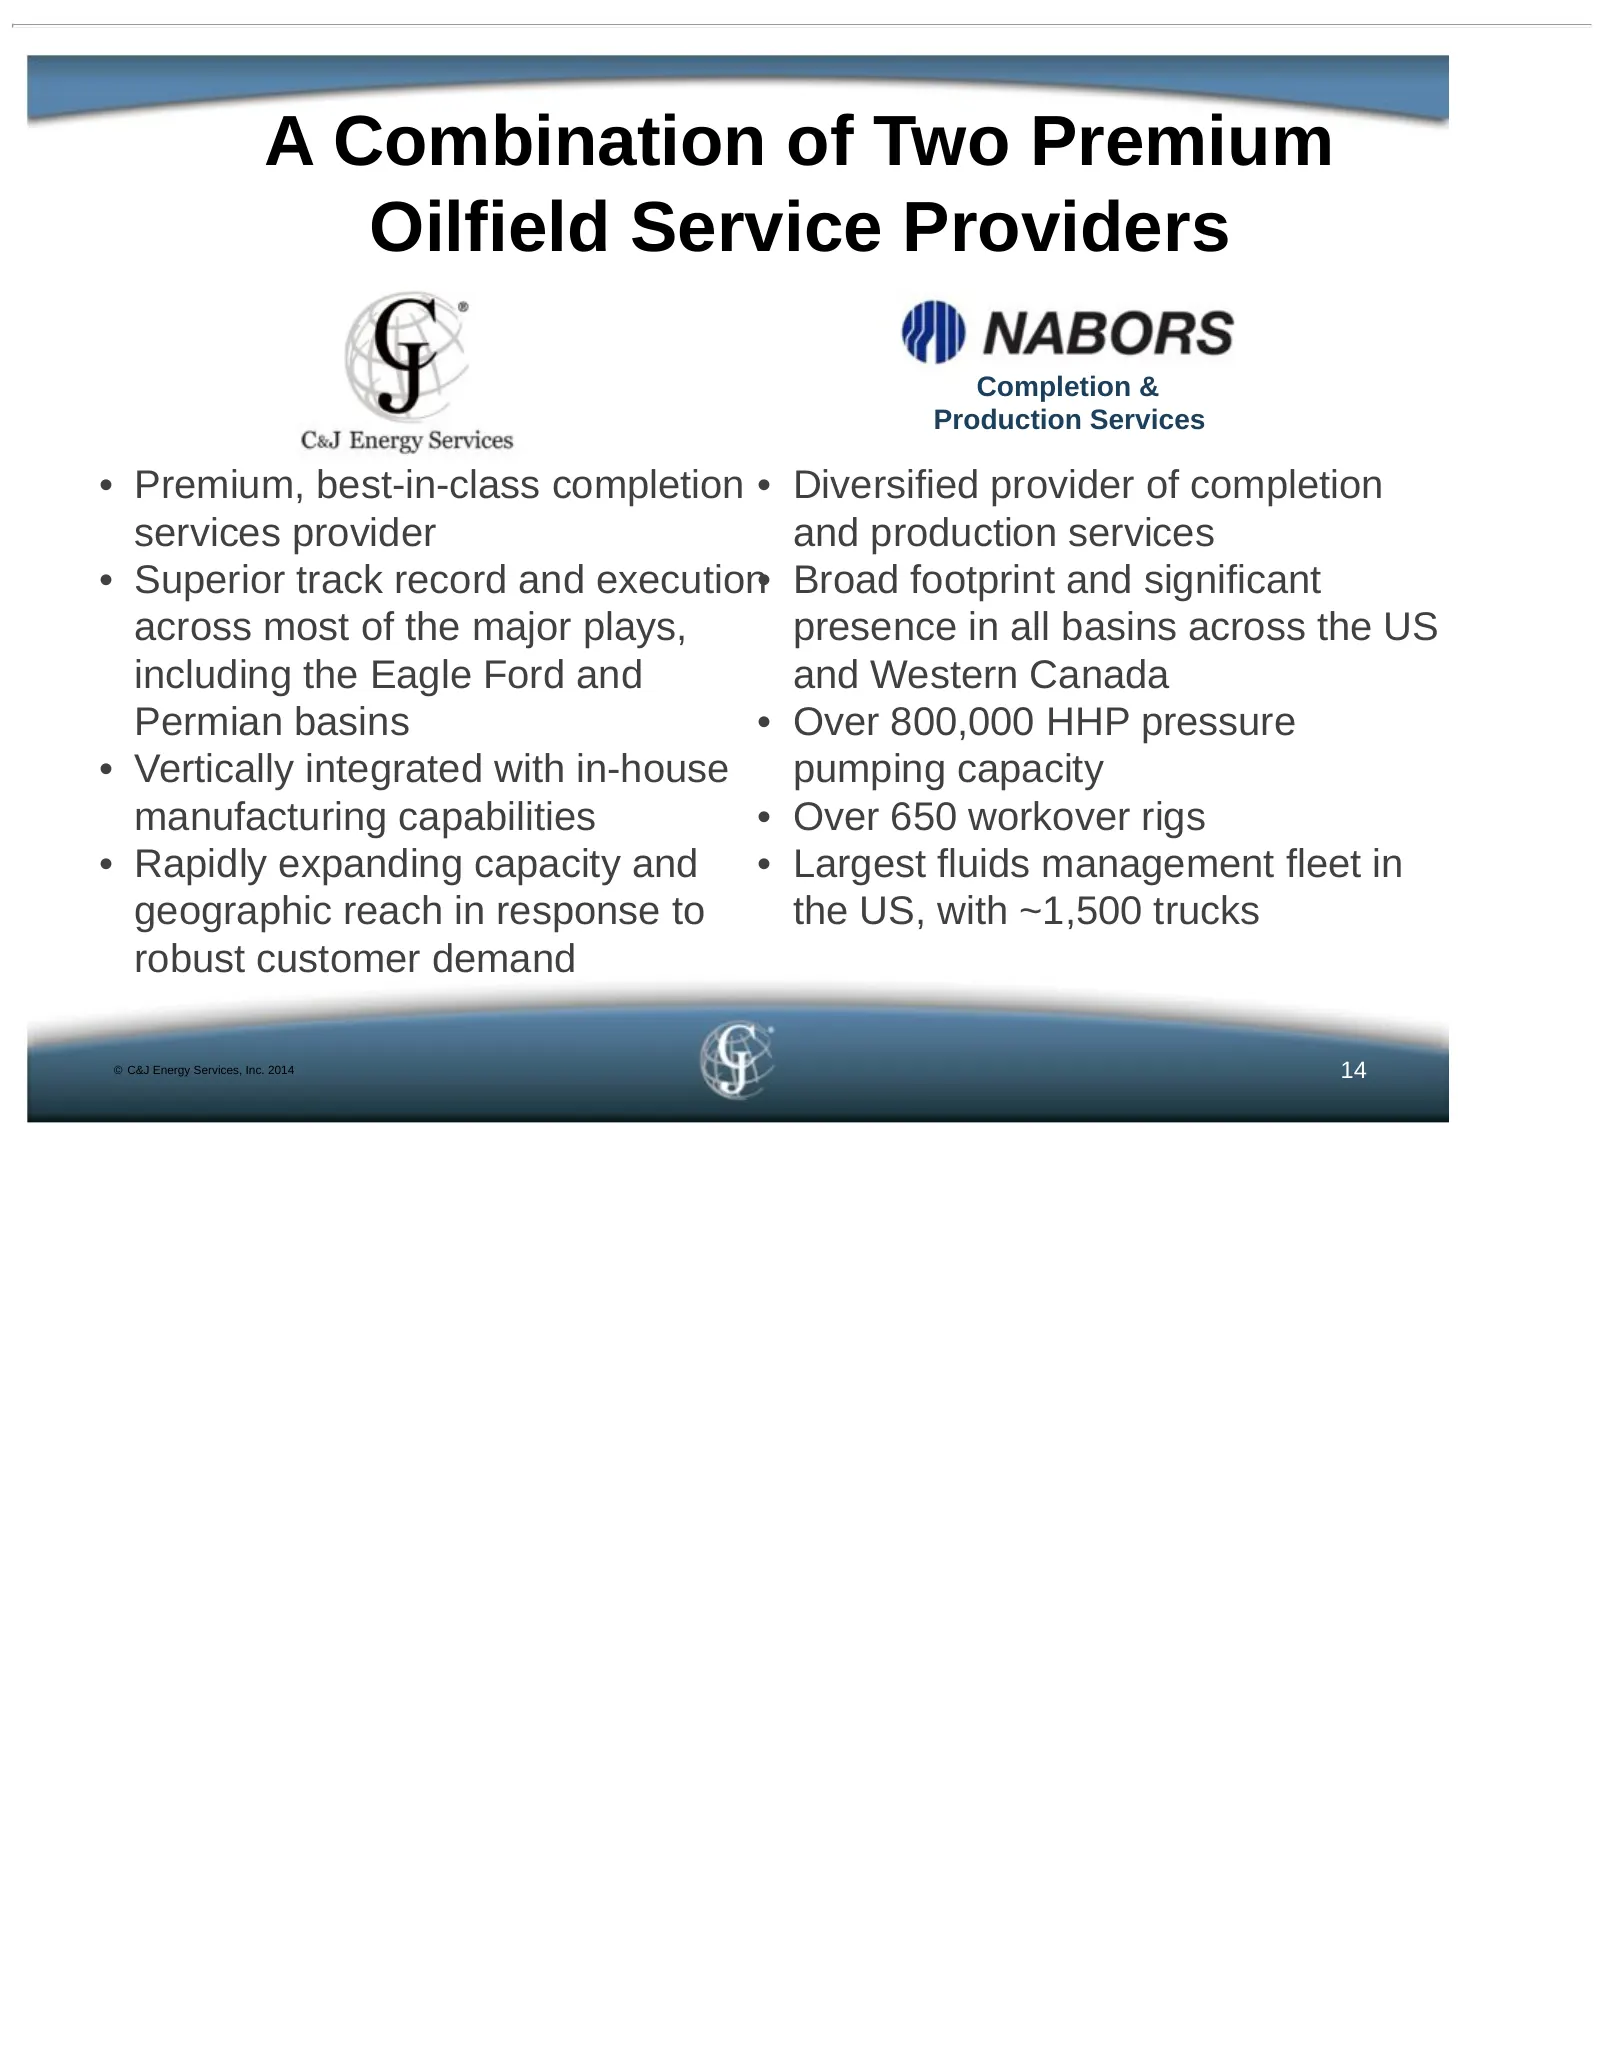
A Combination of Two Premium Oilfield Service Providers Completion & Production Services • Premium, best-in-class completion • Diversified provider of completion services provider and production services • Superior track record and execution• Broad footprint and significant across most of the major
Slide 15: Combination Broadens Reach to Most of the Major US Basins and Canada
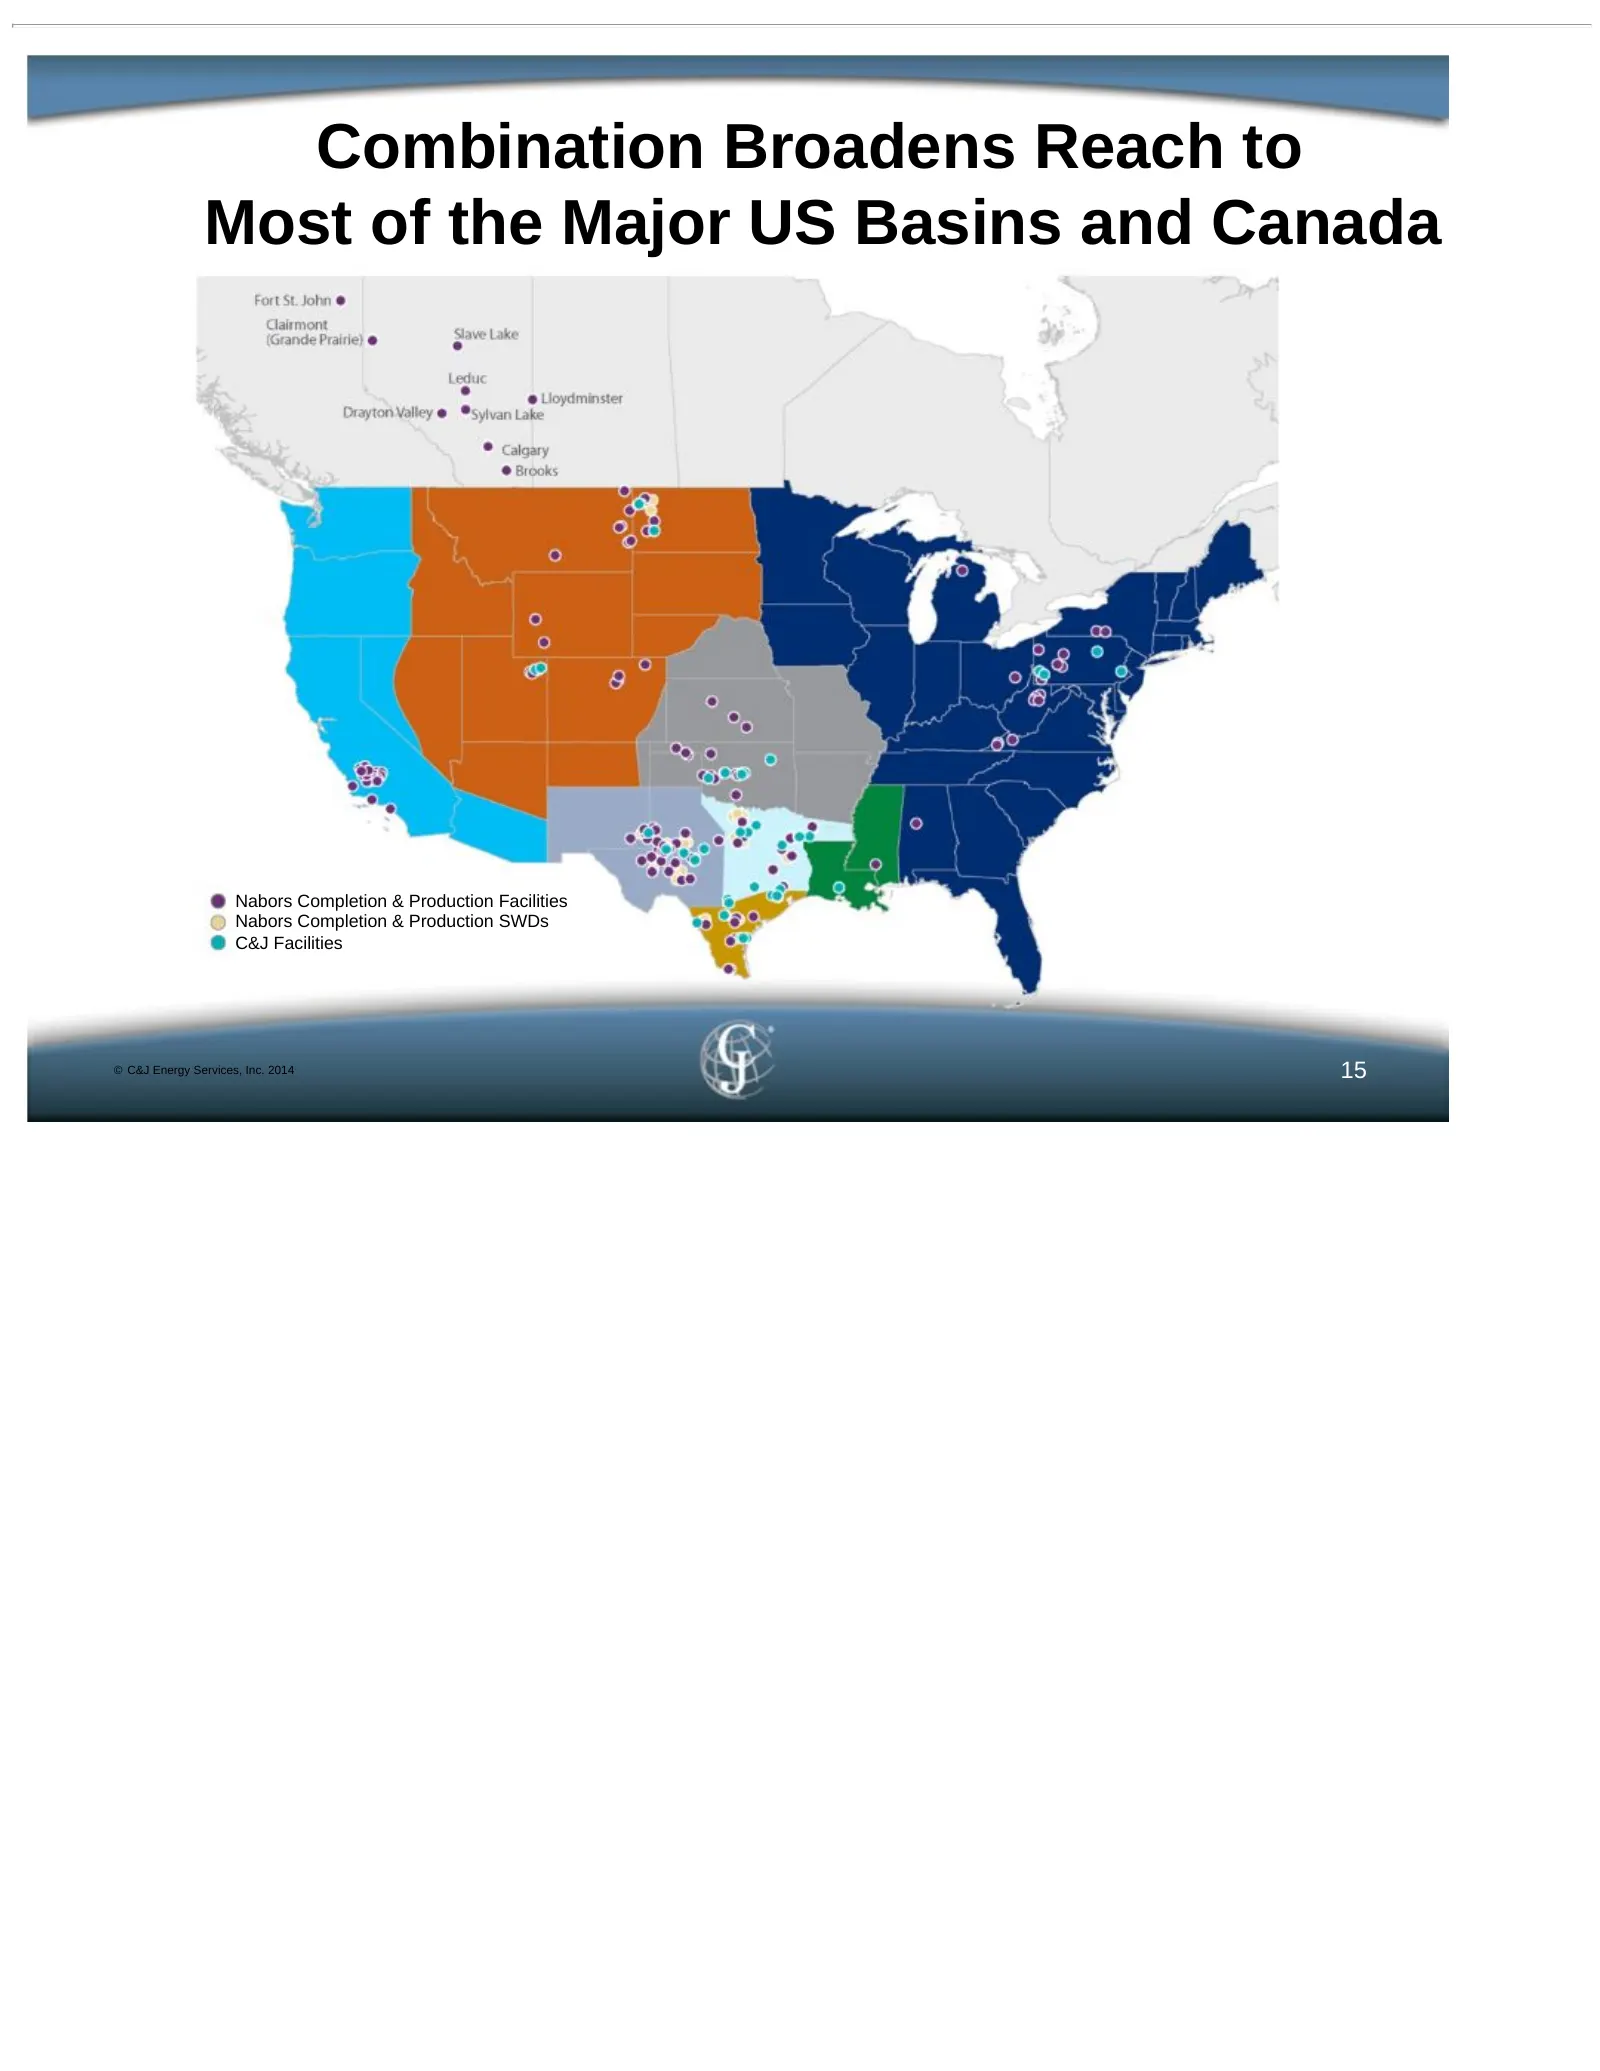
Combination Broadens Reach to Most of the Major US Basins and Canada Nabors Completion & Production Facilities Nabors Completion & Production SWDs C&J Facilities © C&J Energy Services, Inc. 2014 15
Slide 16: Transaction Overview
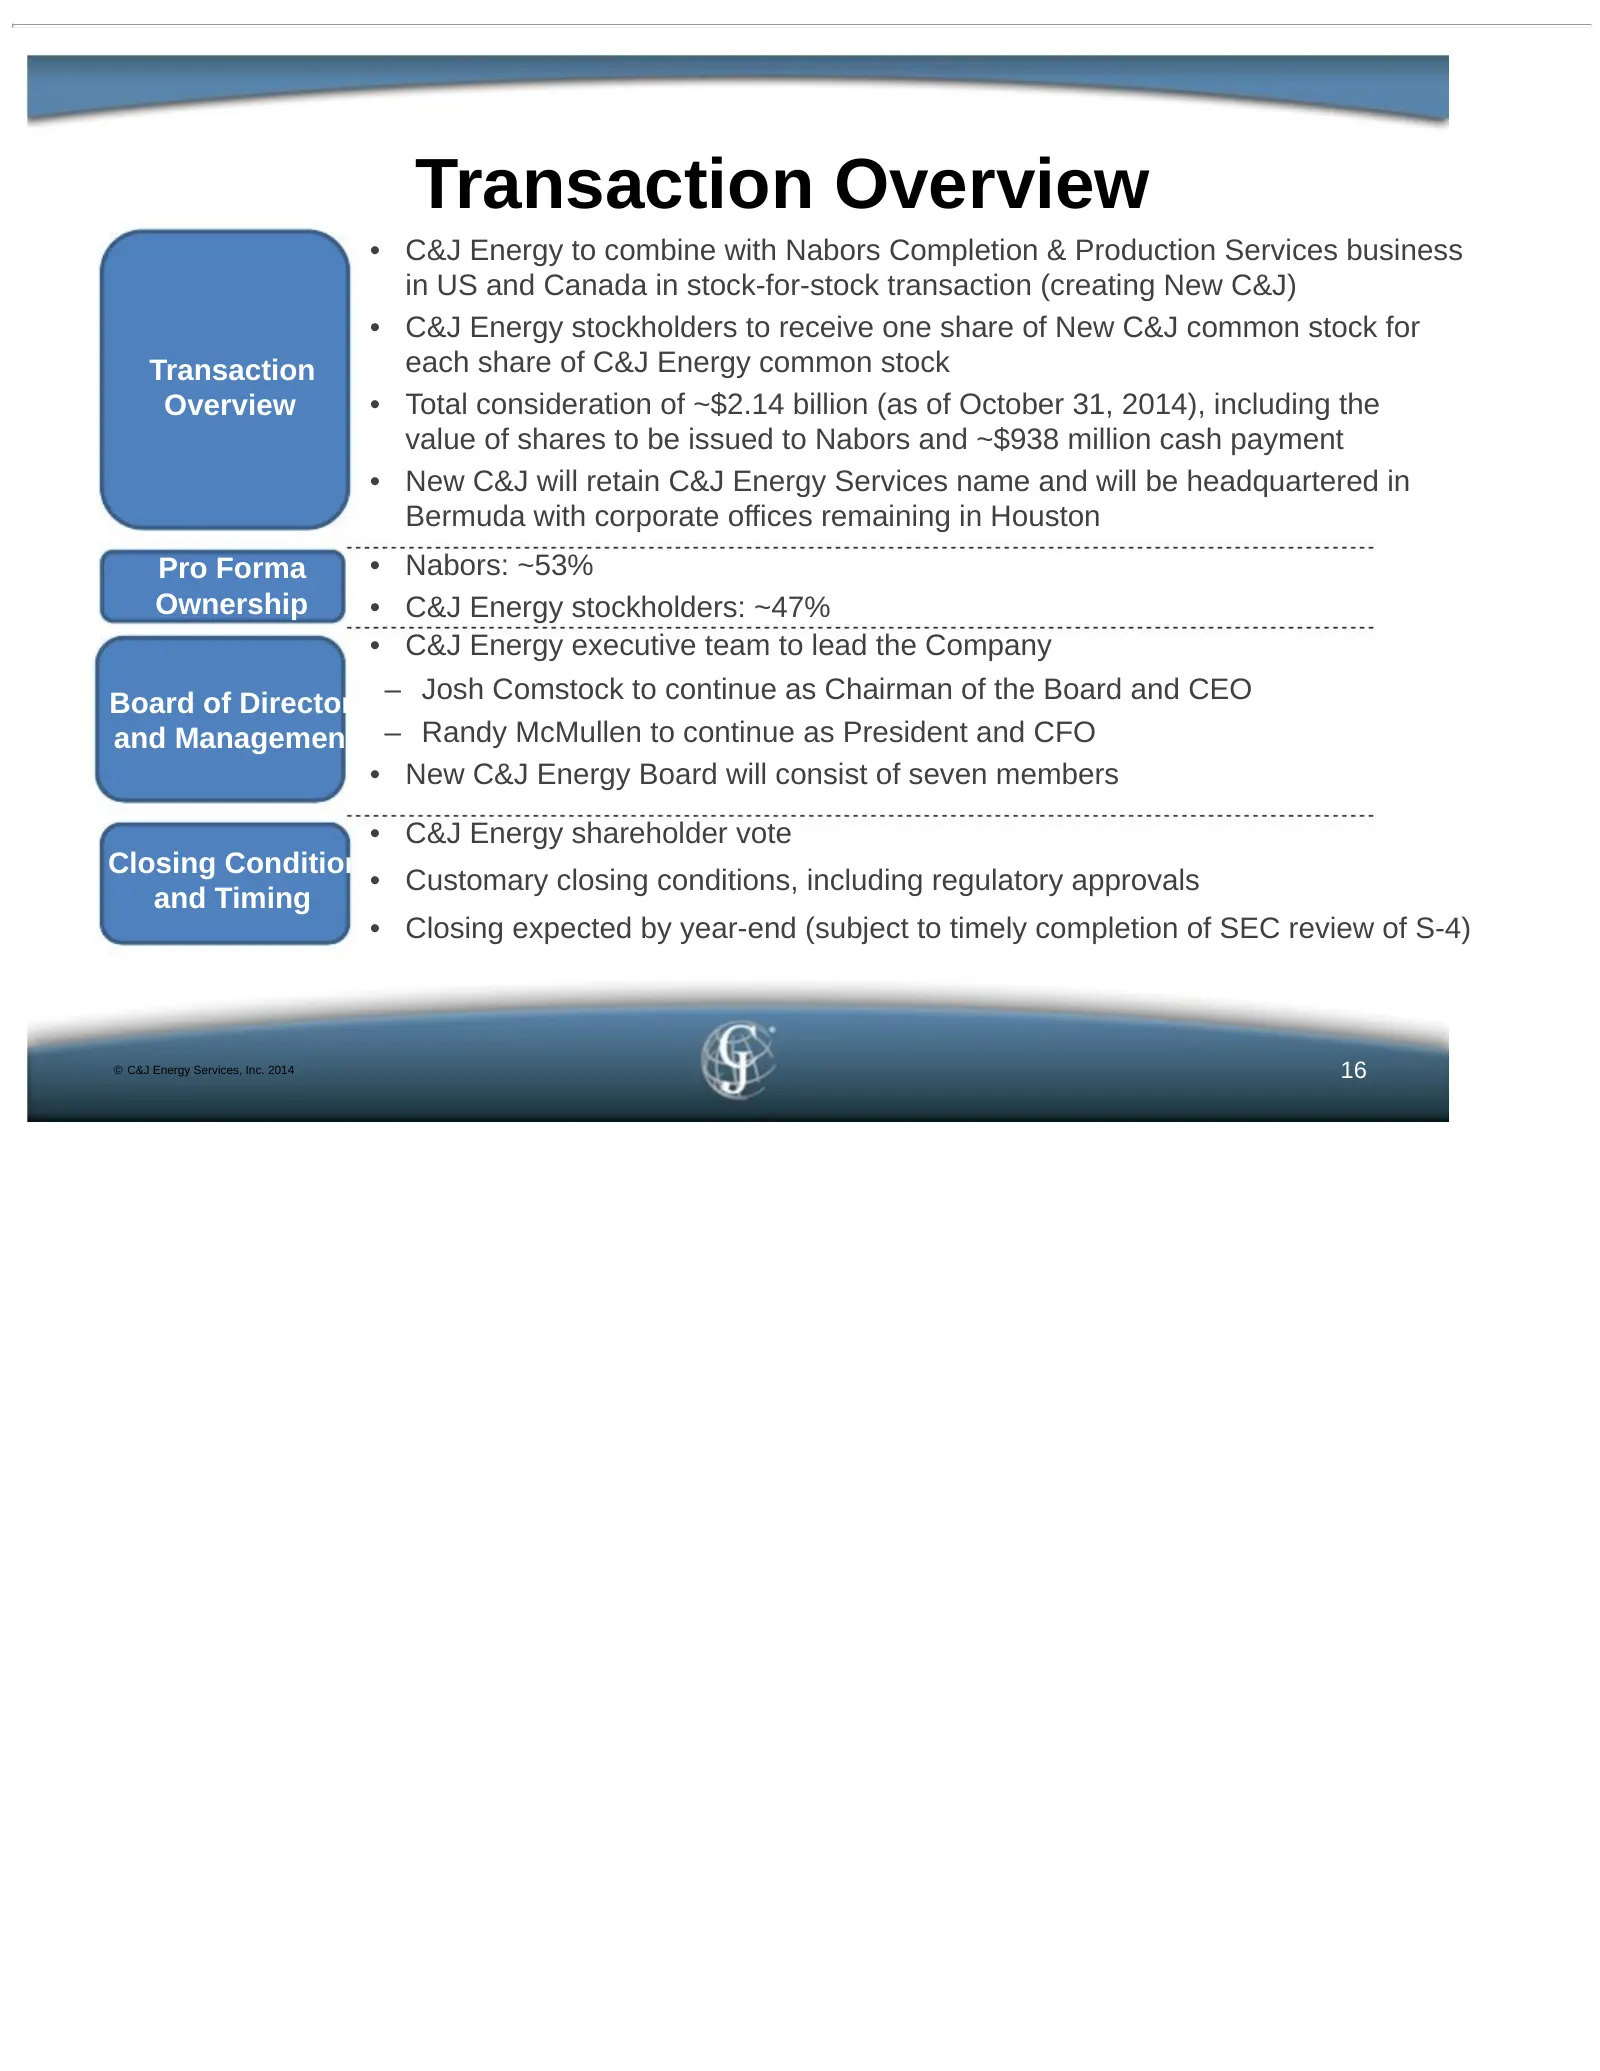
Transaction Overview • C&J Energy to combine with Nabors Completion & Production Services business in US and Canada in stock-for-stock transaction (creating New C&J) • C&J Energy stockholders to receive one share of New C&J common stock for Transaction each share of C&J Energy common stock Overview
Slide 17: Transaction Structure
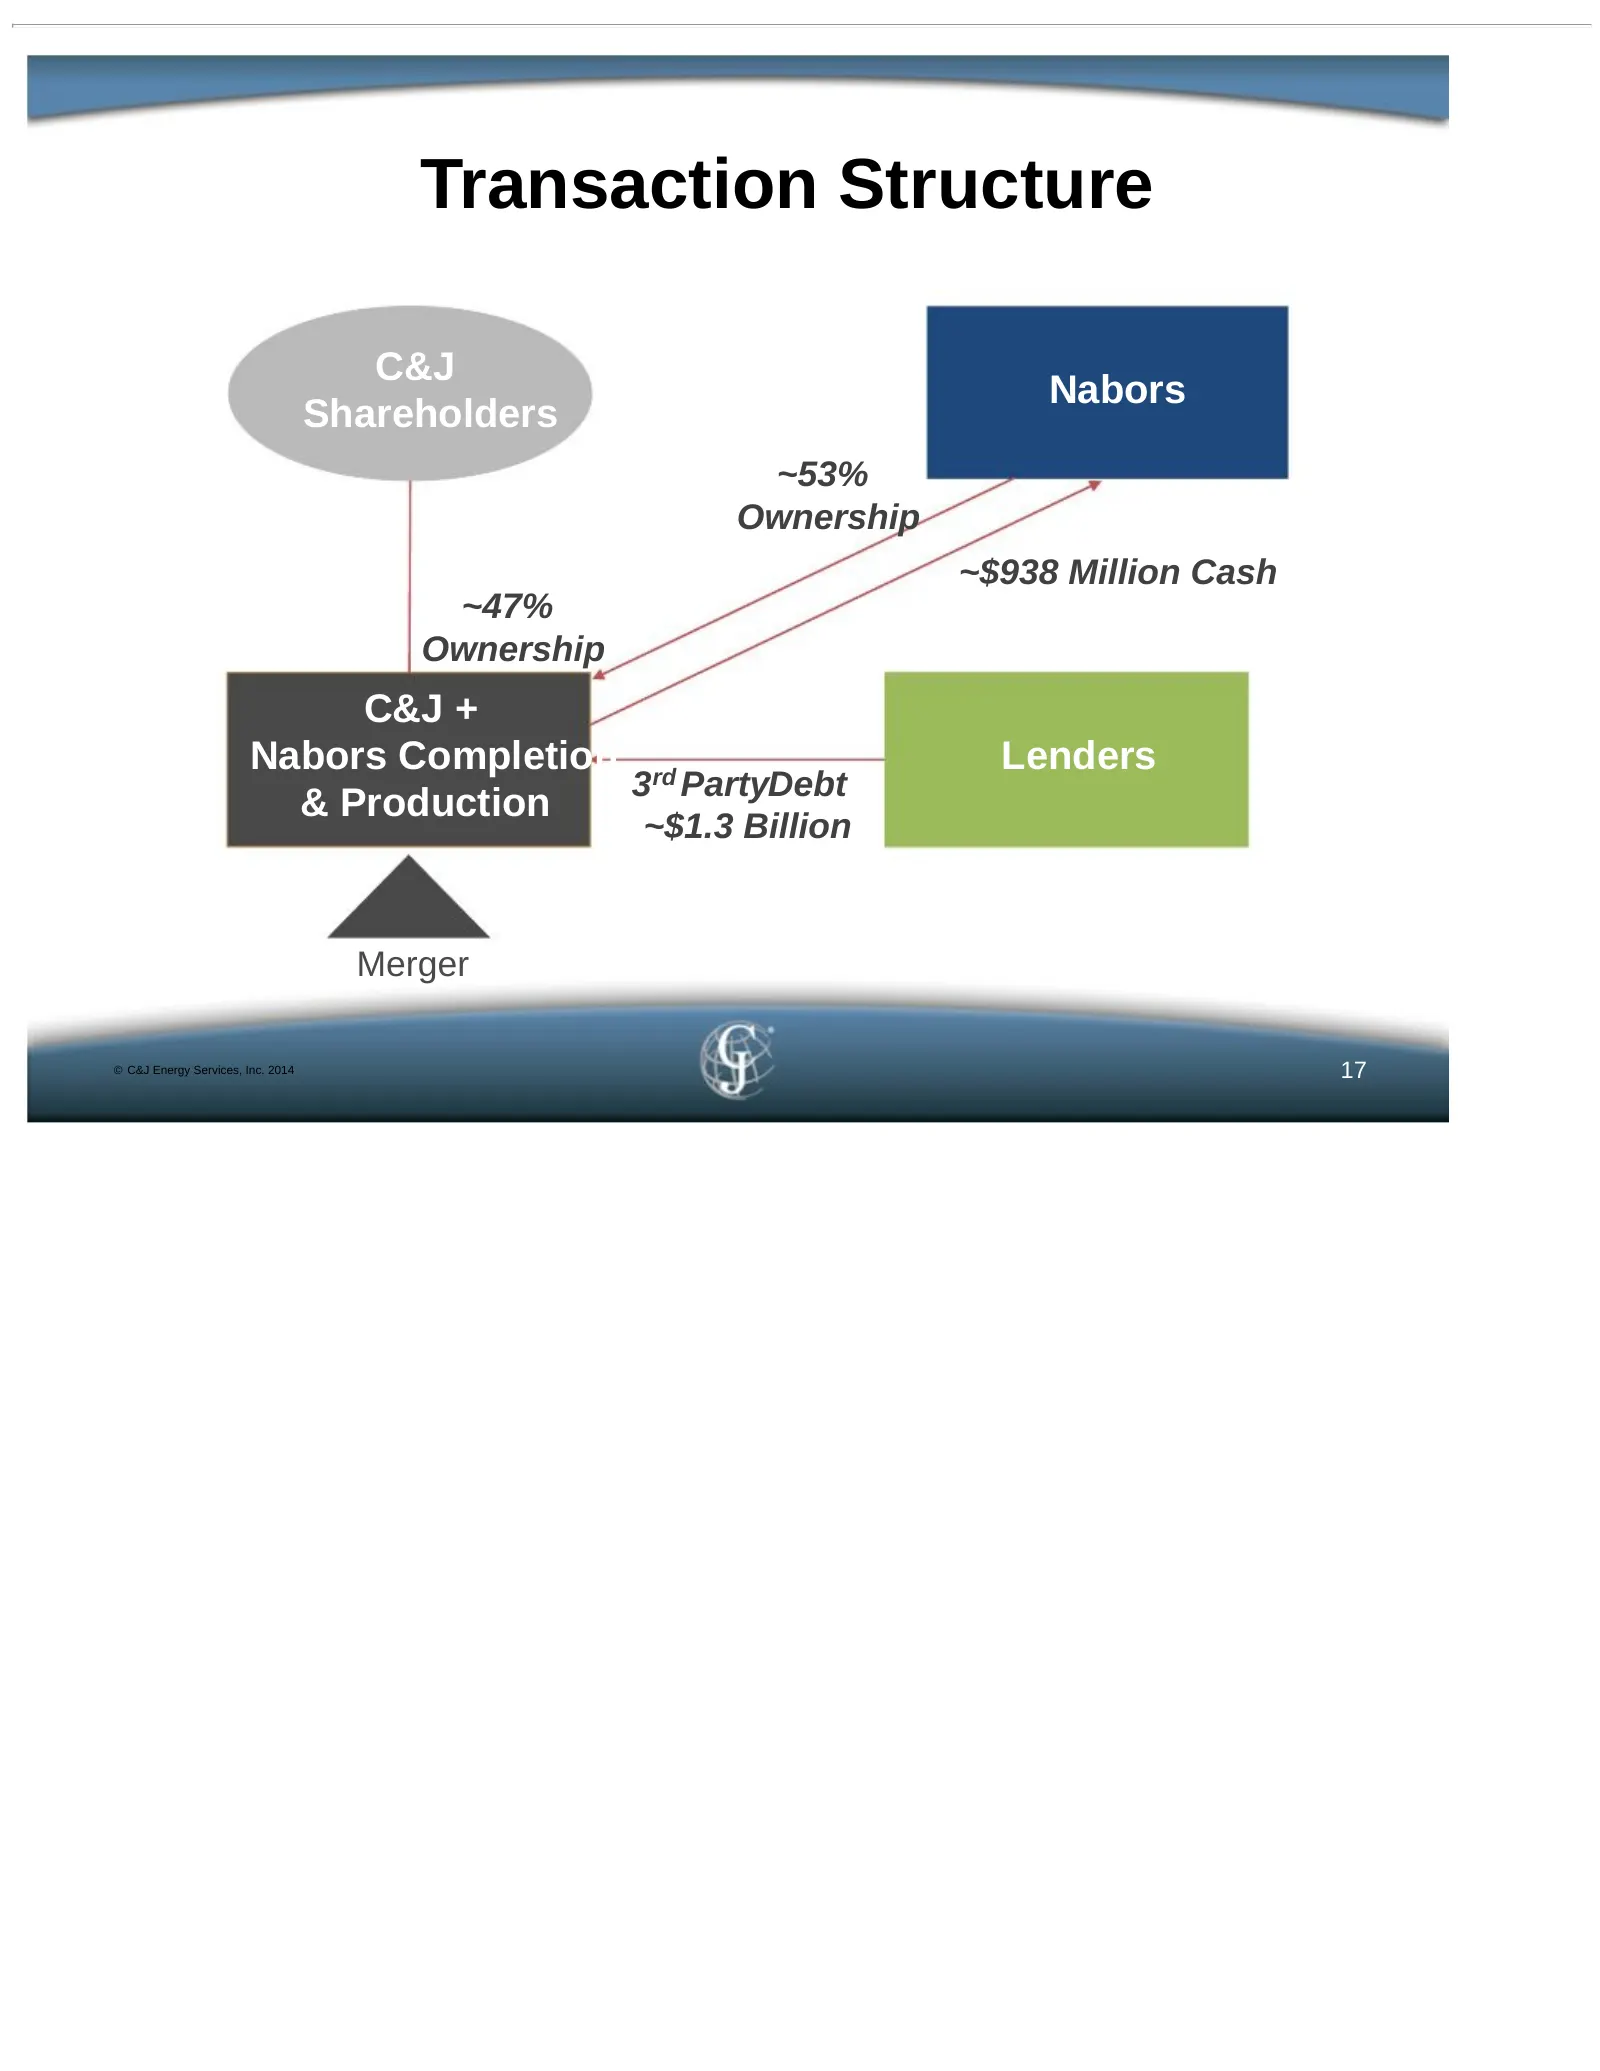
Transaction Structure C&J Nabors Shareholders ~53% Ownership ~$938 Million Cash ~47% Ownership C&J + Nabors Completion rd Lenders 3 PartyDebt & Production ~$1.3 Billion Merger © C&J Energy Services, Inc. 2014 17
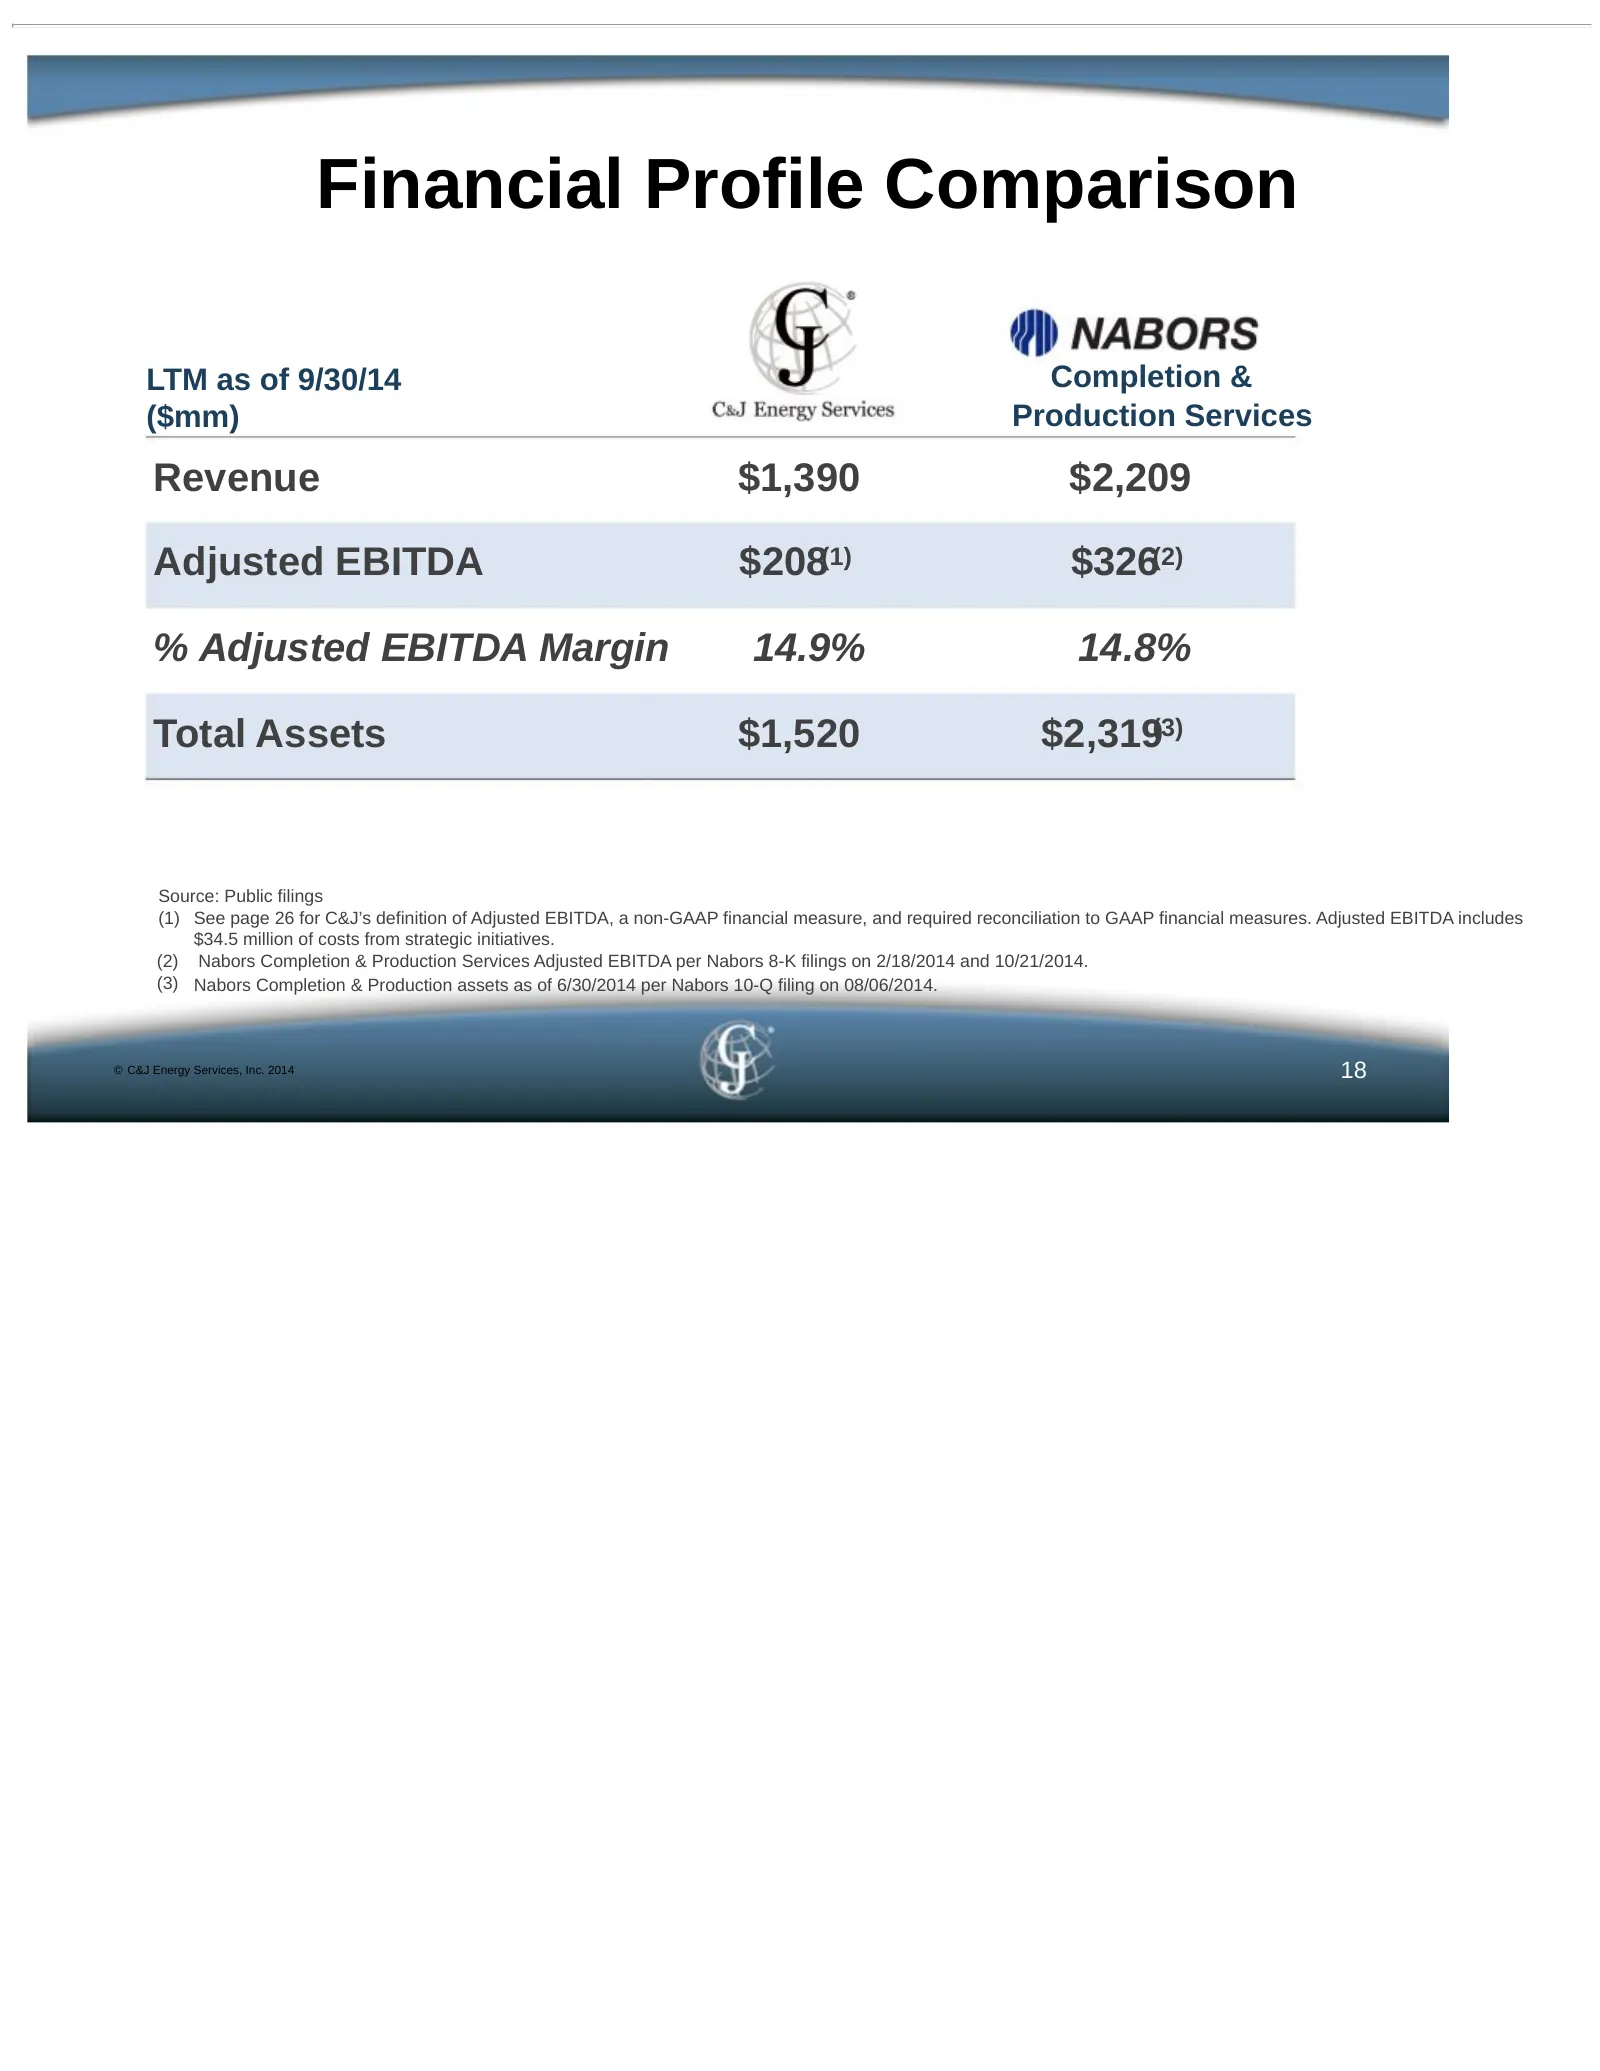
Slide 18: Financial Profile Comparison
Financial Profile Comparison LTM as of 9/30/14 Completion & ($mm) Production Services Revenue $1,390 $2,209 Adjusted EBITDA $208(1) $326(2) % Adjusted EBITDA Margin 14.9% 14.8% Total Assets $1,520 $2,319(3) Source: Public filings (1) See page 26 for C&J’s definition of Adjusted EBITDA, a non-GAAP fi
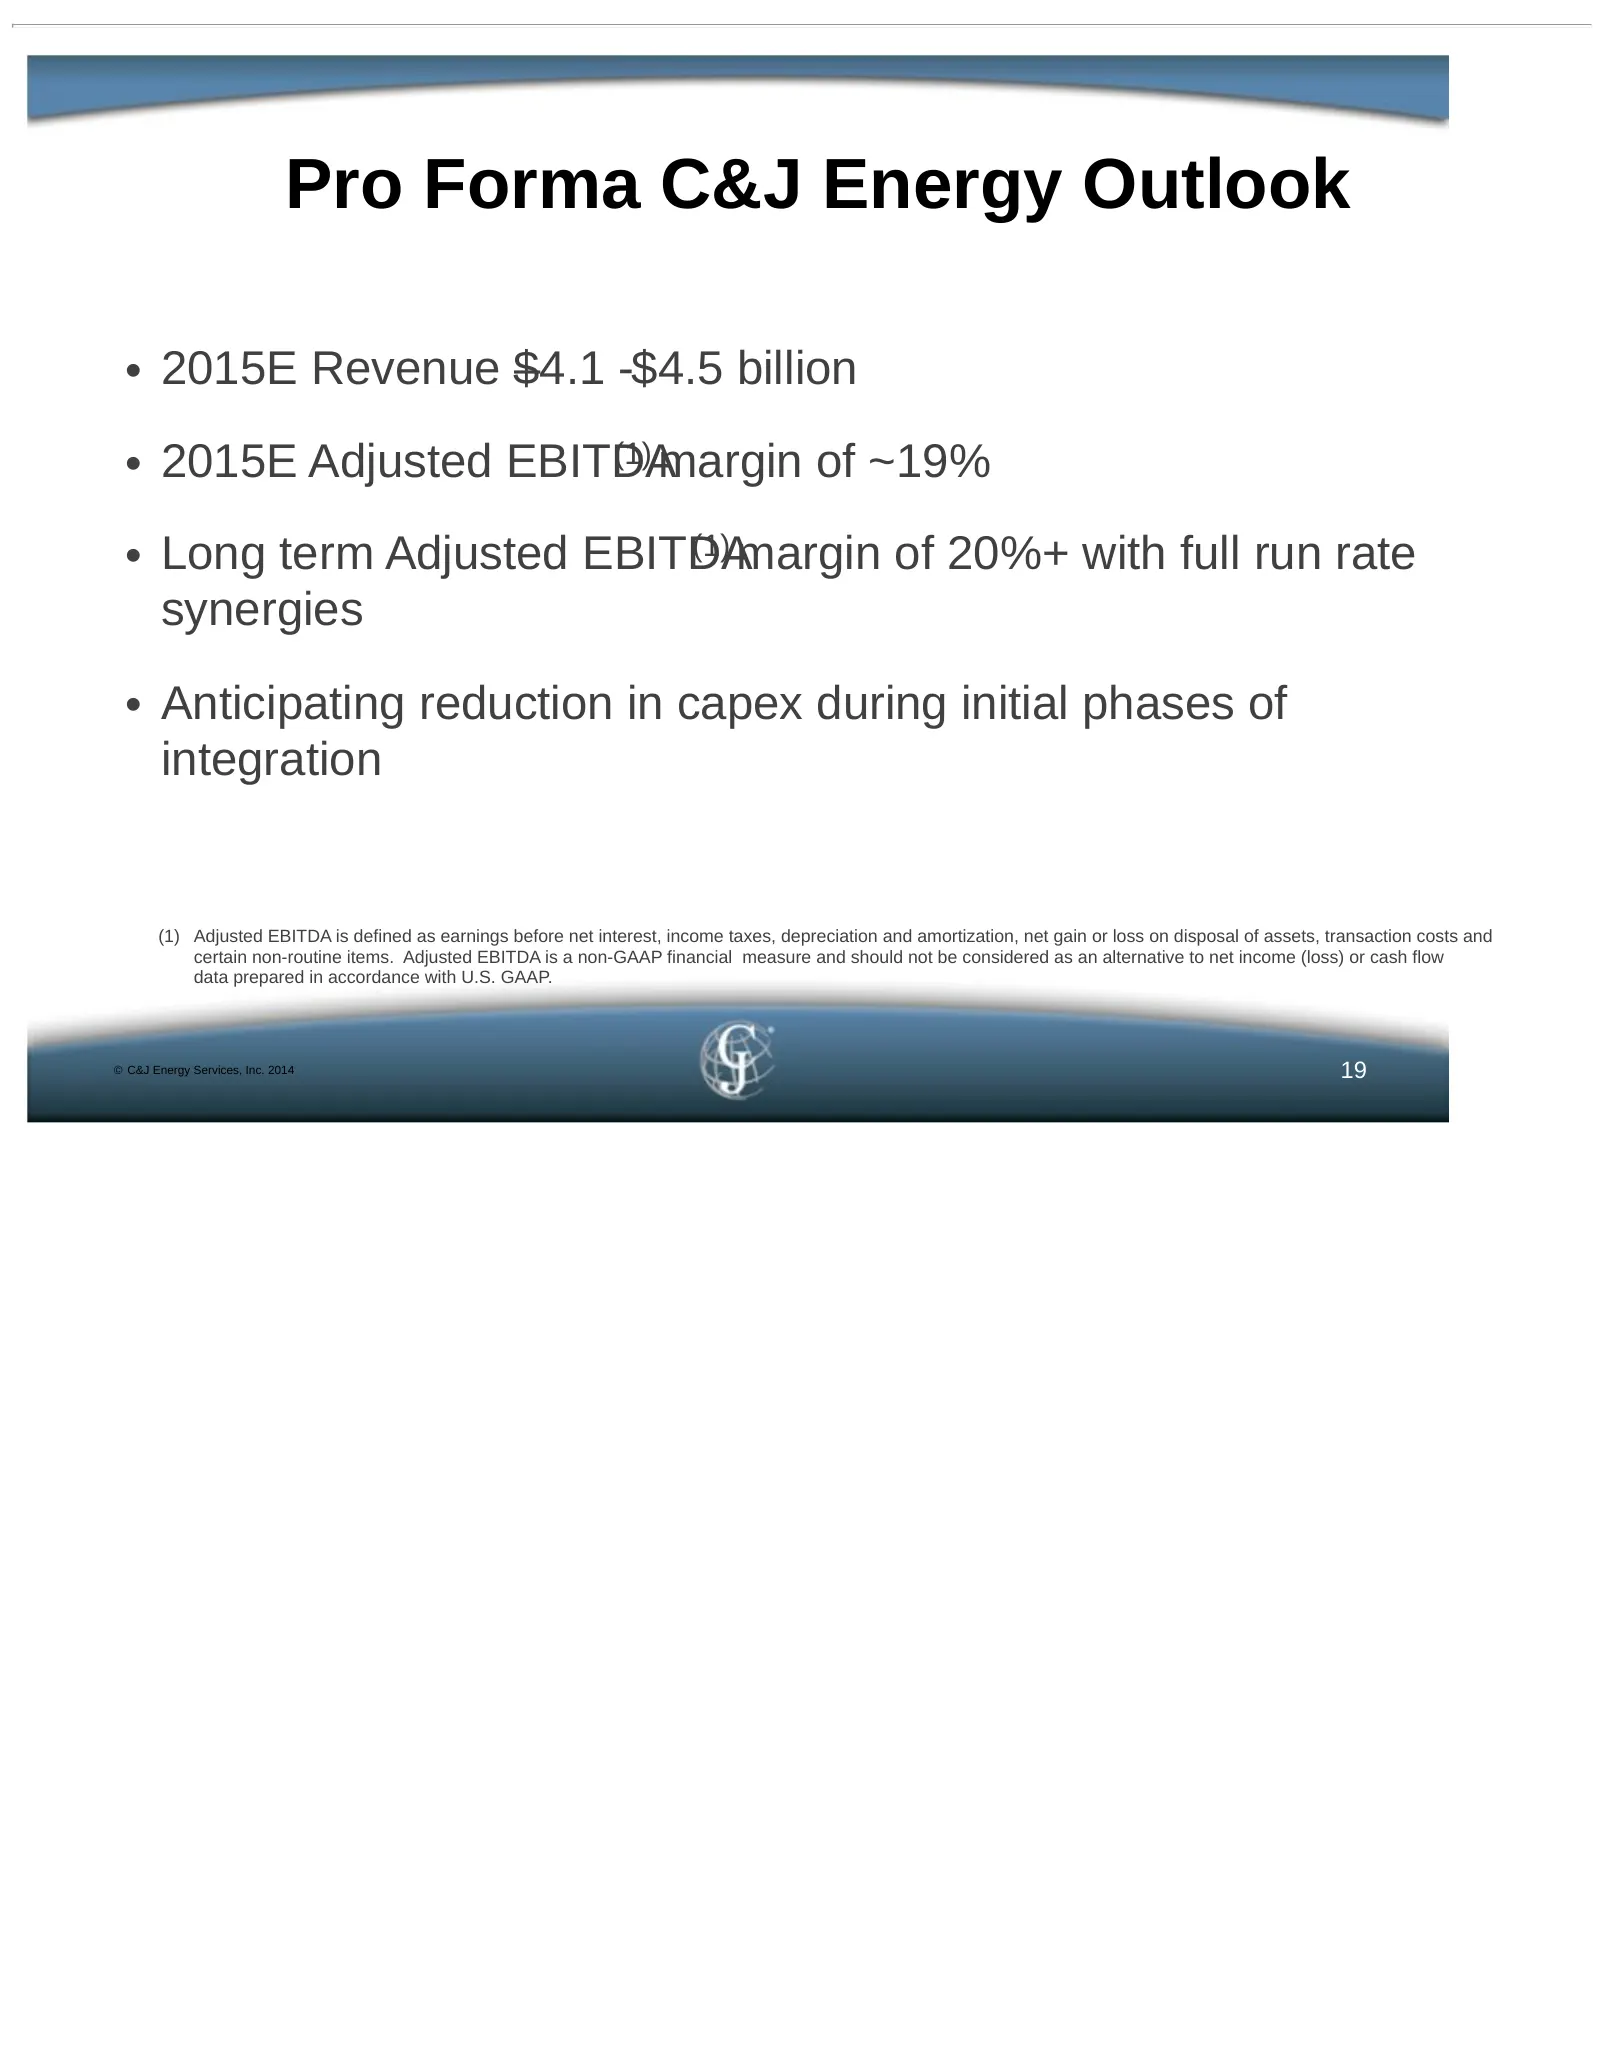
Slide 19: Pro Forma C&J Energy Outlook
Pro Forma C&J Energy Outlook • 2015E Revenue $ –4.1 -$4.5 billion • 2015E Adjusted EBITDA (1) margin of ~19% • Long term Adjusted EBITDA (1) margin of 20%+ with full run rate synergies • Anticipating reduction in capex during initial phases of integration (1) Adjusted EBITDA is defined as earnings b
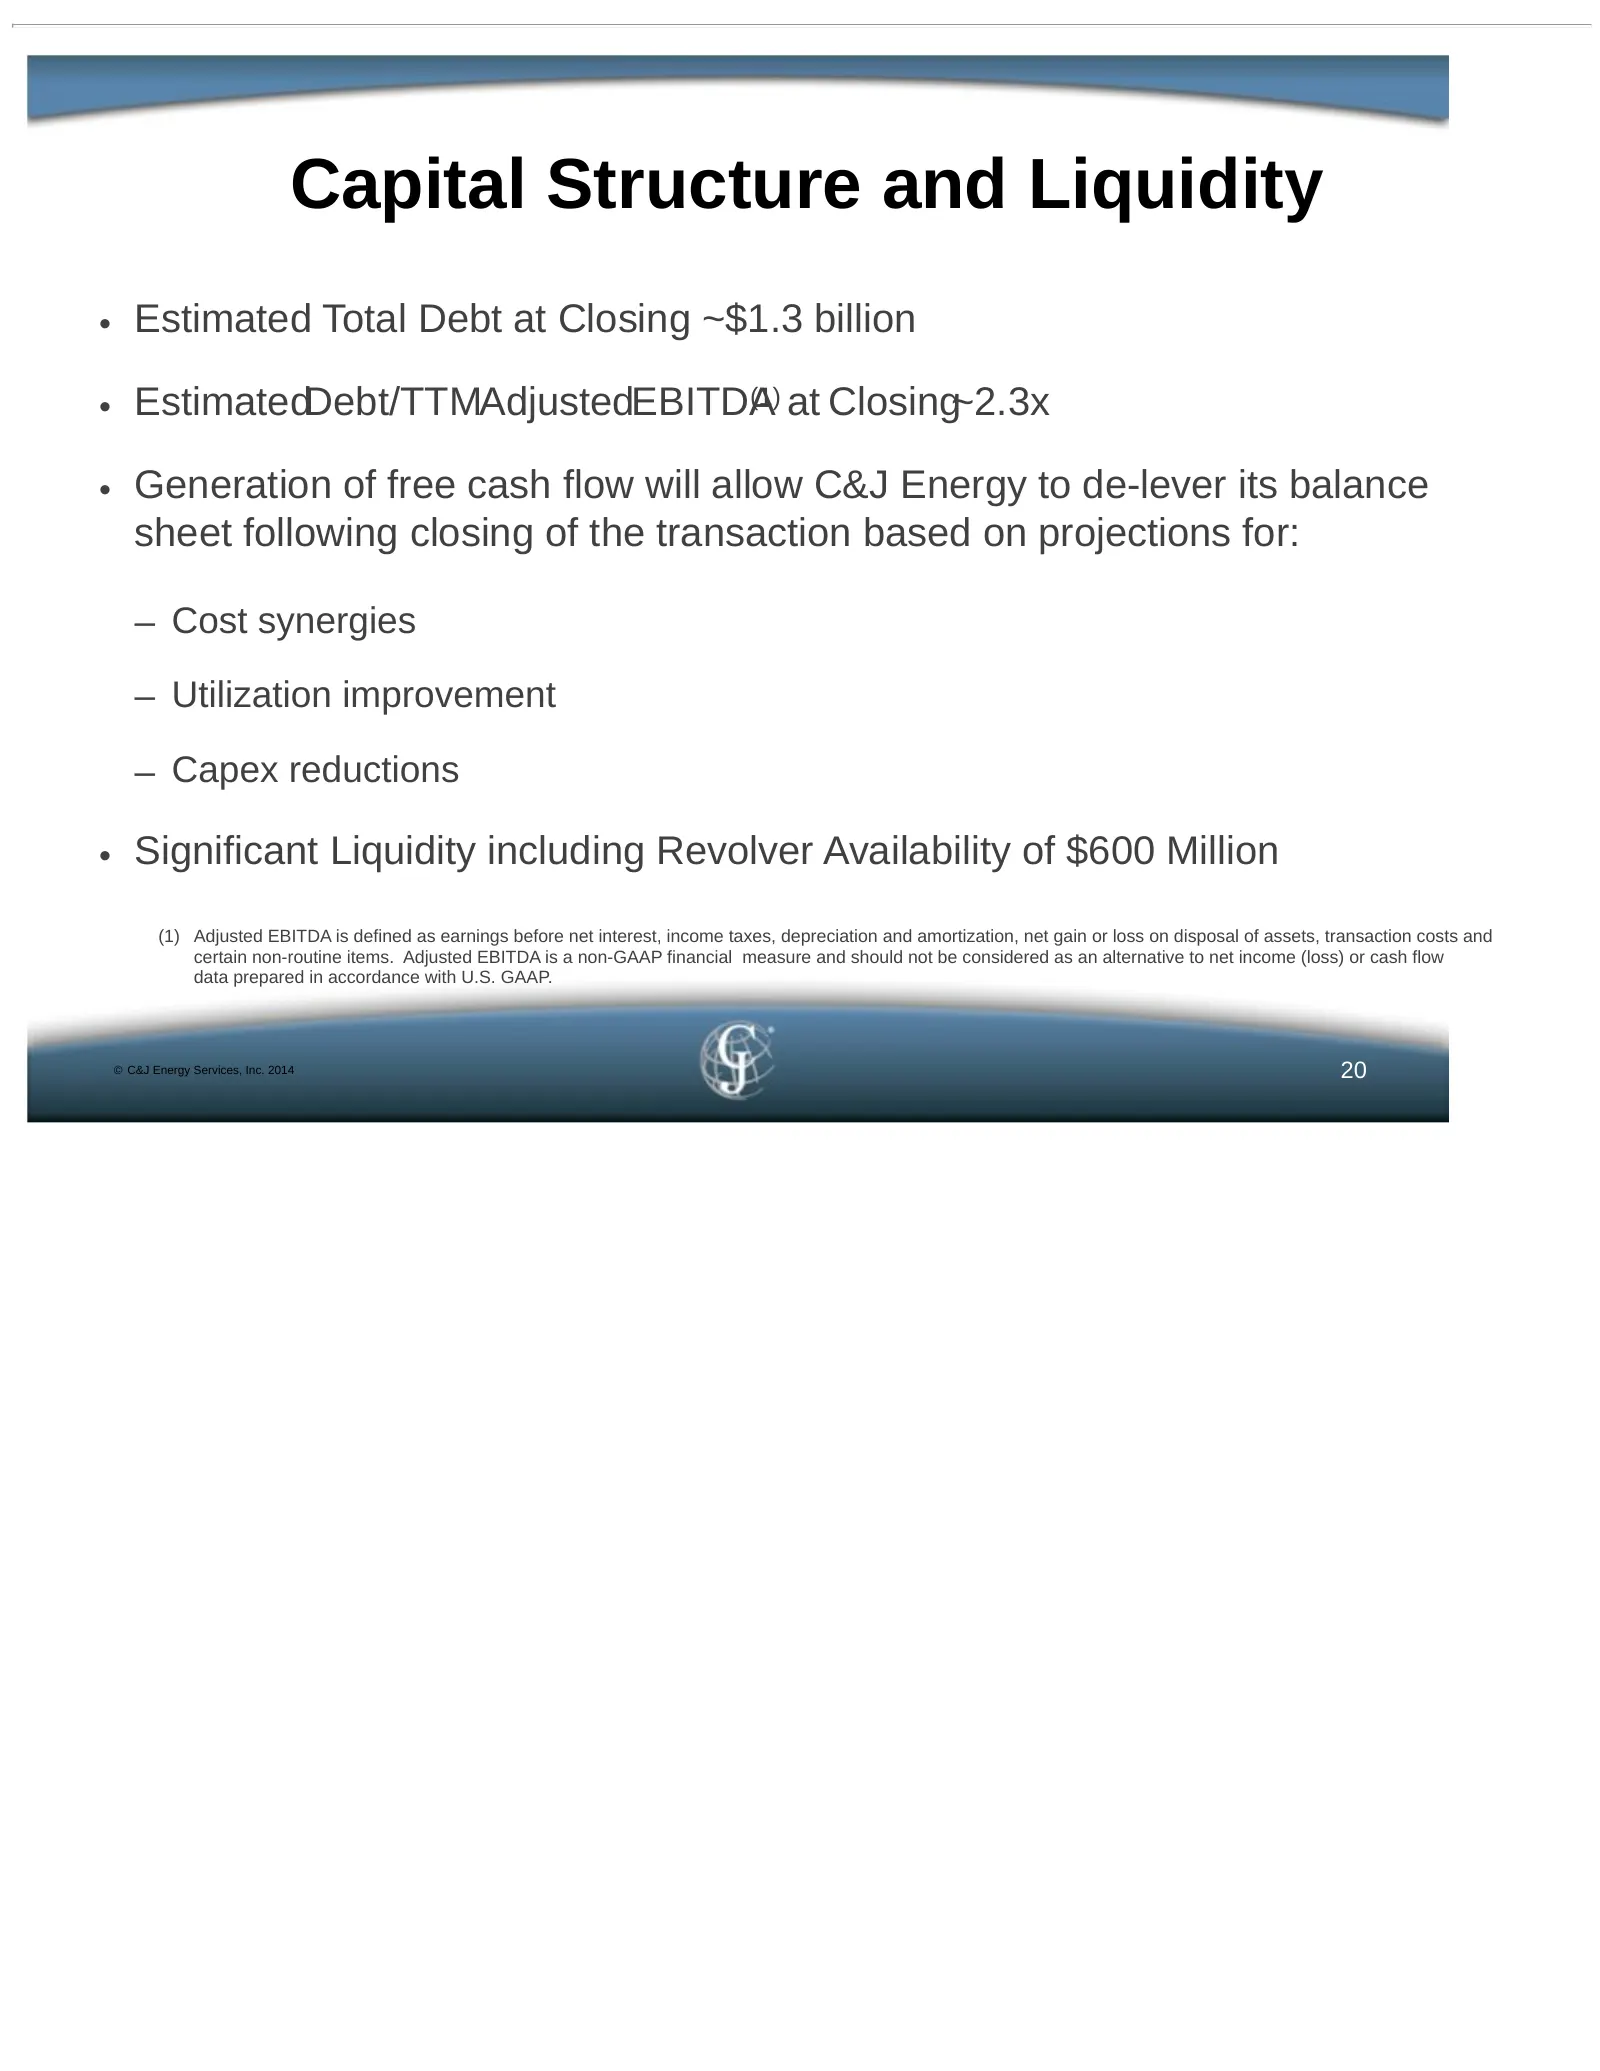
Slide 20: Capital Structure and Liquidity
Capital Structure and Liquidity • Estimated Total Debt at Closing ~$1.3 billion • EstimatedDebt/TTMAdjustedEBITDA (1) at Closing~2.3x • Generation of free cash flow will allow C&J Energy to de-lever its balance sheet following closing of the transaction based on projections for: – Cost synergies – U

Slide 21: Experienced and Proven Leadership
Experienced and Proven Leadership Josh Comstock, Larry Heidt, Chairman and President, Chief Executive Officer, Production Services C&J Energy Services Randy McMullen, Ronnie Witherspoon, President and Chief Financial Executive Vice President, Officer, C&J Energy Services Nabors Completion Services D
Slide 22: Appendix
Appendix © C&J Energy Services, Inc. 2014
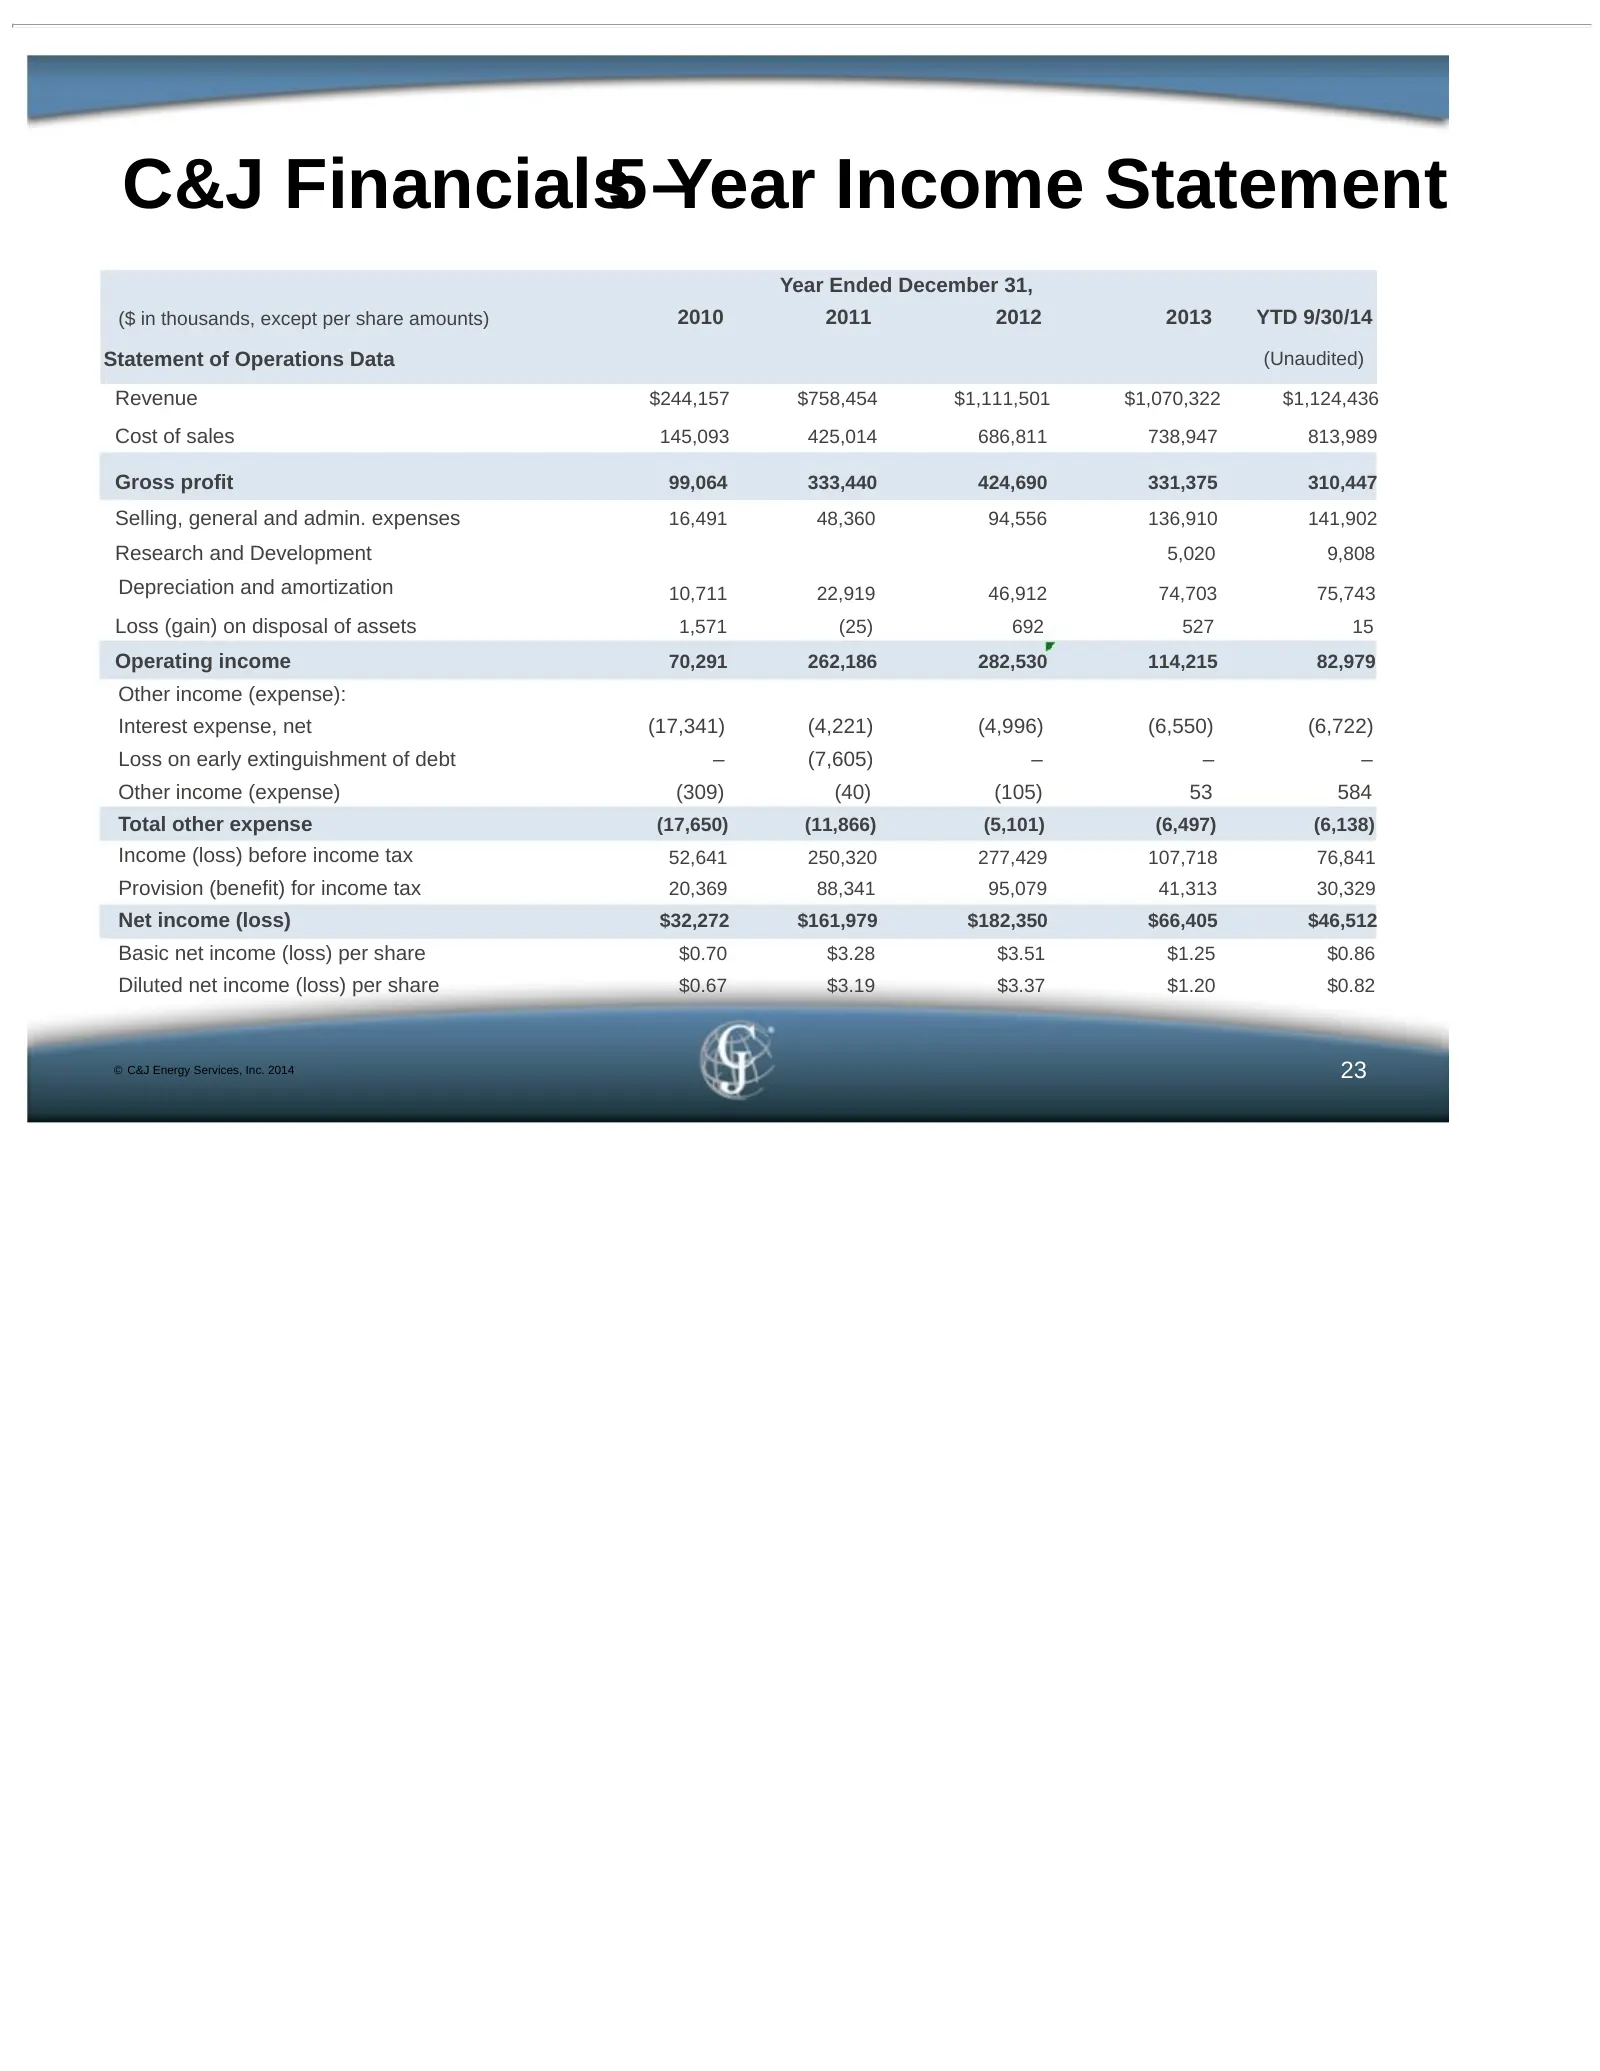
Slide 23: C&J Financials 5-Year Income Statement
C&J Financials5 –Year Income Statement Year Ended December 31, ($ in thousands, except per share amounts) 2010 2011 2012 2013 YTD 9/30/14 Statement of Operations Data (Unaudited) Revenue $244,157 $758,454 $1,111,501 $1,070,322 $1,124,436 Cost of sales 145,093 425,014 686,811 738,947 813,989 Gross pr
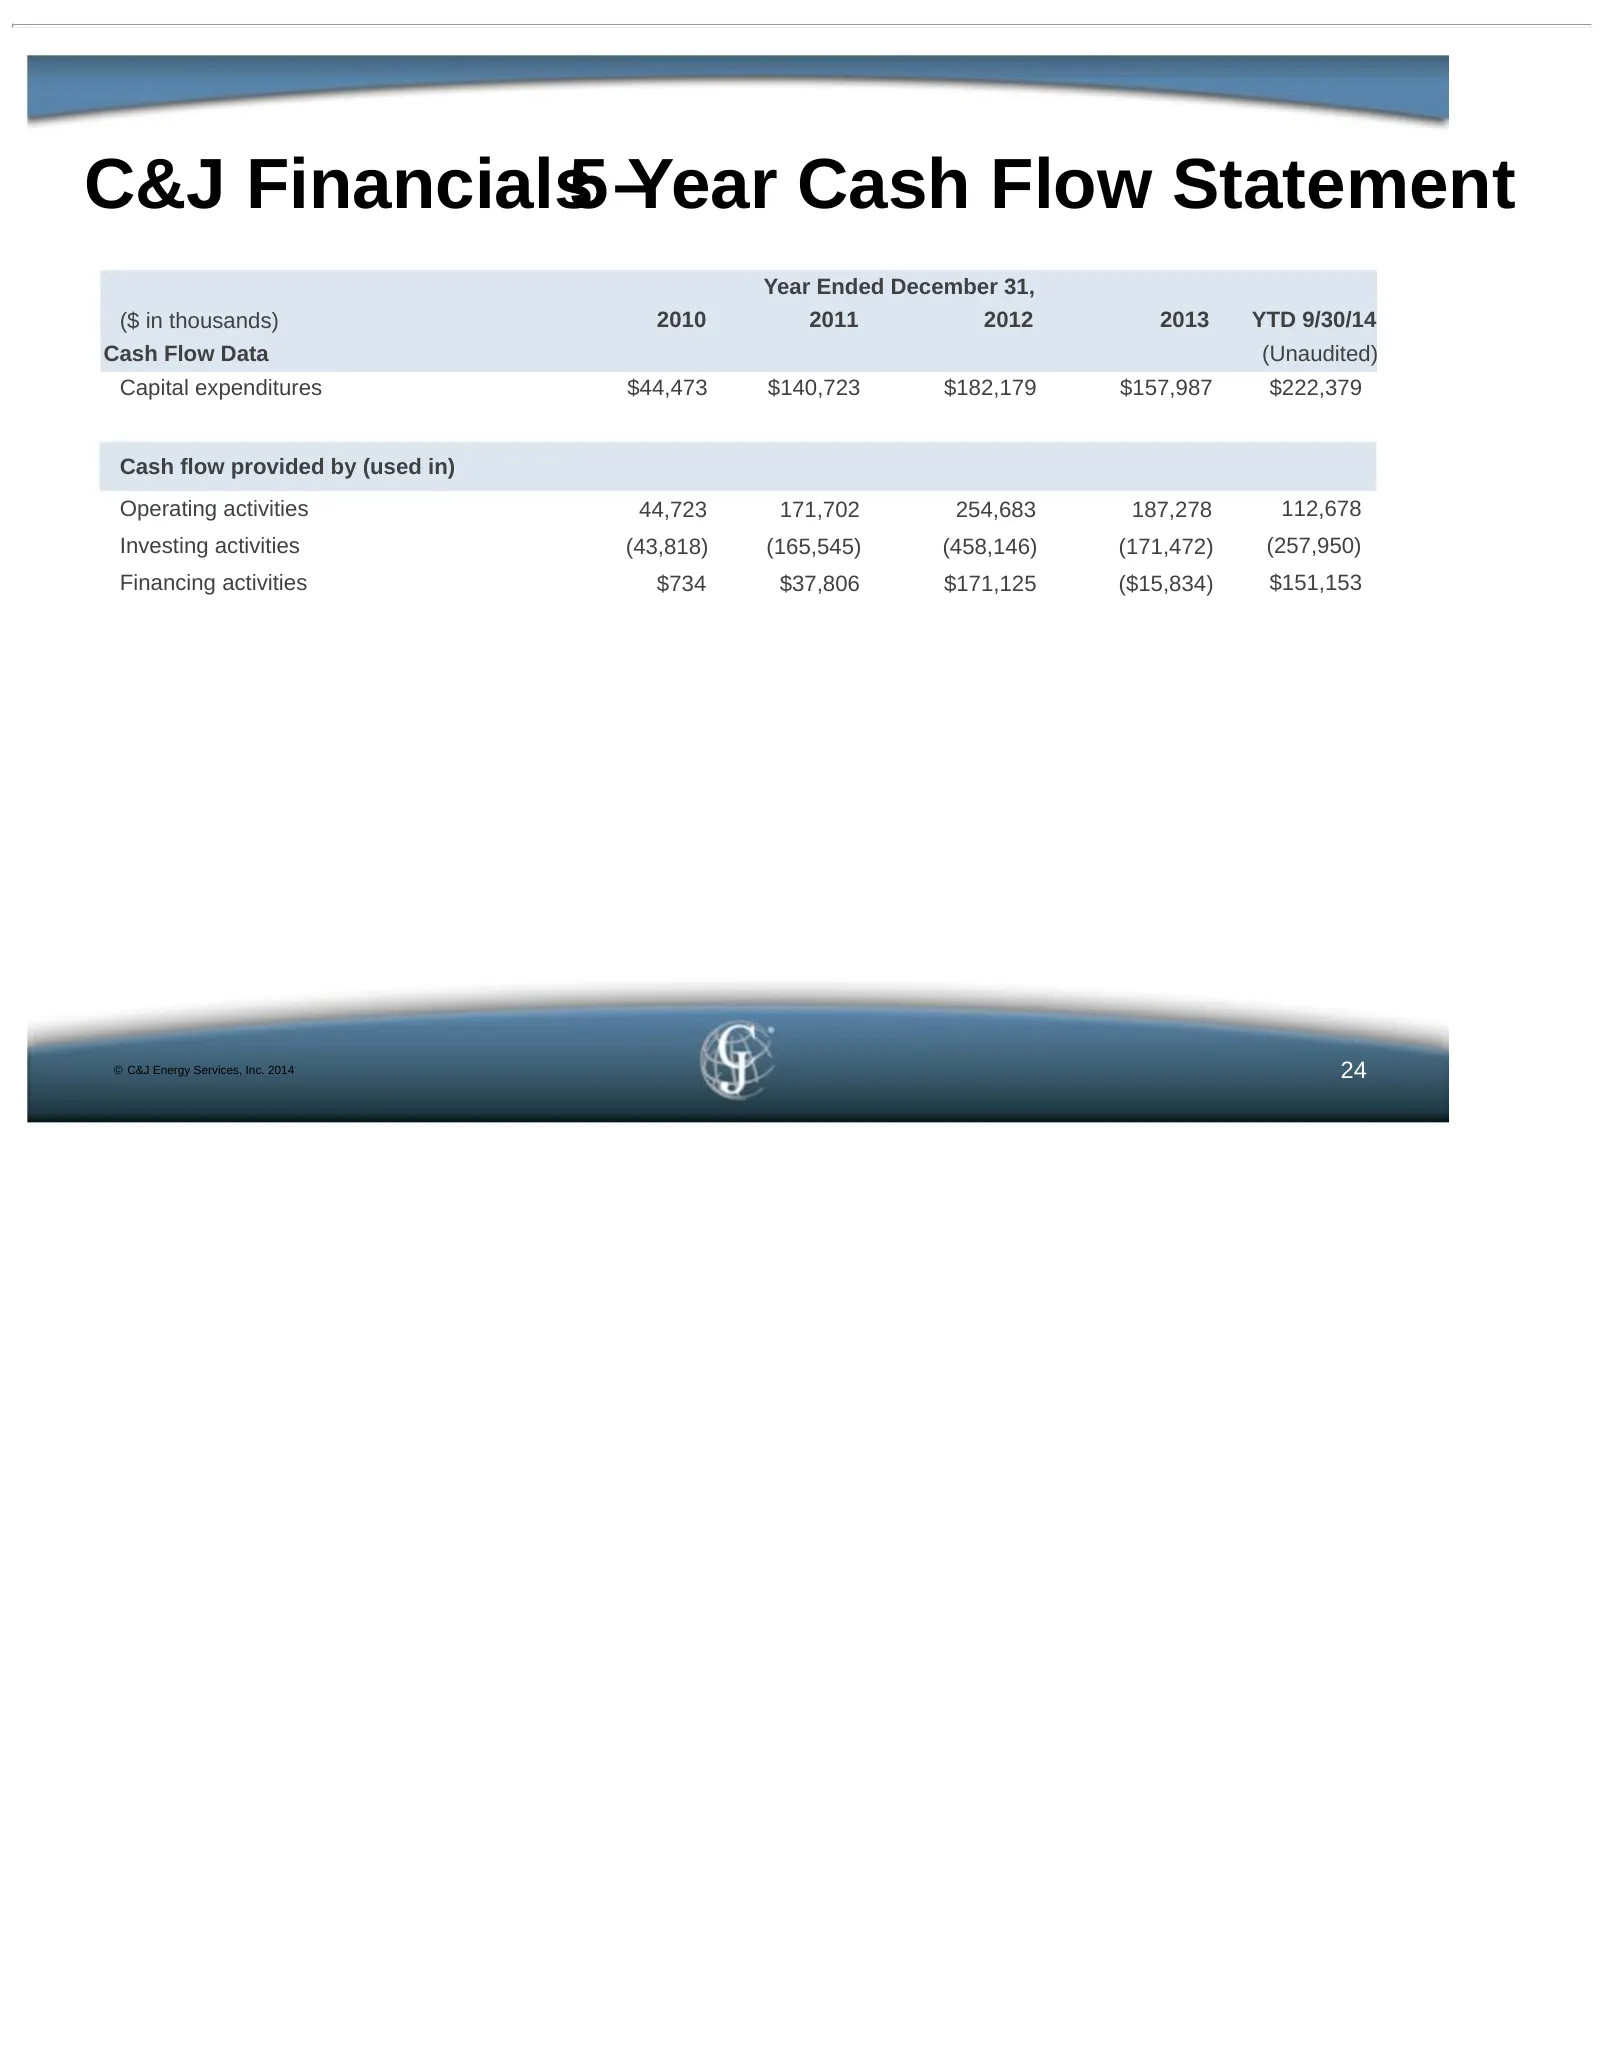
Slide 24: C&J Financials 5-Year Cash Flow Statement
C&J Financials5 –Year Cash Flow Statement Year Ended December 31, ($ in thousands) 2010 2011 2012 2013 YTD 9/30/14 Cash Flow Data (Unaudited) Capital expenditures $44,473 $140,723 $182,179 $157,987 $222,379 Cash flow provided by (used in) Operating activities 44,723 171,702 254,683 187,278 112,678 I
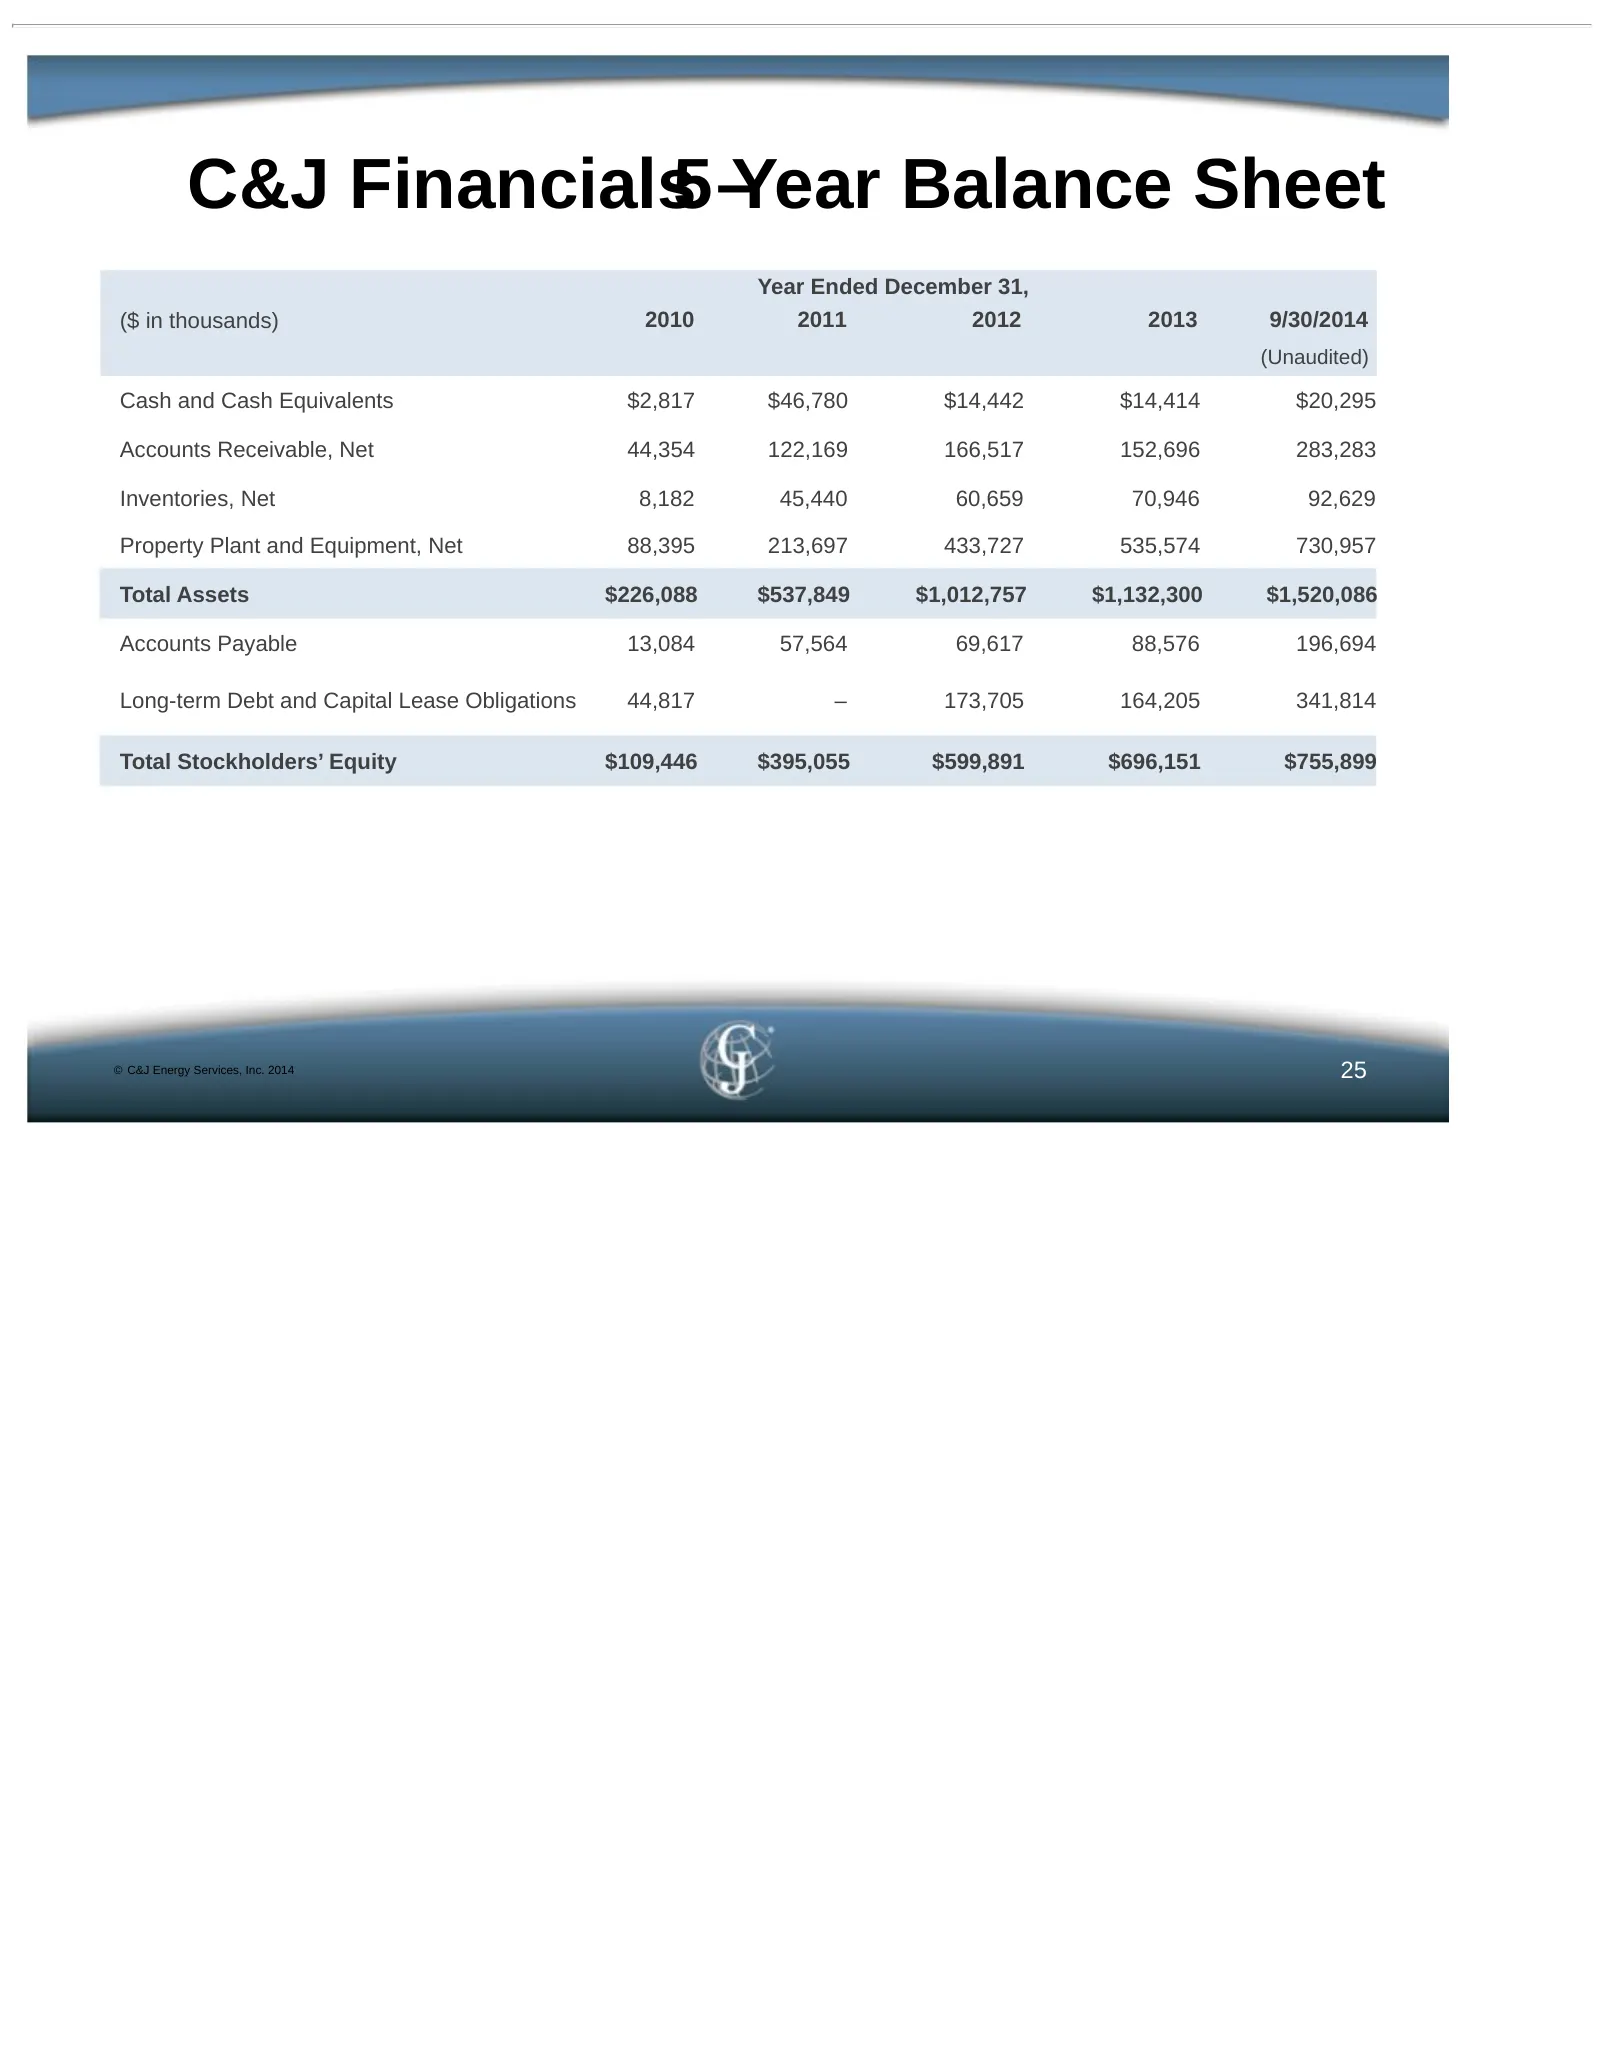
Slide 25: C&J Financials 5-Year Balance Sheet
C&J Financials5 –Year Balance Sheet Year Ended December 31, ($ in thousands) 2010 2011 2012 2013 9/30/2014 (Unaudited) Cash and Cash Equivalents $2,817 $46,780 $14,442 $14,414 $20,295 Accounts Receivable, Net 44,354 122,169 166,517 152,696 283,283 Inventories, Net 8,182 45,440 60,659 70,946 92,629 P
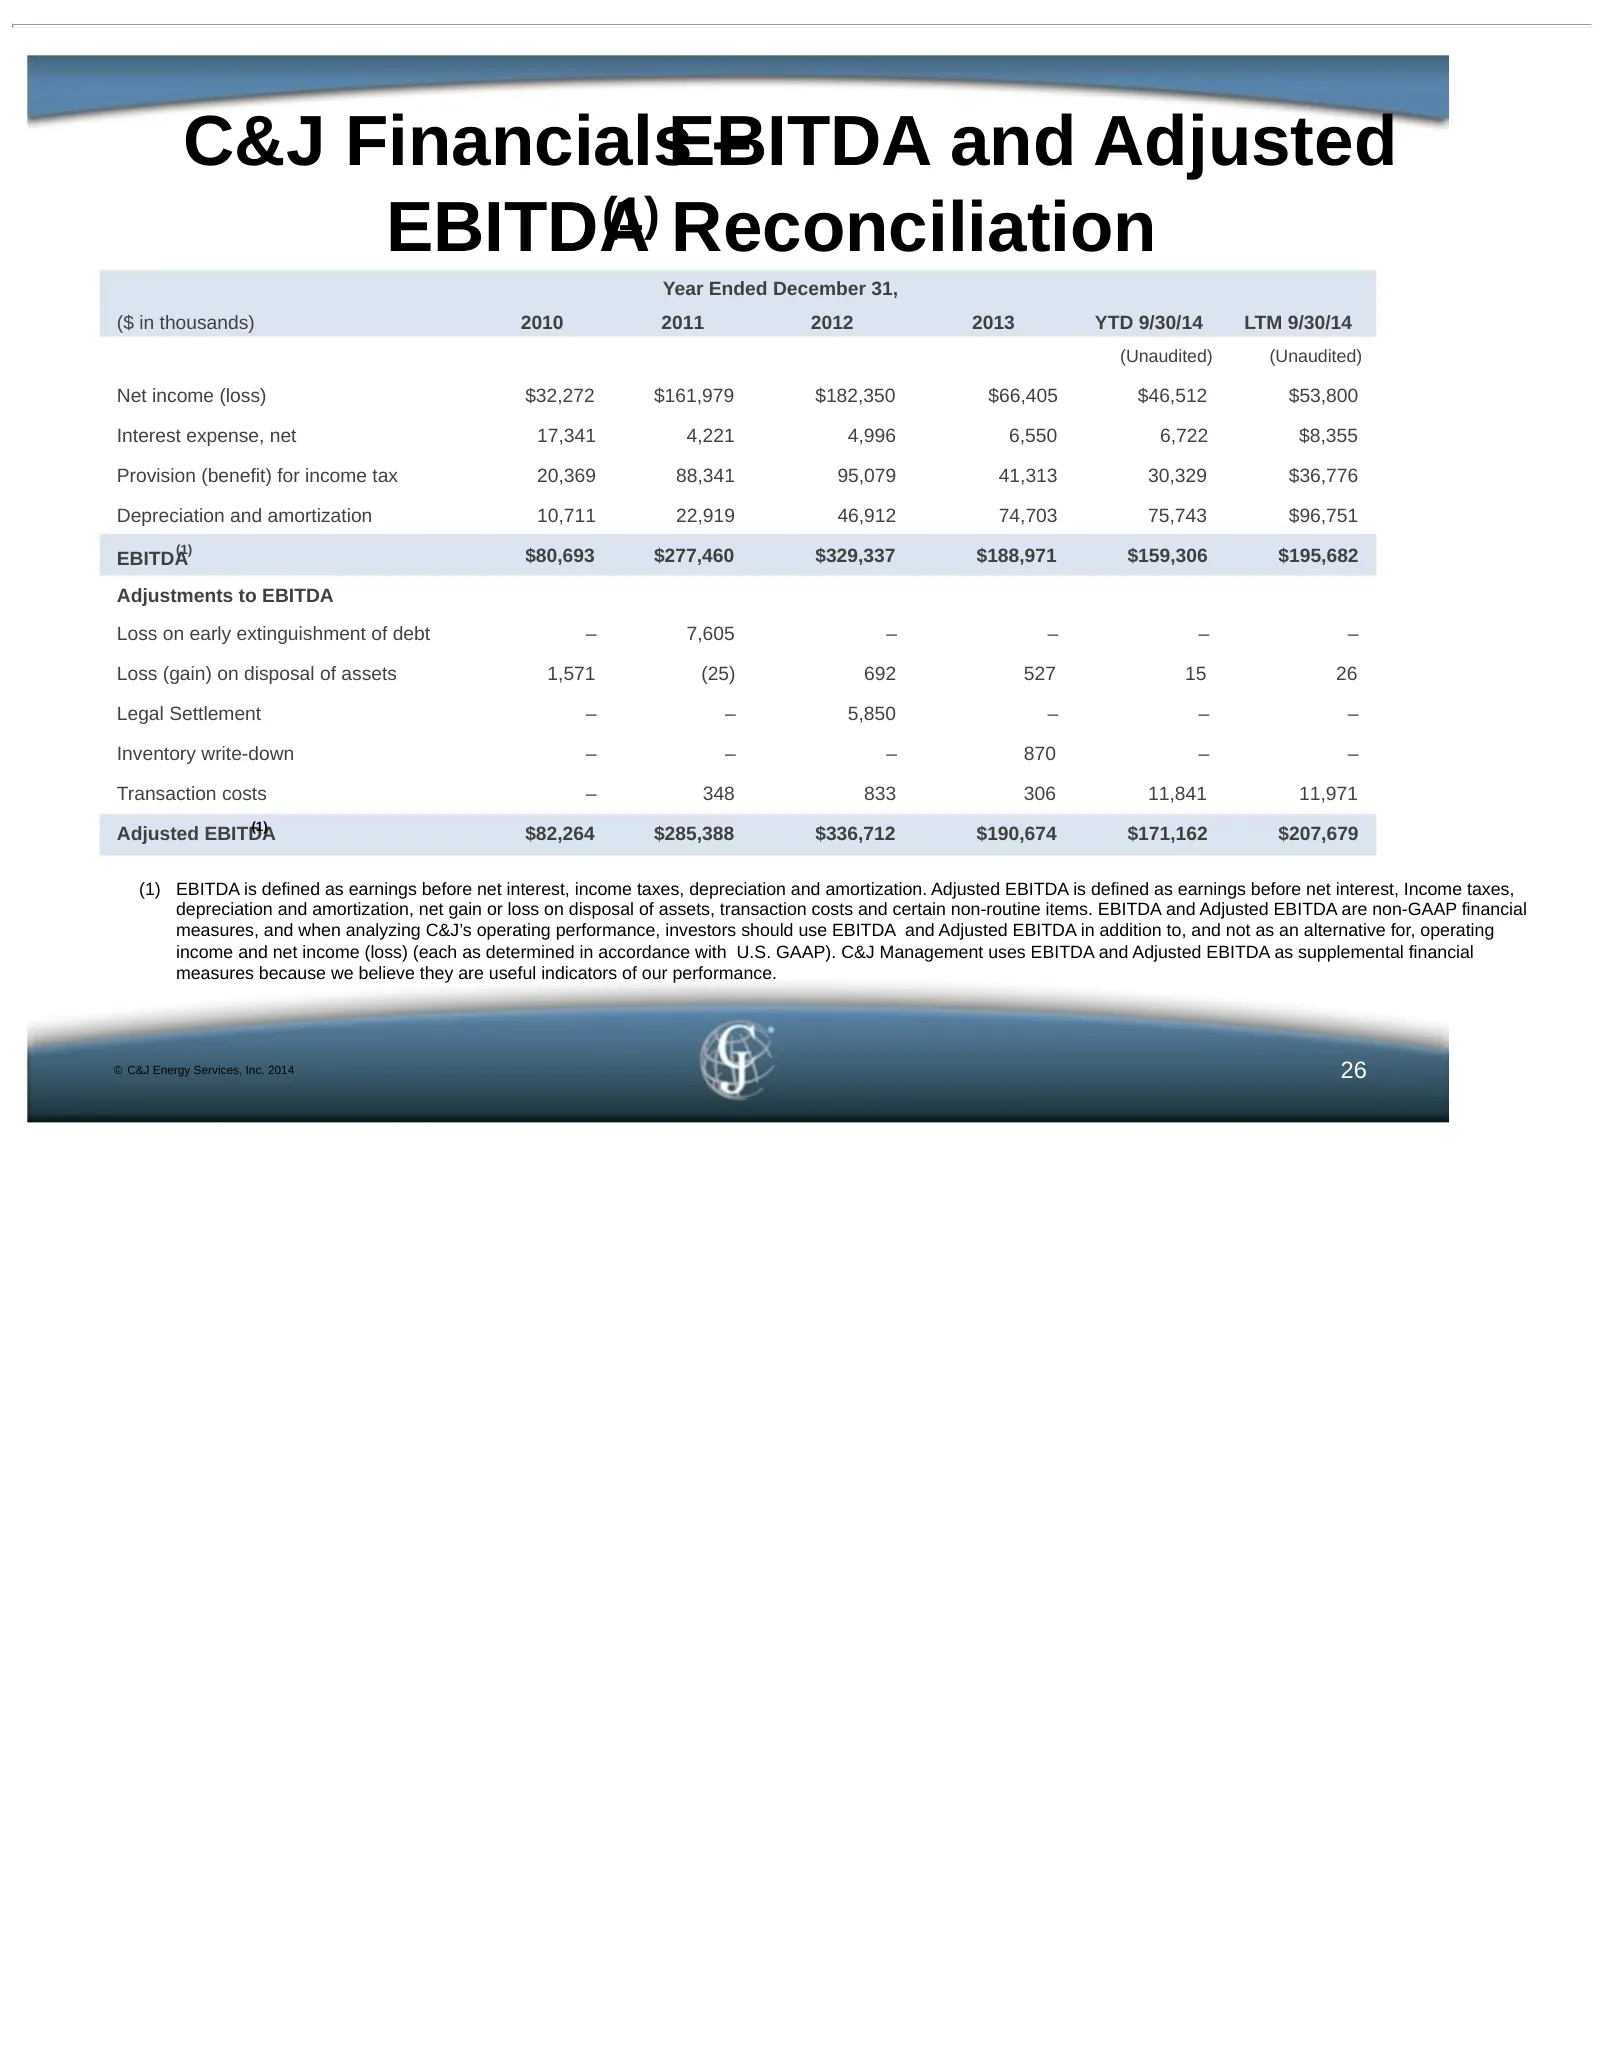
Slide 26: C&J Financials EBITDA and Adjusted EBITDA Reconciliation
C&J FinancialsEBITDA – and Adjusted EBITDA(1) Reconciliation Year Ended December 31, ($ in thousands) 2010 2011 2012 2013 YTD 9/30/14 LTM 9/30/14 (Unaudited) (Unaudited) Net income (loss) $32,272 $161,979 $182,350 $66,405 $46,512 $53,800 Interest expense, net 17,341 4,221 4,996 6,550 6,722 $8,355 Pr
Slide 27: C&J Financials EBITDA and Adjusted EBITDA Reconciliation Quarterly
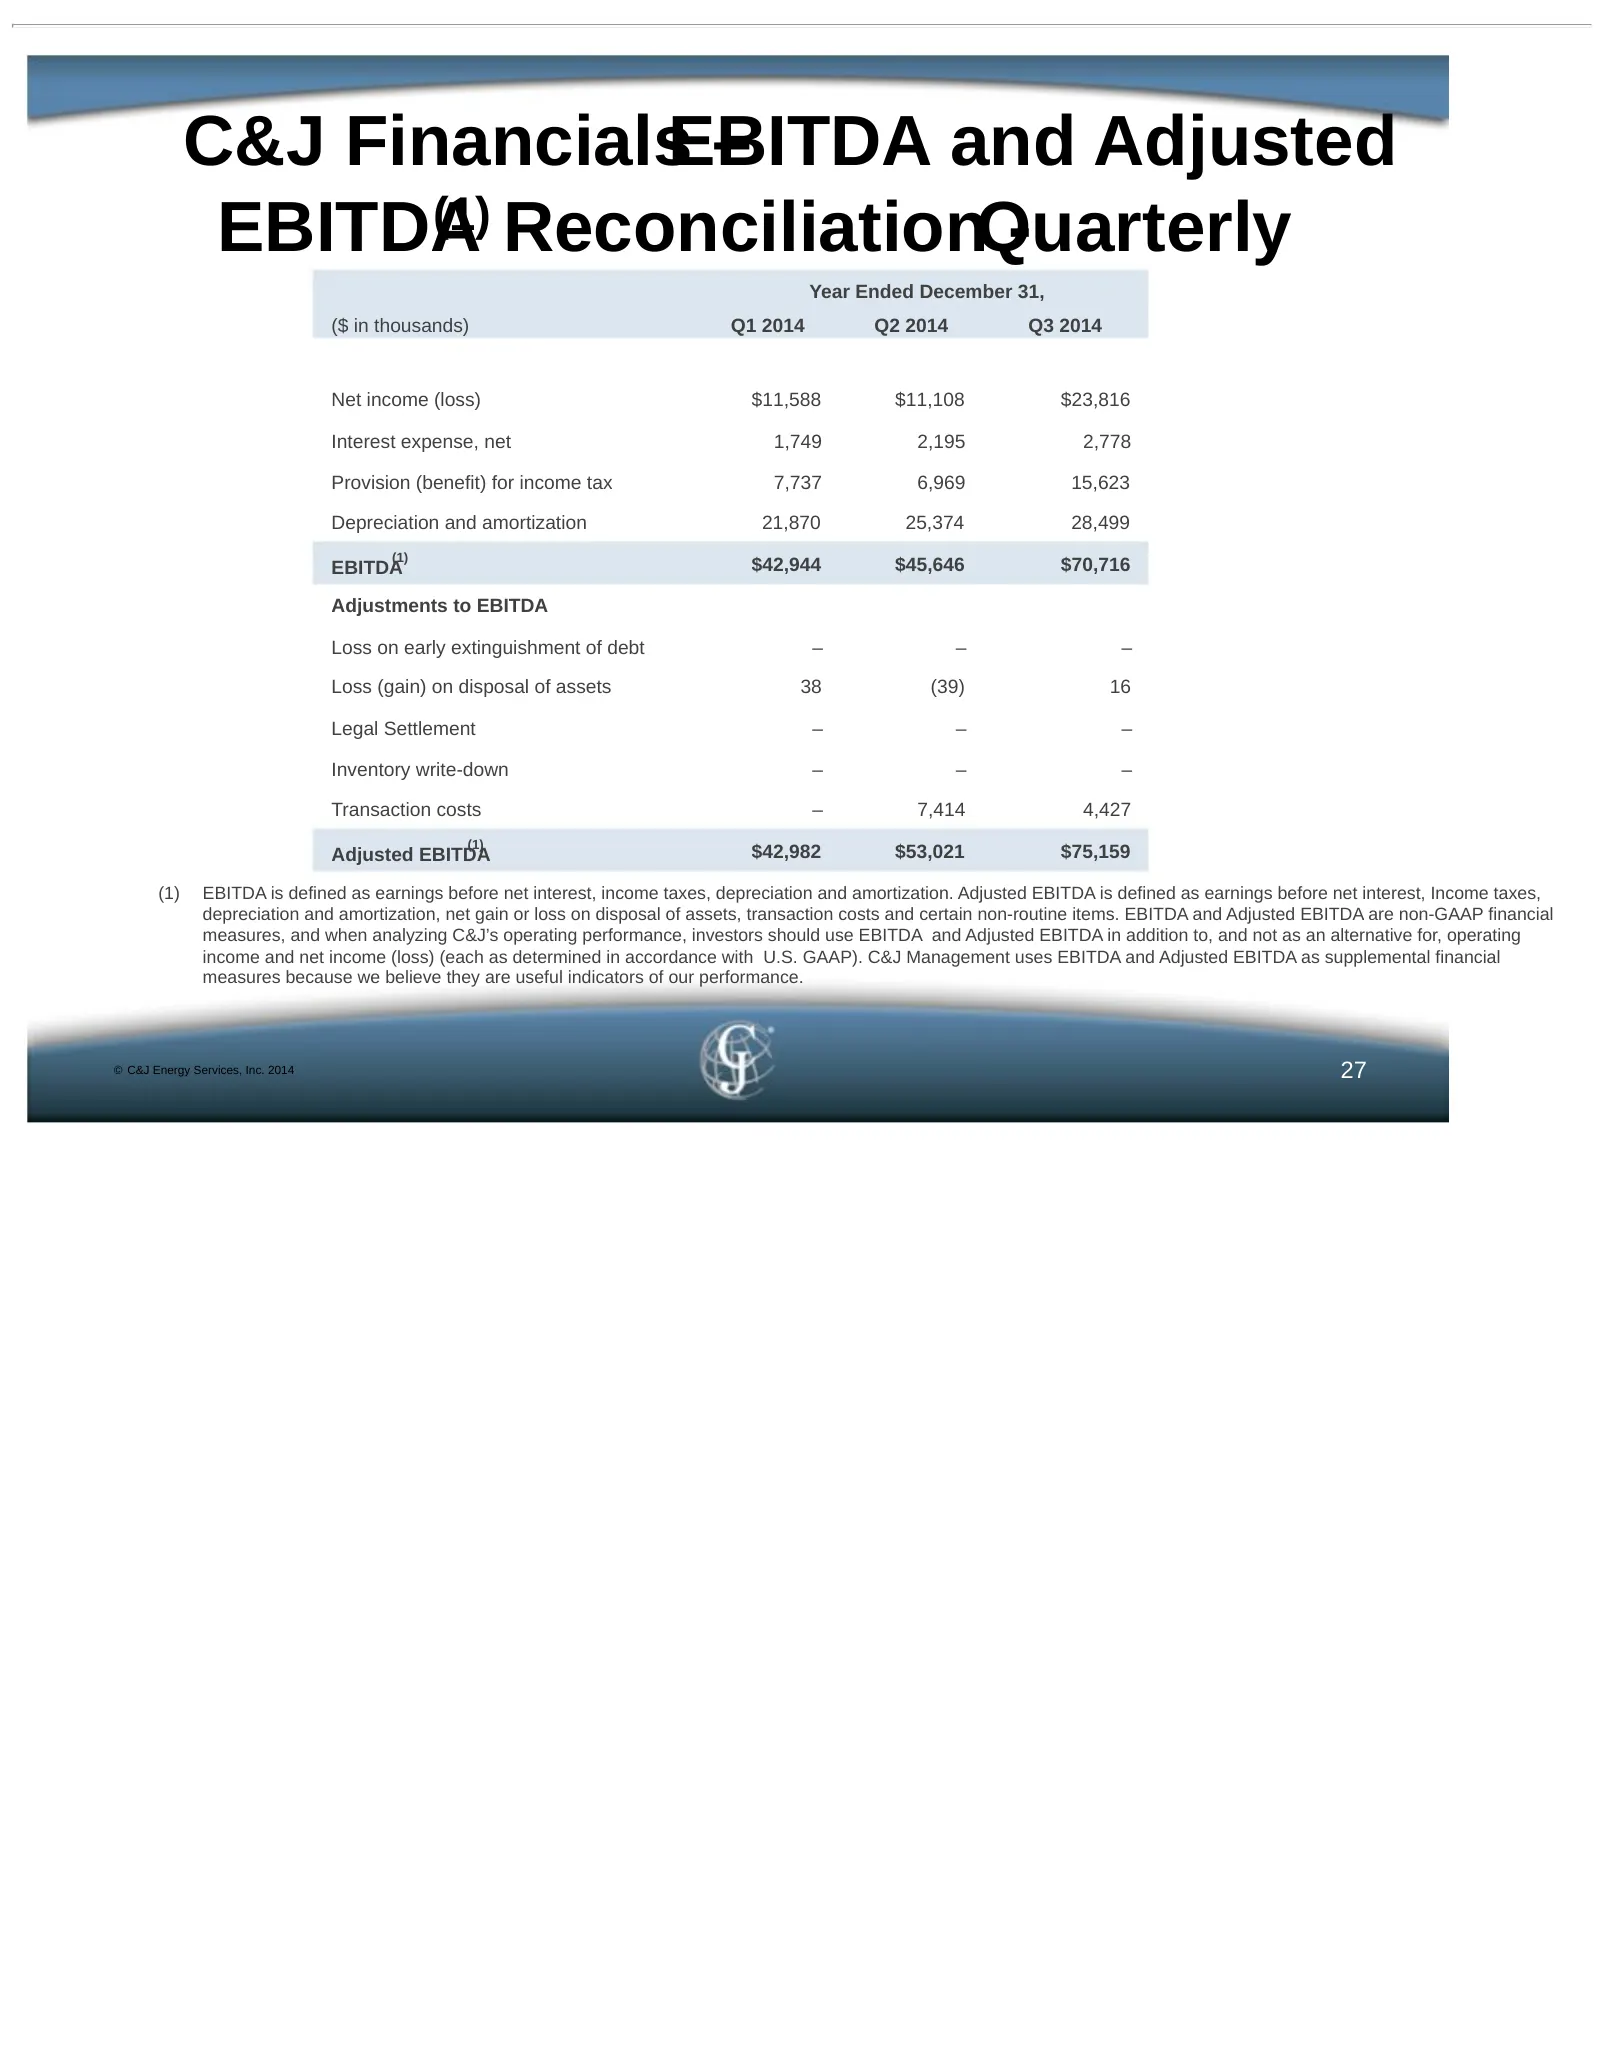
C&J FinancialsEBITDA – and Adjusted EBITDA(1) ReconciliationQuarterly - Year Ended December 31, ($ in thousands) Q1 2014 Q2 2014 Q3 2014 Net income (loss) $11,588 $11,108 $23,816 Interest expense, net 1,749 2,195 2,778 Provision (benefit) for income tax 7,737 6,969 15,623 Depreciation and amortizati
Source: SEC EDGAR · 425 filed Nov 12, 2014
More decks from C&J Energy Services Inc
 Barclays CEO Energy-Power Conference 201933 slides · Sep 3, 2019
 Q2 2019 Earnings Presentation42 slides · Aug 6, 2019
 Q2 2019 Earnings Presentation22 slides · Aug 6, 2019
 Merger or Acquisition (June 2019)20 slides · Jun 17, 2019
 Investor Presentation (May 2019)42 slides · May 14, 2019
 Q1 2019 Earnings Presentation21 slides · May 7, 2019