Continental Resources — Lehman Brothers CEO Energy/Power Conference 2007
18 slides from Continental Resources's conference presentation, Aug 31, 2007
Slide 1: Lehman Brothers – CEO Energy/Power
Exhibit 99.1 Lehman Brothers – CEO Energy/Power September 6, 2007
Slide 2: Forward Looking Statements
Forward Looking Statements This presentation includes forward-looking information that are subject to a number of risks and uncertainties, many of which are beyond our control. All information, other than historical facts included in this presentation, regarding our strategy, future operations, dril
Slide 3: Company Overview
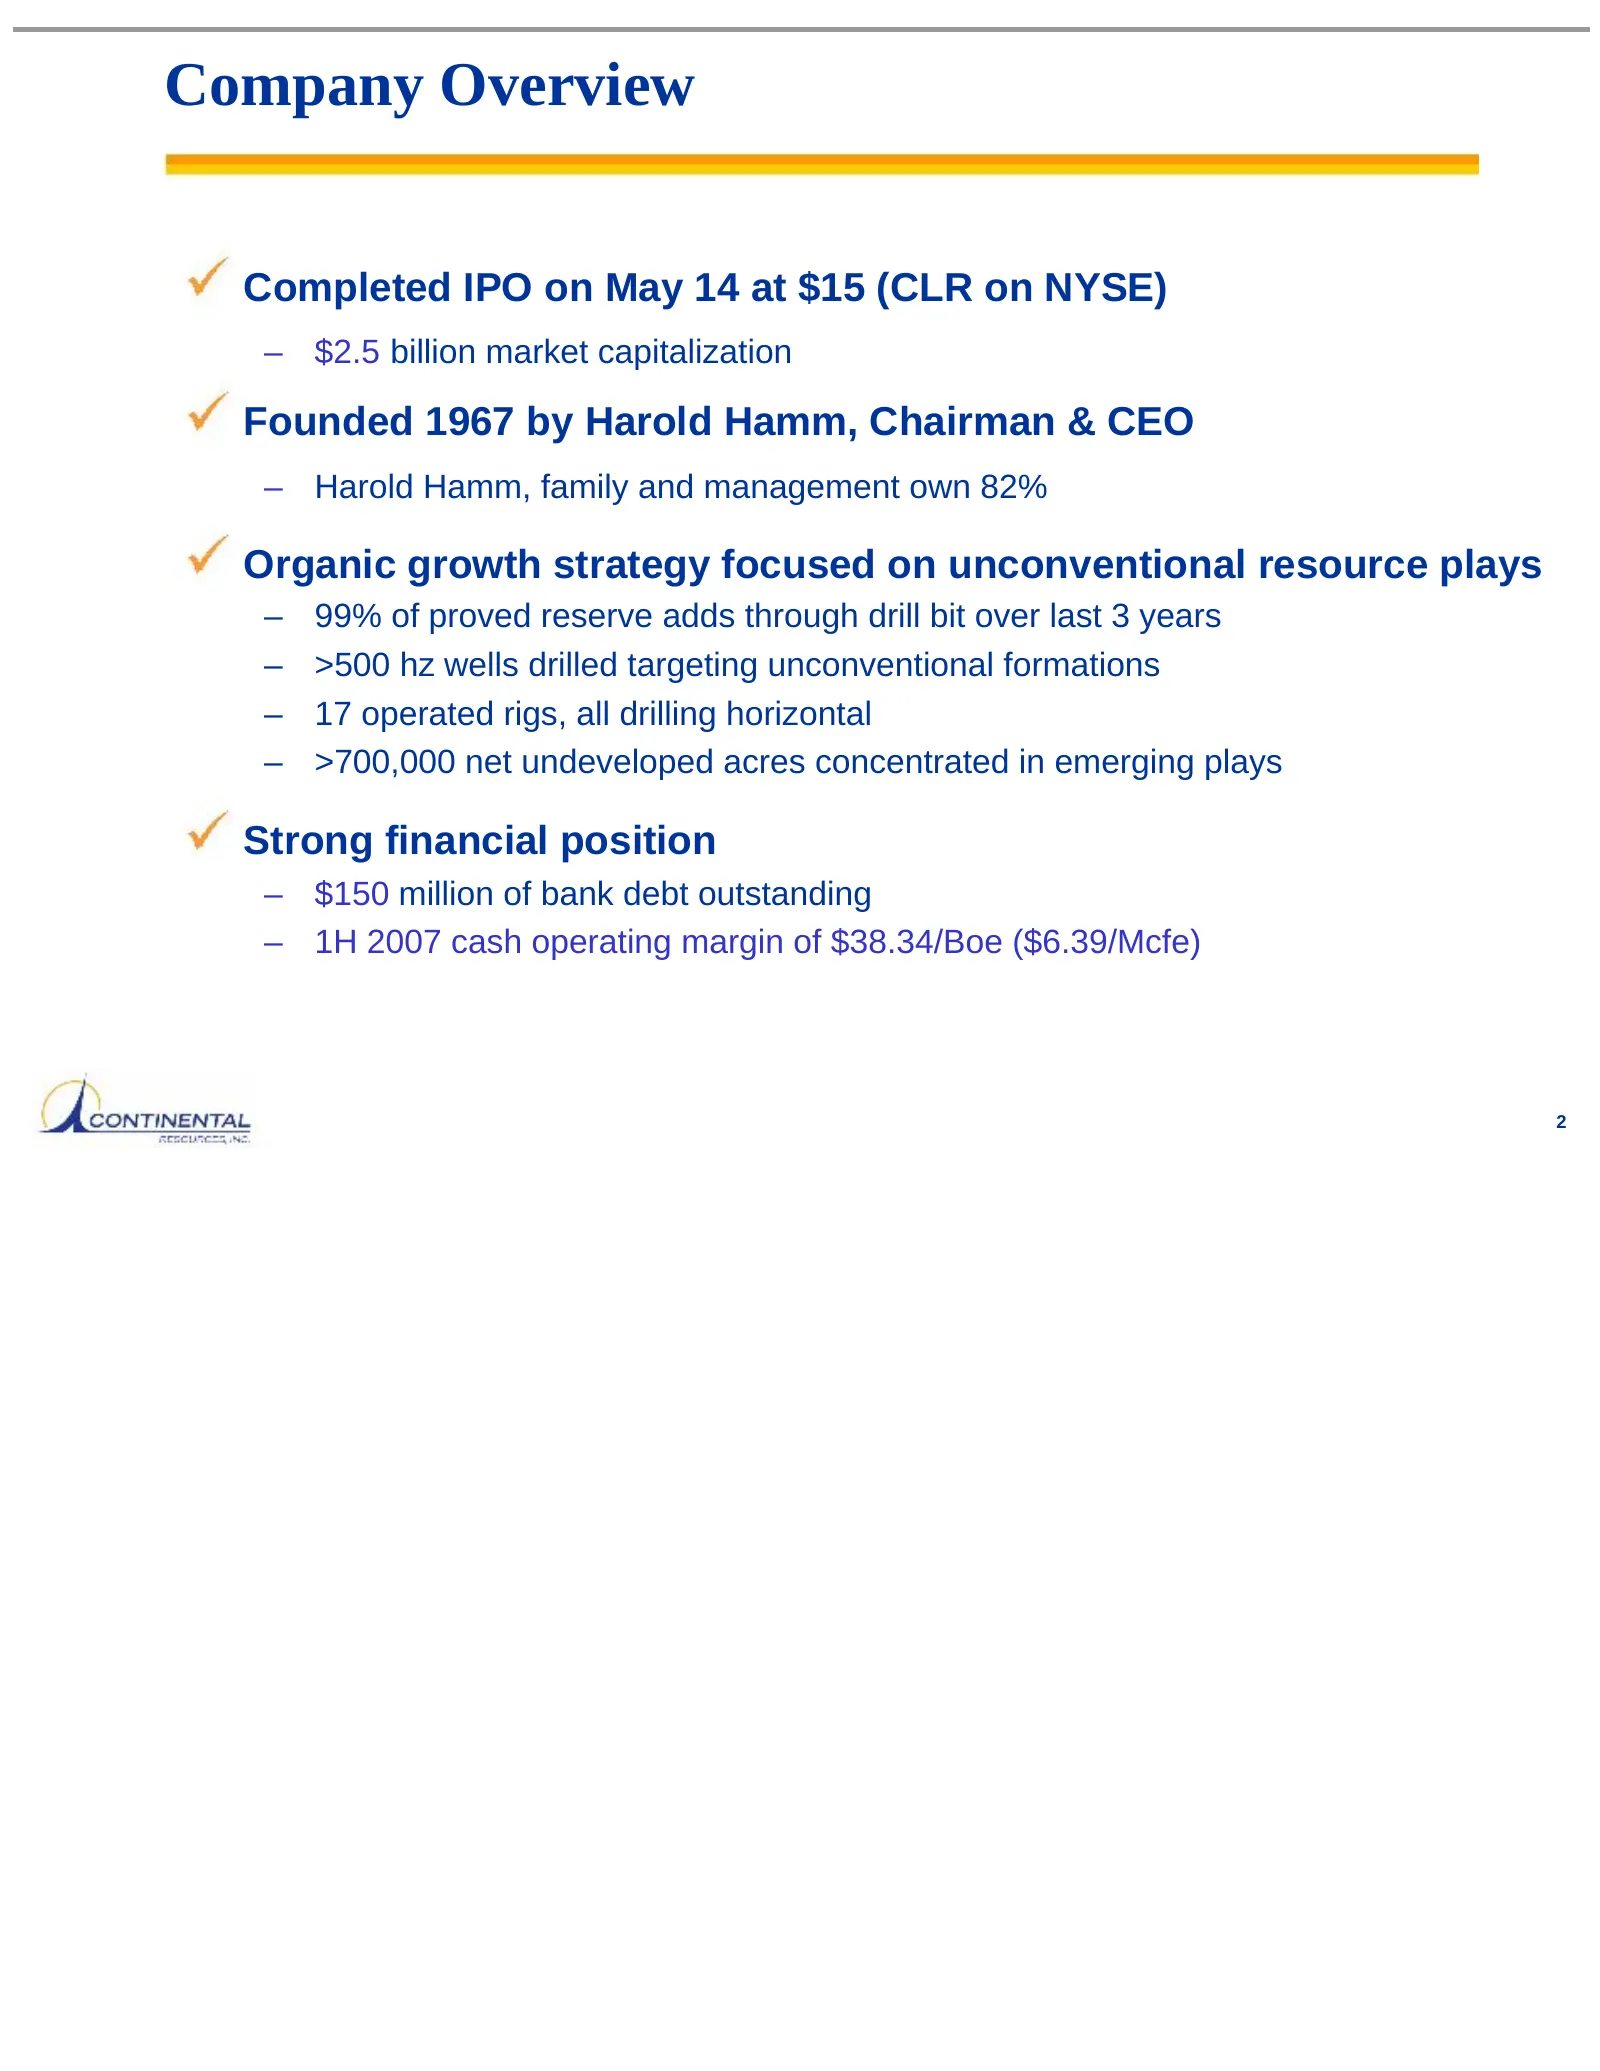
Company Overview Completed IPO on May 14 at $15 (CLR on NYSE) – $2.5 billion market capitalization Founded 1967 by Harold Hamm, Chairman & CEO – Harold Hamm, family and management own 82% Organic growth strategy focused on unconventional resource plays – 99% of proved reserve adds through drill bit
Slide 4: Investment in Asset Base
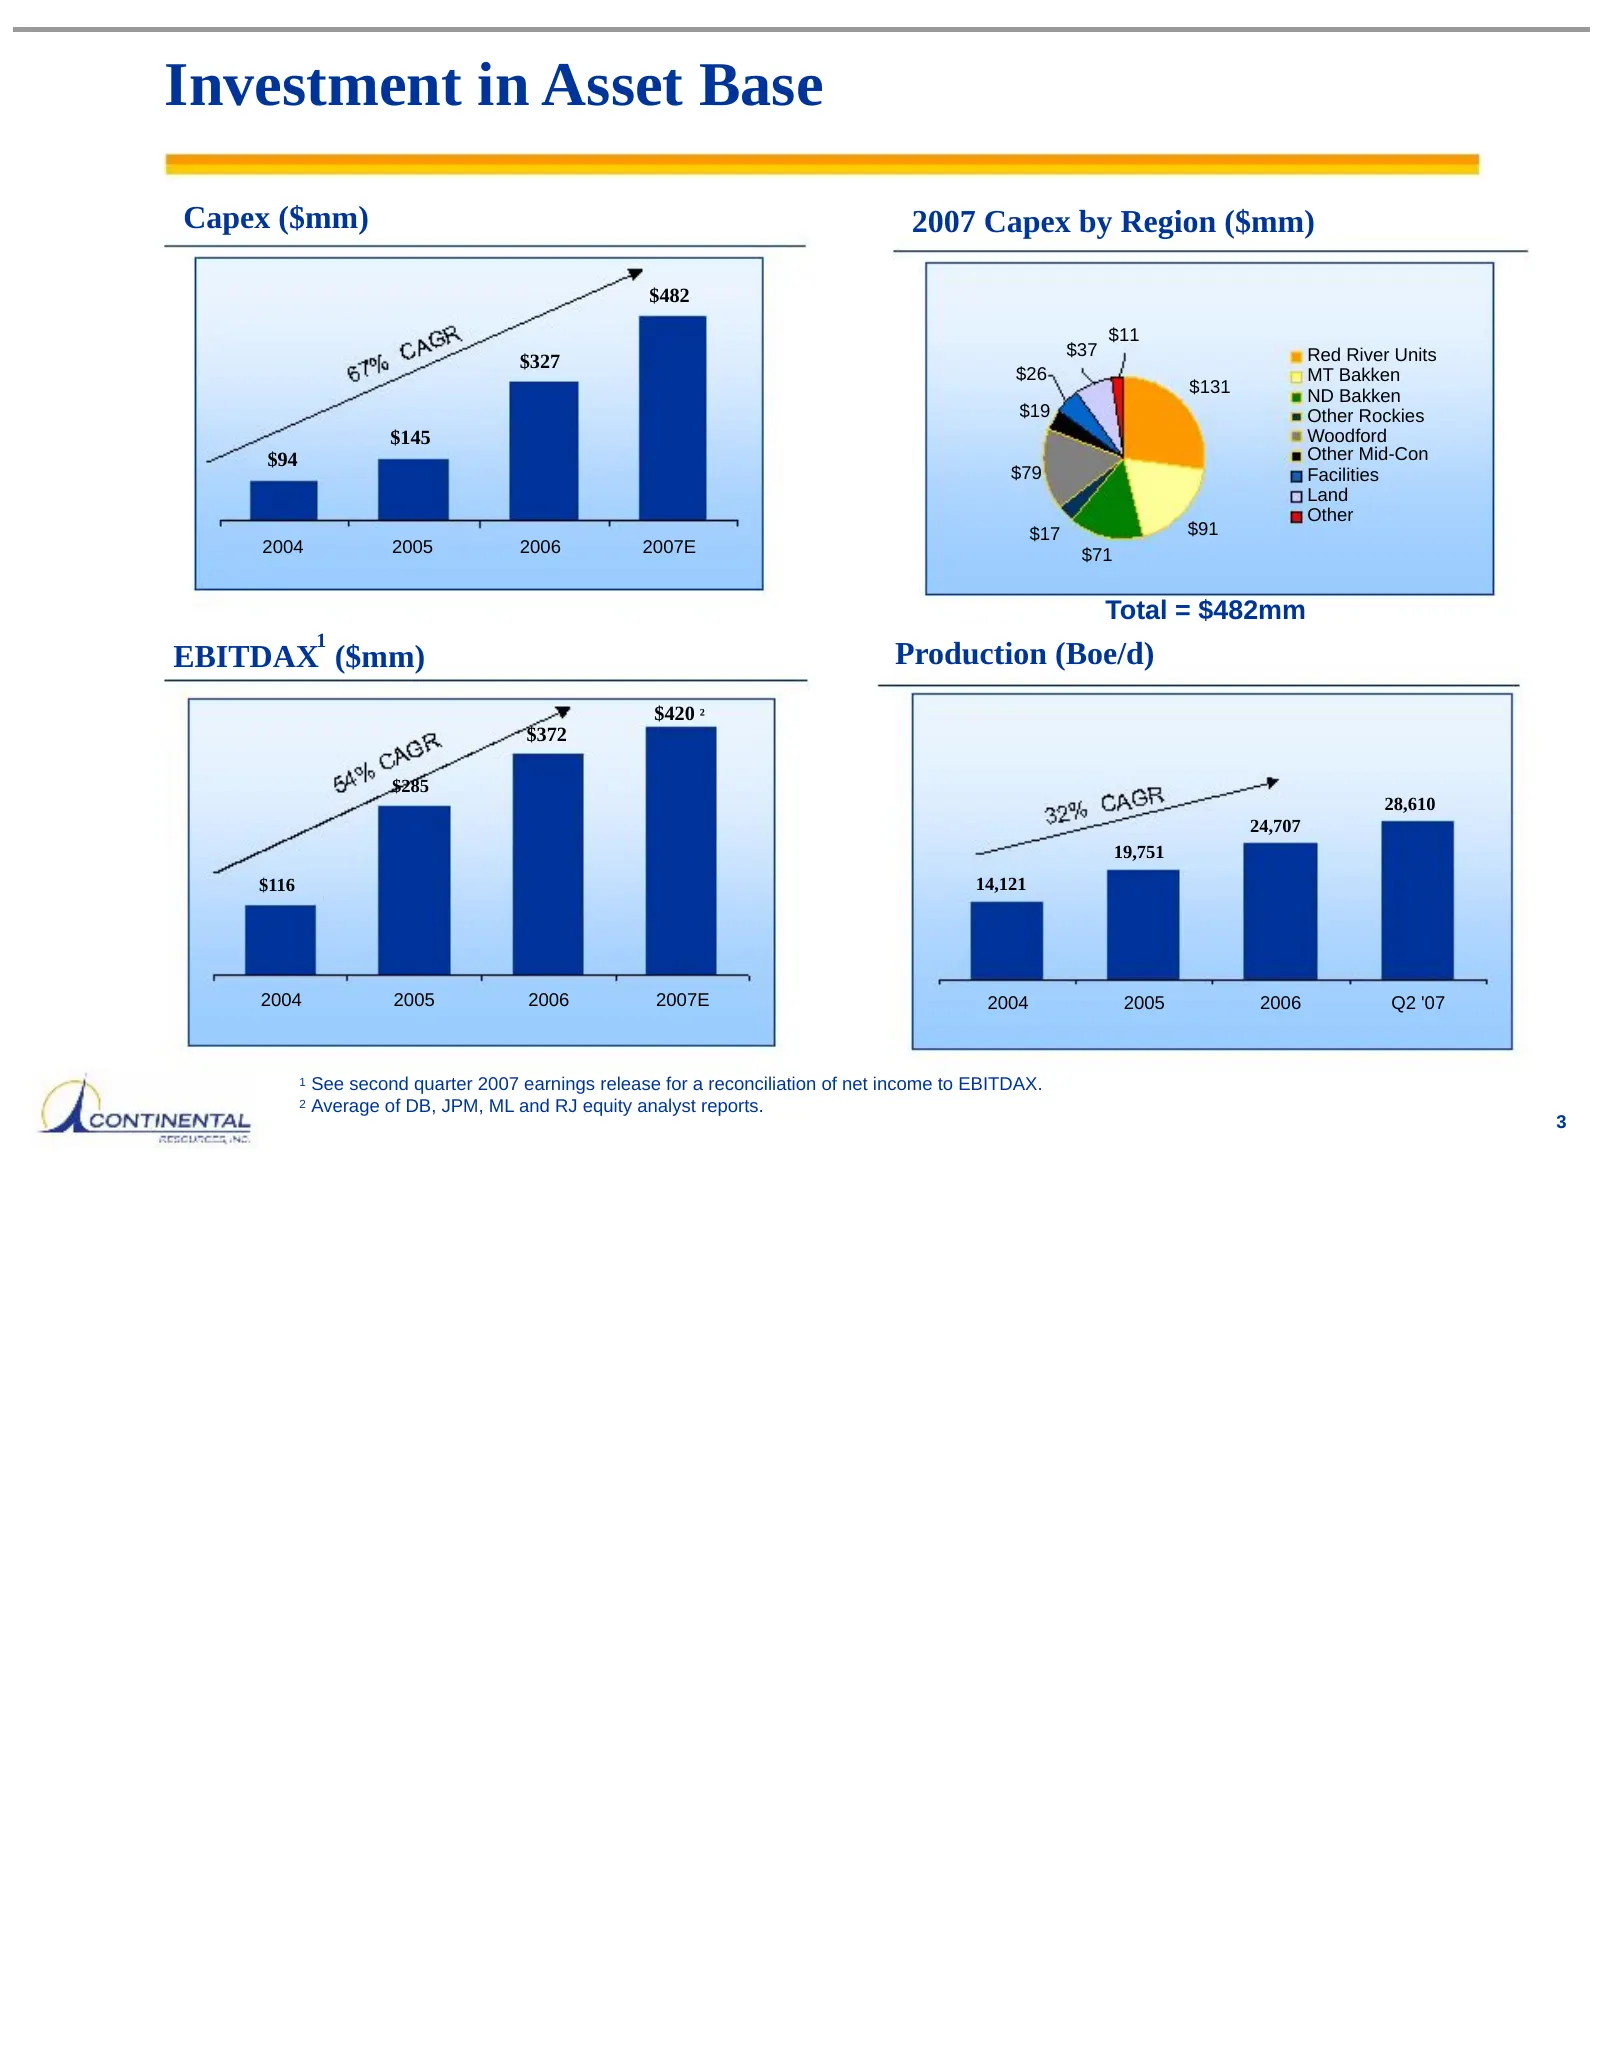
Investment in Asset Base Capex ($mm) 2007 Capex by Region ($mm) $482 $11 $37 Red River Units $327 $26 MT Bakken $131 ND Bakken $19 Other Rockies $145 Woodford $94 Other Mid-Con $79 Facilities Land Other $17 $91 2004 2005 2006 2007E $71 Total = $482mm 1 EBITDAX ($mm) Production (Boe/d) $420 ² $372 $2
Slide 5: Operational Overview
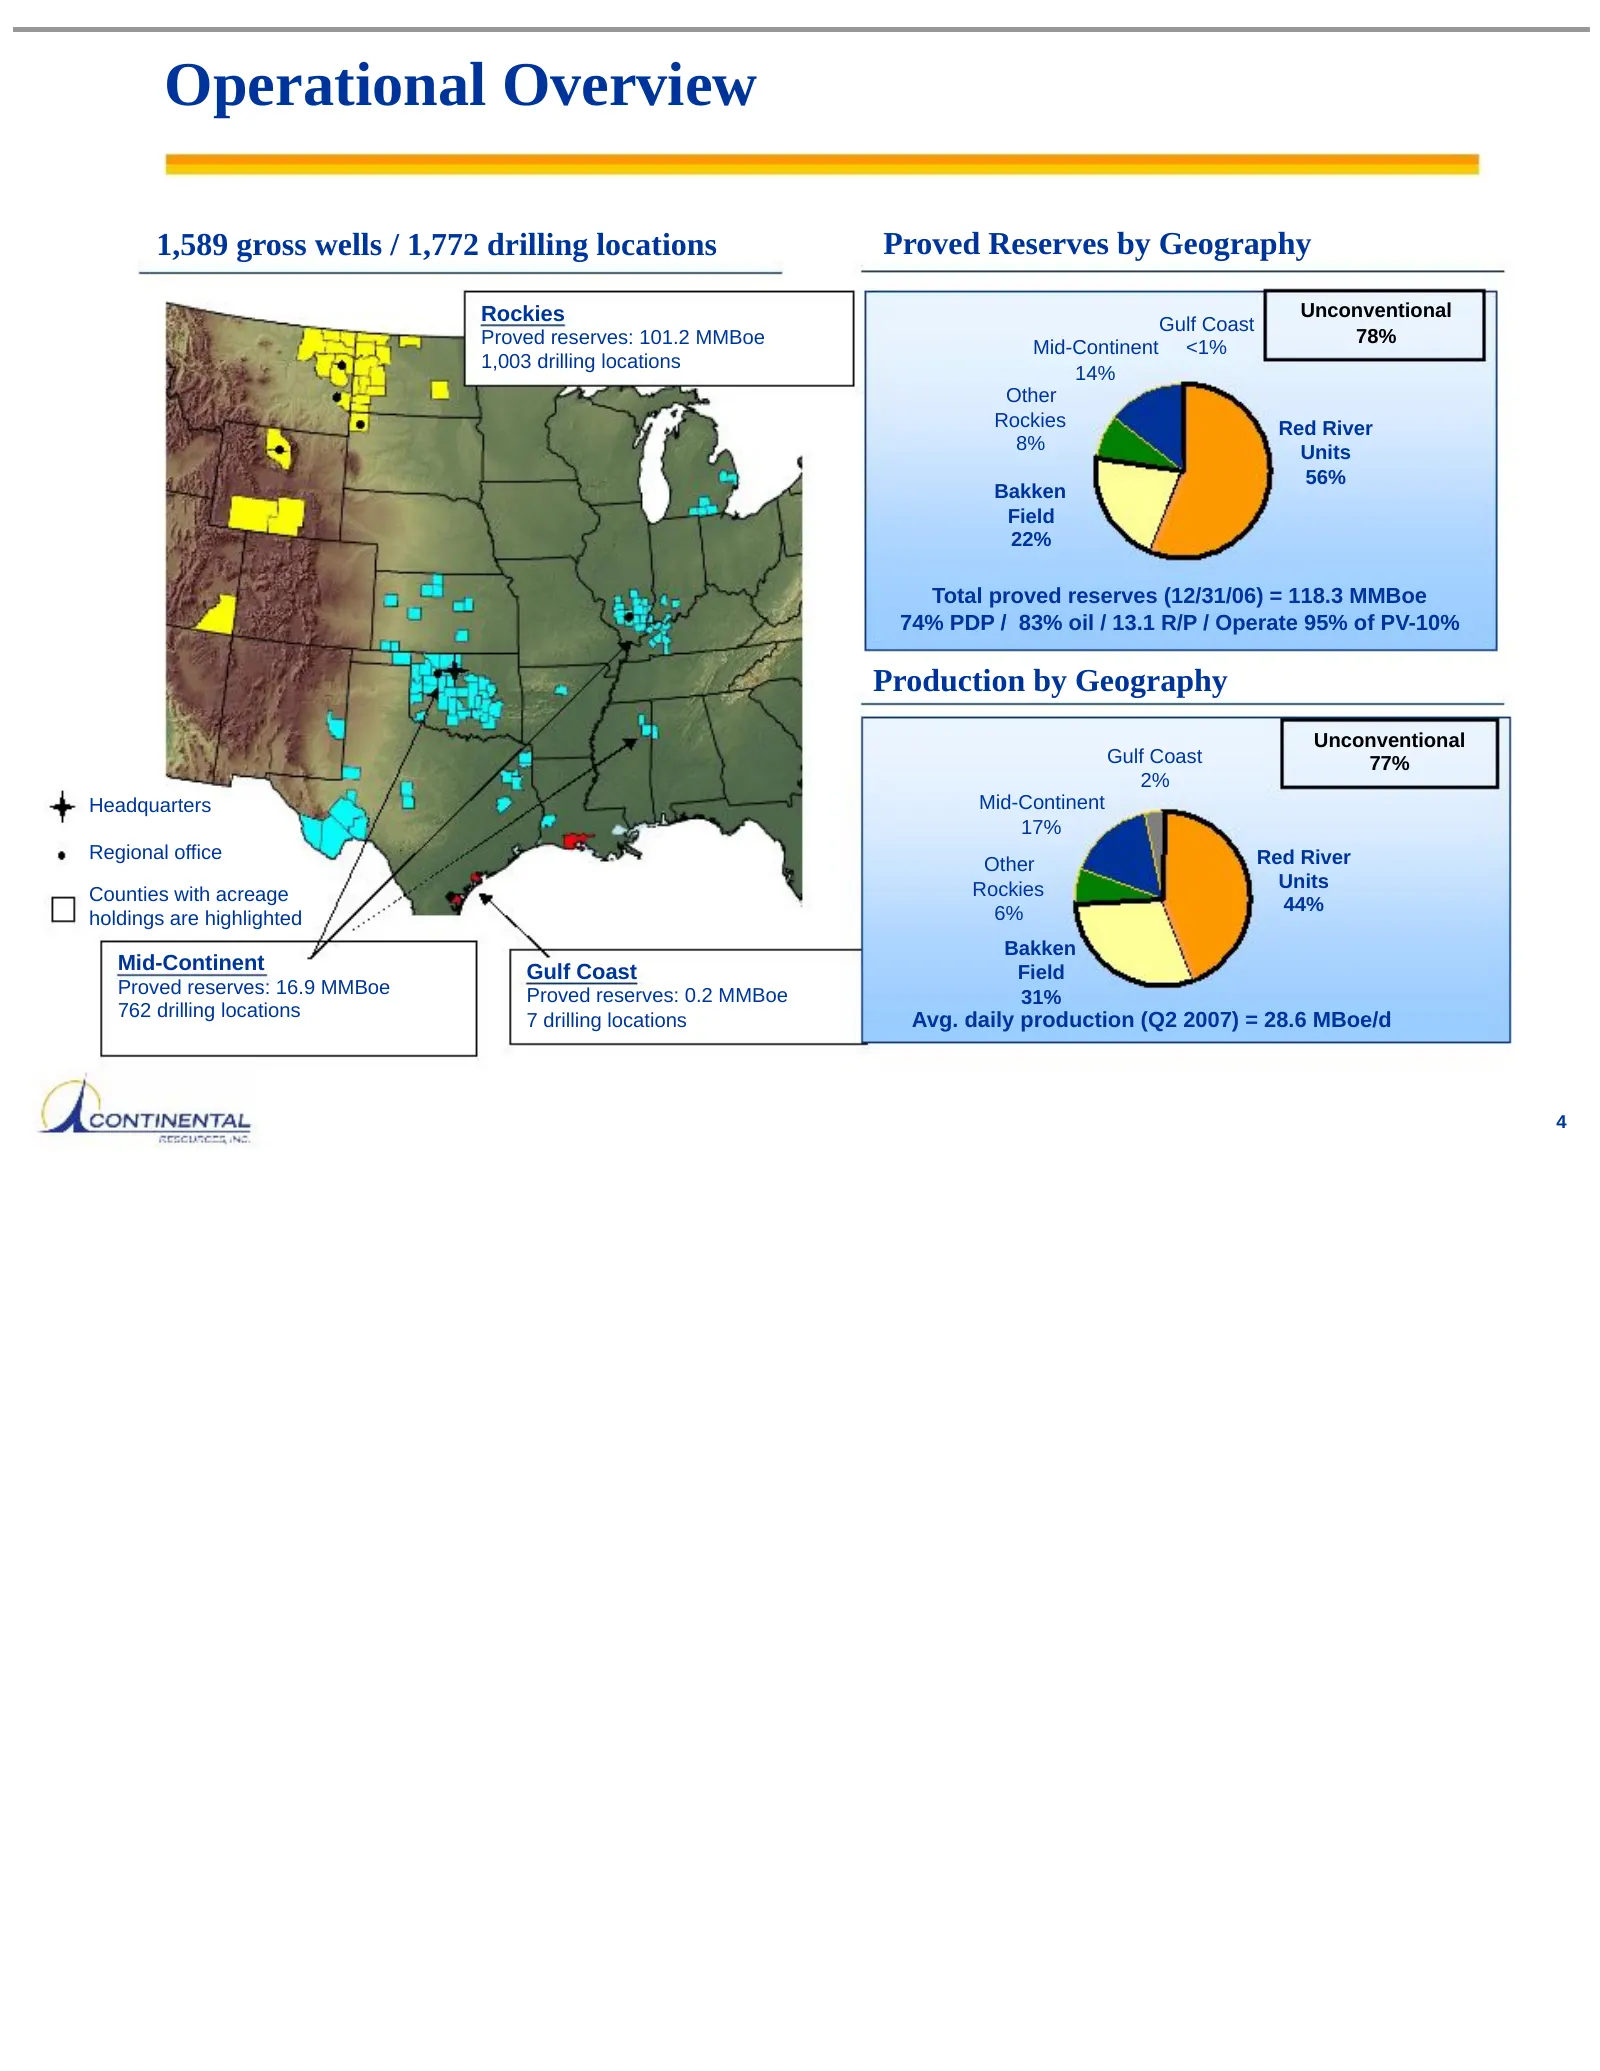
Operational Overview 1,589 gross wells / 1,772 drilling locations Proved Reserves by Geography Rockies Unconventional Gulf Coast Proved reserves: 101.2 MMBoe 78% Mid-Continent <1% 1,003 drilling locations 14% Other Rockies Red River 8% Units 56% Bakken Field 22% Total proved reserves (12/31/06) = 11
Slide 6: Key 2007 Drilling Projects
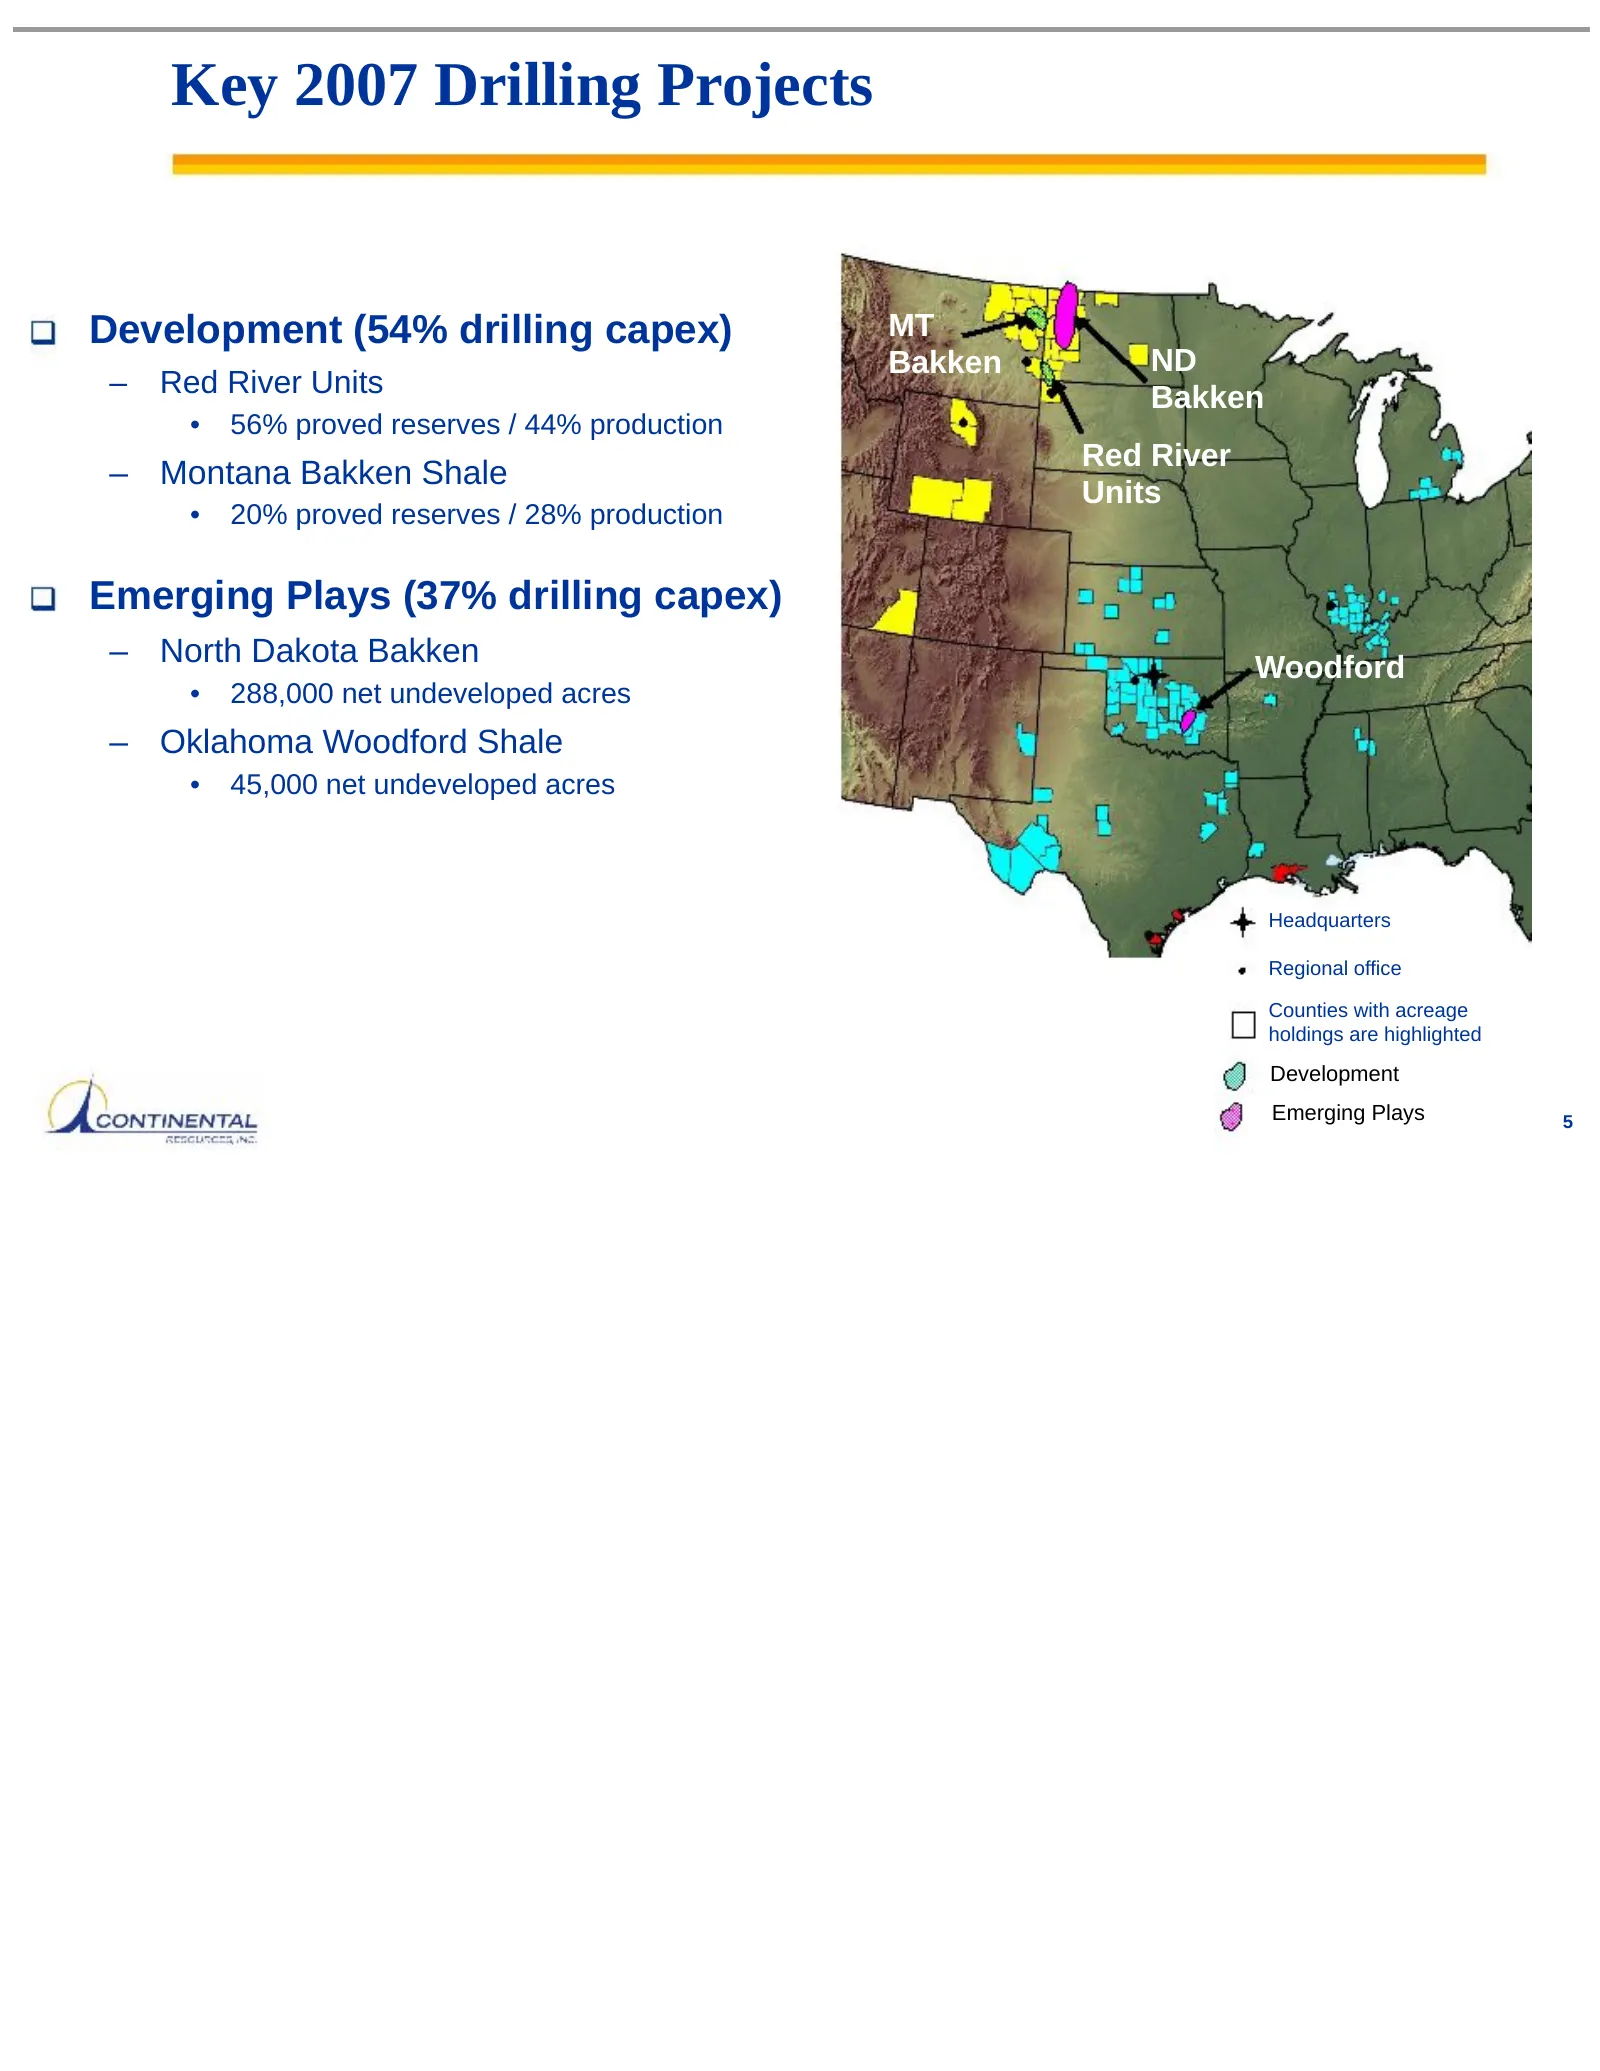
Key 2007 Drilling Projects Development (54% drilling capex) MT Bakken ND – Red River Units Bakken • 56% proved reserves / 44% production Red River – Montana Bakken Shale Units • 20% proved reserves / 28% production Emerging Plays (37% drilling capex) – North Dakota Bakken Woodford • 288,000 net unde
Slide 7: Red River Enhanced Recovery Units
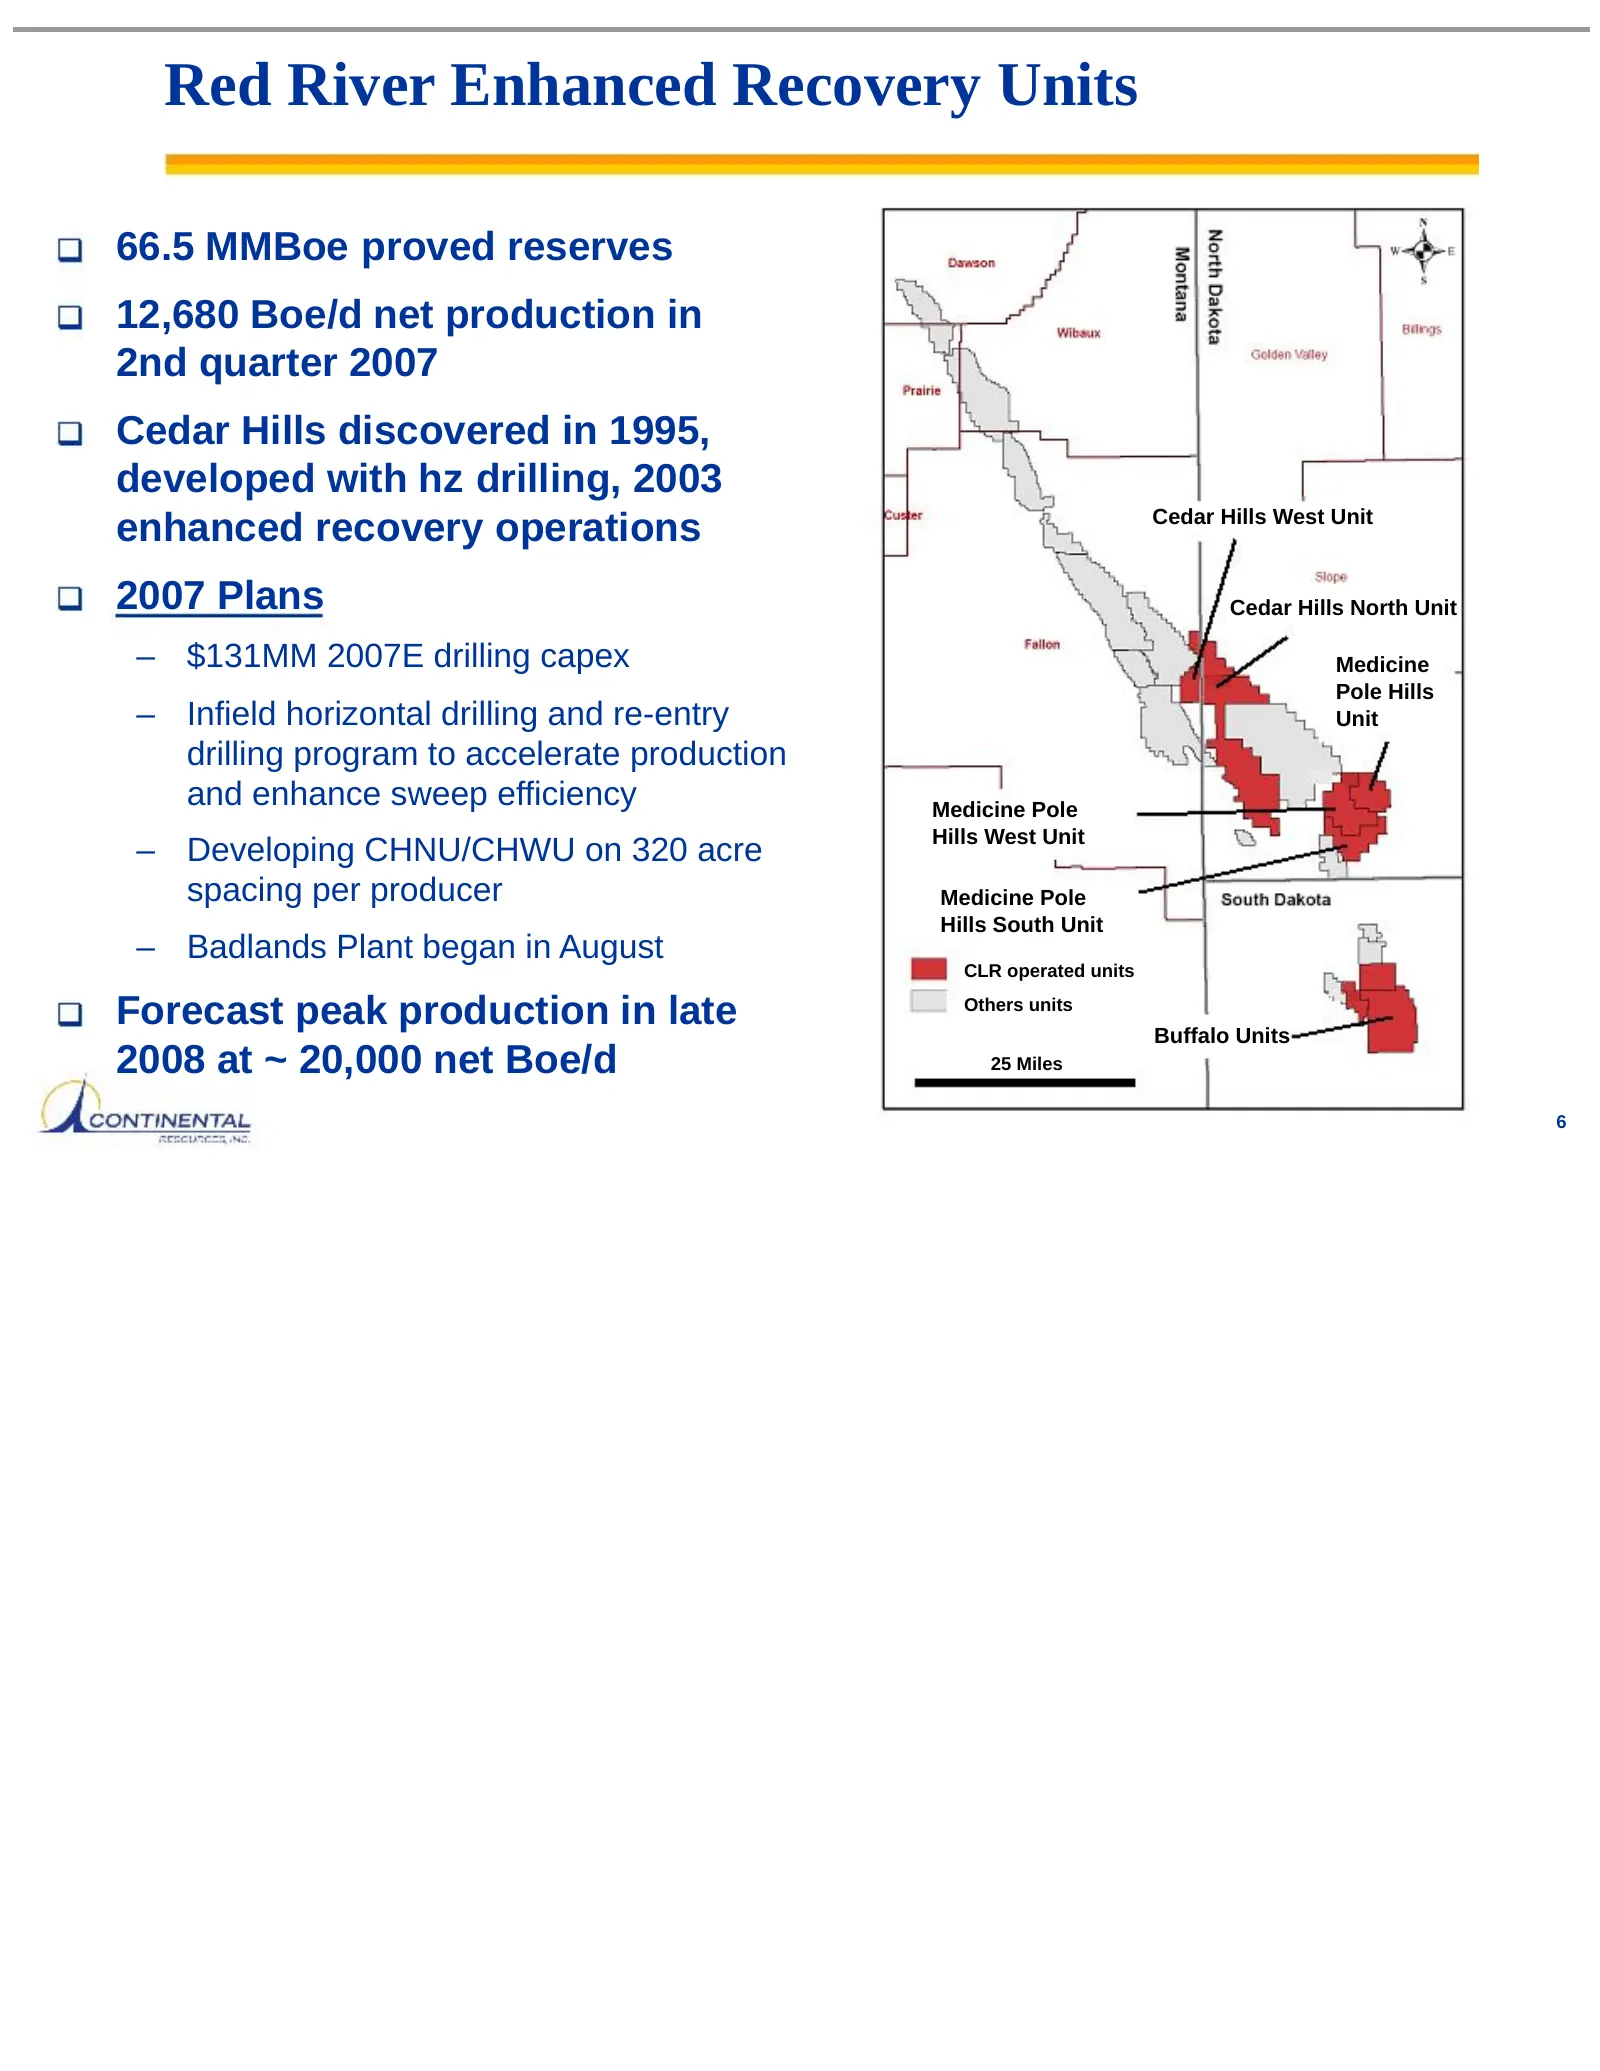
Red River Enhanced Recovery Units 66.5 MMBoe proved reserves 12,680 Boe/d net production in 2nd quarter 2007 Cedar Hills discovered in 1995, developed with hz drilling, 2003 Cedar Hills West Unit enhanced recovery operations 2007 Plans Cedar Hills North Unit – $131MM 2007E drilling capex Medicine Po
Slide 8: Montana Bakken Shale
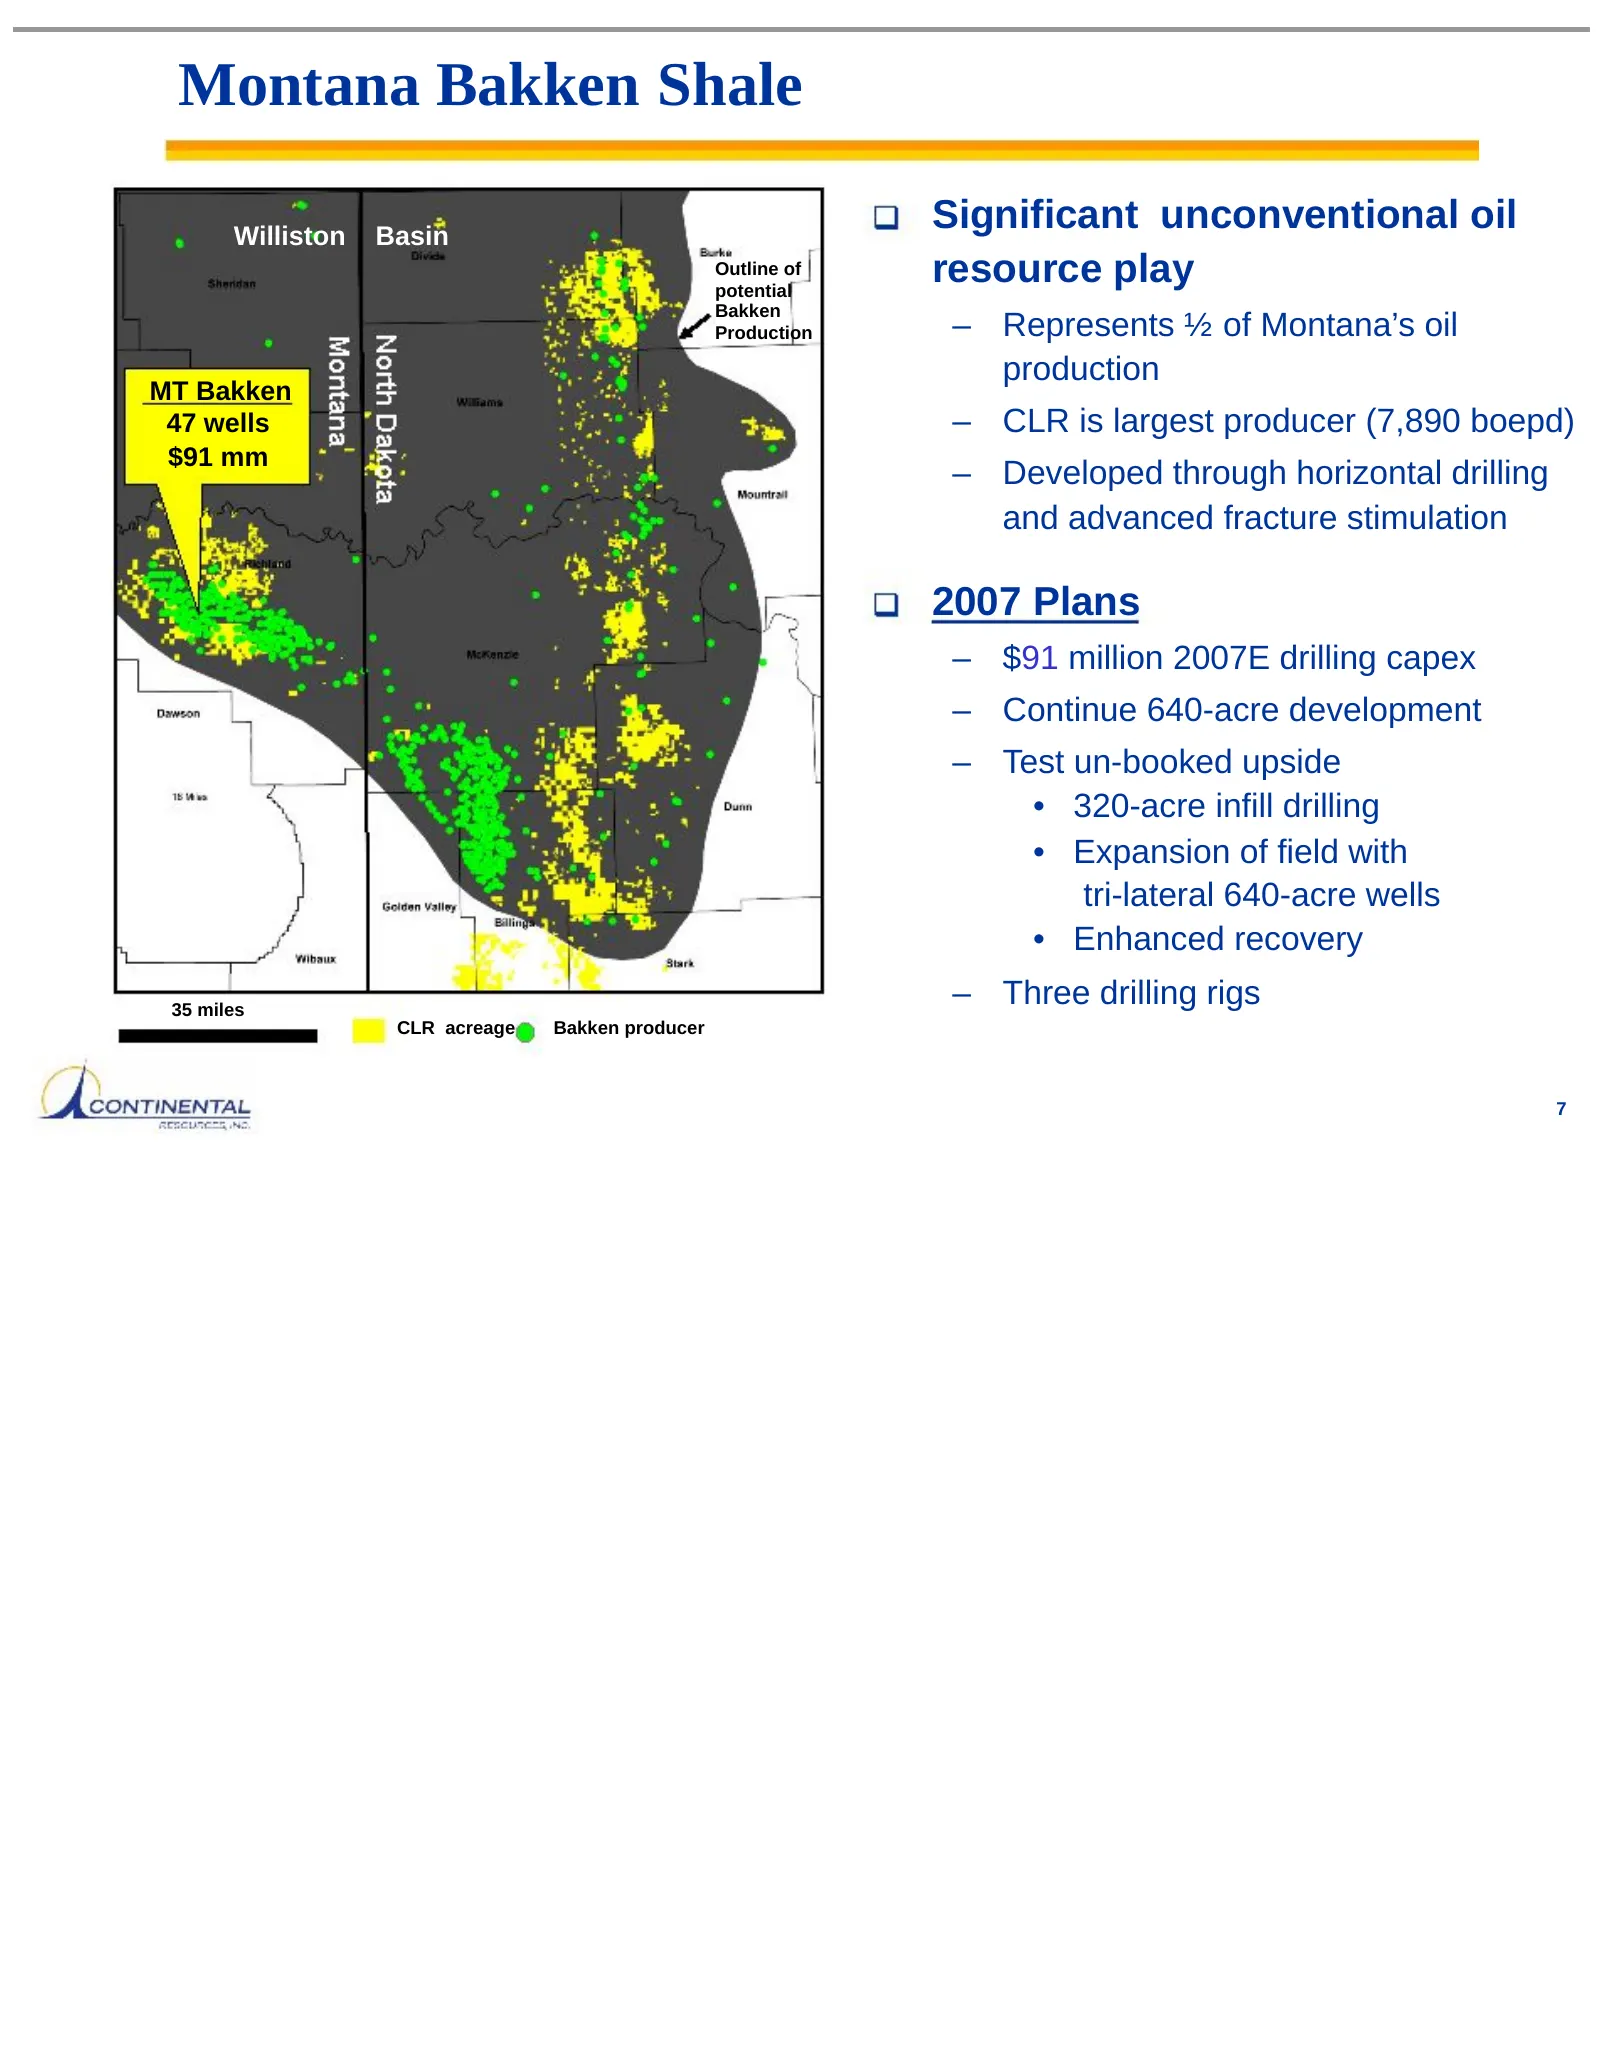
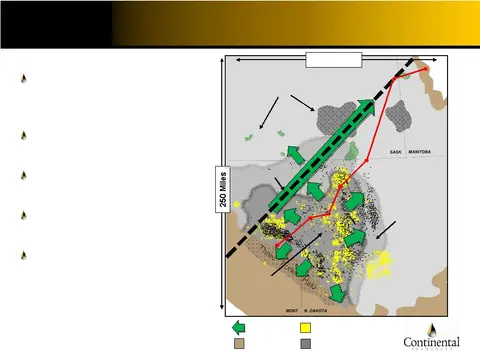
Montana Bakken Shale Williston Basin Significant unconventional oil Outline of potential resource play Bakken Production – Represents ½ of Montana’s oil production MT Bakken 47 wells – CLR is largest producer (7,890 boepd) $91 mm – Developed through horizontal drilling and advanced fracture stimulat
Slide 9: Richland County, Montana Infills
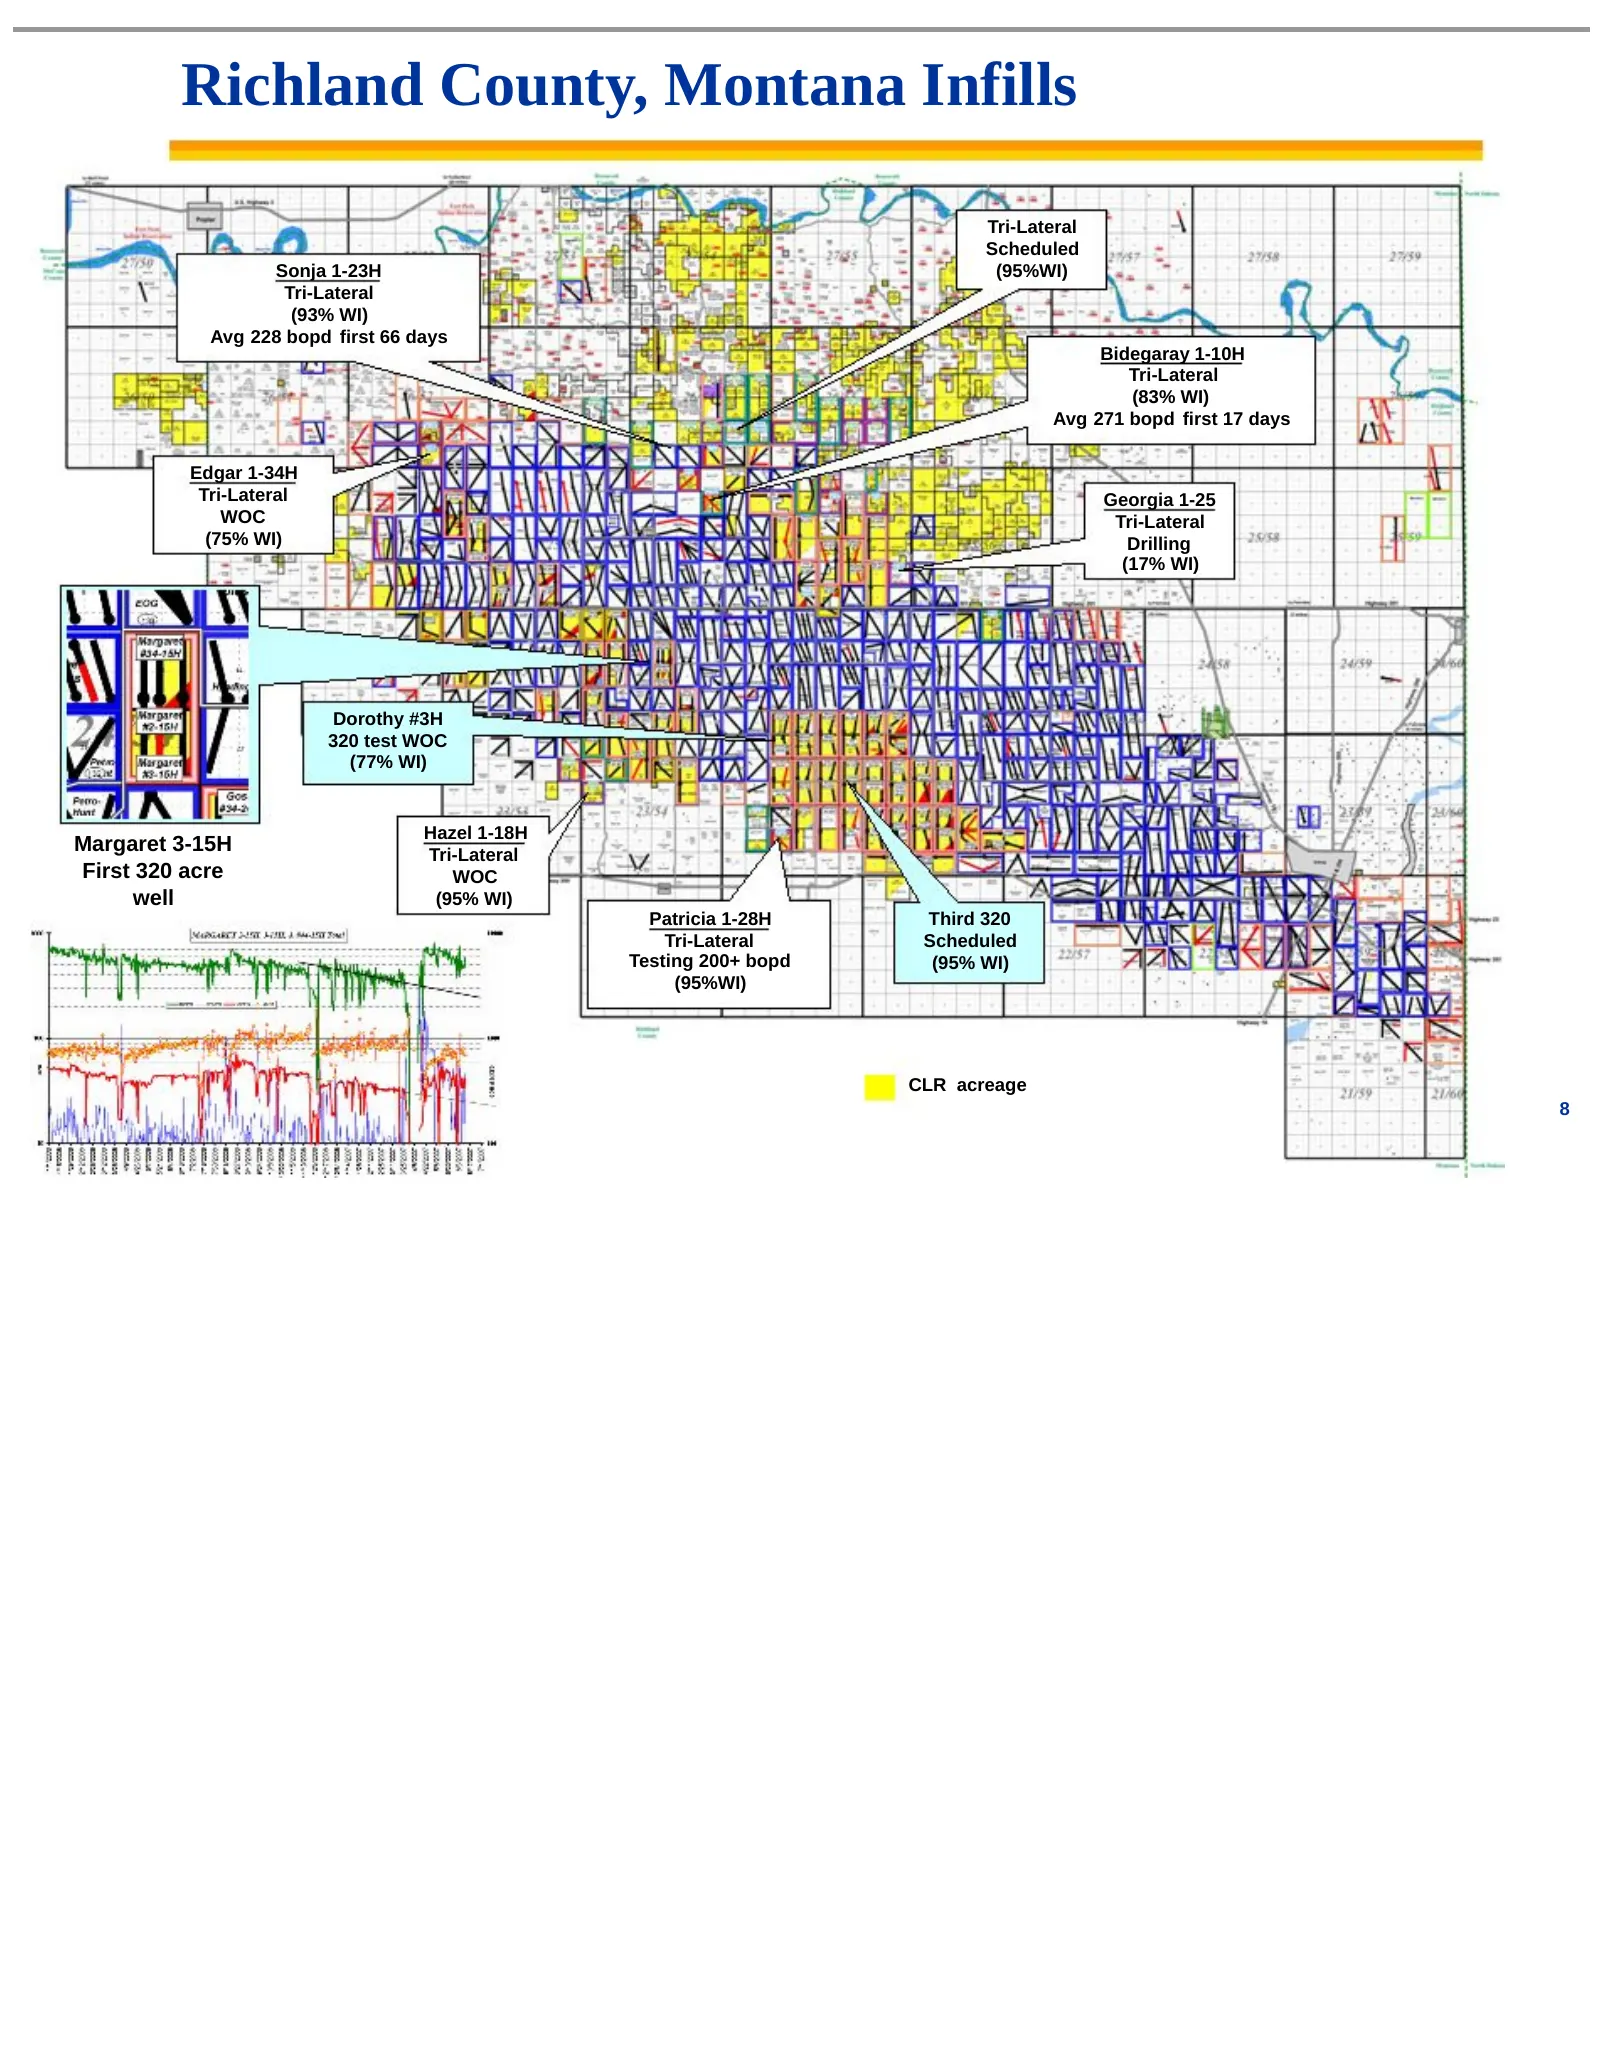
Richland County, Montana Infills Tri-Lateral Scheduled Sonja 1-23H (95%WI) Tri-Lateral (93% WI) Avg 228 bopd first 66 days Bidegaray 1-10H Tri-Lateral (83% WI) Avg 271 bopd first 17 days Edgar 1-34H Tri-Lateral Georgia 1-25 WOC Tri-Lateral (75% WI) Drilling (17% WI) Dorothy #3H 320 test WOC (77% WI)
Slide 10: MT Bakken economic models
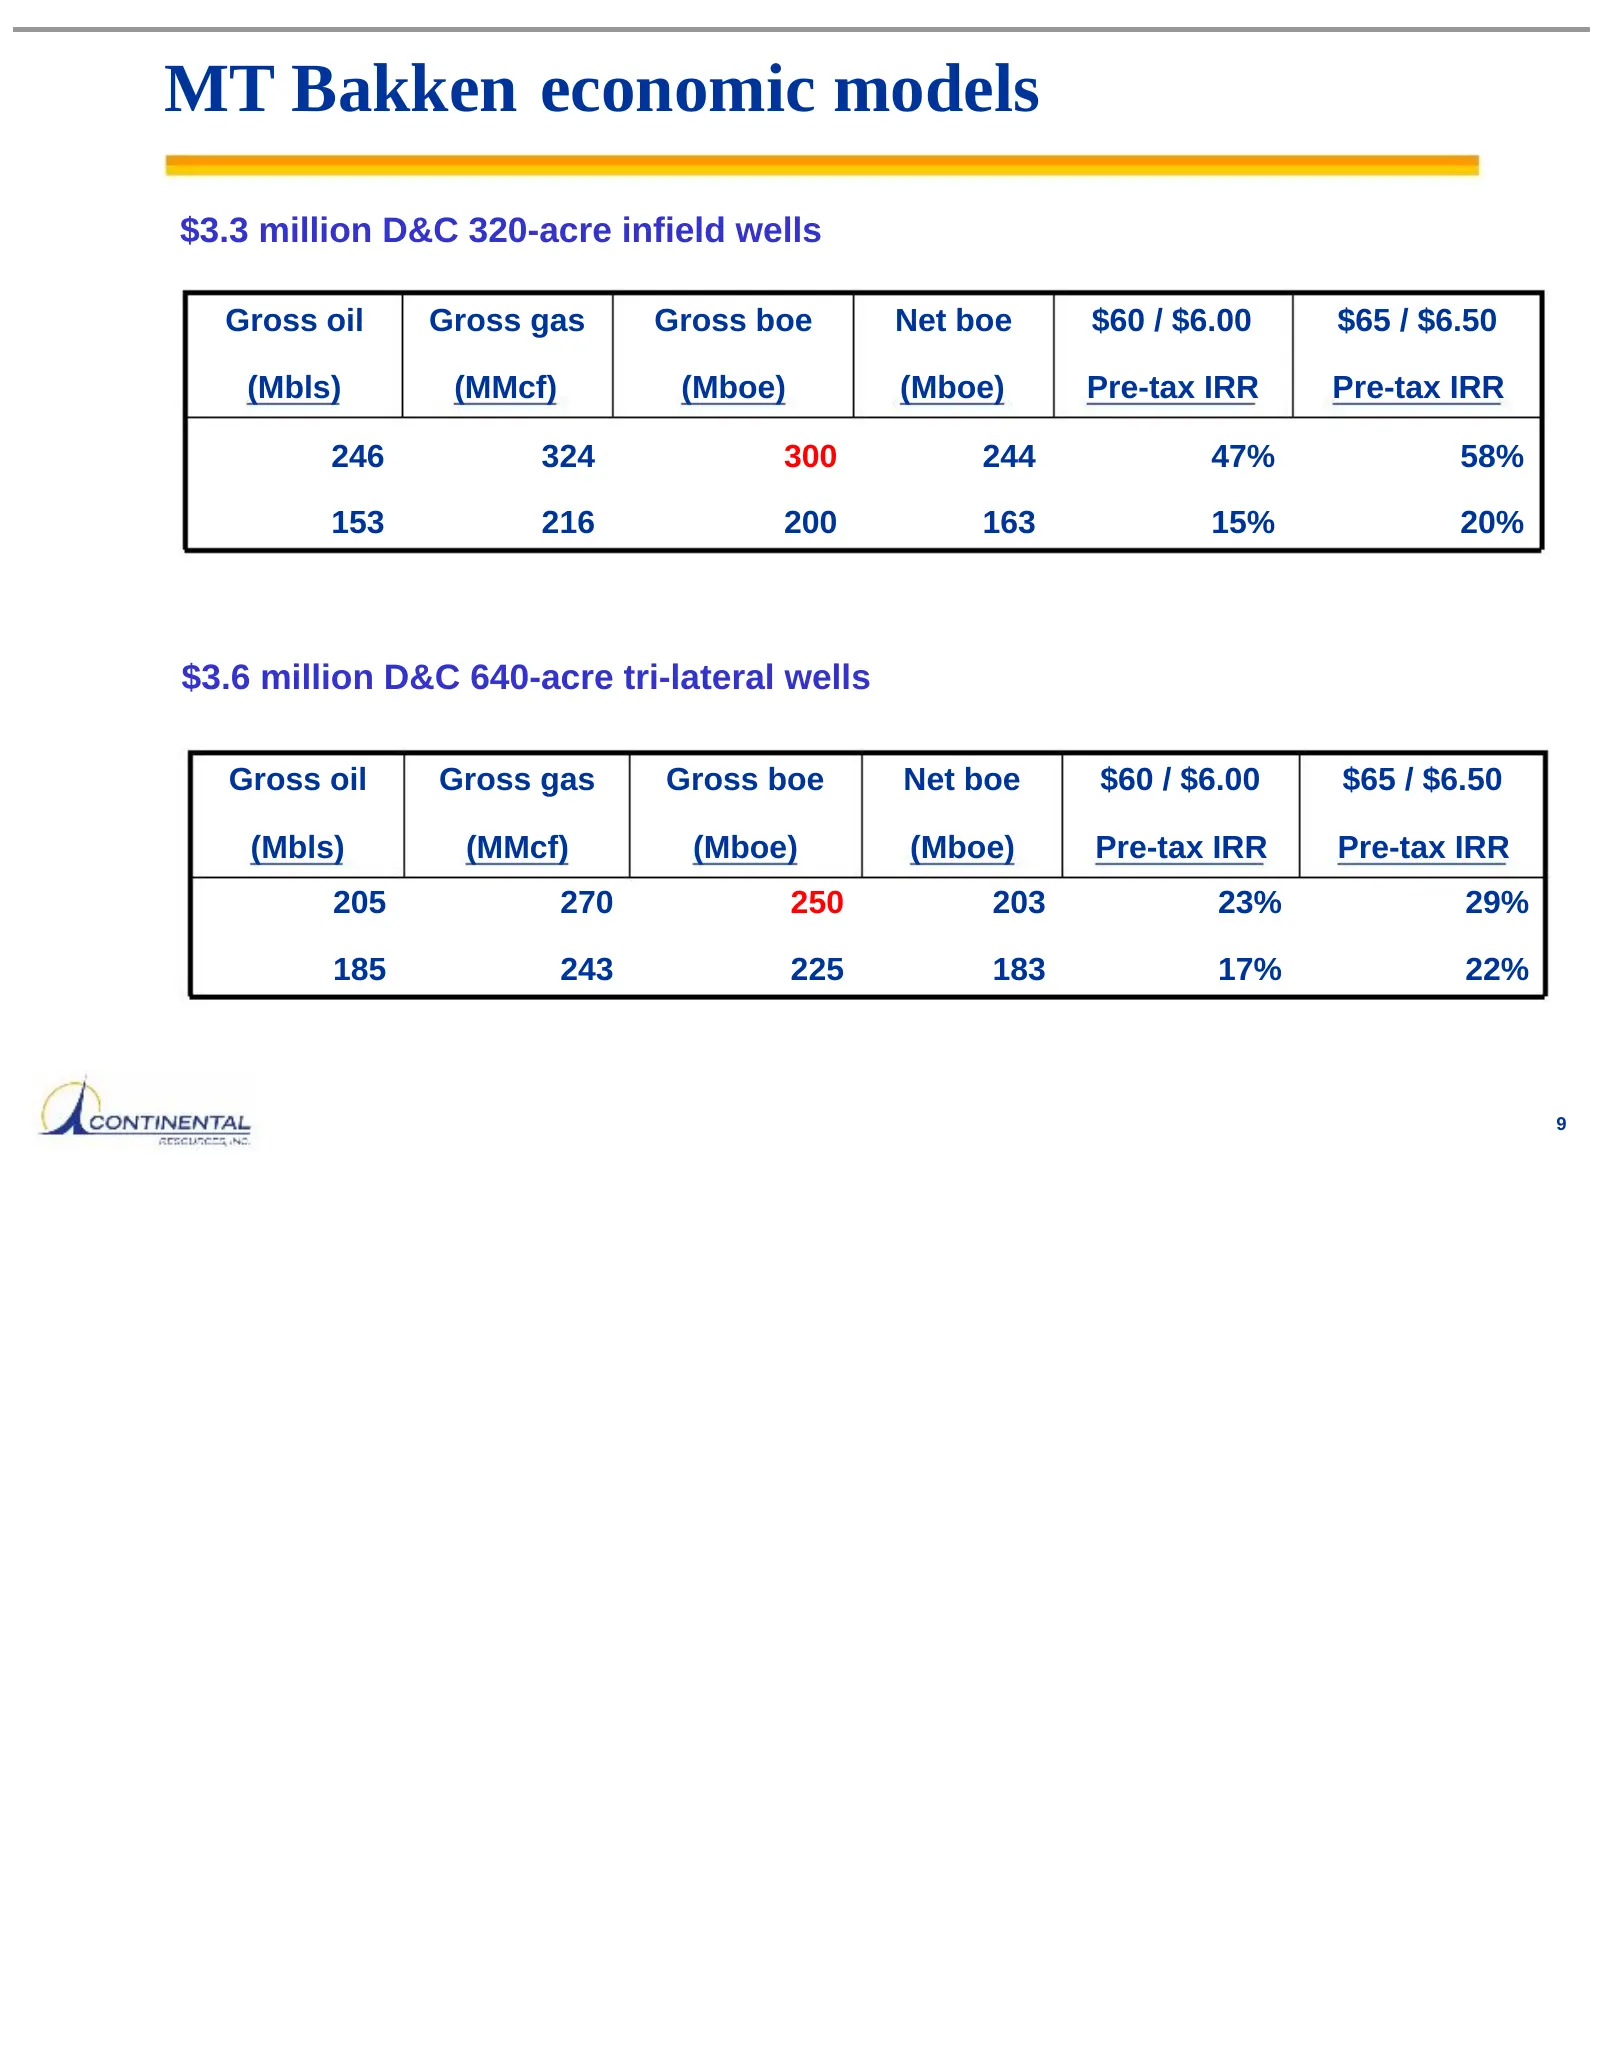
MT Bakken economic models $3.3 million D&C 320-acre infield wells Gross oil Gross gas Gross boe Net boe $60 / $6.00 $65 / $6.50 (Mbls) (MMcf) (Mboe) (Mboe) Pre-tax IRR Pre-tax IRR 246 324 300 244 47% 58% 153 216 200 163 15% 20% $3.6 million D&C 640-acre tri-lateral wells Gross oil Gross gas Gross bo
Slide 11: North Dakota Bakken Shale
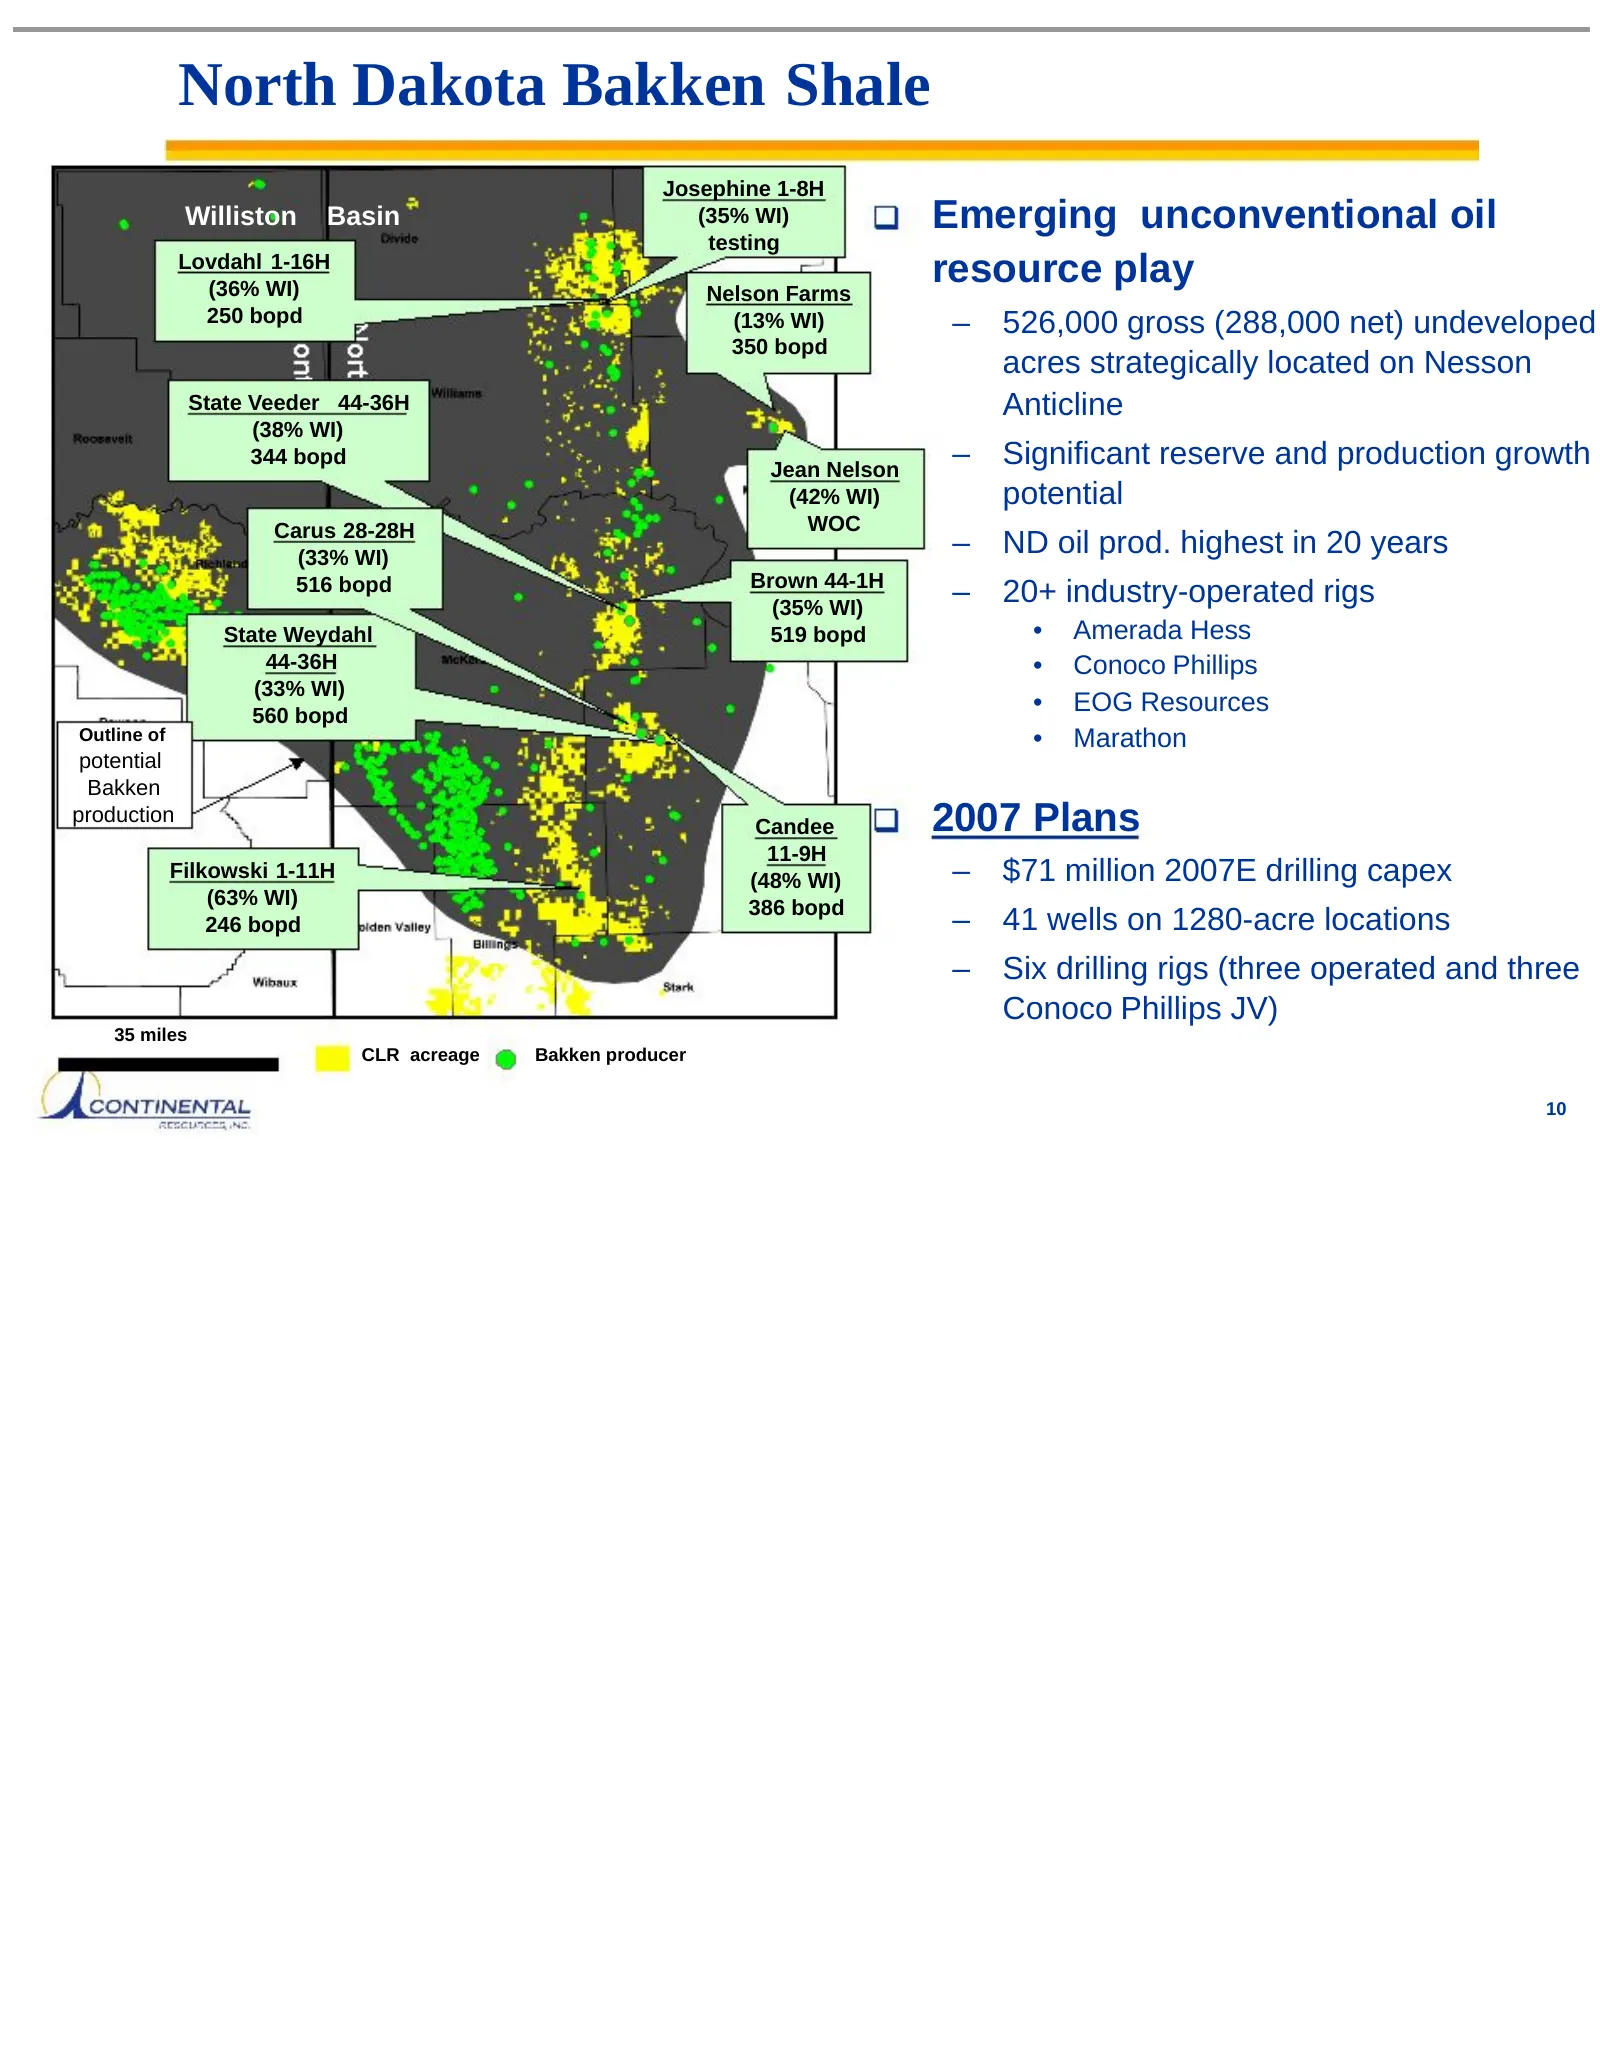
North Dakota Bakken Shale Josephine 1-8H Williston Basin (35% WI) Emerging unconventional oil testing Lovdahl 1-16H (36% WI) Nelson Farms resource play 250 bopd (13% WI) – 526,000 gross (288,000 net) undeveloped 350 bopd acres strategically located on Nesson State Veeder 44-36H Anticline (38% WI) 34
Slide 12: ND Bakken economic model
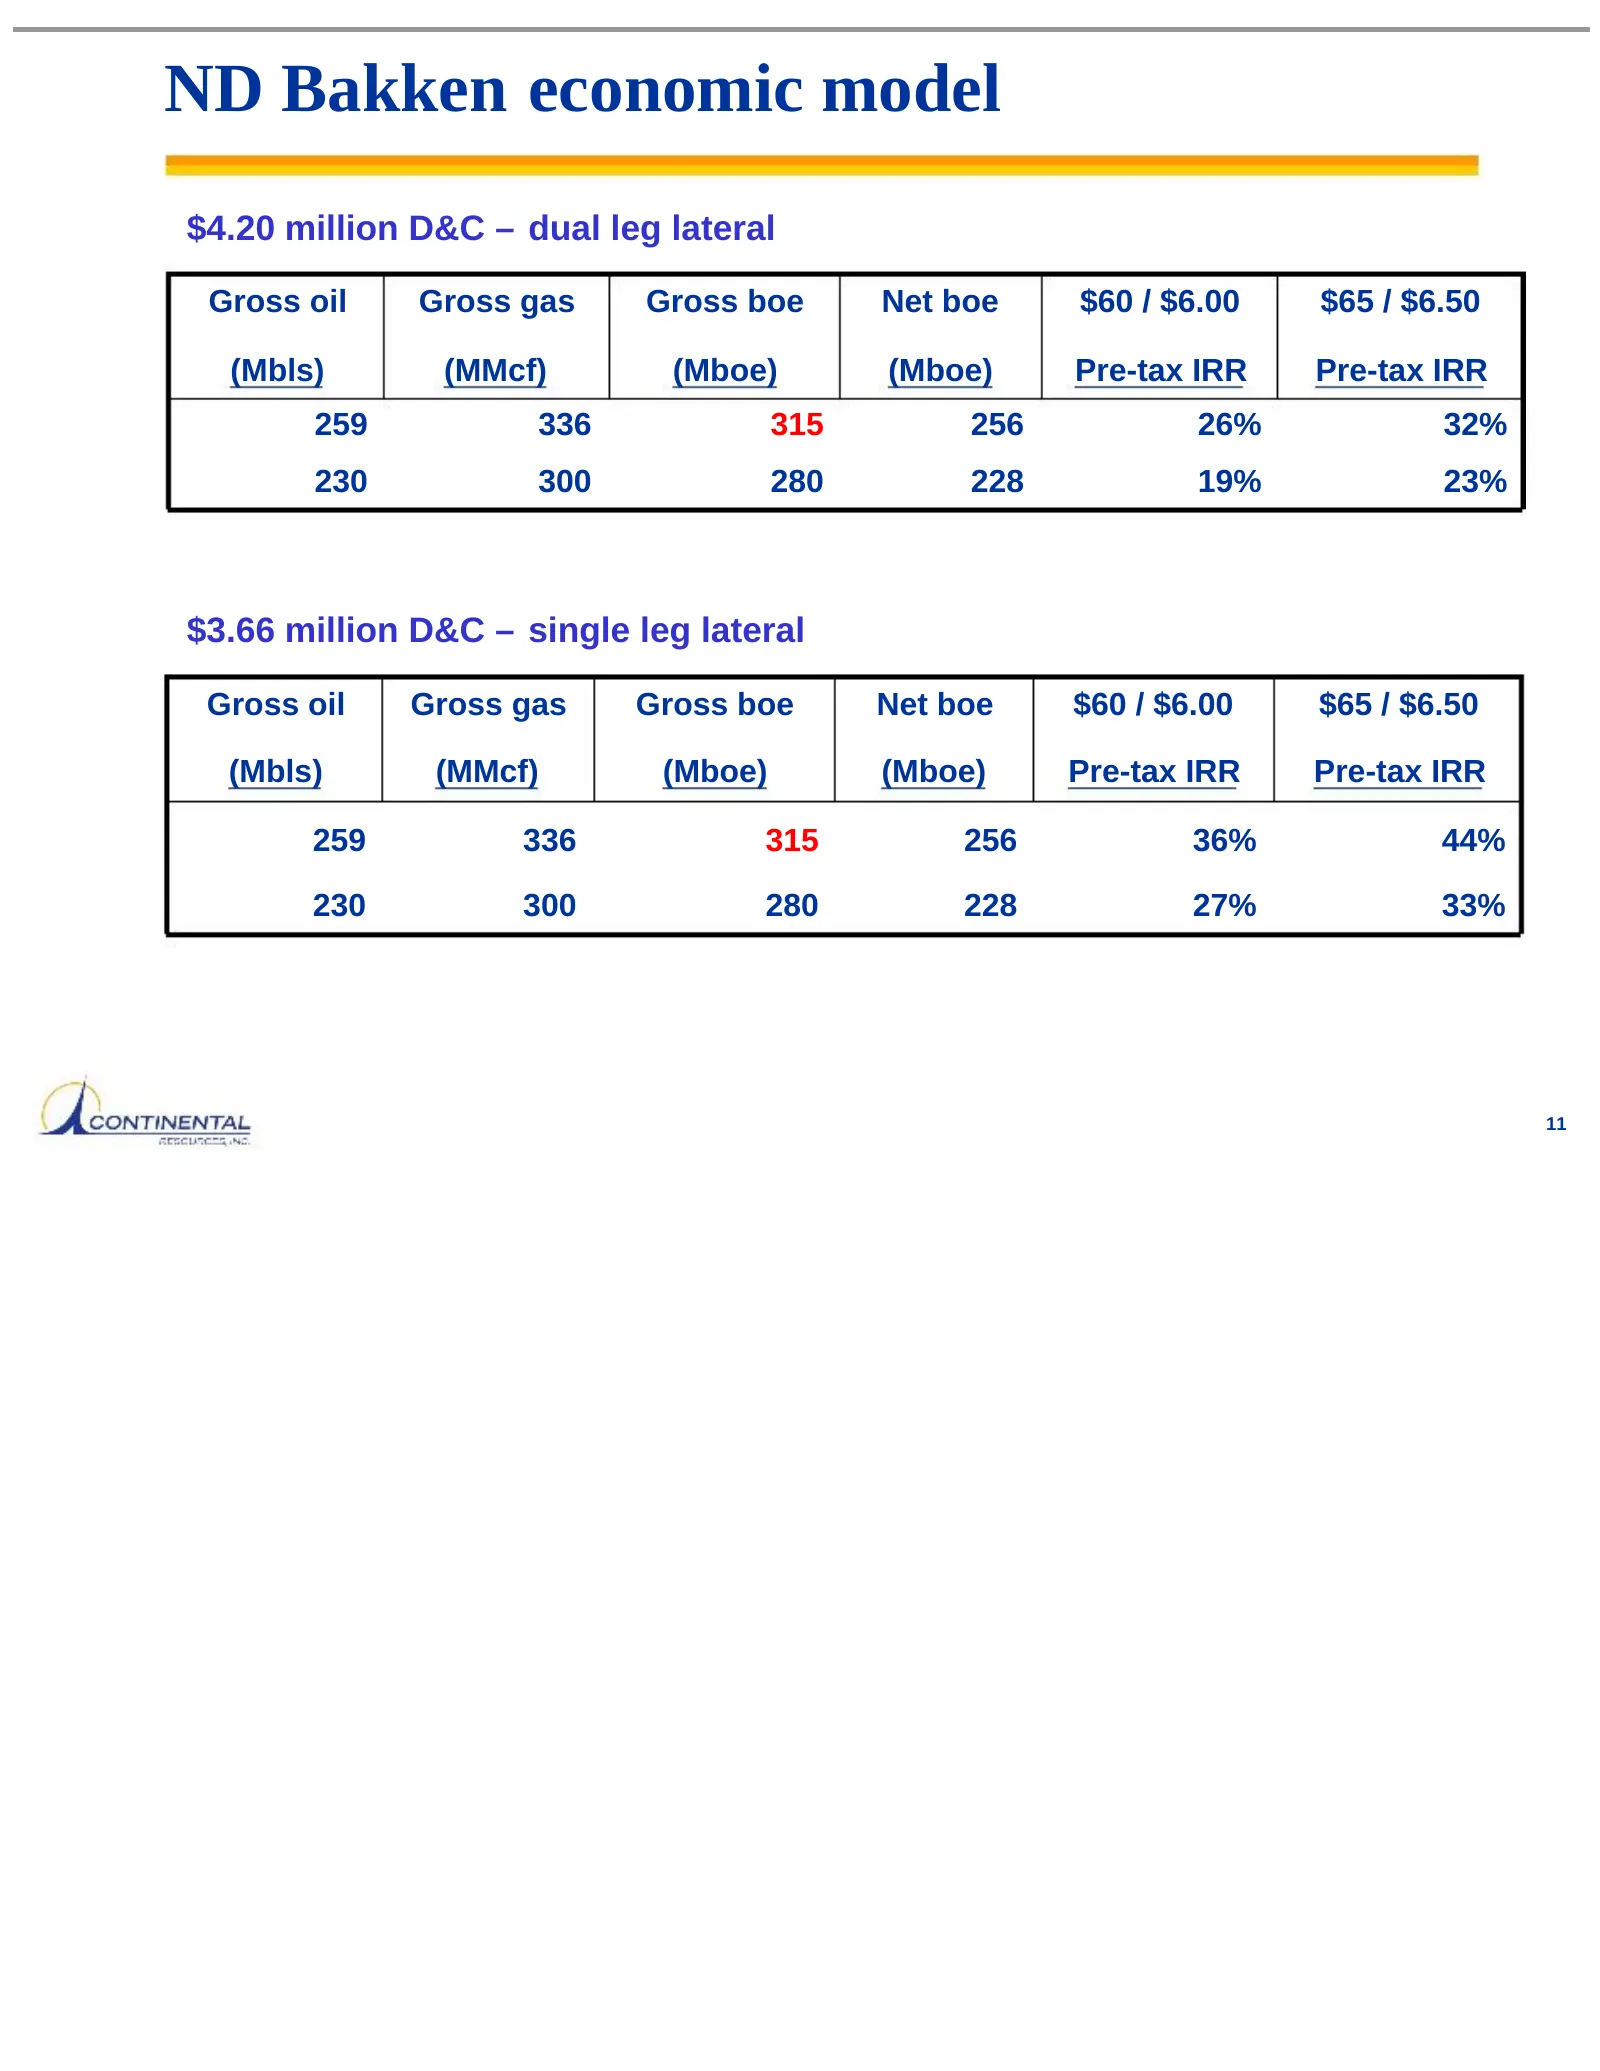
ND Bakken economic model $4.20 million D&C – dual leg lateral Gross oil Gross gas Gross boe Net boe $60 / $6.00 $65 / $6.50 (Mbls) (MMcf) (Mboe) (Mboe) Pre-tax IRR Pre-tax IRR 259 336 315 256 26% 32% 230 300 280 228 19% 23% $3.66 million D&C – single leg lateral Gross oil Gross gas Gross boe Net boe
Slide 13: Oklahoma Woodford Shale Project
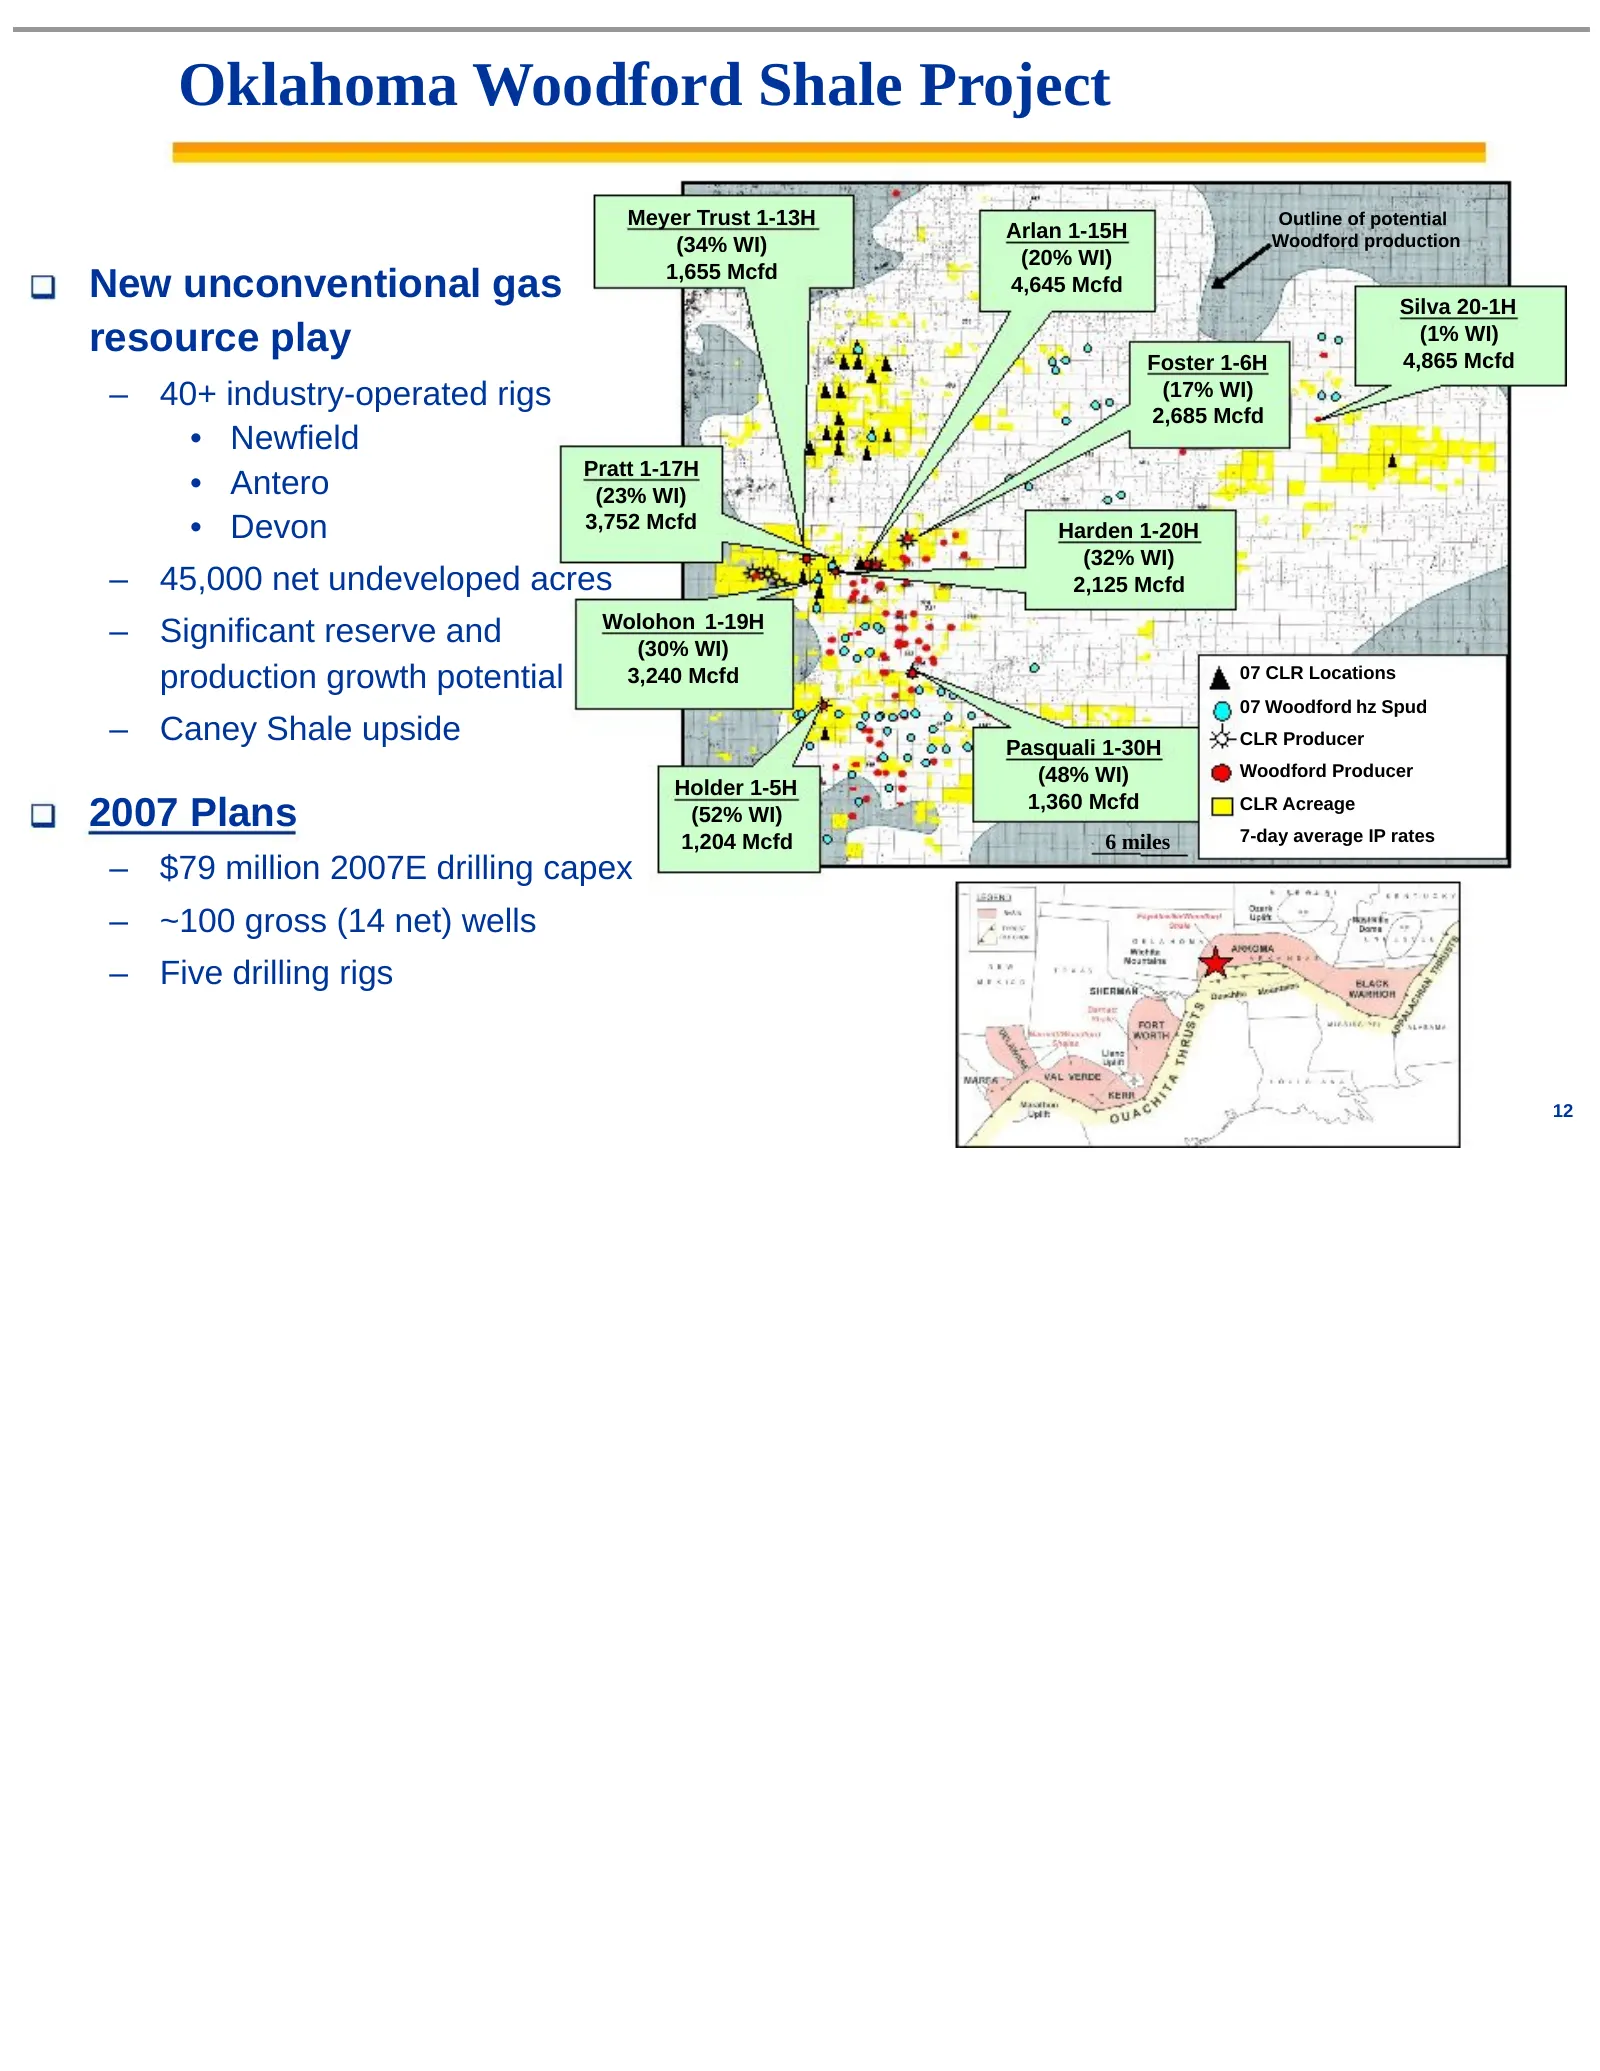
Oklahoma Woodford Shale Project Meyer Trust 1-13H Outline of potential Arlan 1-15H Woodford production (34% WI) (20% WI) 1,655 Mcfd New unconventional gas 4,645 Mcfd Silva 20-1H resource play Foster 1-6H (1% WI) 4,865 Mcfd – 40+ industry-operated rigs (17% WI) 2,685 Mcfd • Newfield Pratt 1-17H • Ant
Slide 14: OK Woodford economic model
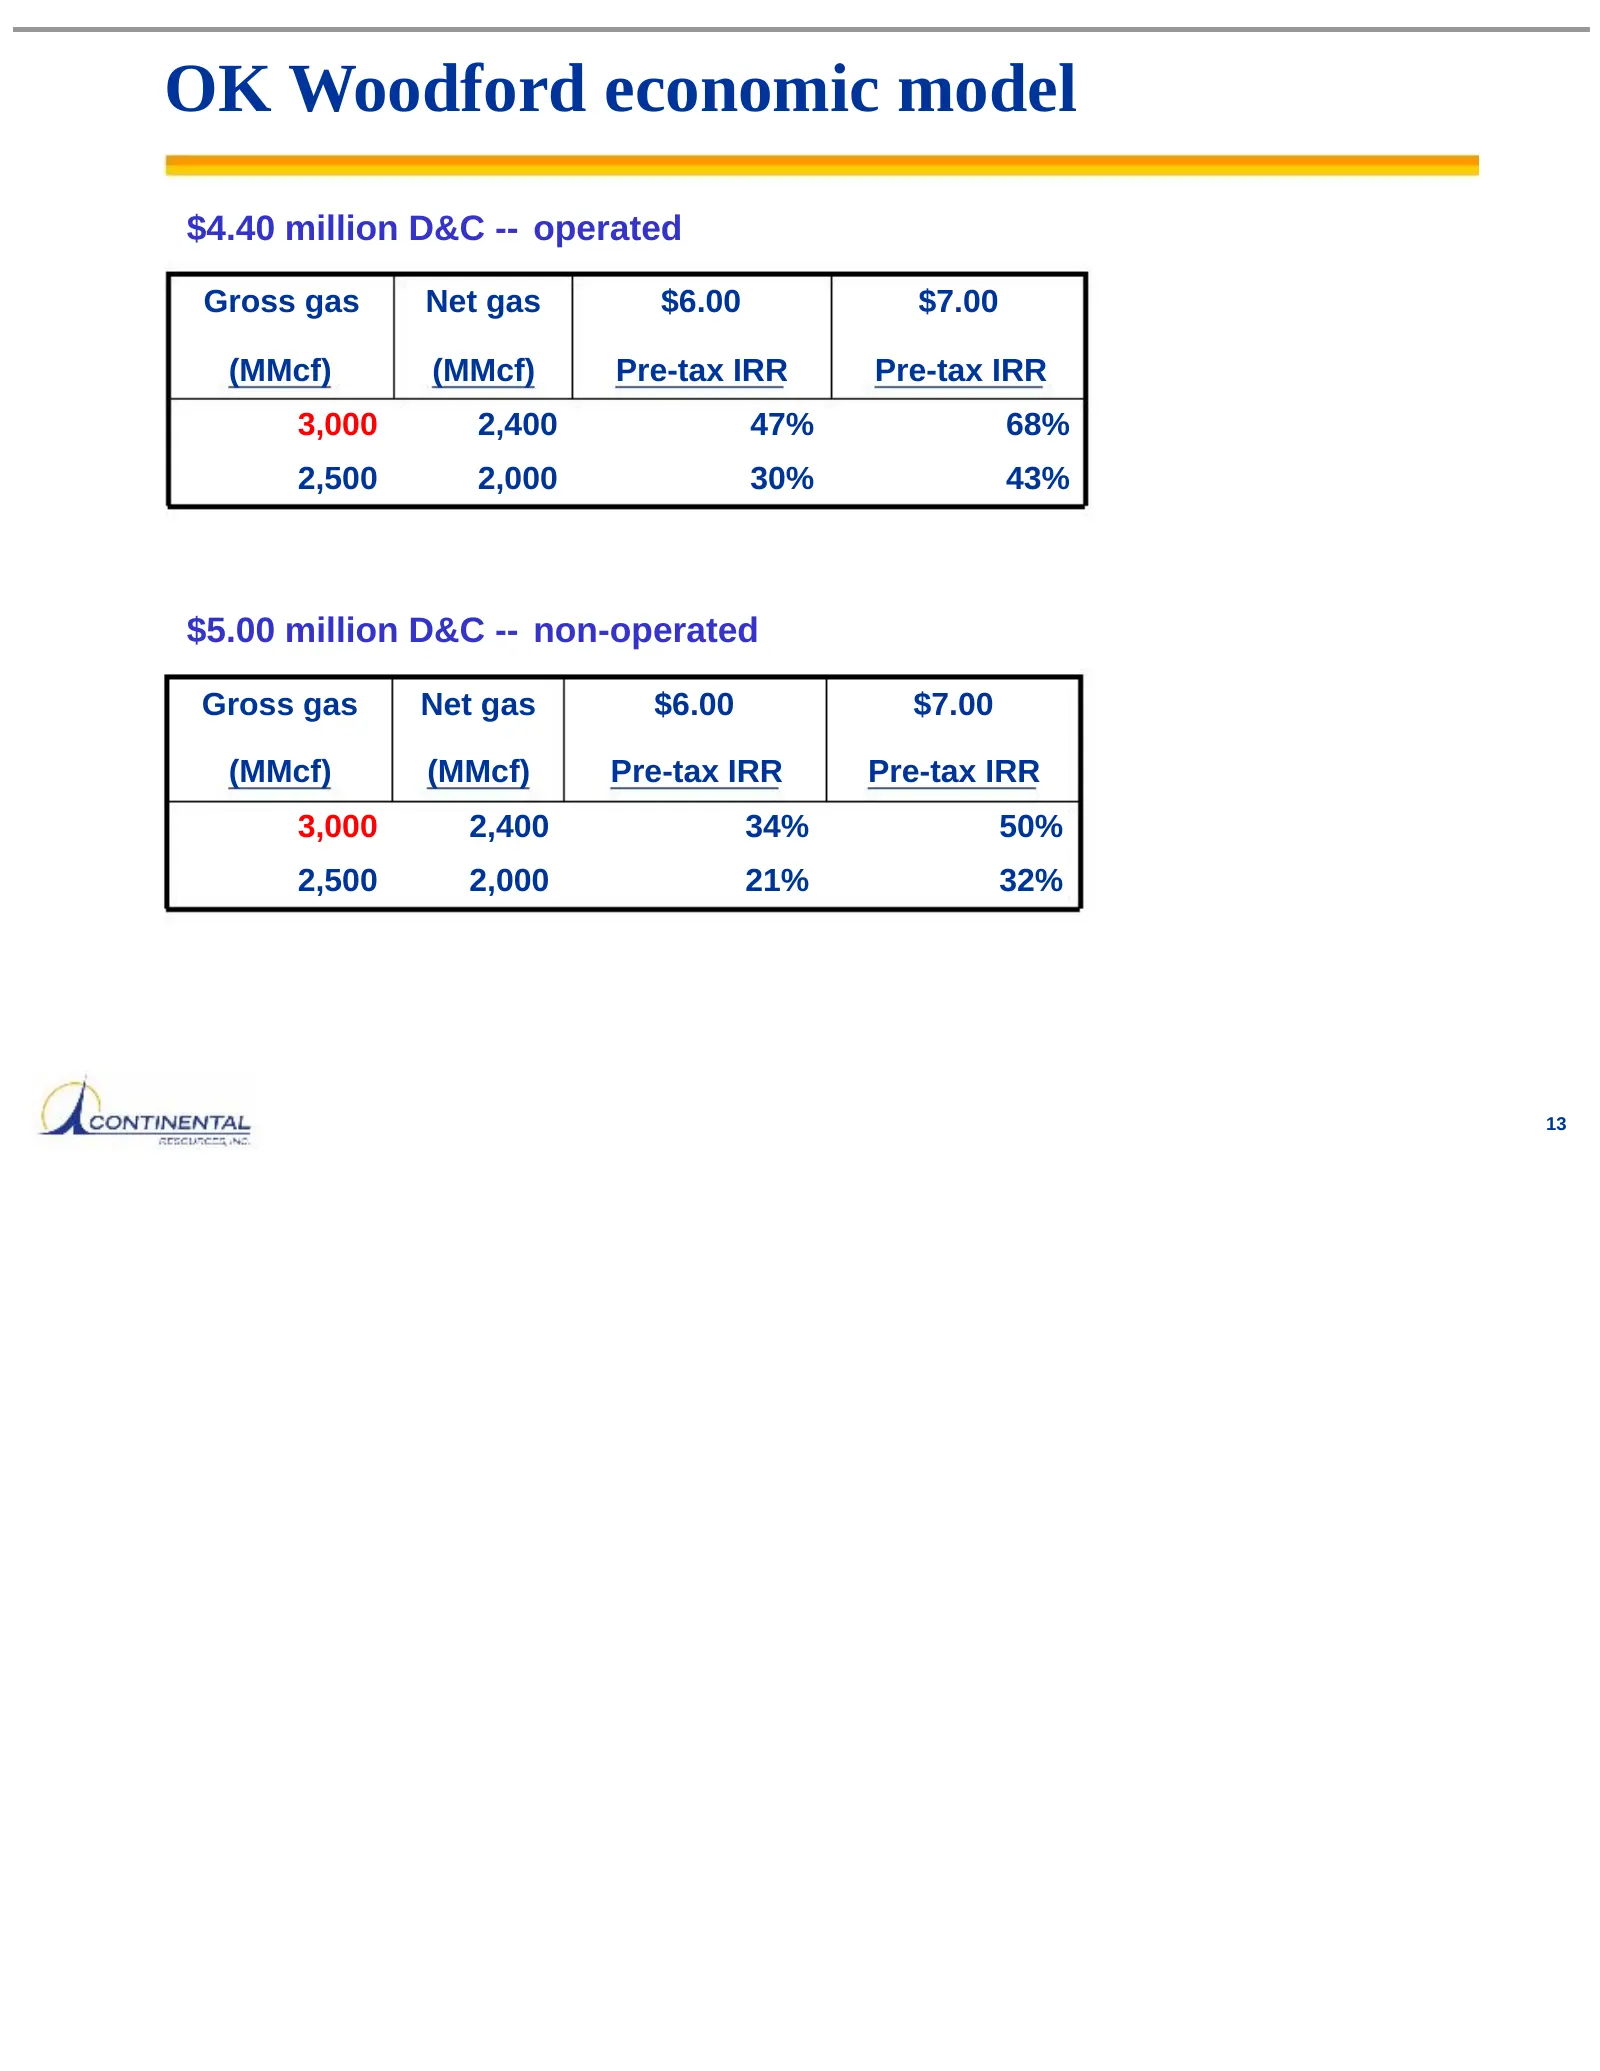
OK Woodford economic model $4.40 million D&C -- operated Gross gas Net gas $6.00 $7.00 (MMcf) (MMcf) Pre-tax IRR Pre-tax IRR 3,000 2,400 47% 68% 2,500 2,000 30% 43% $5.00 million D&C -- non-operated Gross gas Net gas $6.00 $7.00 (MMcf) (MMcf) Pre-tax IRR Pre-tax IRR 3,000 2,400 34% 50% 2,500 2,000 2
Slide 15: Other ongoing and emerging plays
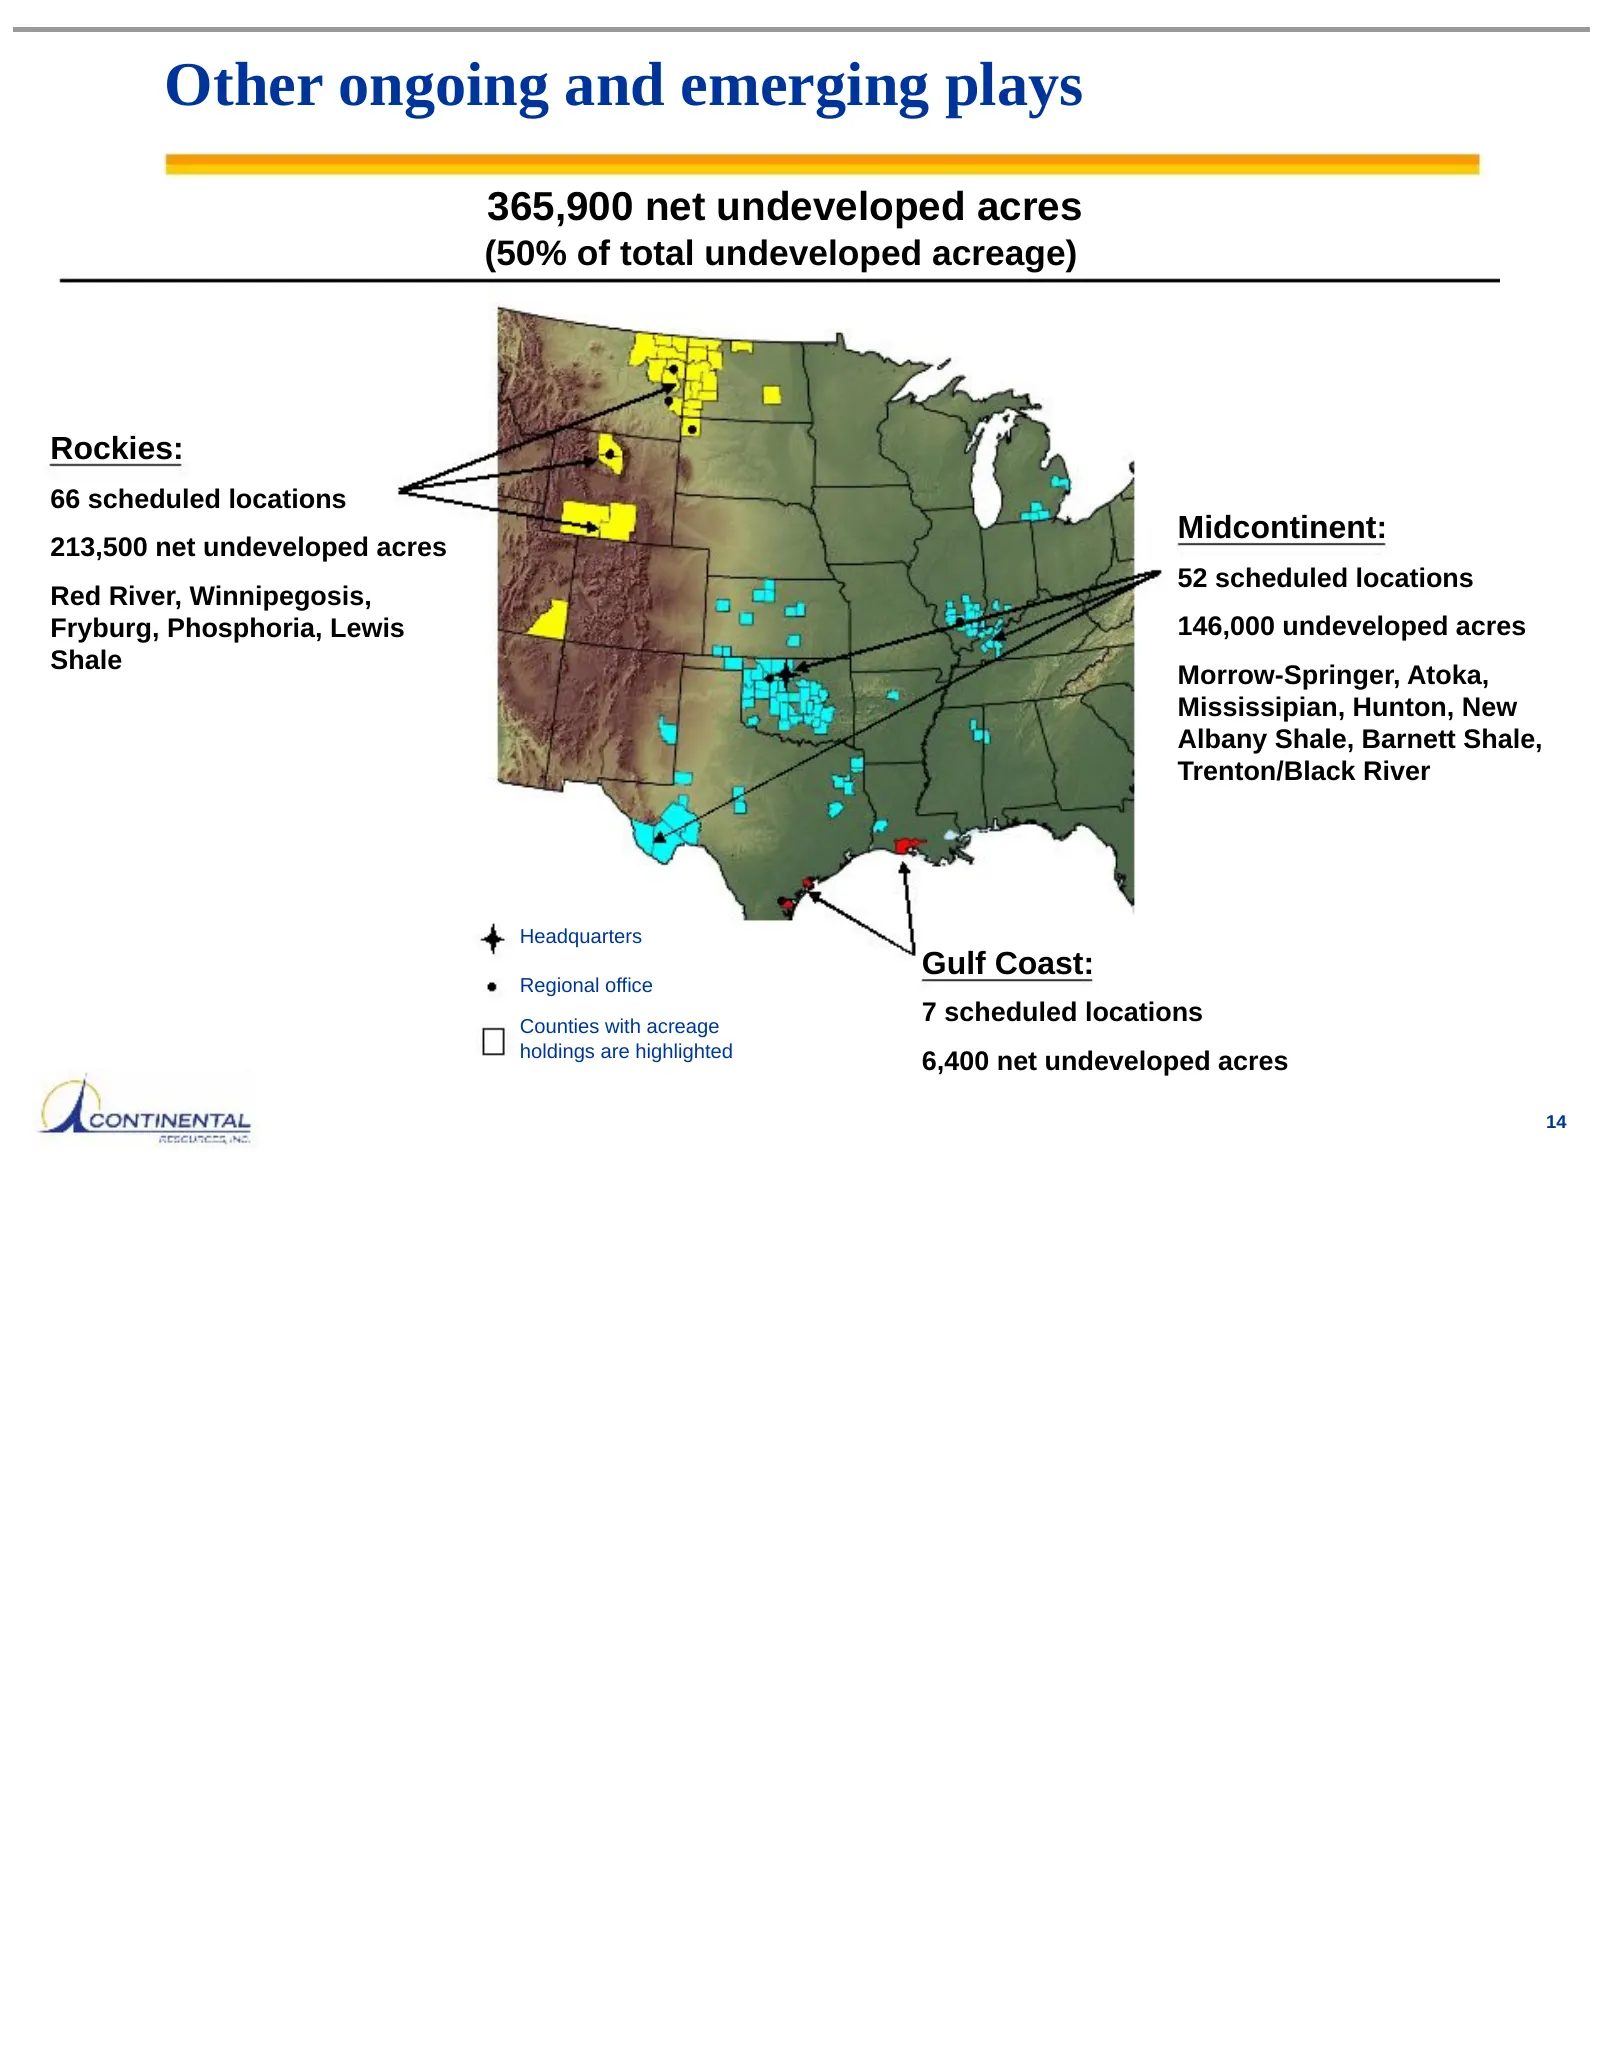
Other ongoing and emerging plays 365,900 net undeveloped acres (50% of total undeveloped acreage) Rockies: 66 scheduled locations Midcontinent: 213,500 net undeveloped acres 52 scheduled locations Red River, Winnipegosis, Fryburg, Phosphoria, Lewis 146,000 undeveloped acres Shale Morrow-Springer, At
Slide 16: 2007 Plans
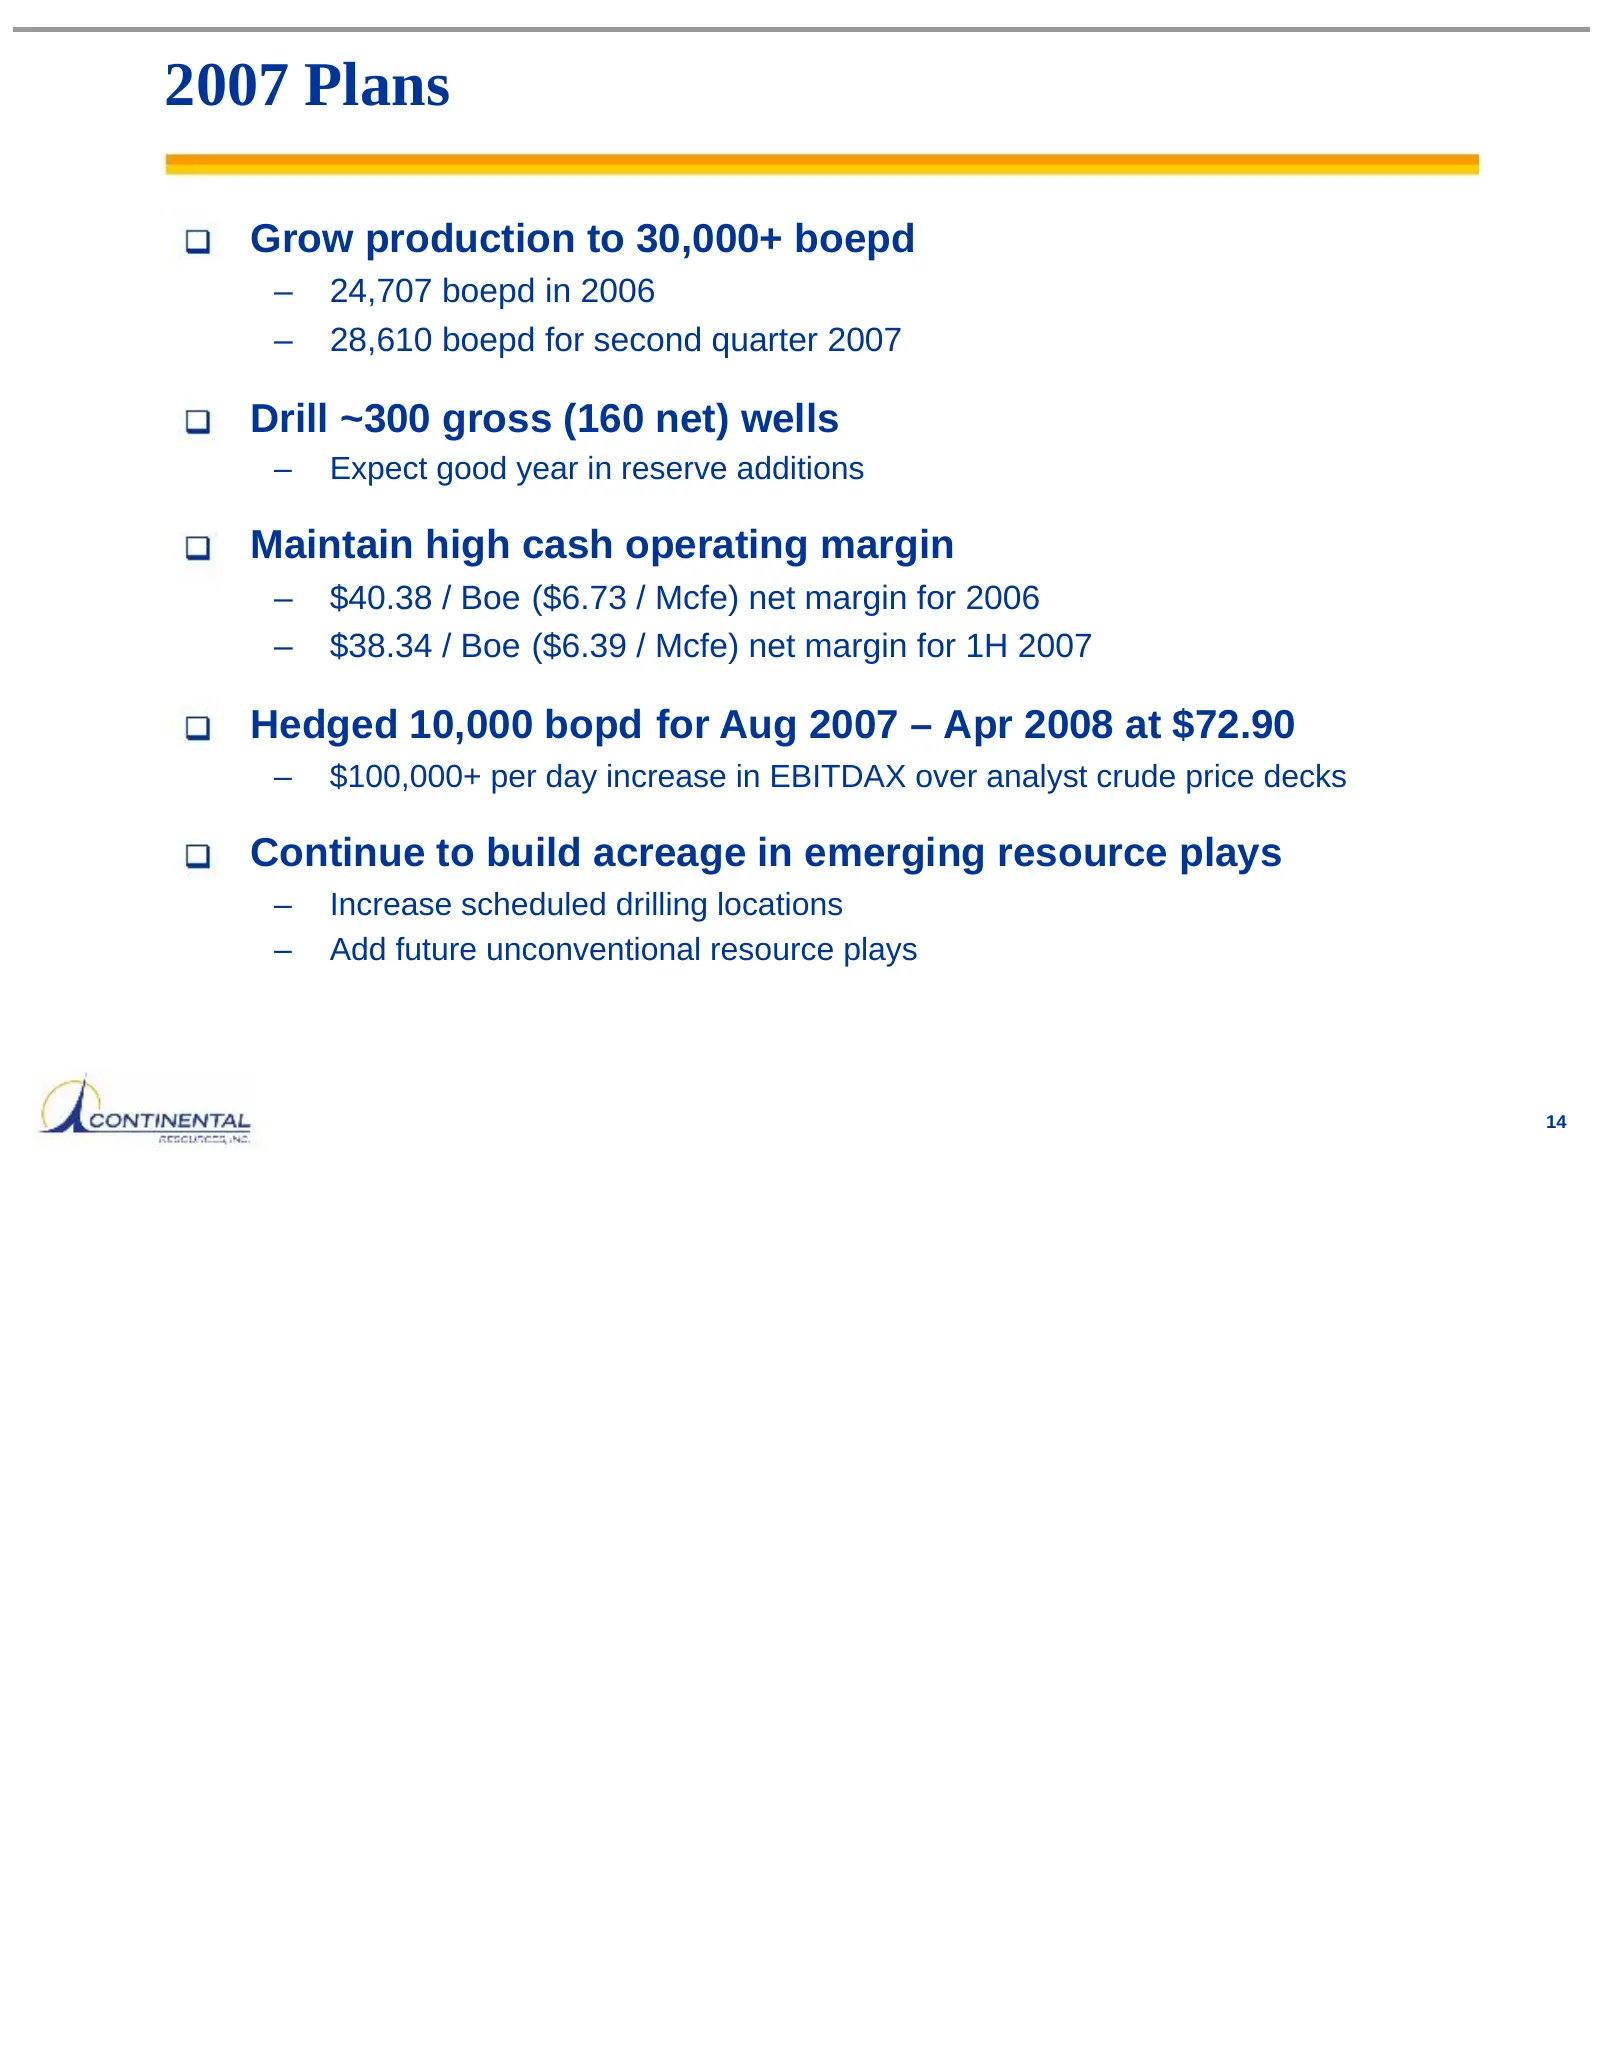
2007 Plans Grow production to 30,000+ boepd – 24,707 boepd in 2006 – 28,610 boepd for second quarter 2007 Drill ~300 gross (160 net) wells – Expect good year in reserve additions Maintain high cash operating margin – $40.38 / Boe ($6.73 / Mcfe) net margin for 2006 – $38.34 / Boe ($6.39 / Mcfe) net m
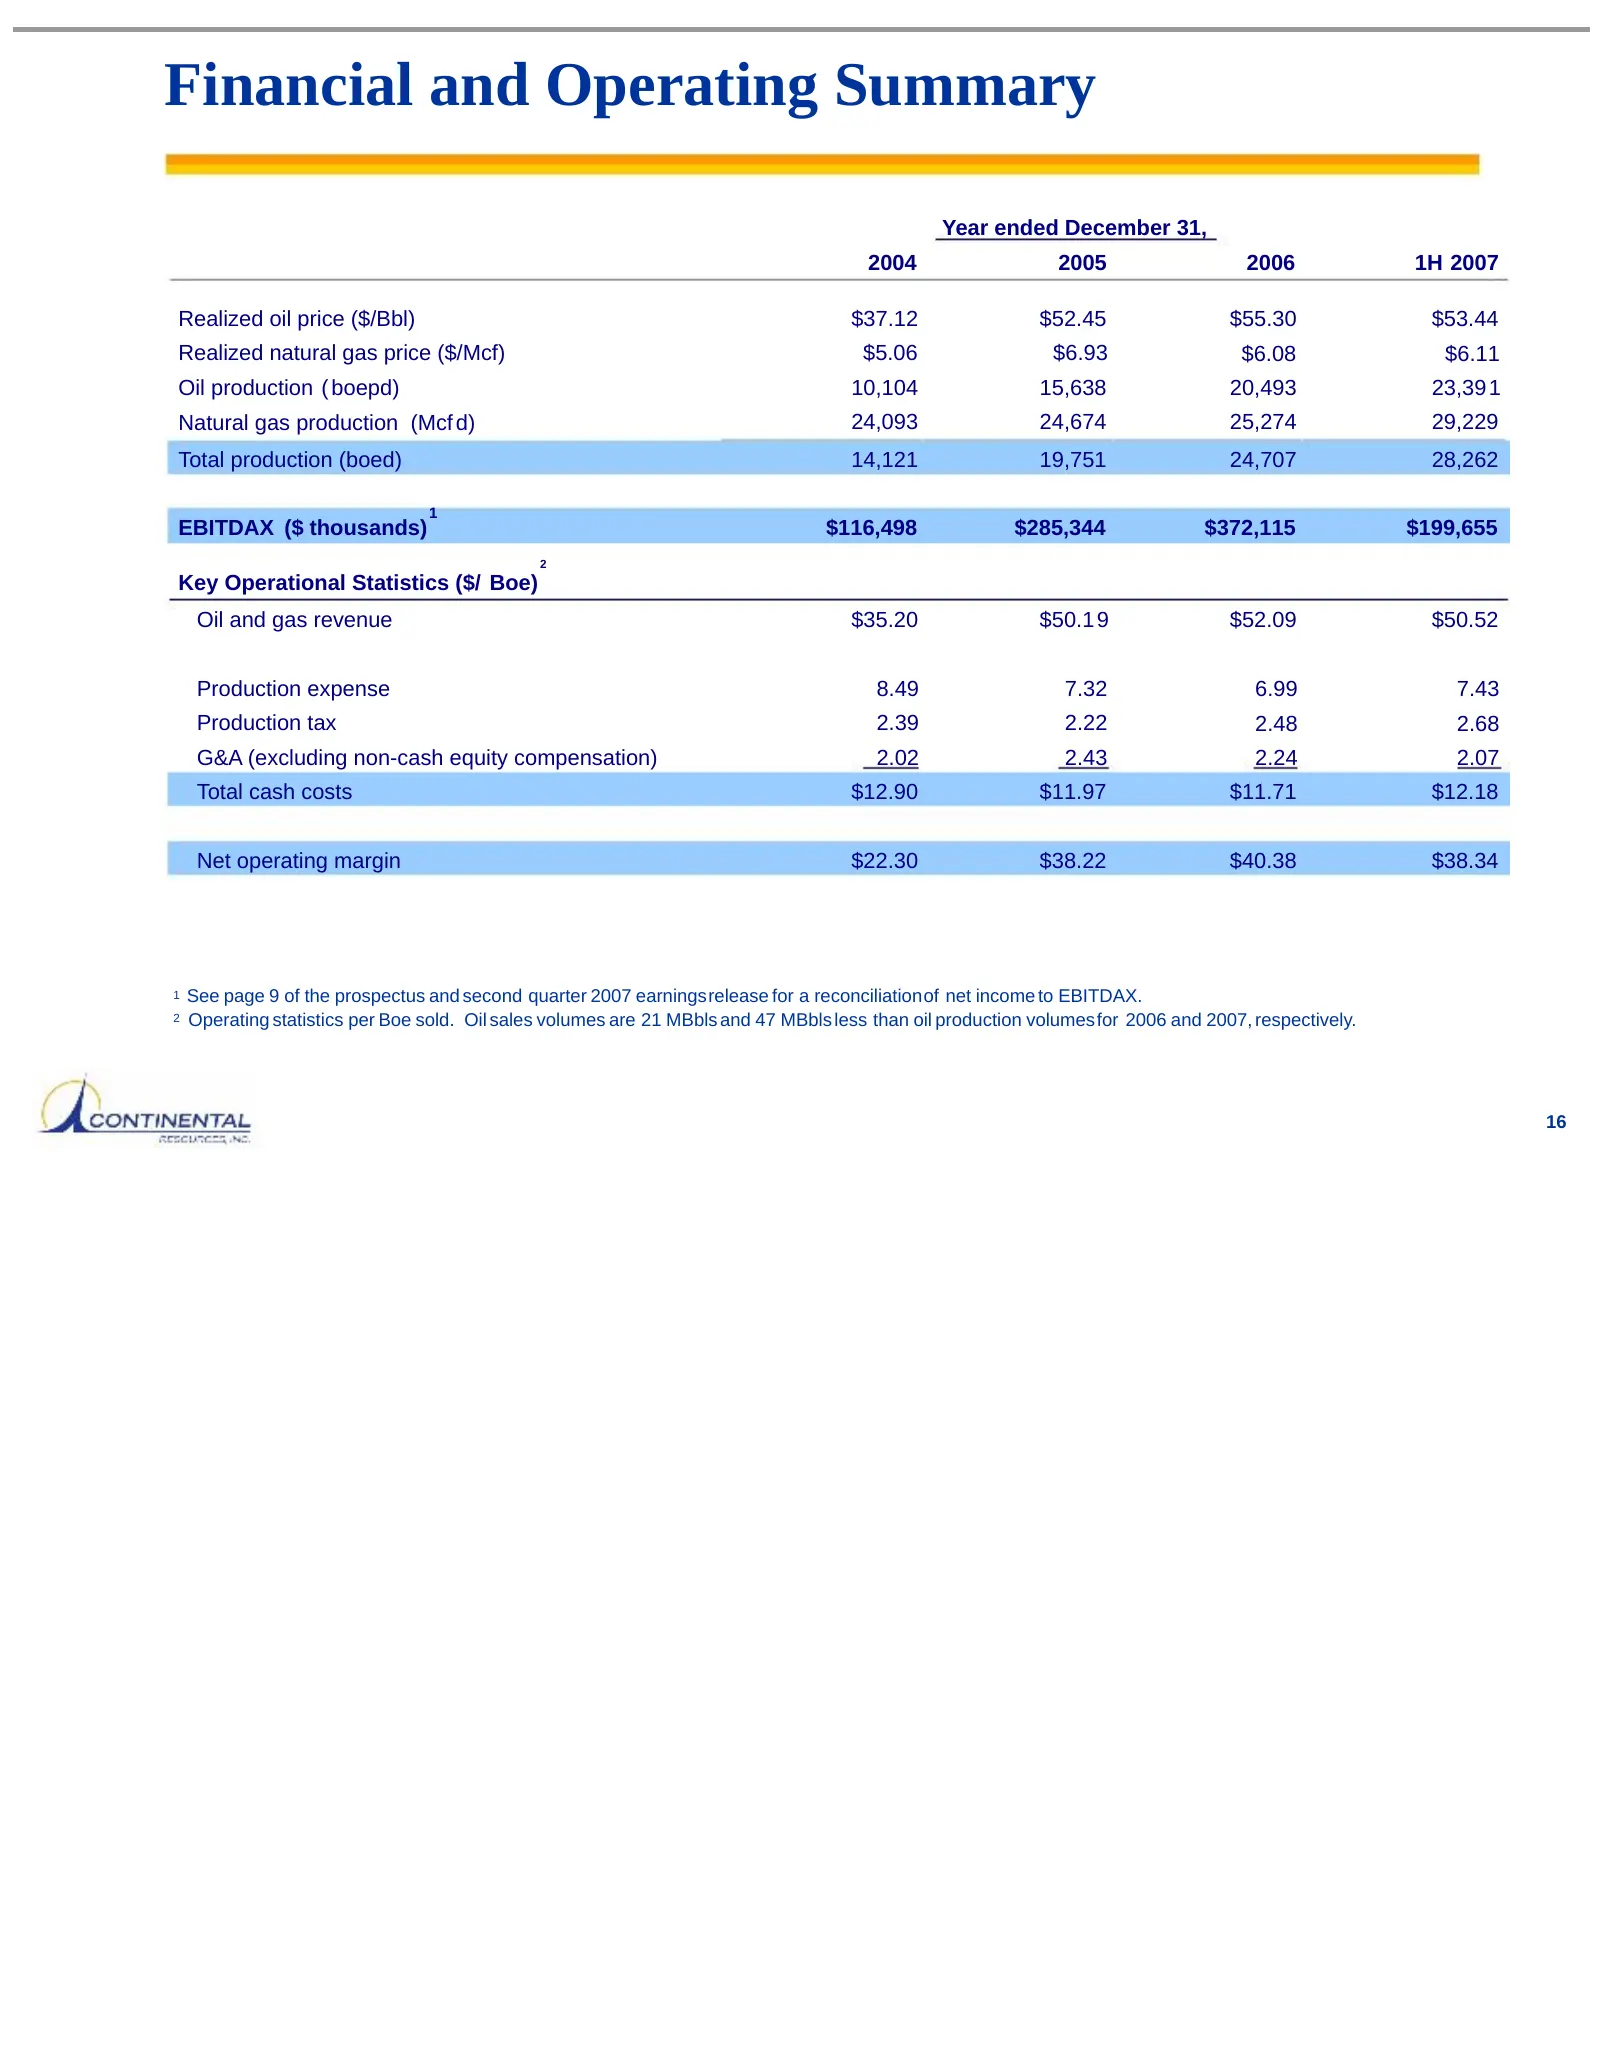
Slide 17: Financial and Operating Summary
Financial and Operating Summary Year ended December 31, 2004 2005 2006 1H 2007 Realized oil price ($/Bbl) $37.12 $52.45 $55.30 $53.44 Realized natural gas price ($/Mcf) $5.06 $6.93 $6.08 $6.11 Oil production ( boepd) 10,104 15,638 20,493 23,39 1 Natural gas production (Mcf d) 24,093 24,674 25,274 29
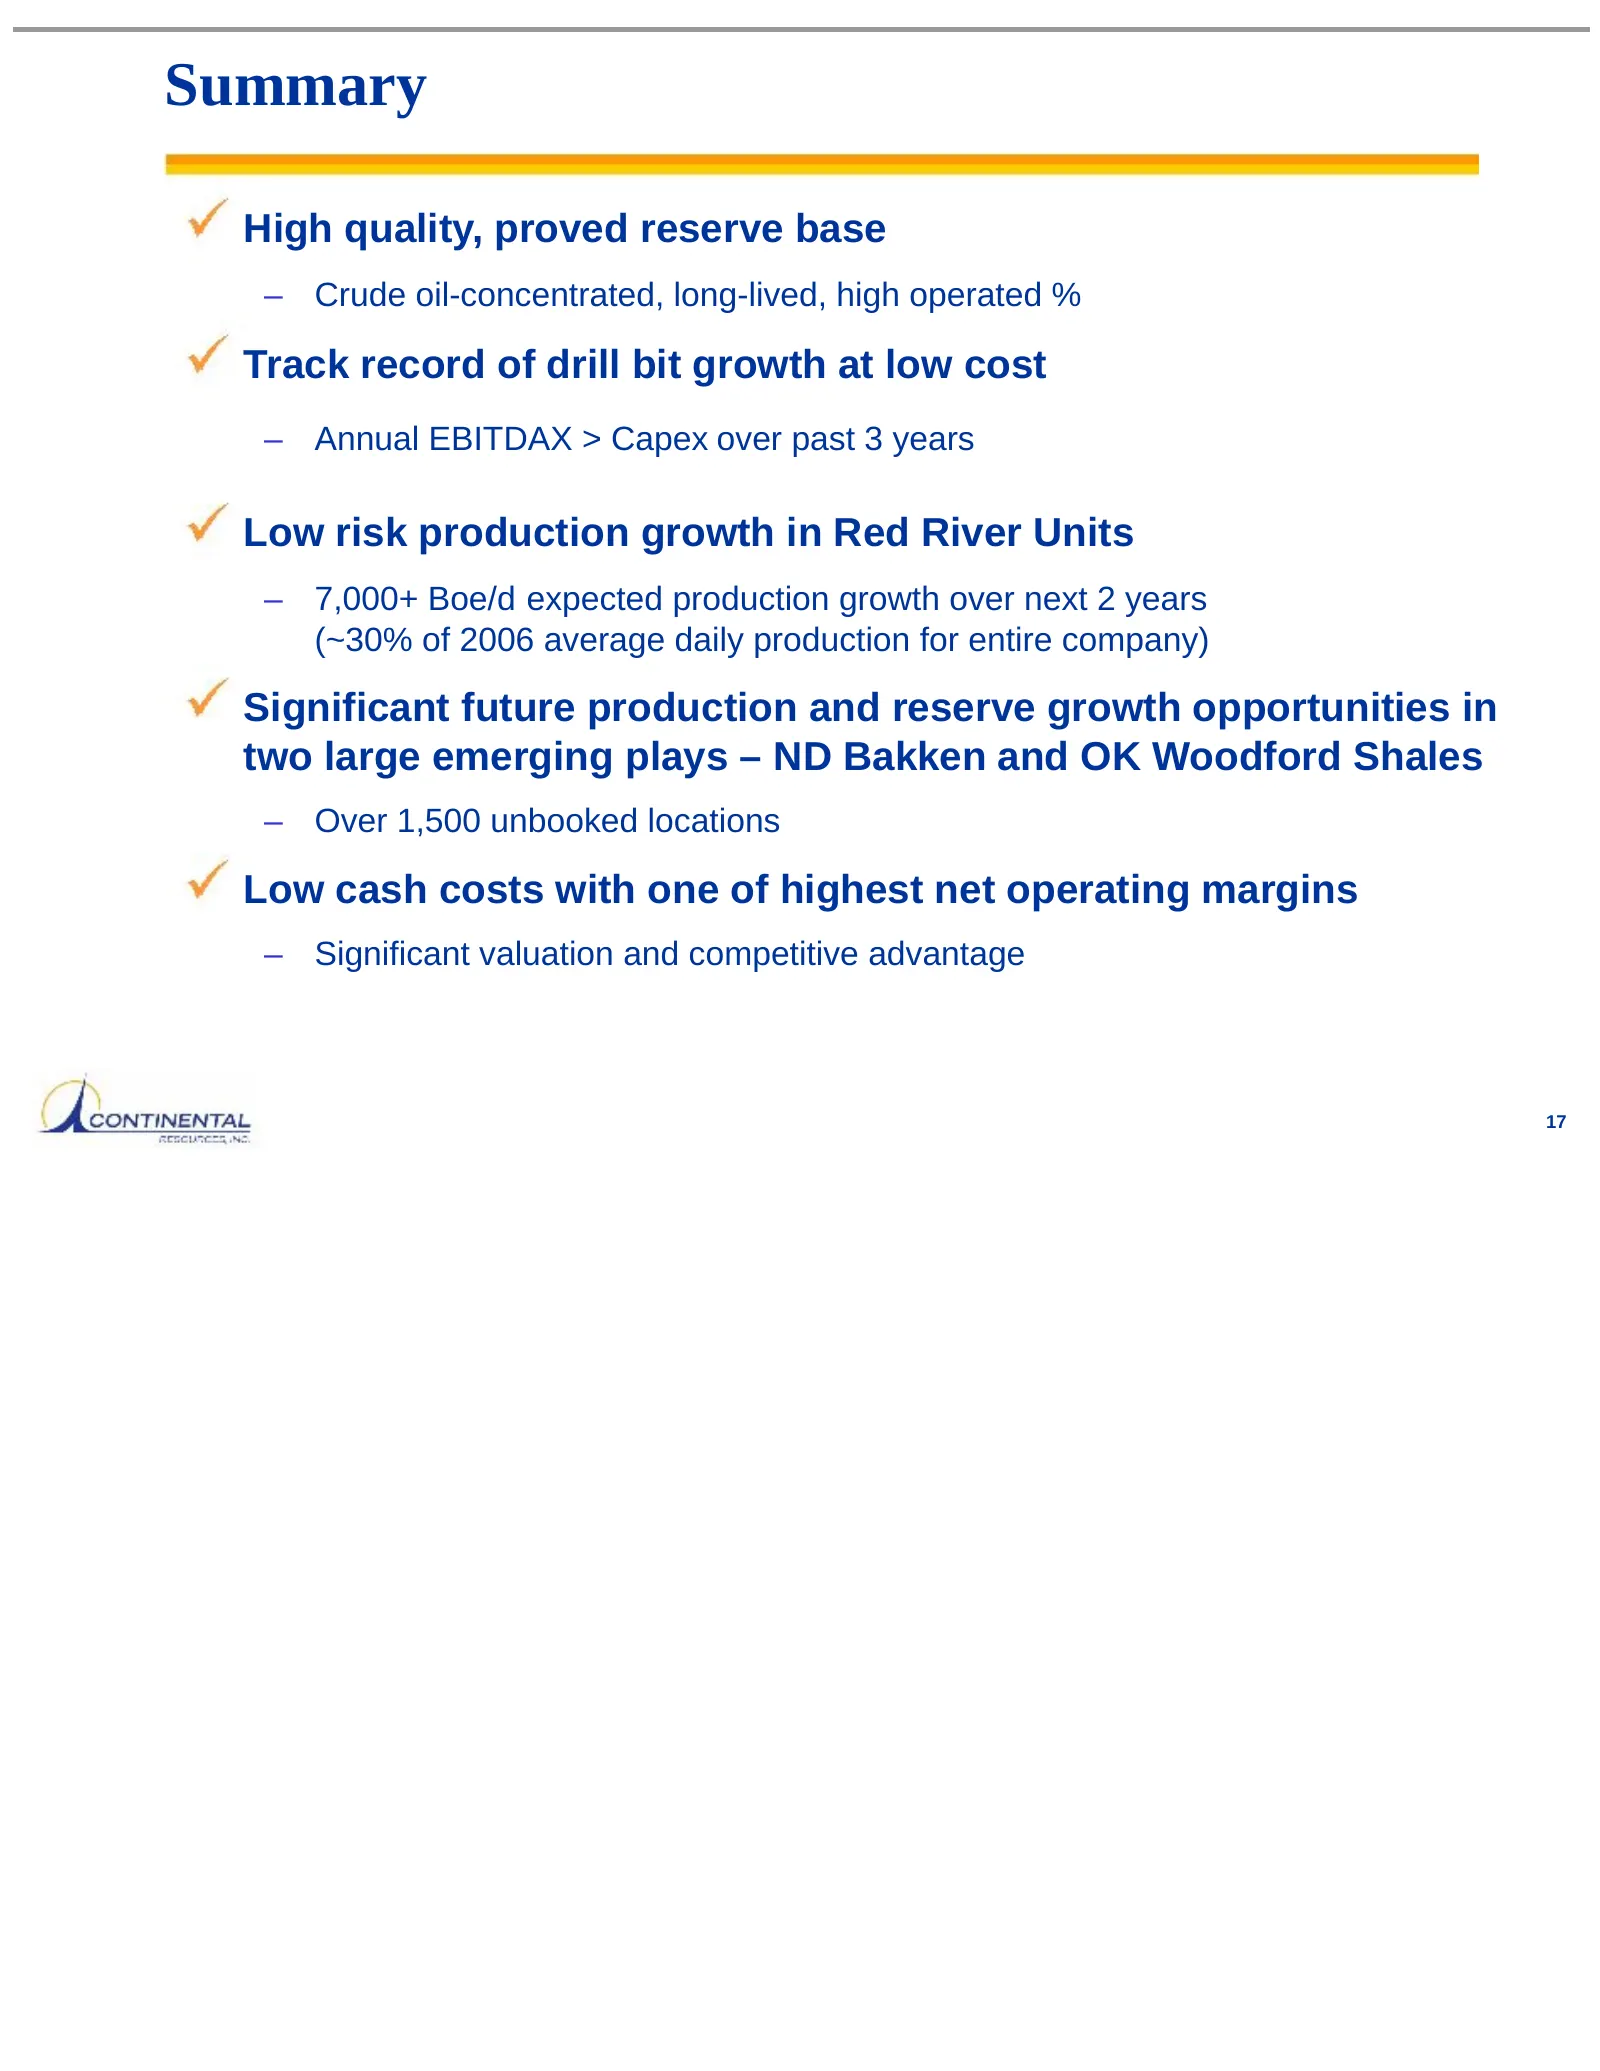
Slide 18: Summary
Summary High quality, proved reserve base – Crude oil-concentrated, long-lived, high operated % Track record of drill bit growth at low cost – Annual EBITDAX > Capex over past 3 years Low risk production growth in Red River Units – 7,000+ Boe/d expected production growth over next 2 years (~30% of 2
Source: SEC EDGAR · 8-K filed Aug 31, 2007
More decks from Continental Resources Inc
 Investor Day (October 2010)17 slides · Oct 12, 2010
 Investor Day (October 2010)14 slides · Oct 12, 2010
 Investor Day (October 2010)35 slides · Oct 12, 2010
 Investor Day (October 2010)16 slides · Oct 12, 2010
 Investor Day (October 2010)10 slides · Oct 12, 2010
 ENERCOM Energy Conference 201026 slides · Aug 24, 2010