Firstcity Financial — Whitebox Market Observer Investor Conference 2004
28 slides from Firstcity Financial's conference presentation, Oct 21, 2004
Slide 1: Whitebox Market Observer Investor Conference
Whitebox Market Observer Investor Conference October 21, 2004 Lake Tahoe NASDAQ: FCFC / FCFCO WWW.FCFC.COM
Slide 2: Cautionary Statement Regarding Forward Looking Statements
Cautionary Statement Regarding Forward Looking Statements Statements in this presentation that are not historical facts, including, but not limited to, statements relating to future operations, results or performance, projections of revenues, income or loss, or plans or objectives of management for
Slide 3: A Vision of Change
A Vision of Change
Slide 4: FirstCity Today Commercial Corporation: A Vision of Change
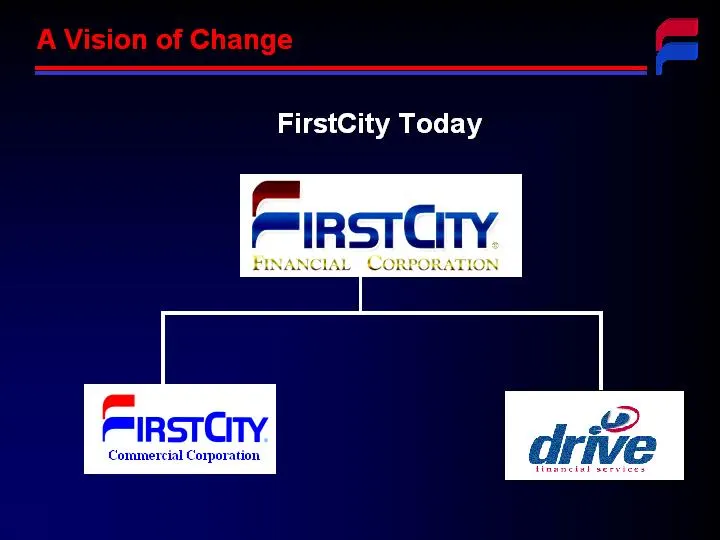
FirstCity Today Commercial Corporation A Vision of Change
Slide 5: A Vision of Change: Recapitalization Dec. '02
A Vision of Change Recapitalization Dec. '02
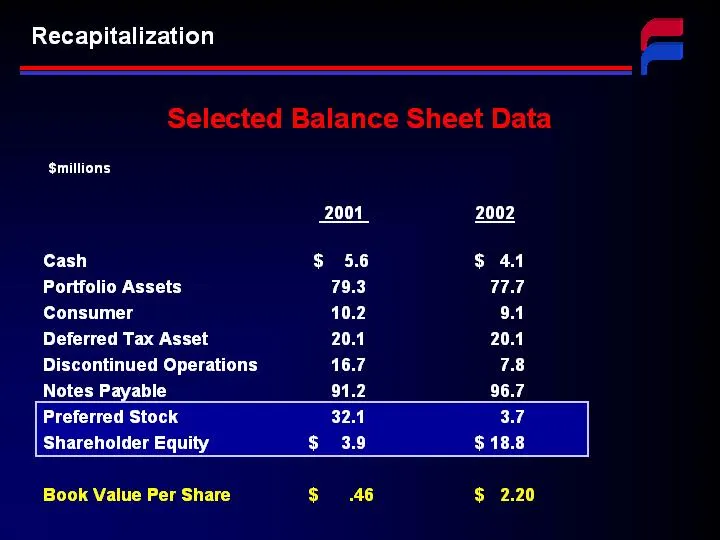
Slide 6: Selected Balance Sheet Data: Recapitalization
2001 2002 Cash $ 5.6 $ 4.1 Portfolio Assets 79.3 77.7 Consumer 10.2 9.1 Deferred Tax Asset 20.1 20.1 Discontinued Operations 16.7 7.8 Notes Payable 91.2 96.7 Preferred Stock 32.1 3.7 Shareholder Equity $ 3.9 $ 18.8 Book Value Per Share $ .46 $ 2.20 Selected Balance Sheet Data Recapitalization $milli
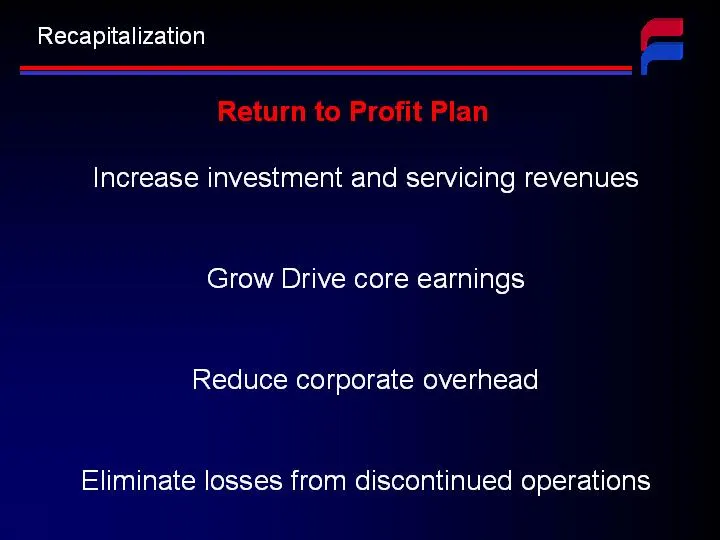
Slide 7: Return to Profit Plan
Return to Profit Plan Increase investment and servicing revenues Grow Drive core earnings Reduce corporate overhead Eliminate losses from discontinued operations Recapitalization
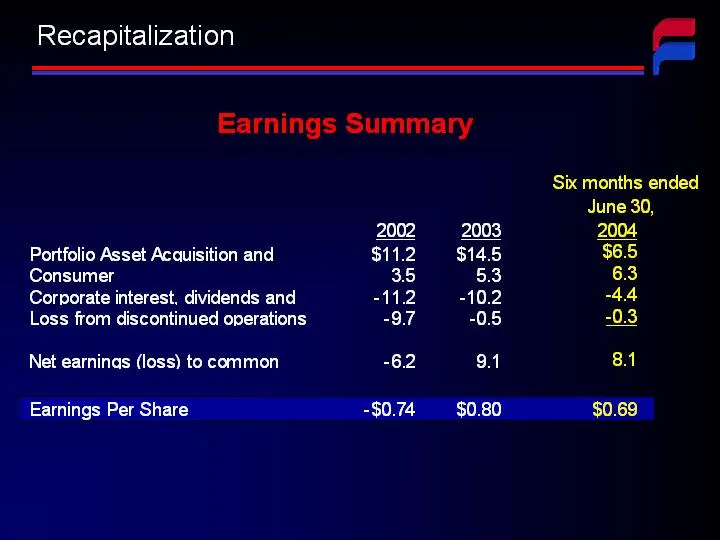
Slide 8: Earnings Summary
Earnings Summary Recapitalization
Slide 9: A Vision of Change: Exit Auto Finance
A Vision of Change Exit Auto Finance
Slide 10: Exit Auto Finance: Intent to Sell 31% Interest in Drive Financial
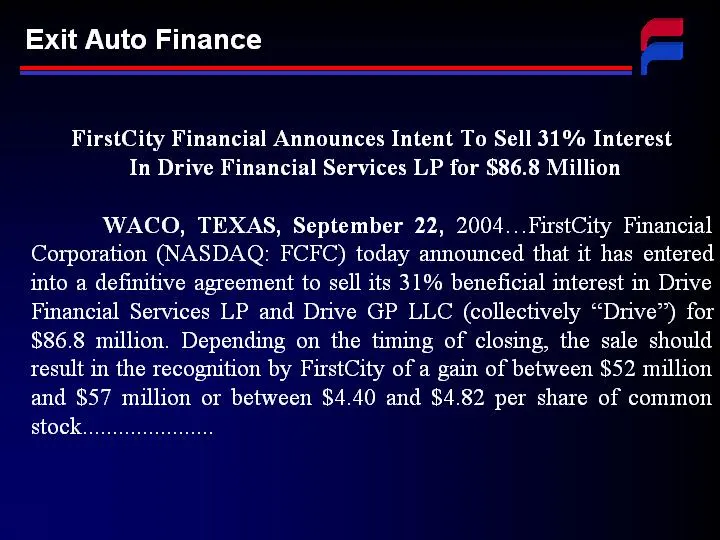
Exit Auto Finance FirstCity Financial Announces Intent To Sell 31% Interest In Drive Financial Services LP for $86.8 Million WACO, TEXAS, September 22, 2004...FirstCity Financial Corporation (NASDAQ: FCFC) today announced that it has entered into a definitive agreement to sell its 31% beneficial int
Slide 11: Effect of Drive Sale on Book Value
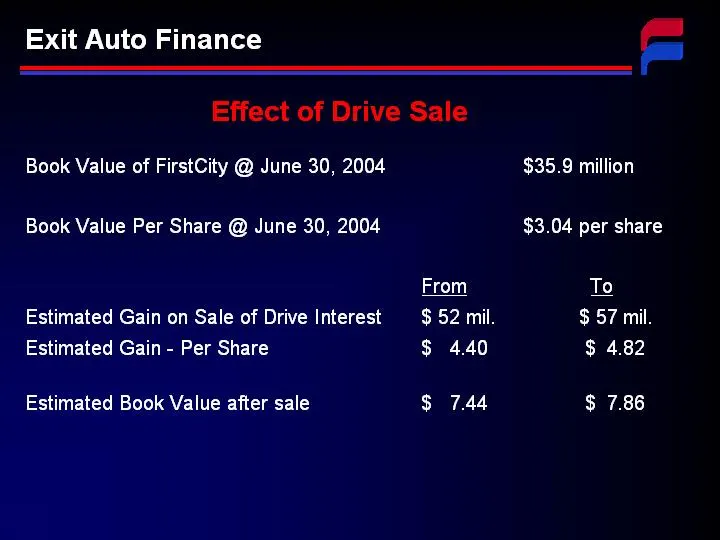
Book Value of FirstCity @ June 30, 2004 $35.9 million Book Value Per Share @ June 30, 2004 $3.04 per share From To Estimated Gain on Sale of Drive Interest $ 52 mil. $ 57 mil. Estimated Gain - Per Share $ 4.40 $ 4.82 Estimated Book Value after sale $ 7.44 $ 7.86 Exit Auto Finance Effect of Drive Sal
Slide 12: A Vision of Change: Strengthen Liquidity
A Vision of Change Strengthen Liquidity
Slide 13: Reduction of Debt
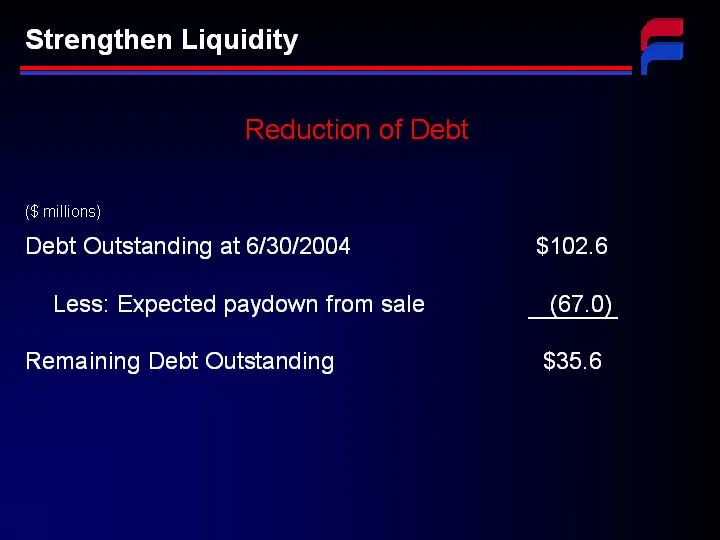
Strengthen Liquidity Reduction of Debt Debt Outstanding at 6/30/2004 $102.6 Less: Expected paydown from sale (67.0) Remaining Debt Outstanding $35.6 ($ millions)
Slide 14: New and Existing Credit Lines
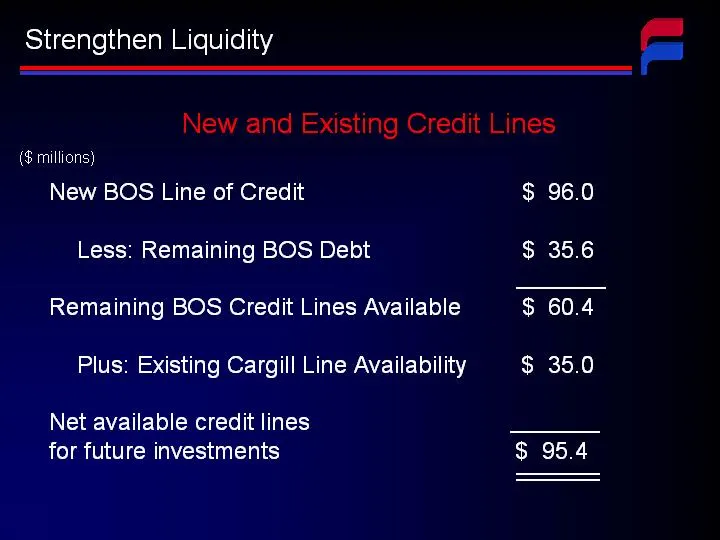
Strengthen Liquidity New and Existing Credit Lines New BOS Line of Credit $ 96.0 Less: Remaining BOS Debt $ 35.6 Remaining BOS Credit Lines Available $ 60.4 Plus: Existing Cargill Line Availability $ 35.0 Net available credit lines for future investments $ 95.4 ($ millions)
Slide 15: A Vision of Change: Grow Core Business
A Vision of Change Grow Core Business
Slide 16: FirstCity Commercial Corporation Business Description
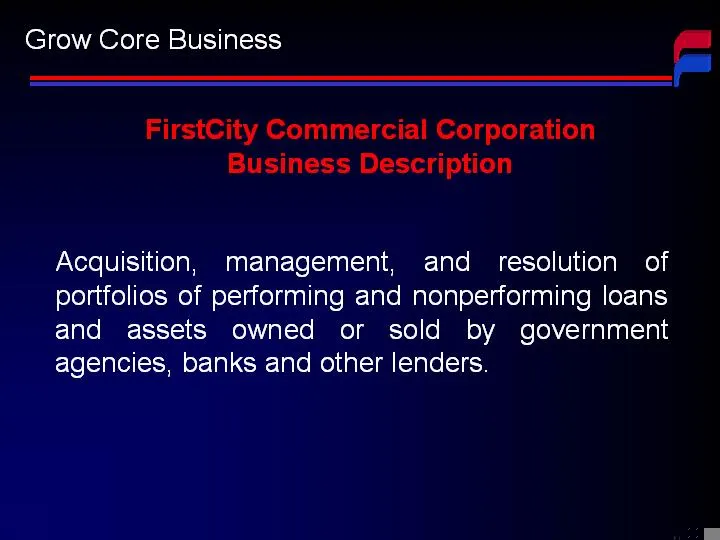
Acquisition, management, and resolution of portfolios of performing and nonperforming loans and assets owned or sold by government agencies, banks and other lenders. FirstCity Commercial Corporation Business Description Grow Core Business
Slide 17: Business Summary
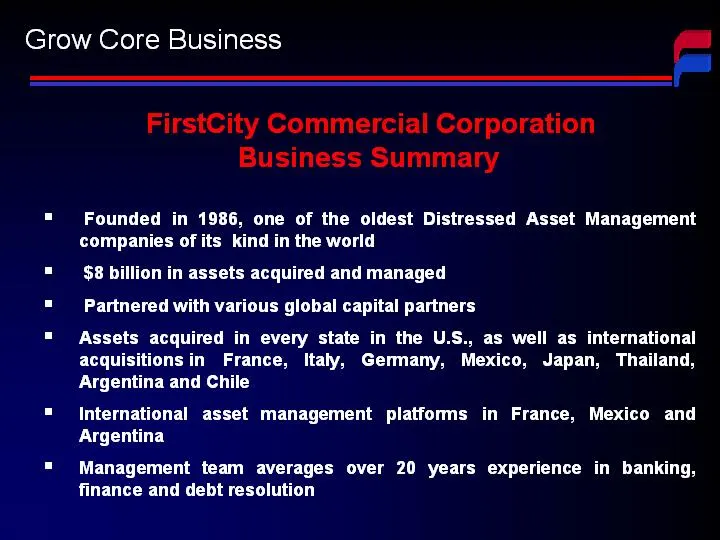
Founded in 1986, one of the oldest Distressed Asset Management companies of its kind in the world $8 billion in assets acquired and managed Partnered with various global capital partners Assets acquired in every state in the U.S., as well as international acquisitions in France, Italy, Germany, Mexi
Slide 18: Historical Acquisitions
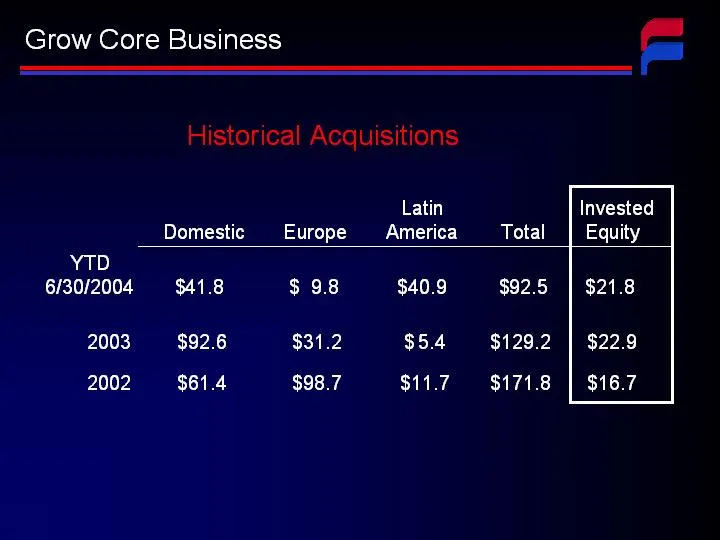
Grow Core Business Historical Acquisitions Domestic Europe Latin America Total Invested Equity YTD 6/30/2004 $ 41.8 $ 9.8 $ 40.9 $ 92.5 $ 21.8 2003 $ 92.6 $ 31.2 $ 5.4 $ 129.2 $ 22.9 2002 $ 61.4 $ 98.7 $ 11.7 $ 171.8 $ 16.7
Slide 19: Growth of Portfolio Assets
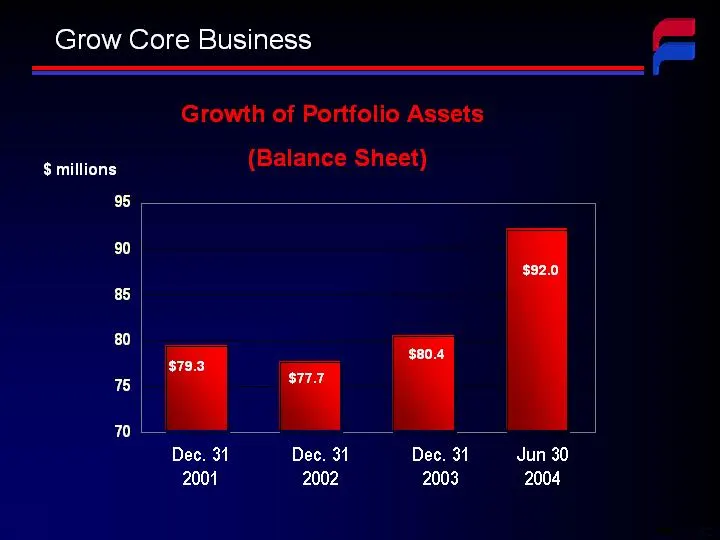
Grow Core Business $ millions Dec. 31 2001 $92.0 $80.4 $77.7 $79.3 Growth of Portfolio Assets (Balance Sheet) Dec. 31 2002 Dec. 31 2003 Jun 30 2004
Slide 20: Total Servicing Portfolio $2.4 Billion
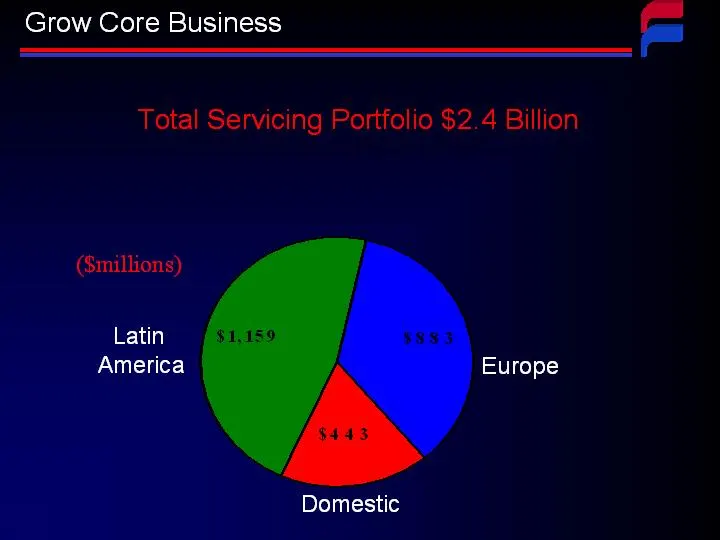
Latin America Domestic Europe Total Servicing Portfolio $2.4 Billion Grow Core Business ($millions)
Slide 21: Market Environment
Market Environment U.S. Europe Latin America Grow Core Business
Slide 22: A Vision of Change: Create Future Value
A Vision of Change Create Future Value
Slide 23: Create Future Value
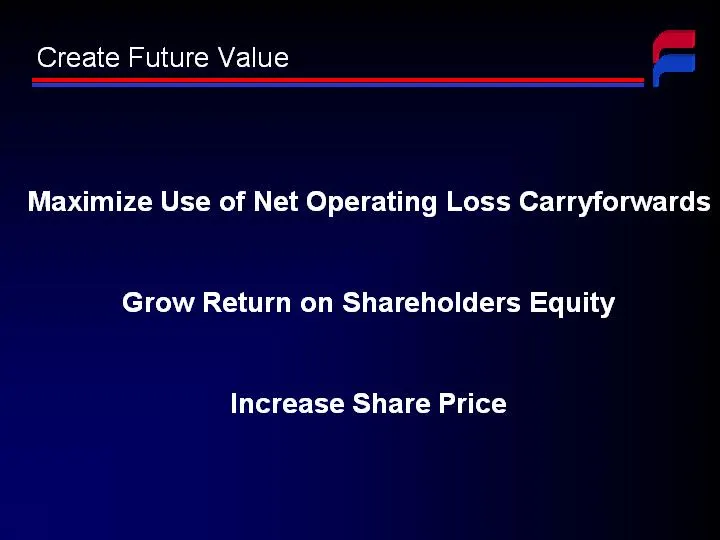
49.6% 39.6% Create Future Value Maximize Use of Net Operating Loss Carryforwards Grow Return on Shareholders Equity Increase Share Price
Slide 24: Maximize Benefits of NOLs
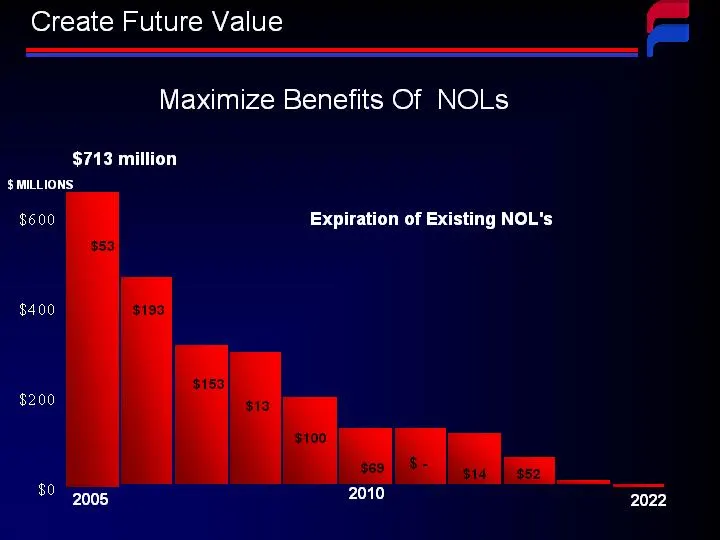
Maximize Benefits Of NOLs $ MILLIONS $713 million Expiration of Existing NOL's $53 $193 $153 $13 $100 $69 $ - $14 2005 $52 2010 2022 Create Future Value
Slide 25: Grow Return on Shareholder's Equity
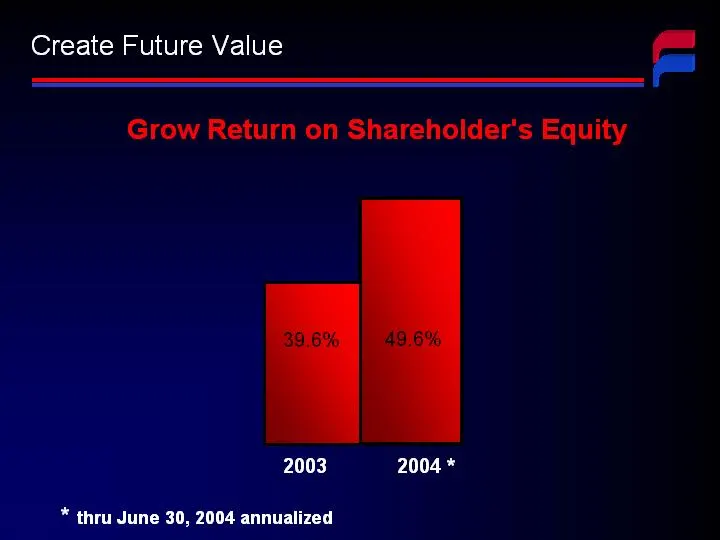
49.6% 39.6% Create Future Value 39.6% 49.6% 2003 2004 * * thru June 30, 2004 annualized Grow Return on Shareholder's Equity
Slide 26: Increase Share Price
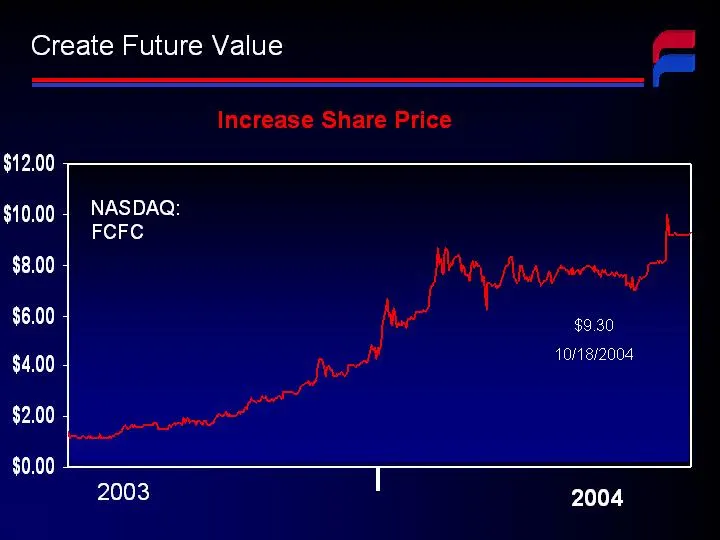
Increase Share Price NASDAQ: FCFC 2003 2004 Create Future Value $9.30 10/18/2004
Slide 27: A Vision of Change Summary
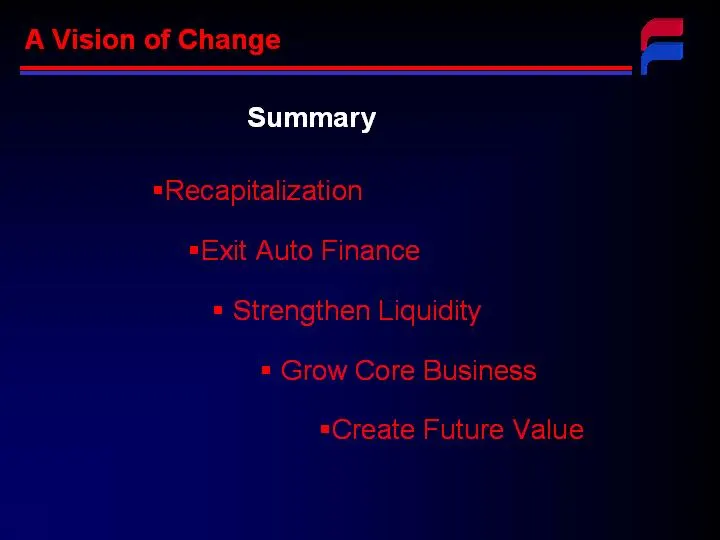
A Vision of Change Recapitalization Exit Auto Finance Strengthen Liquidity Grow Core Business Create Future Value Summary
Slide 28: A Vision of Change
(NASDAQ: FCFC / FCFCO) WWW.FCFC.COM A Vision of Change
Source: SEC EDGAR · 8-K filed Oct 21, 2004