Endurance Specialty Holdings Ltd
Endurance Specialty — Investor Presentation (February 2011)
23 slides from Endurance Specialty's investor presentation, Feb 15, 2011
Slide 1: Endurance Specialty Holdings Investor Presentation, December 31, 2010
Endurance Specialty Holdings Investor Presentation, December 31, 2010
Slide 2: Forward looking statements & regulation G disclaimer
2 Forward looking statements & regulation G disclaimer Safe Harbor for Forward Looking Statements Some of the statements in this presentation include forward-looking statements which reflect our current views with respect to future events and financial performance. Such statements include forward-lo
Slide 3: Investor Value Proposition
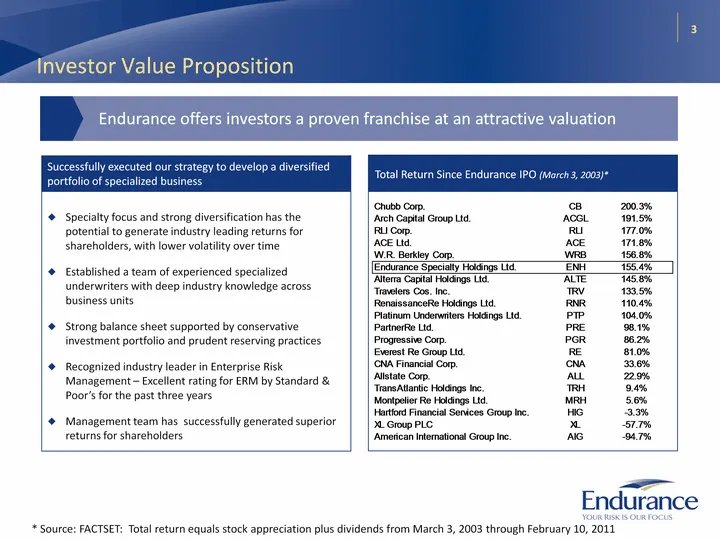
3 Investor Value Proposition Specialty focus and strong diversification has the potential to generate industry leading returns for shareholders, with lower volatility over time Established a team of experienced specialized underwriters with deep industry knowledge across business units Strong balanc
Slide 4: Introduction to Endurance Specialty Holdings
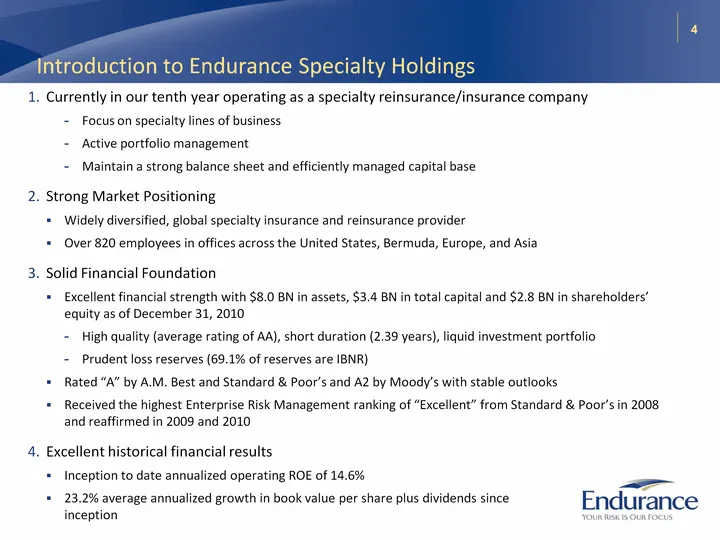
4 Introduction to Endurance Specialty Holdings Currently in our tenth year operating as a specialty reinsurance/insurance company Focus on specialty lines of business Active portfolio management Maintain a strong balance sheet and efficiently managed capital base Strong Market Positioning Widely div
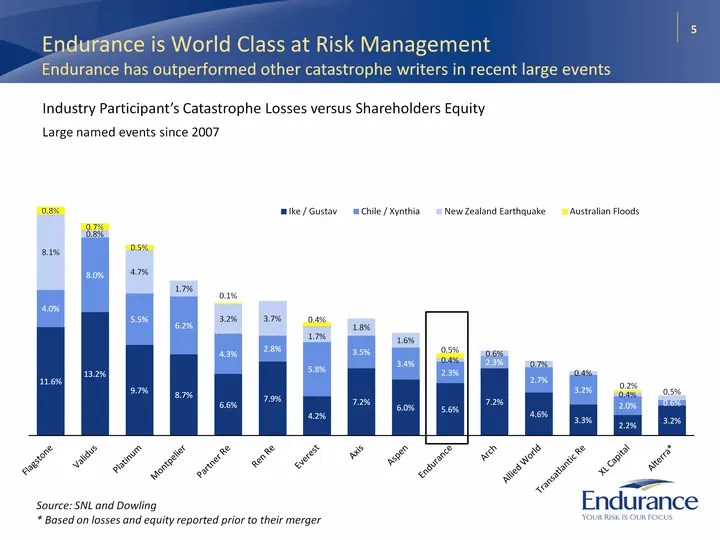
Slide 5: Endurance is World Class at Risk Management
5 Endurance is World Class at Risk Management Endurance has outperformed other catastrophe writers in recent large events Industry Participant's Catastrophe Losses versus Shareholders Equity Large named events since 2007 (CHART) Source: SNL and Dowling * Based on losses and equity reported prior to
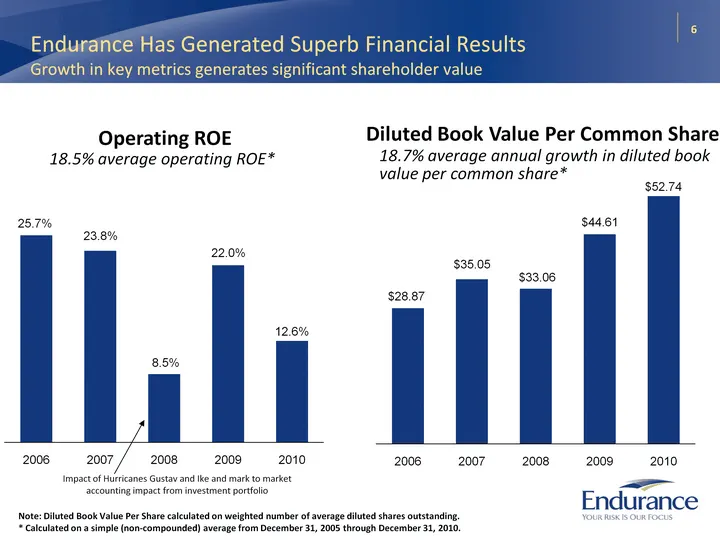
Slide 6: Endurance Has Generated Superb Financial Results
(CHART) 6 Endurance Has Generated Superb Financial Results Growth in key metrics generates significant shareholder value Diluted Book Value Per Common Share Note: Diluted Book Value Per Share calculated on weighted number of average diluted shares outstanding. * Calculated on a simple (non-compounde
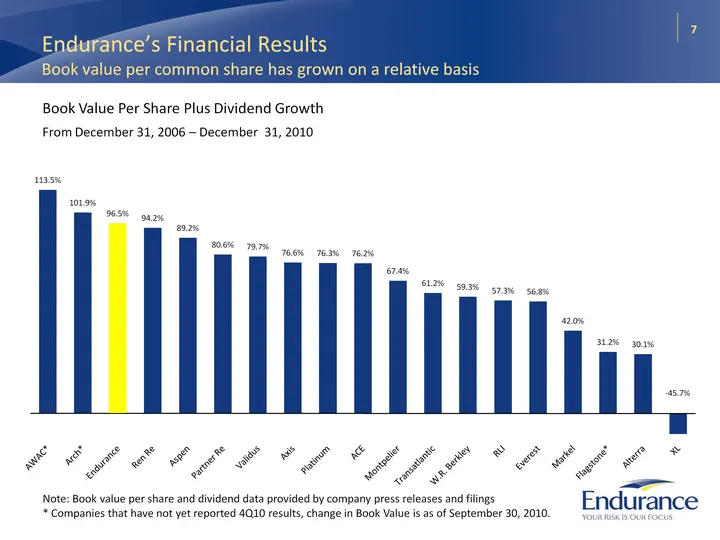
Slide 7: Endurance's Financial Results
7 Endurance's Financial Results Book value per common share has grown on a relative basis Book Value Per Share Plus Dividend Growth From December 31, 2006 - December 31, 2010 (CHART) Note: Book value per share and dividend data provided by company press releases and filings * Companies that have not
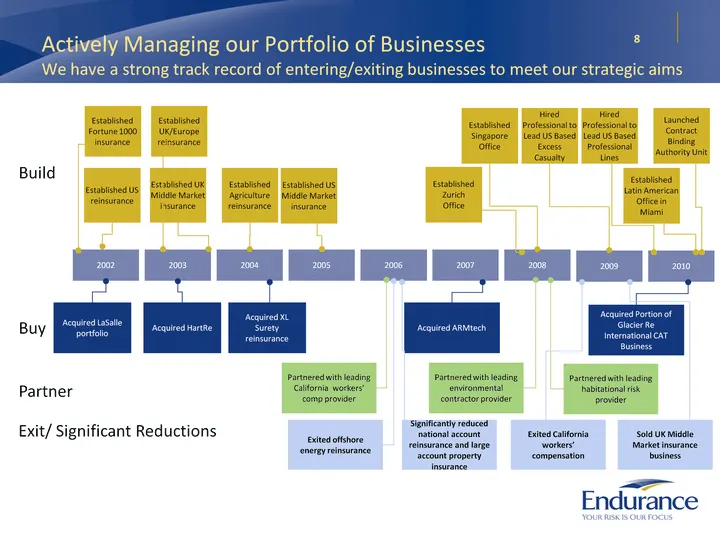
Slide 8: Actively Managing our Portfolio of Businesses
8 Actively Managing our Portfolio of Businesses We have a strong track record of entering/exiting businesses to meet our strategic aims Buy Build Partner 2008 2006 2002 2003 2004 2005 2007 Acquired LaSalle portfolio Acquired HartRe Acquired ARMtech Partnered with leading California workers' comp pro
Slide 9: Specialty Focused, Diversified Portfolio of Businesses
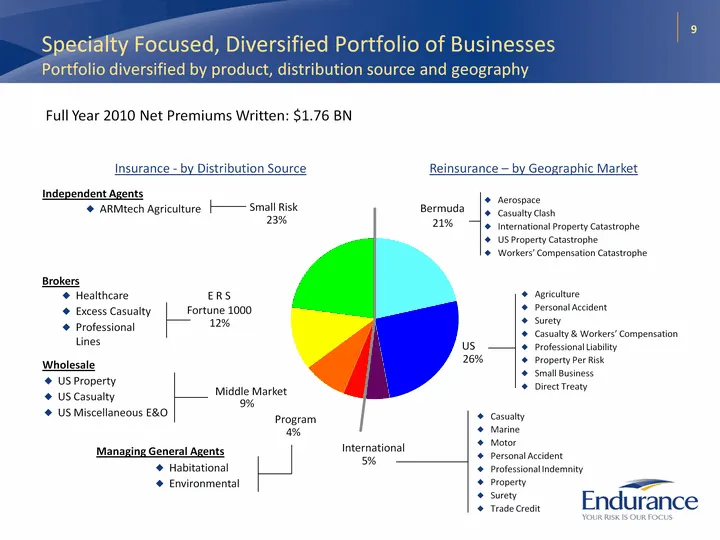
9 Specialty Focused, Diversified Portfolio of Businesses Portfolio diversified by product, distribution source and geography Full Year 2010 Net Premiums Written: $1.76 BN Reinsurance - by Geographic Market Insurance - by Distribution Source Agriculture Personal Accident Surety Casualty & Workers' Co
Slide 10: Specialty Focused, Diversified Portfolio of Businesses
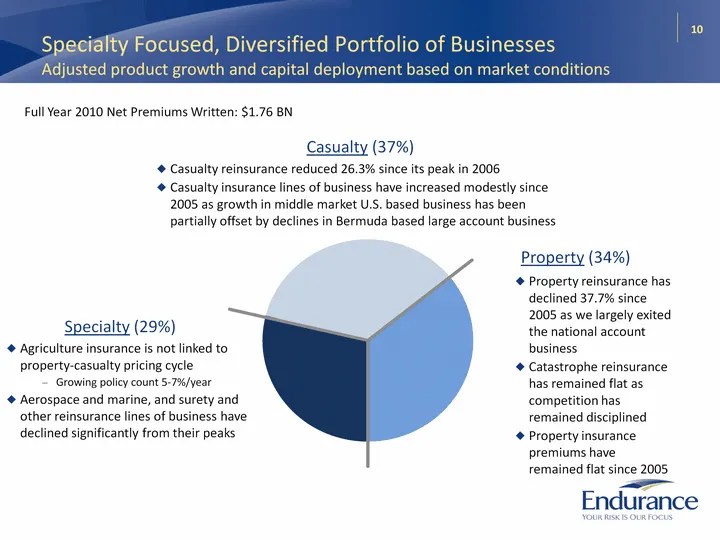
10 Specialty Focused, Diversified Portfolio of Businesses Adjusted product growth and capital deployment based on market conditions Full Year 2010 Net Premiums Written: $1.76 BN Property (34%) Casualty (37%) Property reinsurance has declined 37.7% since 2005 as we largely exited the national account
Slide 11: Disciplined Reinsurance Portfolio Management
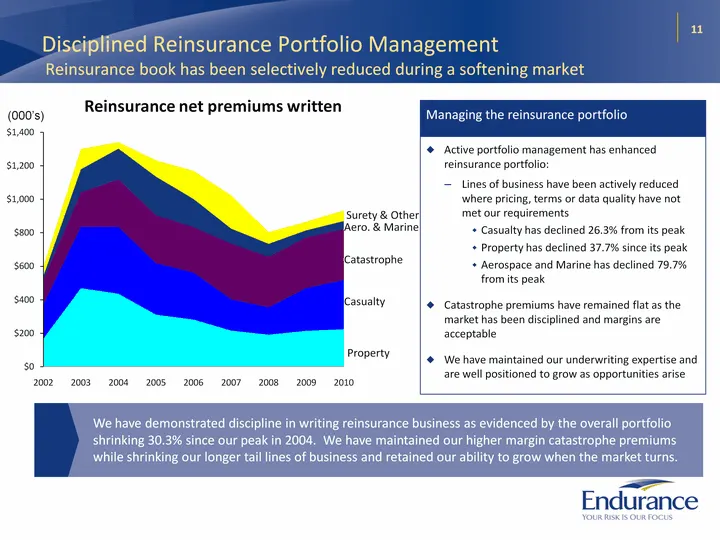
11 Disciplined Reinsurance Portfolio Management Reinsurance book has been selectively reduced during a softening market We have demonstrated discipline in writing reinsurance business as evidenced by the overall portfolio shrinking 30.3% since our peak in 2004. We have maintained our higher margin c
Slide 12: Diversified Insurance Portfolio
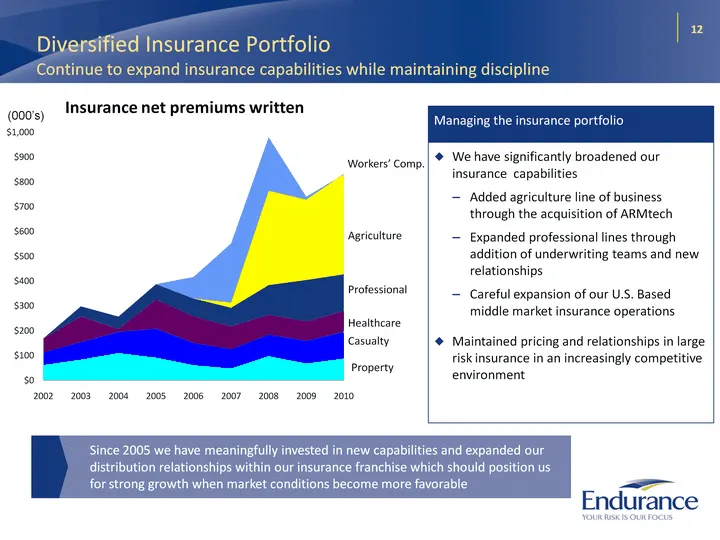
12 Diversified Insurance Portfolio Continue to expand insurance capabilities while maintaining discipline (CHART) Insurance net premiums written Professional Agriculture Healthcare Workers' Comp. Casualty Property Since 2005 we have meaningfully invested in new capabilities and expanded our distribu
Slide 13: Growing Capital Base While Returning Significant Capital to Investors
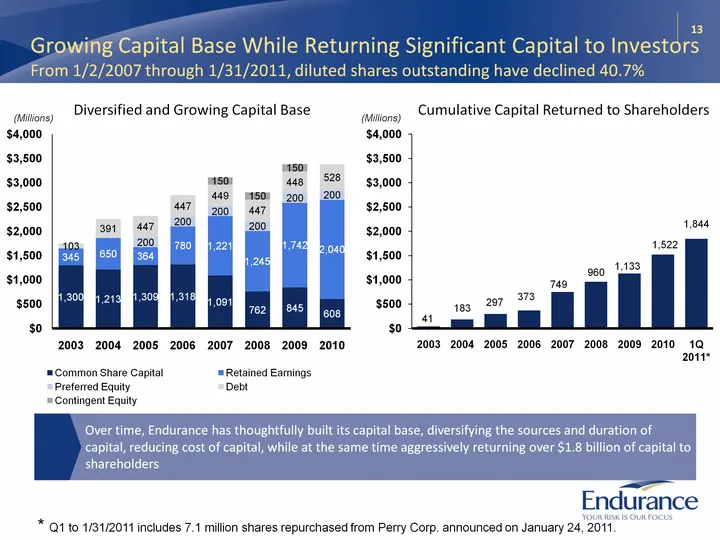
(CHART) 13 Growing Capital Base While Returning Significant Capital to Investors From 1/2/2007 through 1/31/2011, diluted shares outstanding have declined 40.7% (CHART) (Millions) (Millions) Cumulative Capital Returned to Shareholders Diversified and Growing Capital Base Over time, Endurance has tho
Slide 14: Strong Balance Sheet
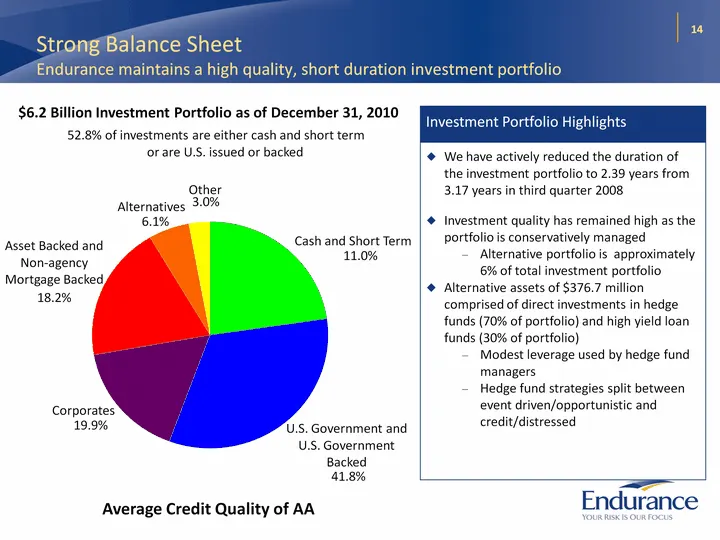
14 Strong Balance Sheet Endurance maintains a high quality, short duration investment portfolio Average Credit Quality of AA Investment Portfolio Highlights We have actively reduced the duration of the investment portfolio to 2.39 years from 3.17 years in third quarter 2008 Investment quality has re
Slide 15: Conclusion
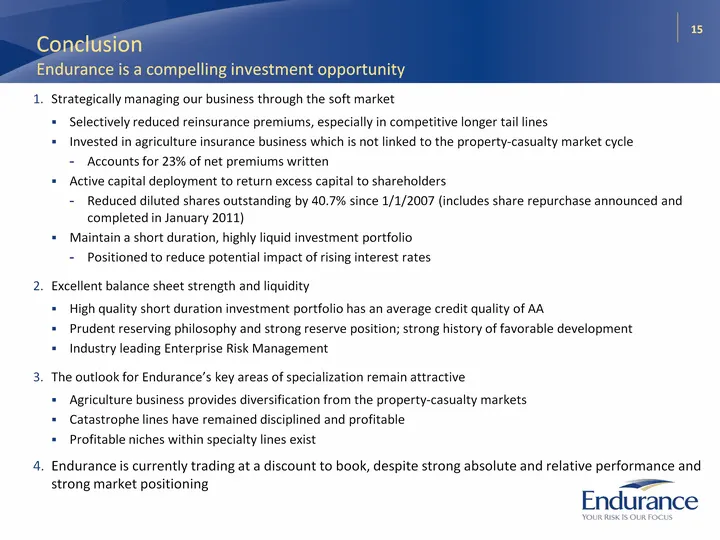
Conclusion Endurance is a compelling investment opportunity Strategically managing our business through the soft market Selectively reduced reinsurance premiums, especially in competitive longer tail lines Invested in agriculture insurance business which is not linked to the property-casualty market

Slide 16: Endurance
—_— Endurance
Slide 17: Business Organization and Competitive Advantages
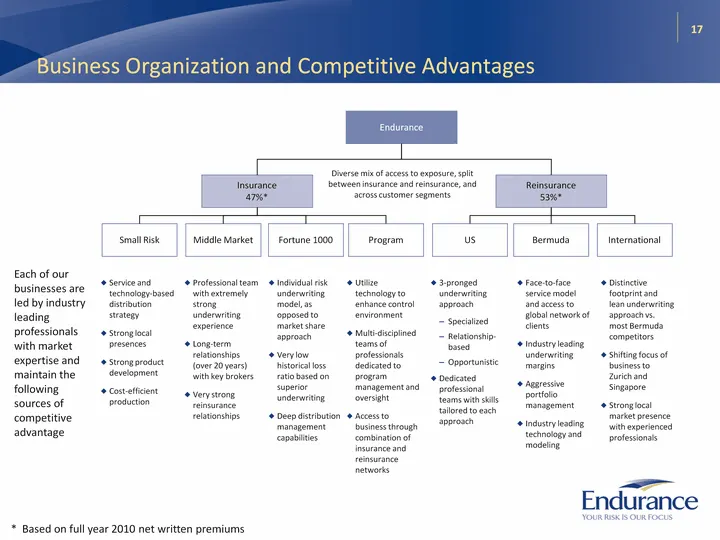
17 Business Organization and Competitive Advantages Each of our businesses are led by industry leading professionals with market expertise and maintain the following sources of competitive advantage Endurance Insurance 47%* Middle Market Small Risk Program Bermuda US Fortune 1000 International Reins
Slide 18: Balance Sheet Strength and Durability
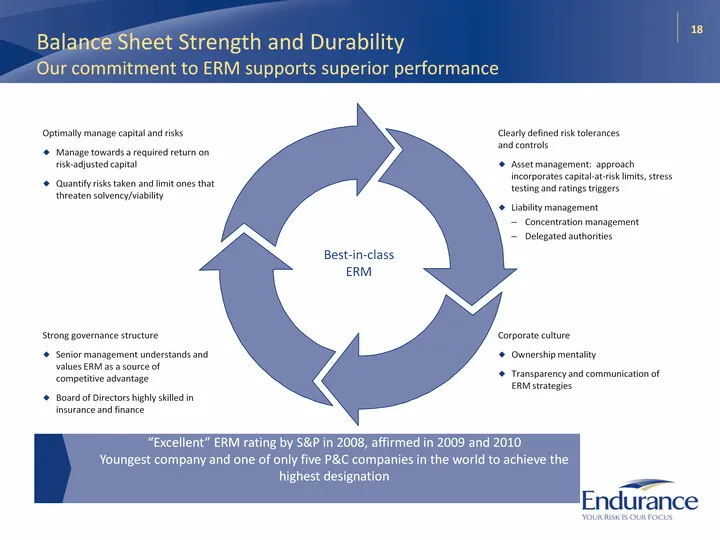
18 Balance Sheet Strength and Durability Our commitment to ERM supports superior performance Best-in-class ERM Optimally manage capital and risks Manage towards a required return on risk-adjusted capital Quantify risks taken and limit ones that threaten solvency/viability Clearly defined risk tolera
Slide 19: Active portfolio management
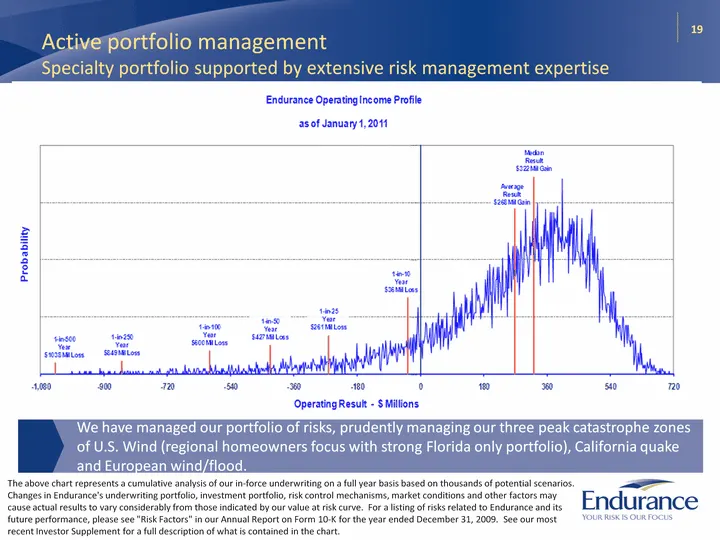
19 Active portfolio management Specialty portfolio supported by extensive risk management expertise We have managed our portfolio of risks, prudently managing our three peak catastrophe zones of U.S. Wind (regional homeowners focus with strong Florida only portfolio), California quake and European w
Slide 20: ARMtech Has Delivered Strong Results
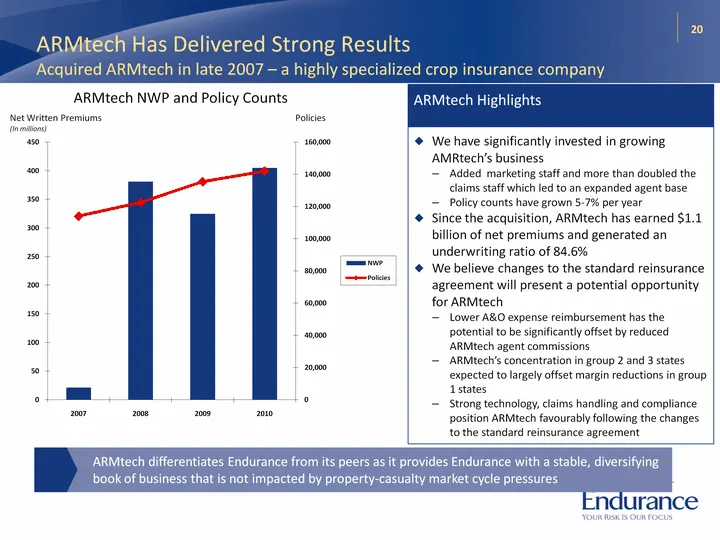
20 ARMtech Has Delivered Strong Results Acquired ARMtech in late 2007 - a highly specialized crop insurance company (CHART) ARMtech Highlights We have significantly invested in growing AMRtech's business Added marketing staff and more than doubled the claims staff which led to an expanded agent base
Slide 21: Financial Results for Fourth Quarter 2010
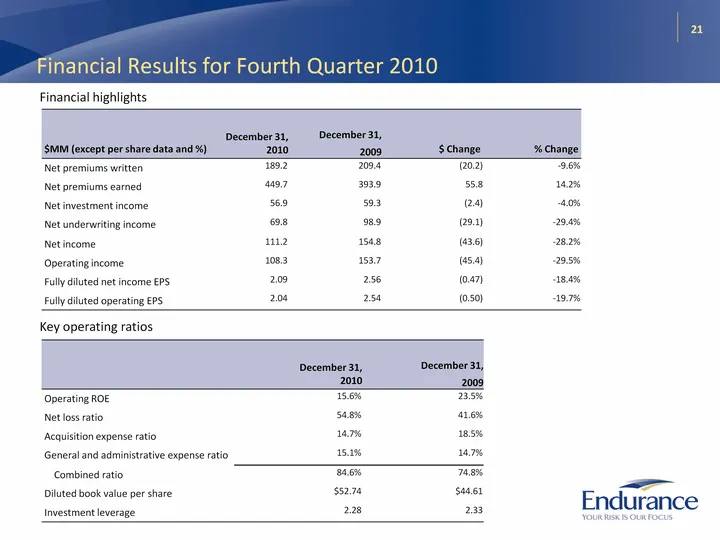
21 Financial Results for Fourth Quarter 2010 $MM (except per share data and %) December 31, 2010 December 31,2009 $ Change % Change Net premiums written 189.2 209.4 (20.2) -9.6% Net premiums earned 449.7 393.9 55.8 14.2% Net investment income 56.9 59.3 (2.4) -4.0% Net underwriting income 69.8 98.9 (
Slide 22: Fourth Quarter 2010 Net Written Premiums
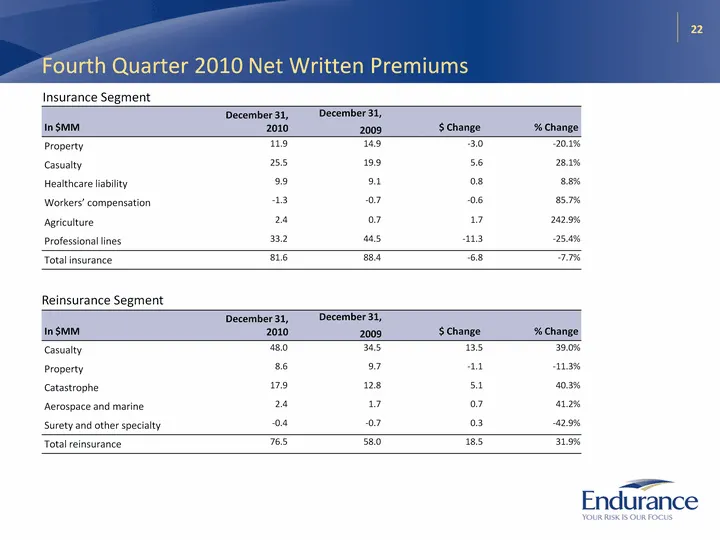
22 Fourth Quarter 2010 Net Written Premiums In $MM December 31, 2010 December 31,2009 $ Change % Change Property 11.9 14.9 -3.0 -20.1% Casualty 25.5 19.9 5.6 28.1% Healthcare liability 9.9 9.1 0.8 8.8% Workers' compensation -1.3 -0.7 -0.6 85.7% Agriculture 2.4 0.7 1.7 242.9% Professional lines 33.2
Slide 23: Financial Overview: Historical
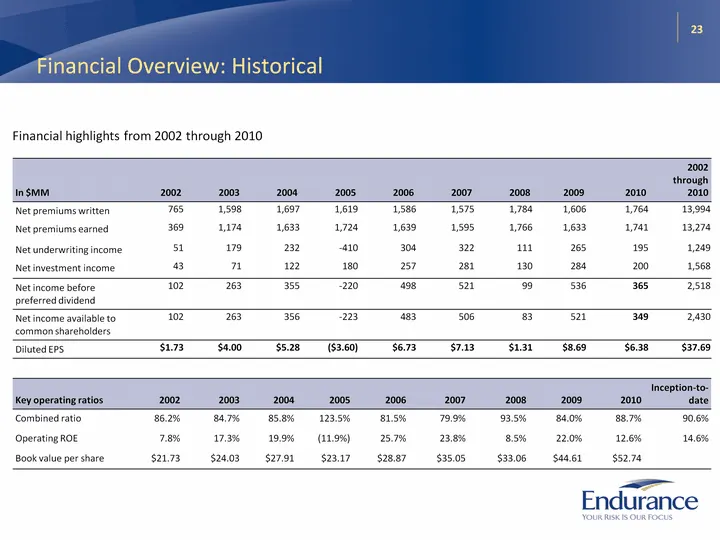
23 Financial Overview: Historical In $MM 2002 2003 2004 2005 2006 2007 2008 2009 2010 2002 through 2010 Net premiums written 765 1,598 1,697 1,619 1,586 1,575 1,784 1,606 1,764 13,994 Net premiums earned 369 1,174 1,633 1,724 1,639 1,595 1,766 1,633 1,741 13,274 Net underwriting income 51 179 232 -4
Source: SEC EDGAR · 8-K filed Feb 15, 2011
More decks from Endurance Specialty Holdings Ltd
 Merger or Acquisition (October 2016)17 slides · Oct 12, 2016
 Investor Presentation (August 2016)29 slides · Aug 9, 2016
 Investor Presentation (May 2016)28 slides · May 10, 2016
 Investor Presentation (February 2016)29 slides · Feb 9, 2016
 Investor Presentation (February 2015)28 slides · Feb 11, 2015
 Merger or Acquisition (April 2014)22 slides · Apr 14, 2014