Sealed Air — Credit Suisse Annual Paper & Packaging Conference 2012
17 slides from Sealed Air's conference presentation, Feb 21, 2012
Slide 1: Sealed Air Update
SEALED AIR UPDATE CREDIT SUISSE ANNUAL PAPER & PACKAGING CONFERENCE FEBRUARY 22, 2012 WILLIAM V. HICKEY PRESIDENT & CEO TOD S. CHRISTIE TREASURER & INTERIM CFO Sealed Air
Slide 2: Safe Harbor and Regulation G Statement
el SAFE HARBOR AND REGULATION G STAT| IT a This presentation contains forward-looking statements within the meaning of the Private Securities Litigation Reform Act of 1995. These forward-looking statements can be identified by such words as | fs iy assumes “could,” “estimates,” “expects,” “intends,”
Slide 3: Who We Are: A Company Focused on Protection
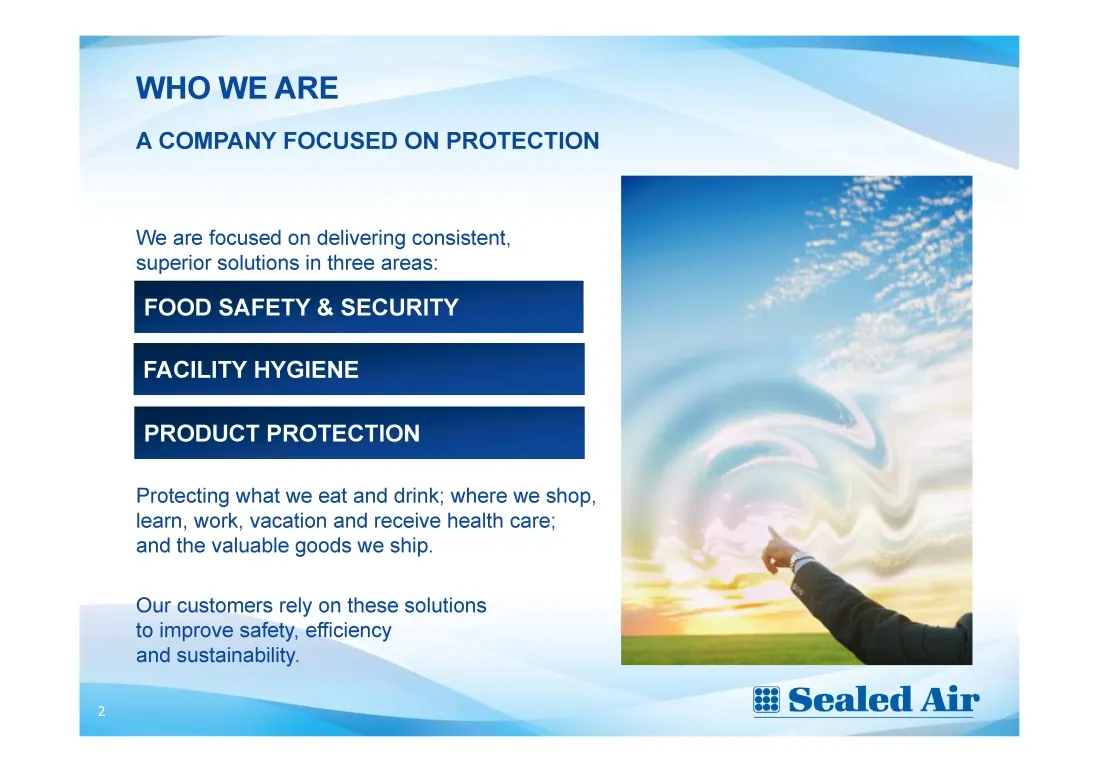
WHO WE ARE A COMPANY FOCUSED ON PROTECTION We are focused on delivering consistent, superior solutions in three areas: FOOD SAFETY & SECURITY FACILITY HYGIENE PRODUCT PROTECTION Protecting what we eat and drink; where we shop, learn, work, vacation and receive health care; and the valuable goods we
Slide 4: Solid Business Profile
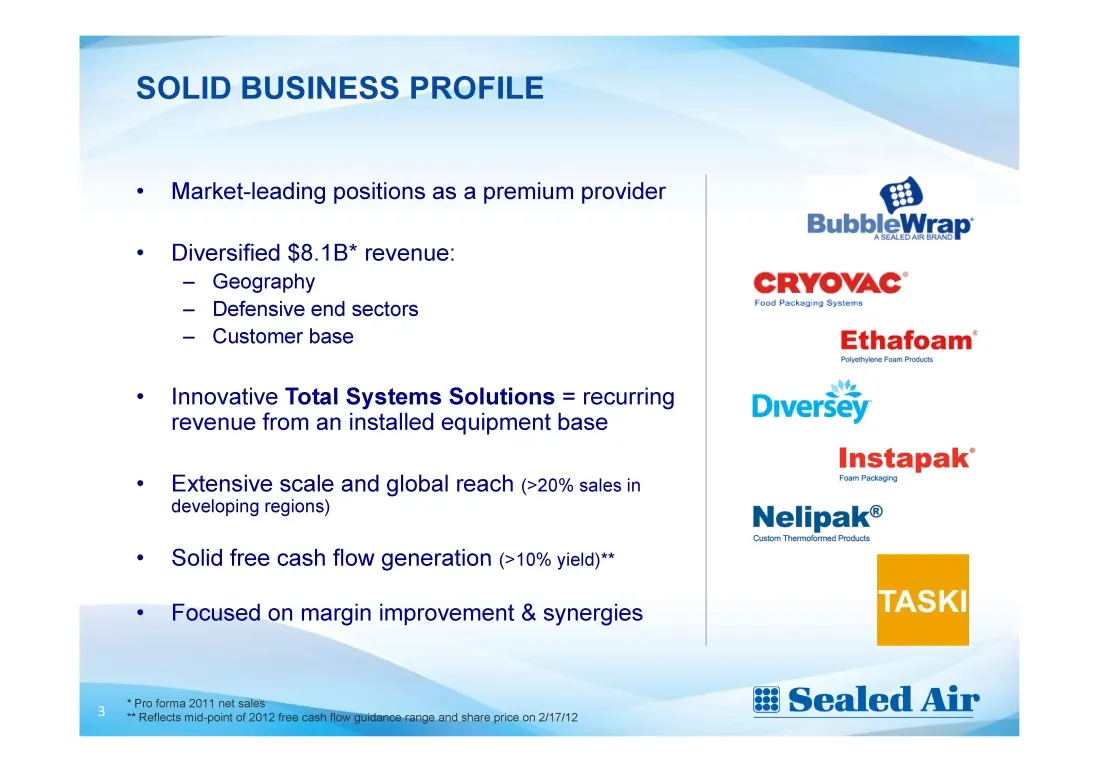
EE SOLID BUSINESS PROFILE Market-leading positions as a premium provider | @ BubbleWrap * Diversified $8.1B* revenue: — Geography CRYOVAC — Defensive end sectors aoa — Customer base Ethafoam’ + Innovative Total Systems Solutions = recurring 4 revenue from an installed equipment base Diversey Instapa
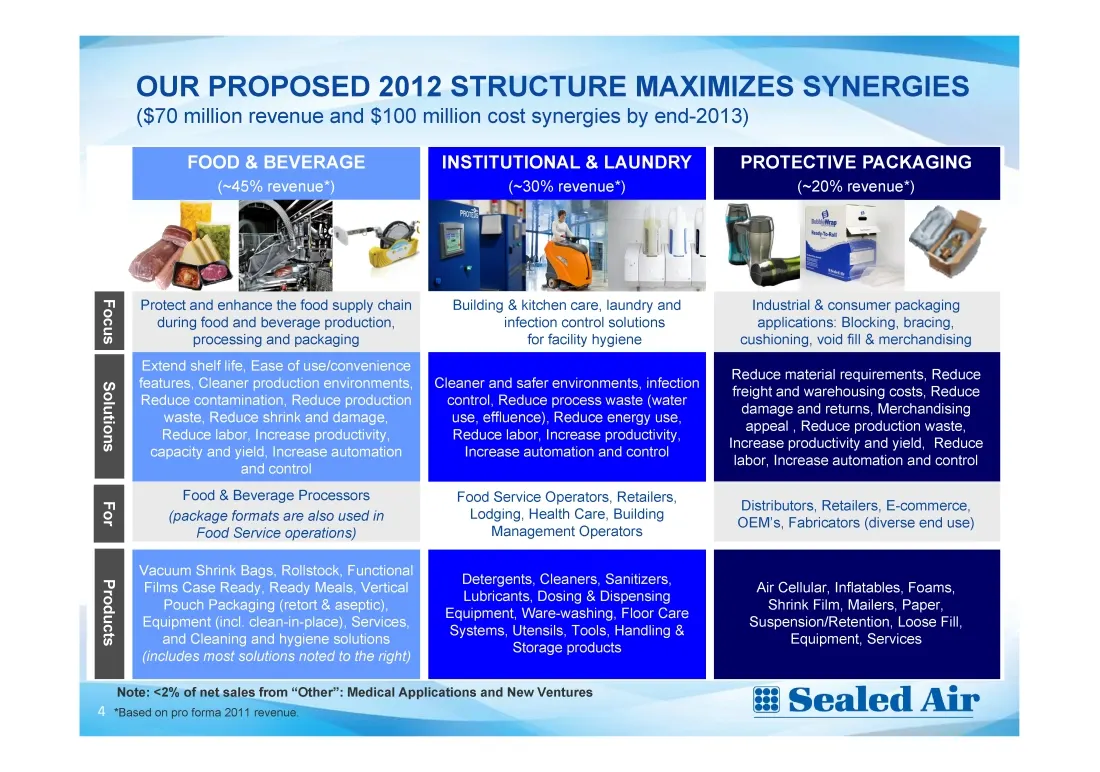
Slide 5: Our Proposed 2012 Structure Maximizes Synergies
OUR PROPOSED 2012 STRUCTURE MAXIMIZES SYNERGIES ($70 million revenue and $100 million cost synergies by end-2013) INSTITUTIONAL & LA PROTECTIVE PACKAGING / revenue (~20% revenuey) ii Protect and enhance the food su ly giem Building 7 sctchen care, laundry ans Industrial & consumer packaging during f
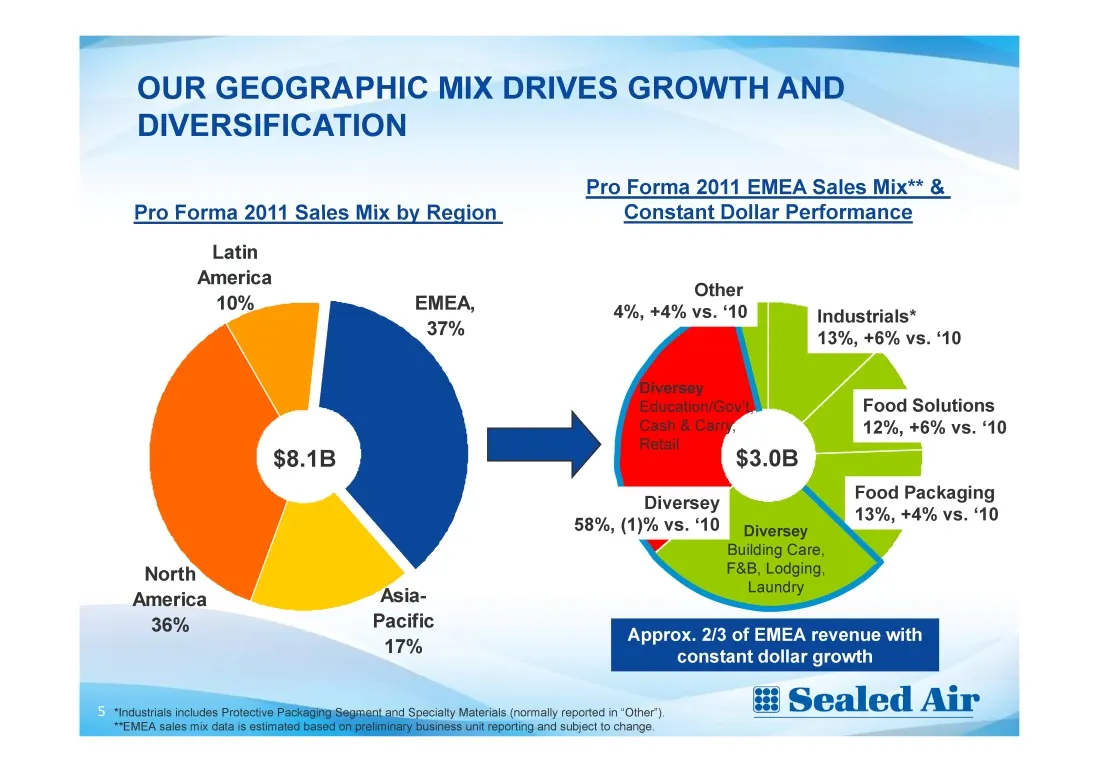
Slide 6: Our Geographic Mix Drives Growth and Diversification
OUR GEOGRAPHIC MIX DRIVES GROWTH AND DIVERSIFICATION Pro Forma 2011 EMEA Sales Mix** & Pro Forma 2011 Sales Mix by Region Constant Dollar Performance Latin America Other 10% 4%, +4% vs. 10 Industrials* 13%, +6% vs. ‘10 Food Solutions 12%, +6% vs. ‘10 " Food Packaging 58%, (1)%vetd 13%, +4% vs. 10 Ap
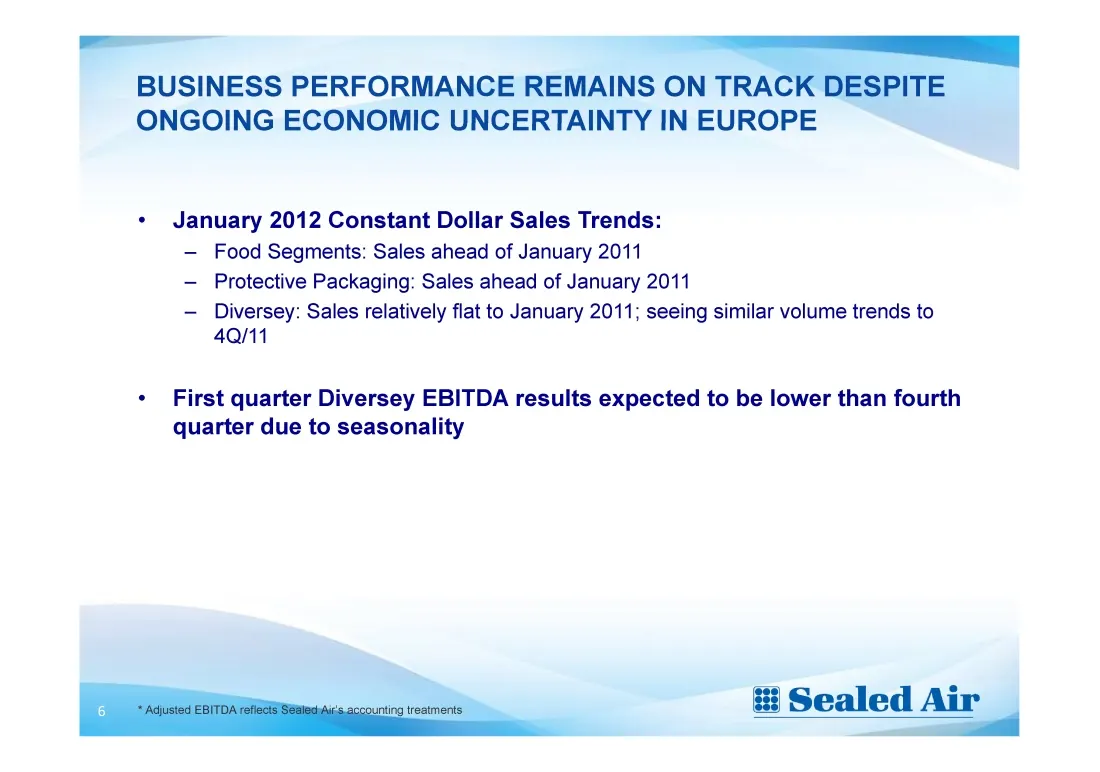
Slide 7: Business Performance Remains on Track Despite Ongoing Economic Uncertainty in Europe
= BUSINESS PERFORMANCE REMAINS ON TRACK DESPITE ONGOING ECONOMIC UNCERTAINTY IN EUROPE January 2012 Constant Dollar Sales Trends: — Food Segments: Sales ahead of January 2011 — Protective Packaging: Sales ahead of January 2011 — Diversey: Sales relatively flat to January 2011; seeing similar volume
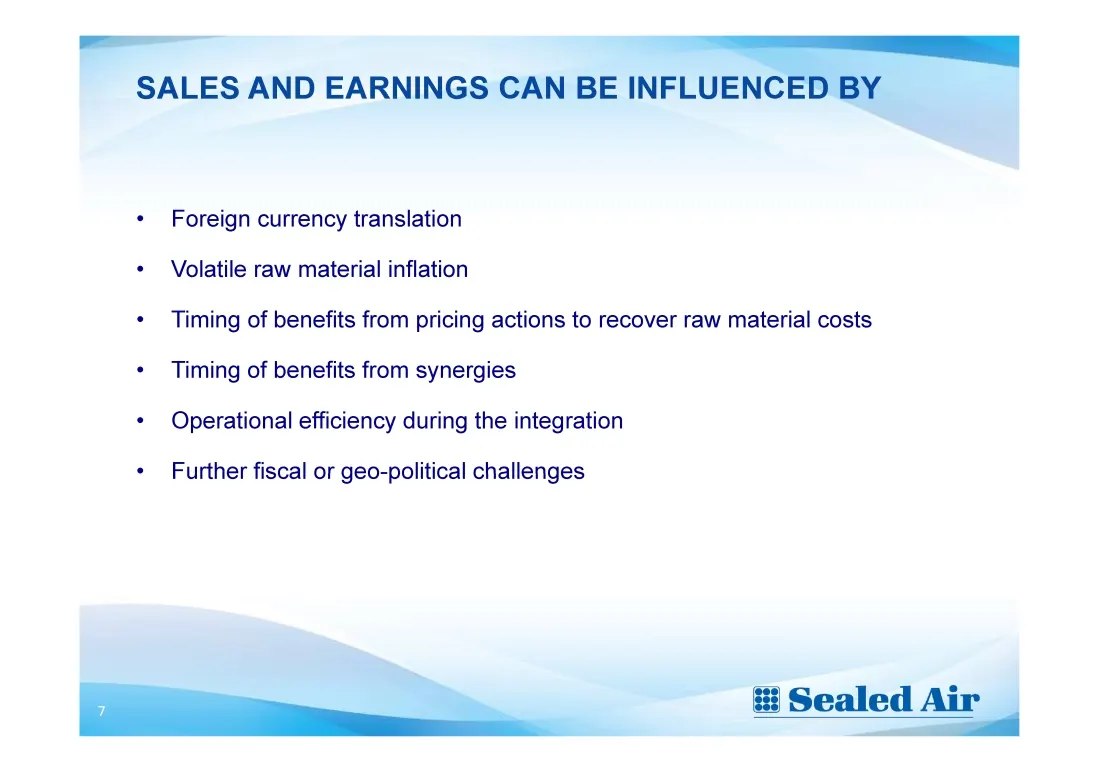
Slide 8: Sales and Earnings Can Be Influenced By
EE SALES AND EARNINGS CAN BE INFLUENCED BY Foreign currency translation Volatile raw material inflation Timing of benefits from pricing actions to recover raw material costs Timing of benefits from synergies Operational efficiency during the integration Further fiscal or geo-political challenges A #
Slide 9: Integration Program Is on Track
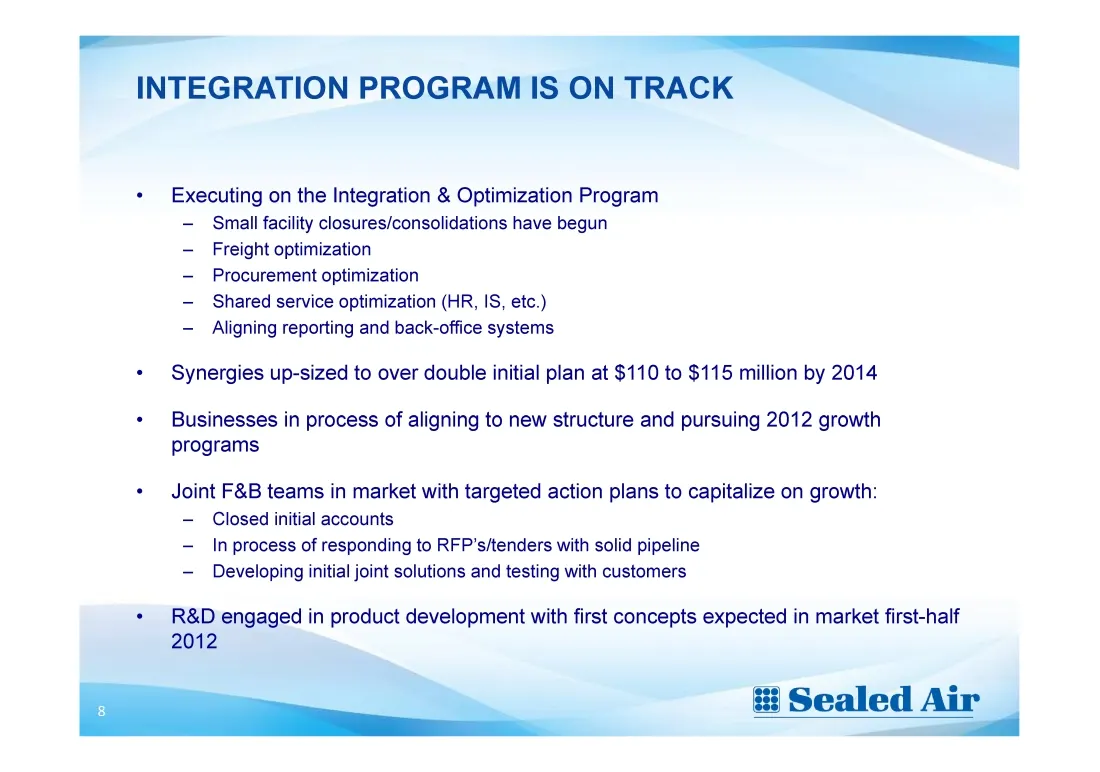
ml INTEGRATION PROGRAM IS ON TRACK Executing on the Integration & Optimization Program - Small facility closures/consolidations have begun — Freight optimization - Procurement optimization - Shared service optimization (HR, IS, etc.) - Aligning reporting and back-office systems. Synergies up-sized t
Slide 10: Sealed Air
Sealed Air
Slide 11: Ample Liquidity to Drive Value
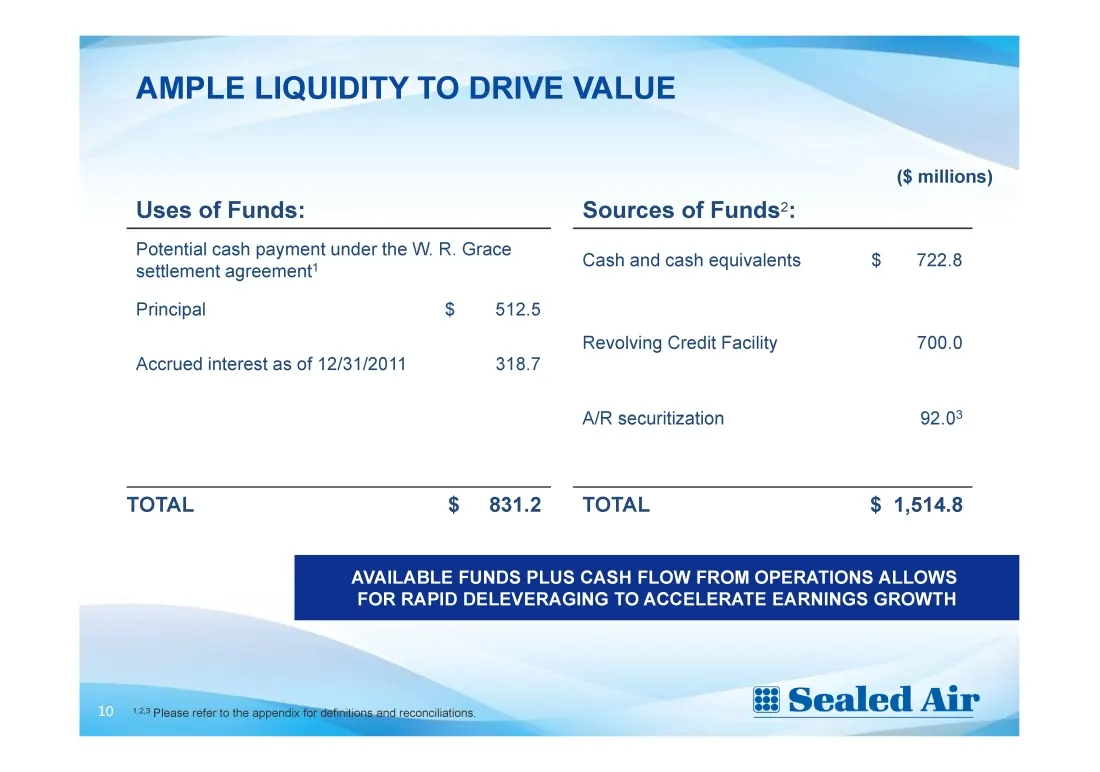
= AMPLE LIQUIDITY TO DRIVE VALUE ($ millions) Uses of Funds: Sources of Funds’: Potential cash payment under the W. R. Grace . settlement agreement! Cash and cash equivalents $ 722.8 Principal $ 512.5 Revolving Credit Facility 700.0 Accrued interest as of 12/31/2011 318.7 AJR securitization 92.08 TO
Slide 12: Solid Free Cash Flow Generation
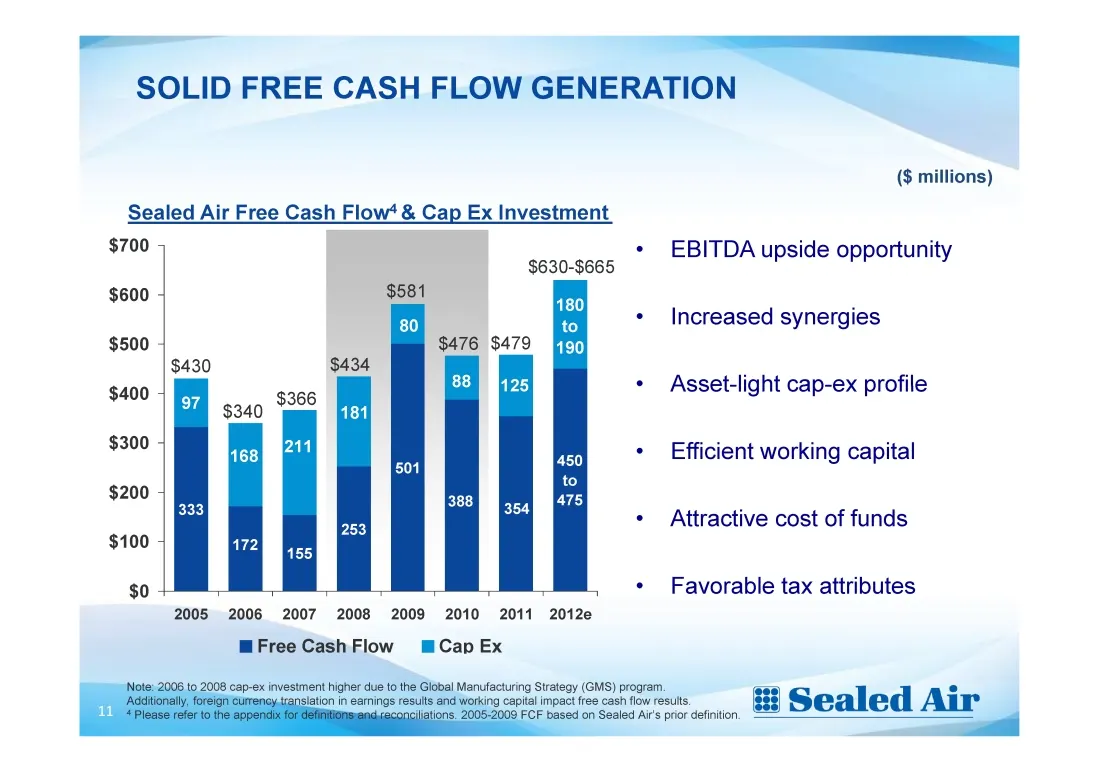
SOLID FREE CASH FLOW GENERATION Sealed Air Free Cash Flow‘ & Cap Ex Investment $700 $600 $500 $400 $300 $200 $100 $0 $630-$665 2005 2006 2007 2008 2009 2010 2011 ™FreeCashFlow mCap Ex 2008 cap 2012e slation ($ millions) EBITDA upside opportunity Increased synergies Asset-light cap-ex profile Efficie
Slide 13: Rapid Deleveraging: Targeting $4.9B Net Debt End-2012
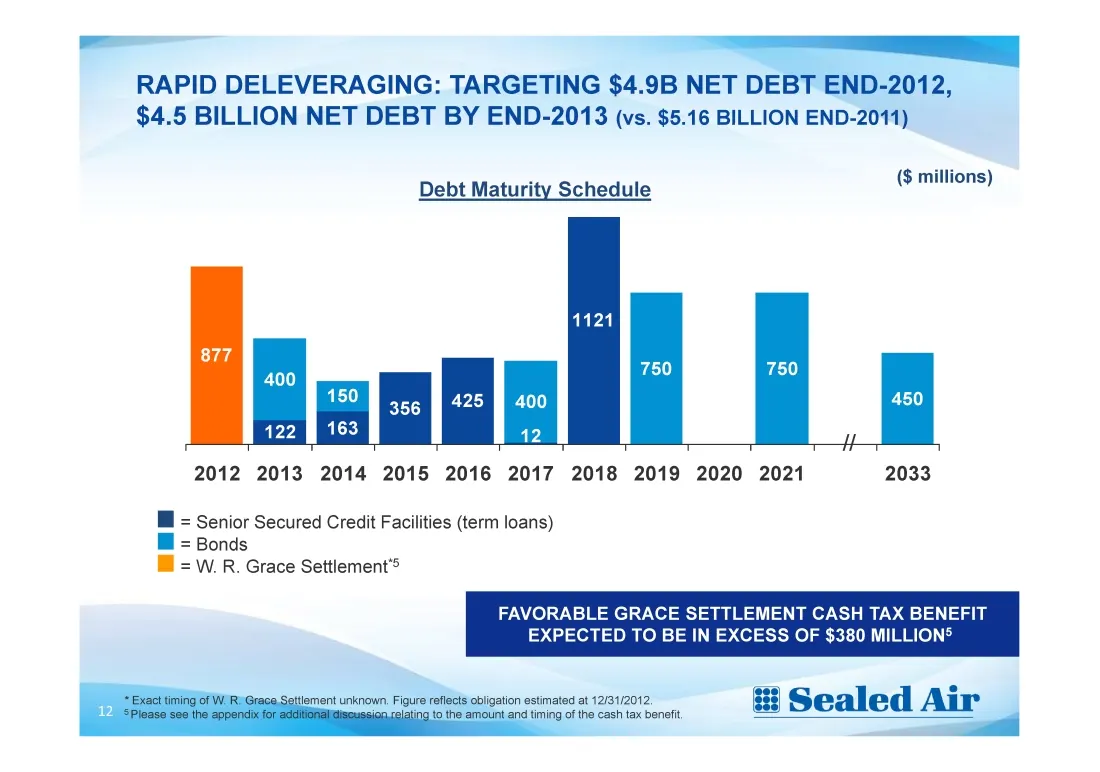
RAPID DELEVERAGING: TARGETING $4.9B NET DEBT END-2012, $4.5 BILLION NET DEBT BY END-2013 (vs. $5.16 BILLION END-2011) ($ millions) Debt Maturity Schedule 2012 2013 2014 2015 2016 2017 2018 2019 2020 2021 2033 a Sela Secured Credit Facilities (term loans) jonds FAVORABLE GRACE SETTLEMENT CASH TAX BEN
Slide 14: Focused on Key Objectives to Drive Shareholder Value
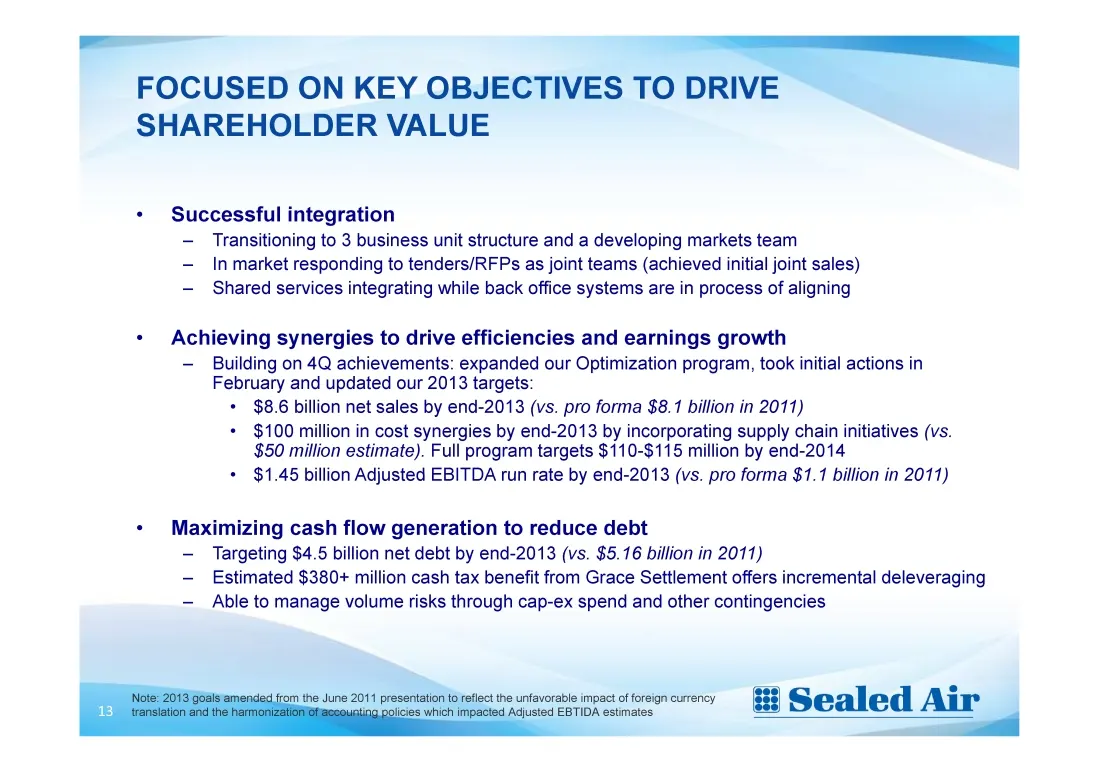
= FOCUSED ON KEY OBJECTIVES TO DRIVE SHAREHOLDER VALUE Successful integration — Transitioning to 3 business unit structure and a developing markets team In market responding to tenders/RFPs as joint teams (achieved initial joint sales) Shared services integrating while back office systems are in pro
Slide 15: For additional information, please contact
a For additional information, please contact: Amanda Butler, Director of Investor Relations Email: [email protected] Tel: 201.703.4210
Slide 16: Footnote detail
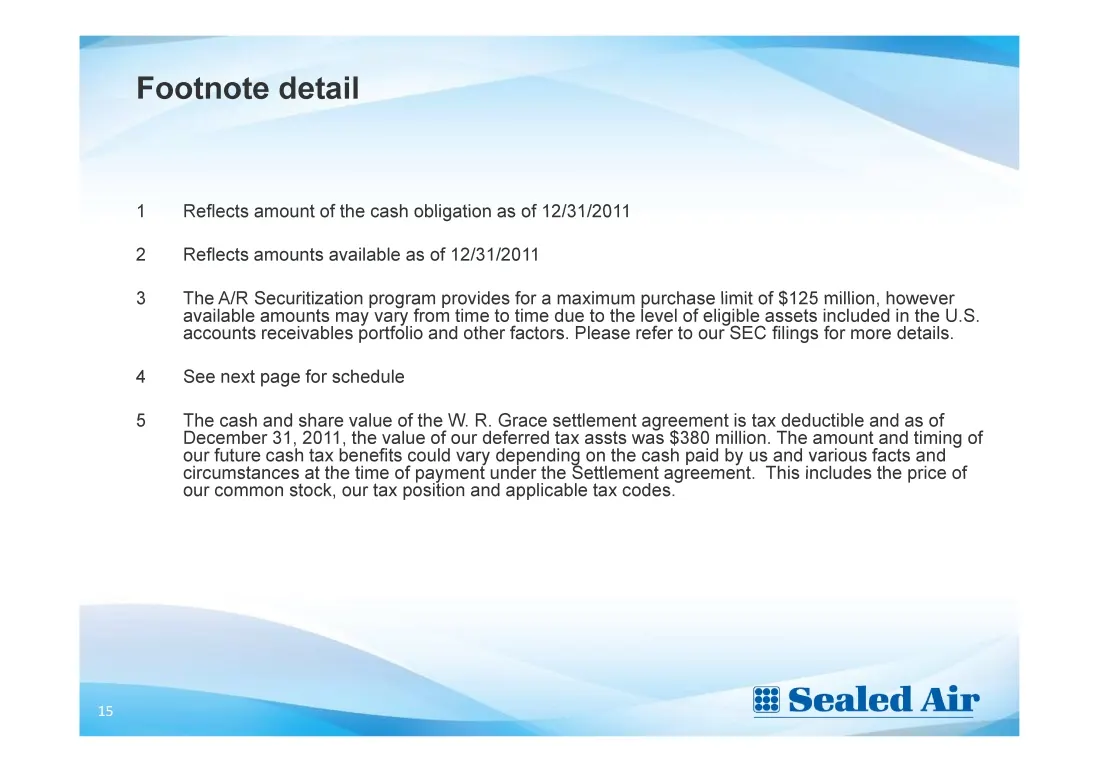
— = Footnote detail 1 Reflects amount of the cash obligation as of 12/31/2011 2 Reflects amounts available as of 12/31/2011 3 The AVR Securitization program provides for a maximum purchase limit of $125 million, however available amounts may vary from time to time due to the level of eligible assets
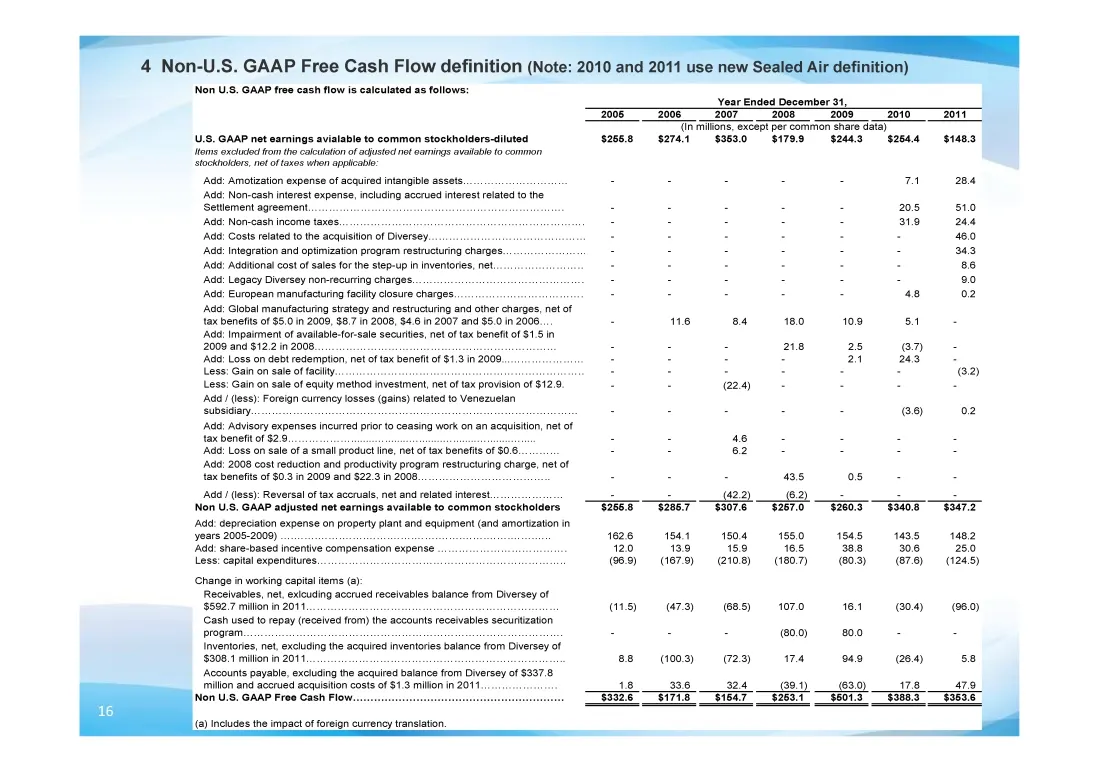
Slide 17: Non-U.S. GAAP Free Cash Flow definition
4 Non-U.S. GAAP Free Cash Flow definition (Note: 2010 and 2011 use new Non U.S. GAAP free cash flow is calculated as follows: us. stockholders, net o taxes when applicable: Ended December 31, Ada: Costs related to the acquisition of Diversey. ‘Ad: Acltional cost of sales forthe step-up in inventorie
Source: SEC EDGAR · 8-K filed Feb 21, 2012
More decks from Sealed Air Corporation
 Q3 2025 Earnings Presentation17 slides · Nov 4, 2025
 Q2 2025 Earnings Presentation17 slides · Aug 5, 2025
 Q1 2025 Earnings Presentation15 slides · May 6, 2025
 Q4 2024 Earnings Presentation21 slides · Feb 25, 2025
 Q3 2024 Earnings Presentation20 slides · Nov 7, 2024
 Q2 2024 Earnings Presentation20 slides · Aug 8, 2024