South Jersey Industries — Morgan Stanley Utilities Conference 2018
23 slides from South Jersey Industries's conference presentation, Feb 27, 2018

Slide 1: South Jersey Industries Morgan Stanley Utilities Conference
South Jersey Industries Morgan Stanley Utilities Conference - NY February 27, 2018
Slide 2: Forward Looking Statements
Certain statements contained in this presentation may qualify as “forward-looking statements” within the meaning of Section 27A of the Securities Act of 1933 and Section 21E of the Securities Exchange Act of 1934. All statements other than statements of historical fact should be considered forward-l
Slide 3: Organizational Structure
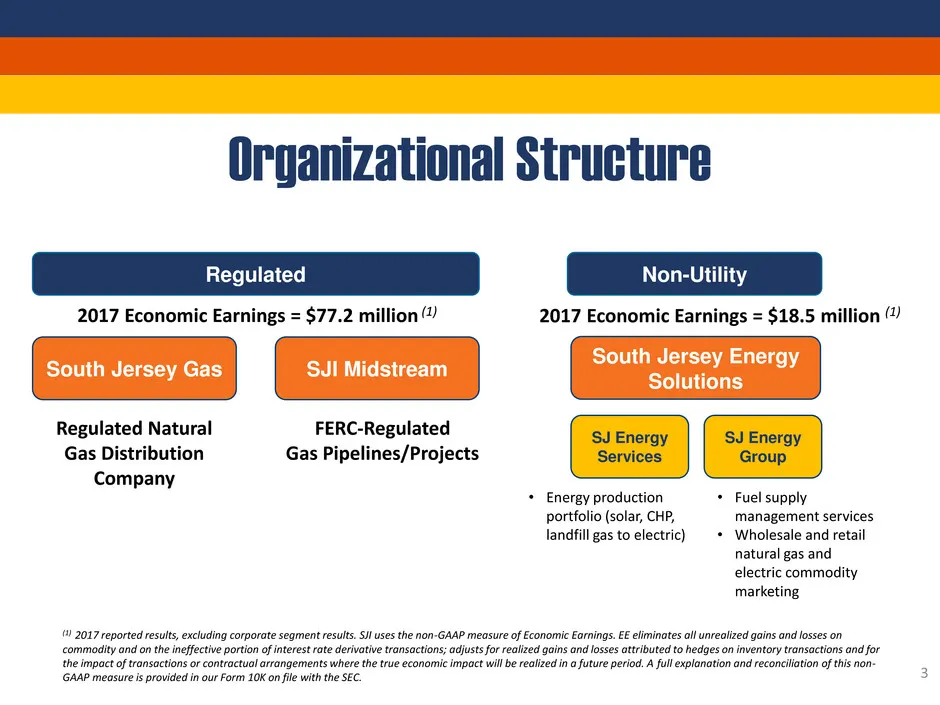
3 South Jersey Gas SJI Midstream South Jersey Energy Solutions Regulated Natural Gas Distribution Company FERC-Regulated Gas Pipelines/Projects SJ Energy Services SJ Energy Group • Energy production portfolio (solar, CHP, landfill gas to electric) • Fuel supply management services • Wholesale and re
Slide 4: 2017 Highlights: The Path to Growth
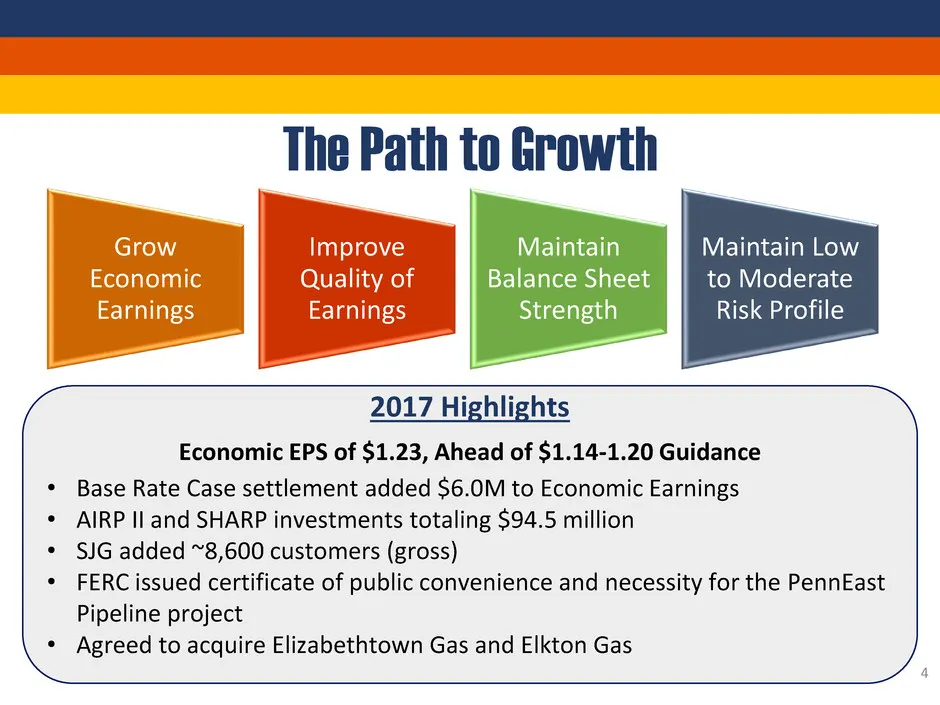
Grow Economic Earnings Improve Quality of Earnings Maintain Balance Sheet Strength Maintain Low to Moderate Risk Profile 2017 Highlights Economic EPS of $1.23, Ahead of $1.14-1.20 Guidance • Base Rate Case settlement added $6.0M to Economic Earnings • AIRP II and SHARP investments totaling $94.5 mil
Slide 5: 2018 Guidance
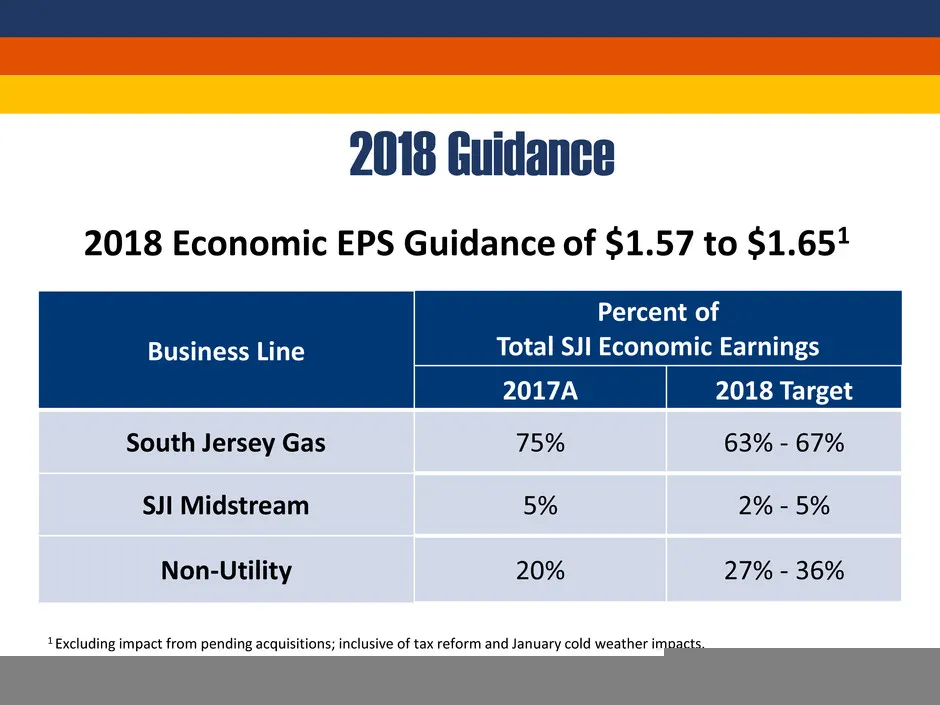
2018 Guidance Business Line Percent of Total SJI Economic Earnings 2017A 2018 Target South Jersey Gas 75% 63% - 67% SJI Midstream 5% 2% - 5% Non-Utility 20% 27% - 36% 2018 Economic EPS Guidance of $1.57 to $1.651 1 Excluding impact from pending acquisitions; inclusive of tax reform and January cold
Slide 6: Improving the Quality of Earnings
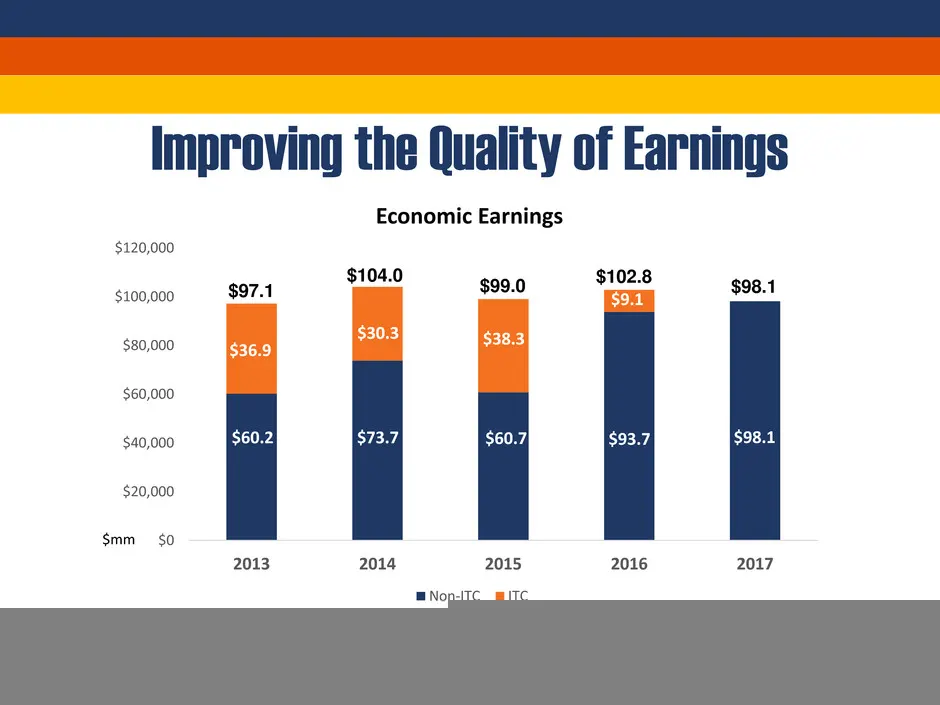
6 Improving the Quality of Earnings $0 $20,000 $40,000 $60,000 $80,000 $100,000 $120,000 2013 2014 2015 2016 2017 Economic Earnings Non-ITC ITC $98.1 $38.3 $98.1 $60.2 $73.7 $60.7 $36.9 $30.3 $97.1 $104.0 $99.0 $102.8 $mm $60.7 $38.3 $93.7 $9.1
Slide 7: Strong Financial Position
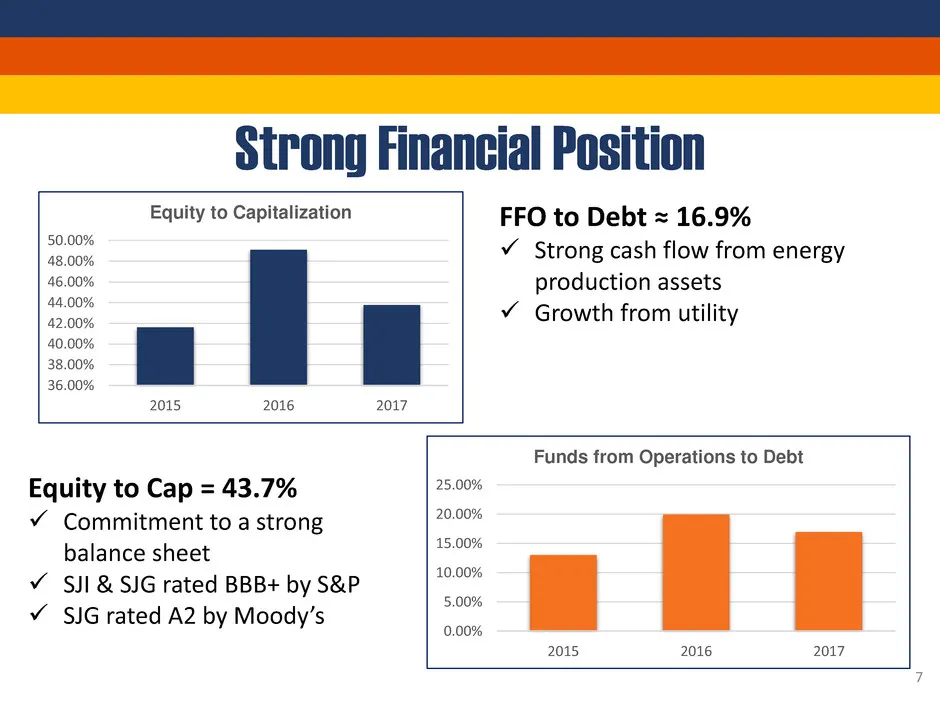
36.00% 38.00% 40.00% 42.00% 44.00% 46.00% 48.00% 50.00% 2015 2016 2017 Equity to Capitalization 7 Equity to Cap = 43.7% Commitment to a strong balance sheet SJI & SJG rated BBB+ by S&P SJG rated A2 by Moody’s Strong Financial Position FFO to Debt ≈ 16.9% Strong cash flow from energy producti
Slide 8: Capex Drives Economic Earnings
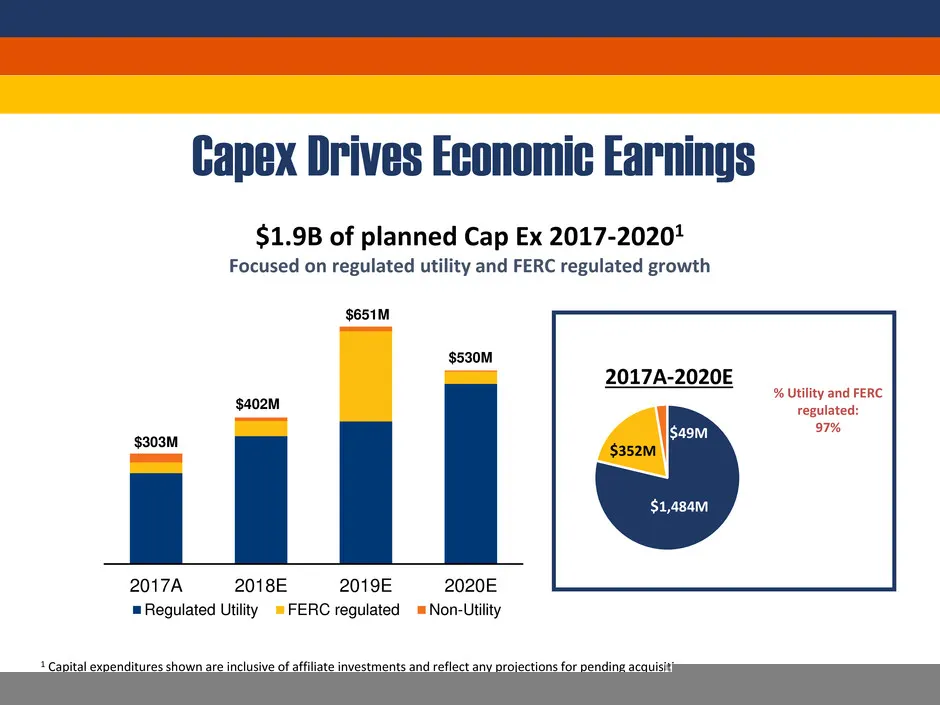
Capex Drives Economic Earnings $1.9B of planned Cap Ex 2017-20201 Focused on regulated utility and FERC regulated growth 2017A-2020E % Utility and FERC regulated: 97% 1 Capital expenditures shown are inclusive of affiliate investments and reflect any projections for pending acquisition 2017A 2018E 2
Slide 9: SJG Base Rate Case and Infrastructure Investment
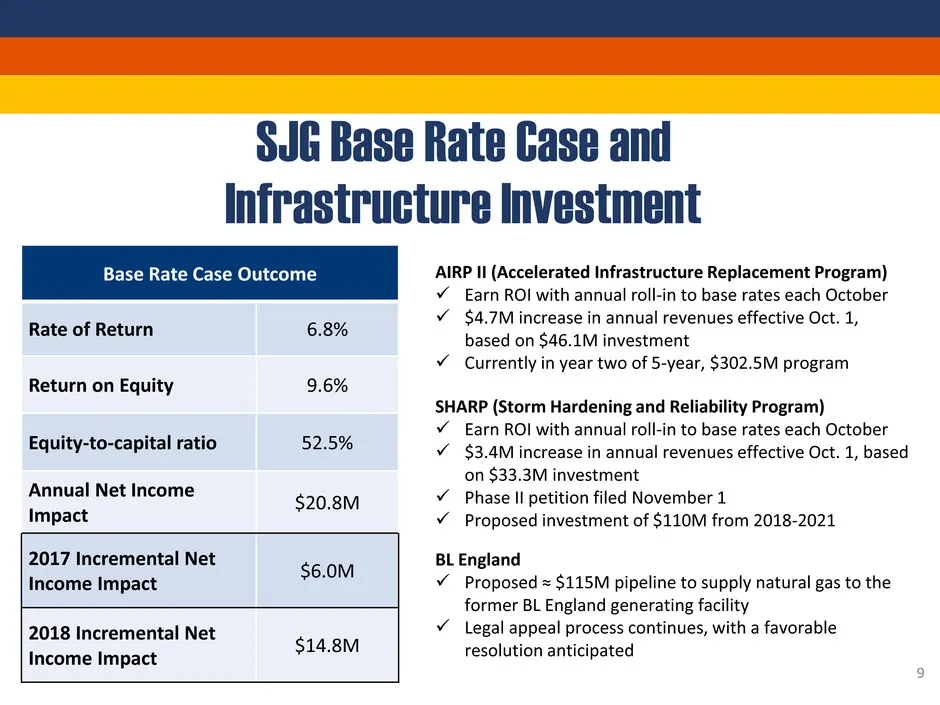
SJG Base Rate Case and Infrastructure Investment Base Rate Case Outcome Rate of Return 6.8% Return on Equity 9.6% Equity-to-capital ratio 52.5% Annual Net Income Impact $20.8M 2017 Incremental Net Income Impact $6.0M 2018 Incremental Net Income Impact $14.8M AIRP II (Accelerated Infrastructure Repla
Slide 10: Utility Customer Growth
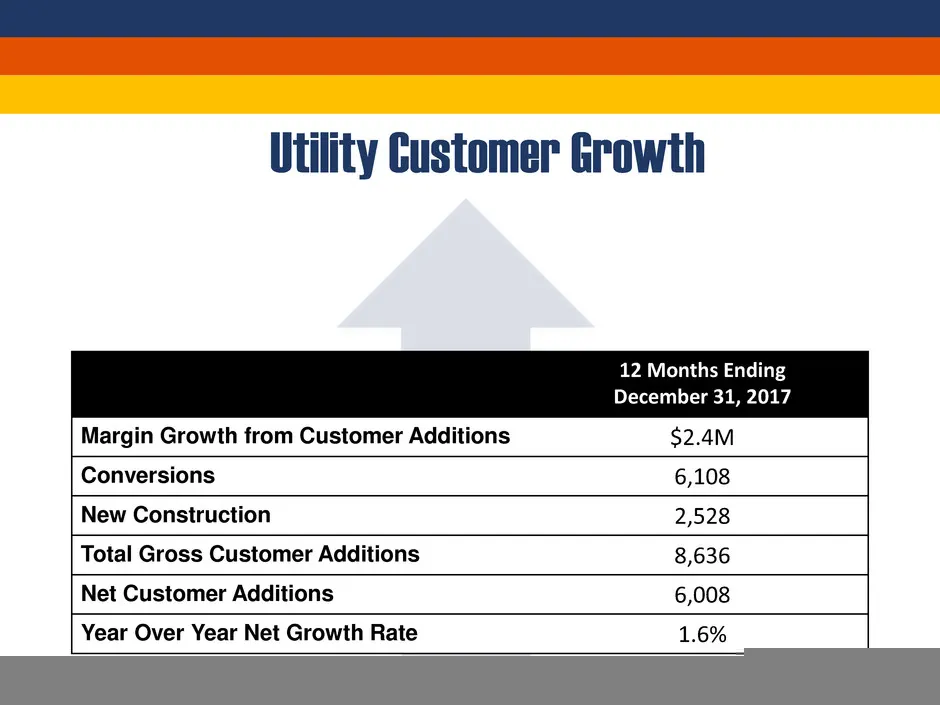
Utility Customer Growth 12 Months Ending December 31, 2017 Margin Growth from Customer Additions $2.4M Conversions 6,108 New Construction 2,528 Total Gross Customer Additions 8,636 Net Customer Additions 6,008 Year Over Year Net Growth Rate 1.6% 10
Slide 11: PennEast Pipeline Project
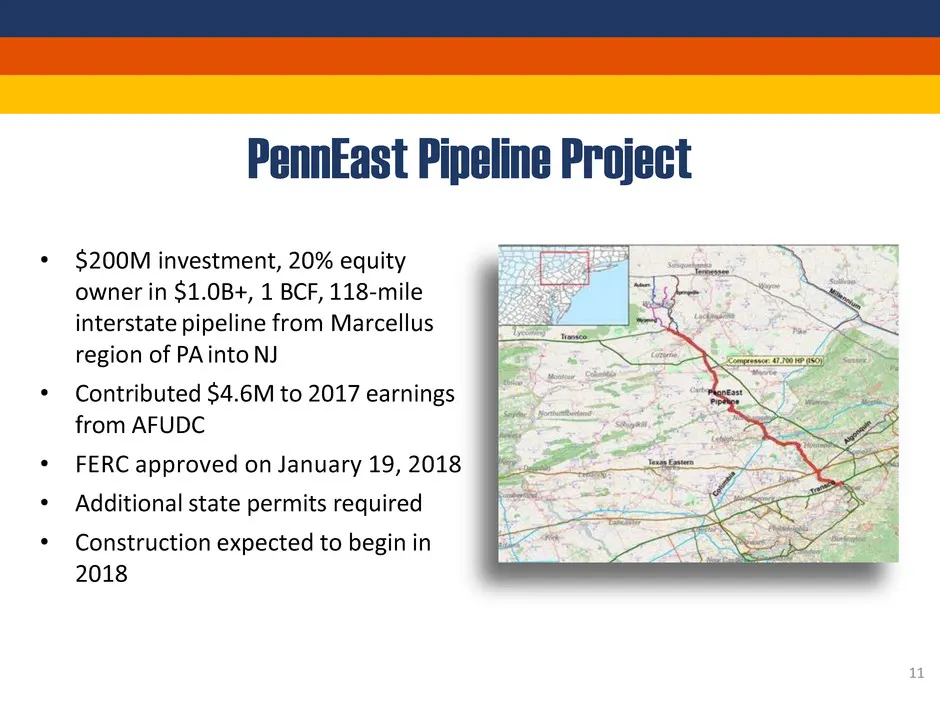
PennEast Pipeline Project • $200M investment, 20% equity owner in $1.0B+, 1 BCF, 118-mile interstate pipeline from Marcellus region of PA into NJ • Contributed $4.6M to 2017 earnings from AFUDC • FERC approved on January 19, 2018 • Additional state permits required • Construction expected to begin i
Slide 12: Fuel Supply Management
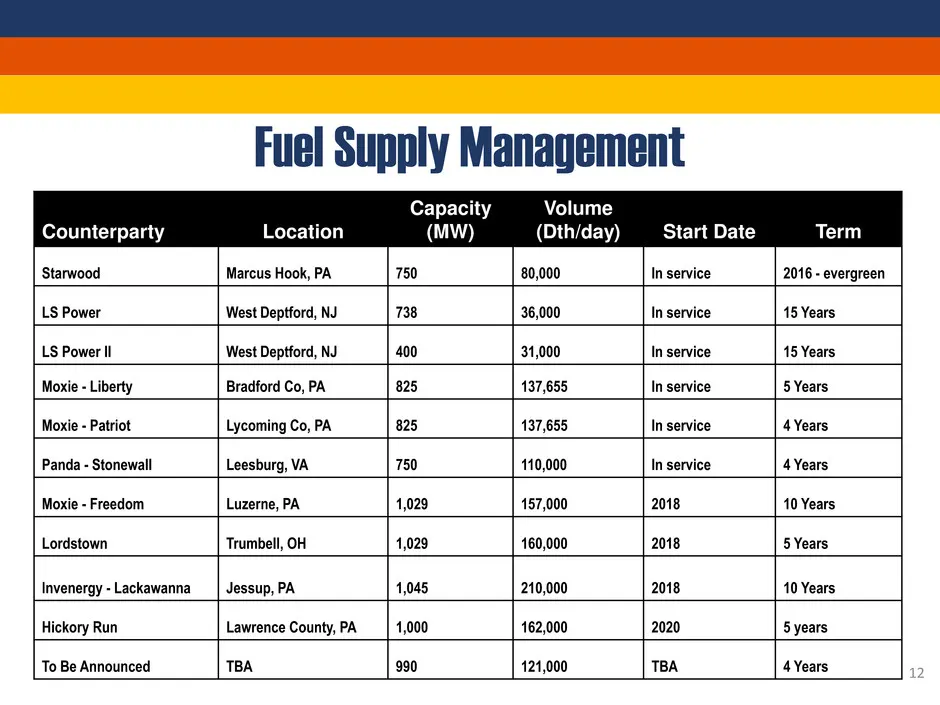
Fuel Supply Management Counterparty Location Capacity (MW) Volume (Dth/day) Start Date Term Starwood Marcus Hook, PA 750 80,000 In service 2016 - evergreen LS Power West Deptford, NJ 738 36,000 In service 15 Years LS Power II West Deptford, NJ 400 31,000 In service 15 Years Moxie - Liberty Bradford
Slide 13: Current Performance
Current Performance C , a : :
Slide 14: Economic Earnings – 2017 v 2016
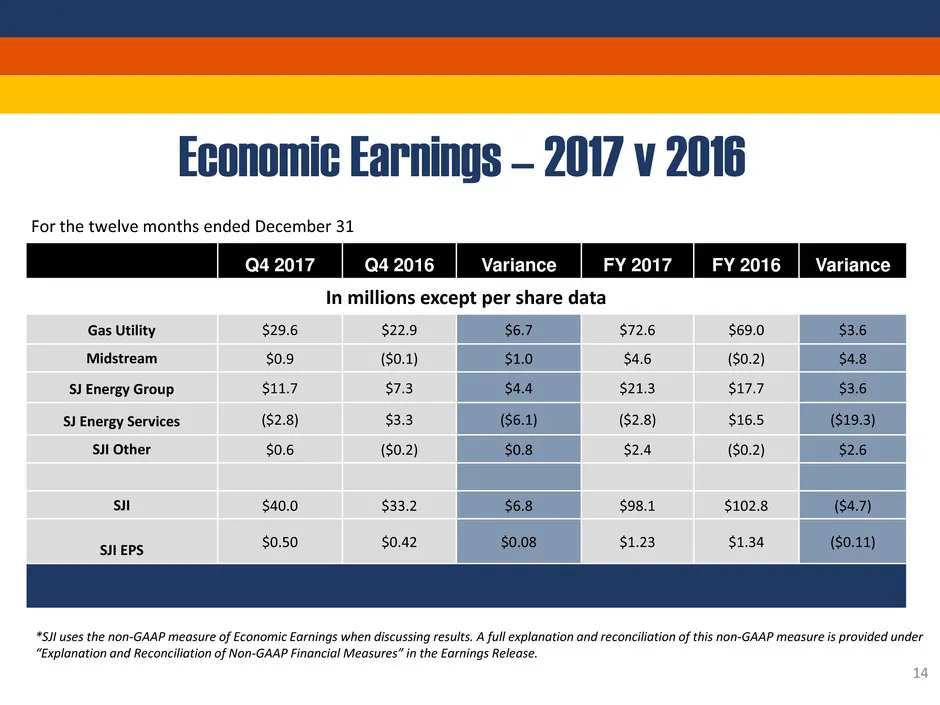
Economic Earnings – 2017 v 2016 For the twelve months ended December 31 Q4 2017 Q4 2016 Variance FY 2017 FY 2016 Variance In millions except per share data Gas Utility $29.6 $22.9 $6.7 $72.6 $69.0 $3.6 Midstream $0.9 ($0.1) $1.0 $4.6 ($0.2) $4.8 SJ Energy Group $11.7 $7.3 $4.4 $21.3 $17.7 $3.6 SJ En
Slide 15: South Jersey Gas
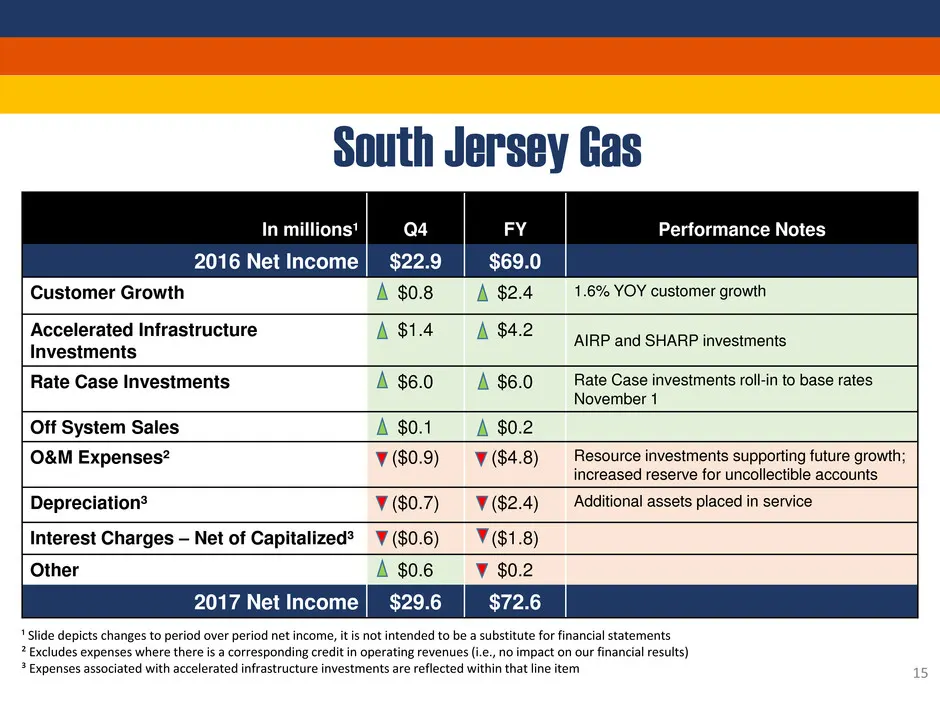
South Jersey Gas In millions¹ Q4 FY Performance Notes 2016 Net Income $22.9 $69.0 Customer Growth $0.8 $2.4 1.6% YOY customer growth Accelerated Infrastructure Investments $1.4 $4.2 AIRP and SHARP investments Rate Case Investments $6.0 $6.0 Rate Case investments roll-in to base rates November 1 Off
Slide 16: South Jersey Energy Group Economic Earnings
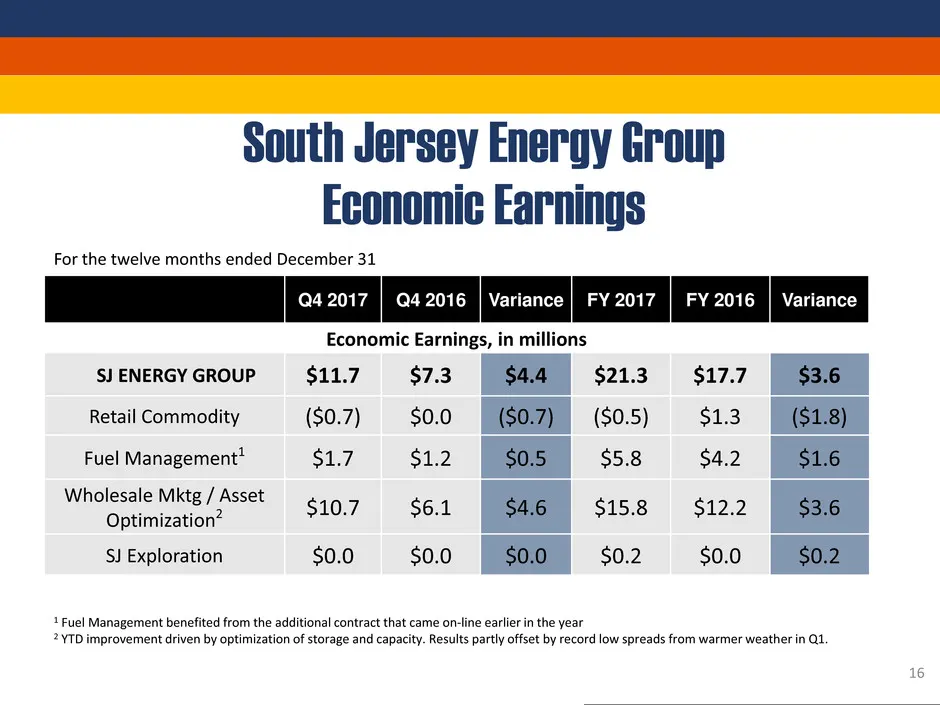
South Jersey Energy Group Economic Earnings For the twelve months ended December 31 Q4 2017 Q4 2016 Variance FY 2017 FY 2016 Variance Economic Earnings, in millions SJ ENERGY GROUP $11.7 $7.3 $4.4 $21.3 $17.7 $3.6 Retail Commodity ($0.7) $0.0 ($0.7) ($0.5) $1.3 ($1.8) Fuel Management1 $1.7 $1.2 $0.5
Slide 17: South Jersey Energy Services Economic Earnings
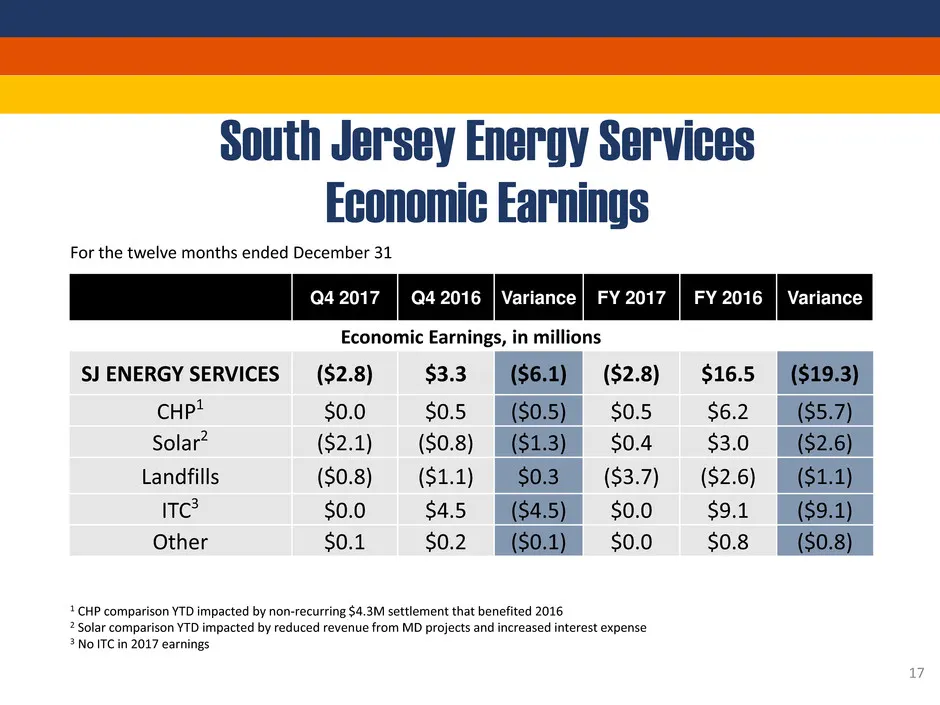
South Jersey Energy Services Economic Earnings For the twelve months ended December 31 Q4 2017 Q4 2016 Variance FY 2017 FY 2016 Variance Economic Earnings, in millions SJ ENERGY SERVICES ($2.8) $3.3 ($6.1) ($2.8) $16.5 ($19.3) CHP1 $0.0 $0.5 ($0.5) $0.5 $6.2 ($5.7) Solar2 ($2.1) ($0.8) ($1.3) $0.4 $
Slide 18: Solar SREC Generation
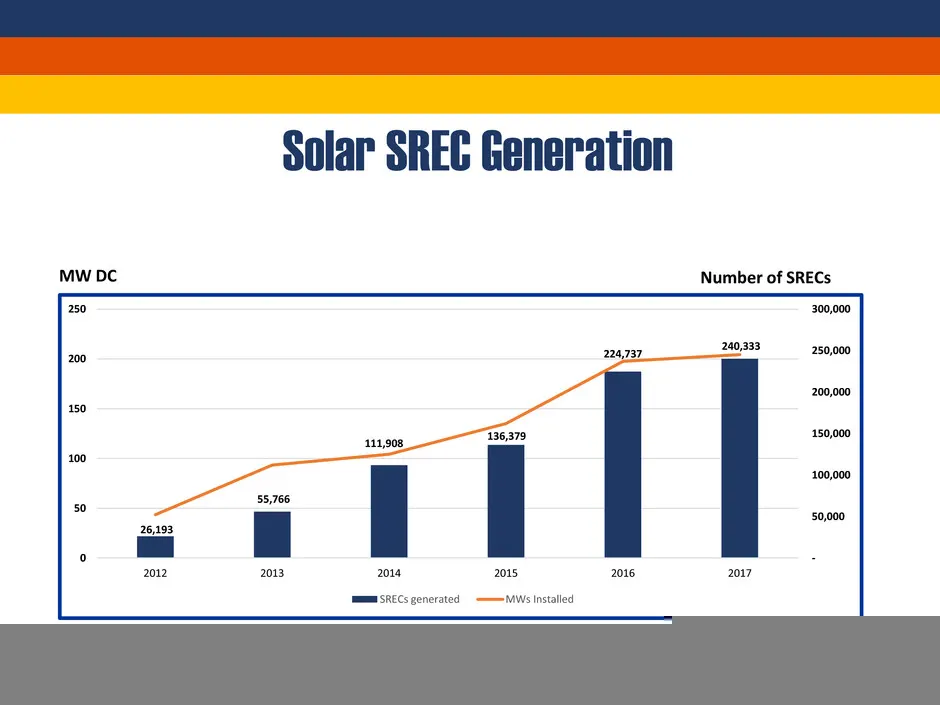
Solar SREC Generation MW DC Number of SRECs 26,193 55,766 111,908 136,379 224,737 240,333 - 50,000 100,000 150,000 200,000 250,000 300,000 0 50 100 150 200 250 2012 2013 2014 2015 2016 2017 SRECs generated MWs Installed 18

Slide 19: Appendix
Appendix
Slide 20: GAAP Earnings – 2017 v 2016
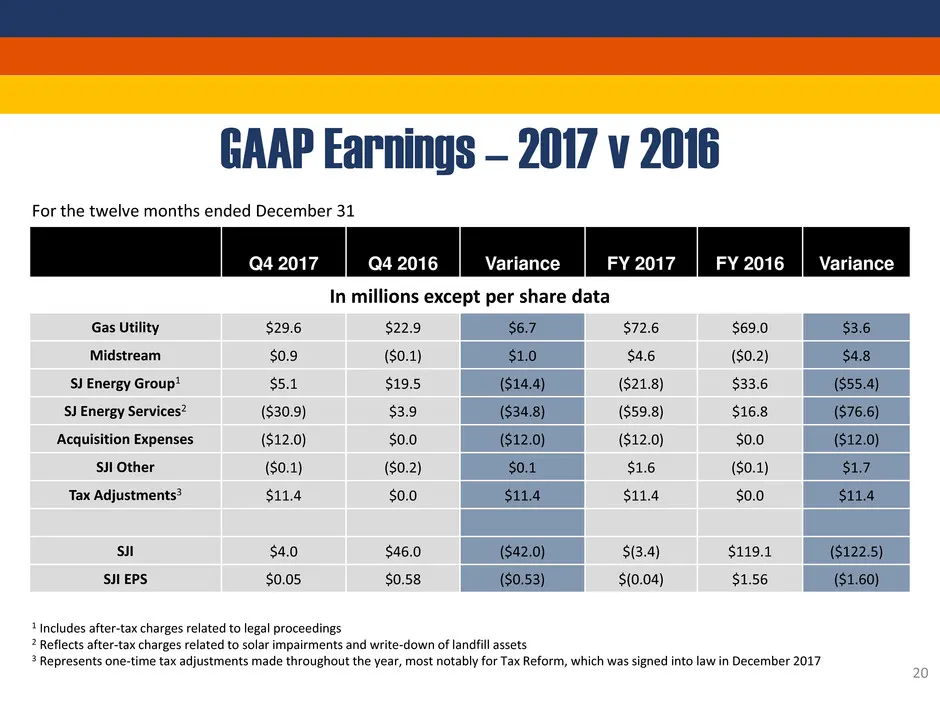
GAAP Earnings – 2017 v 2016 For the twelve months ended December 31 Q4 2017 Q4 2016 Variance FY 2017 FY 2016 Variance In millions except per share data Gas Utility $29.6 $22.9 $6.7 $72.6 $69.0 $3.6 Midstream $0.9 ($0.1) $1.0 $4.6 ($0.2) $4.8 SJ Energy Group1 $5.1 $19.5 ($14.4) ($21.8) $33.6 ($55.4)
Slide 21: South Jersey Energy Group GAAP Earnings – 2017 v 2016
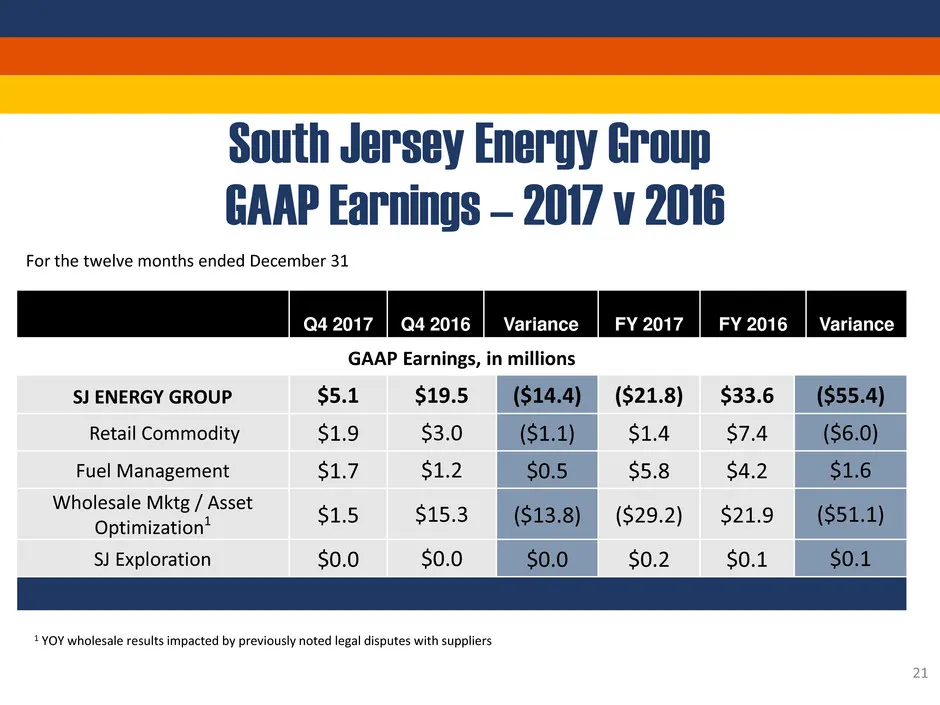
South Jersey Energy Group GAAP Earnings – 2017 v 2016 For the twelve months ended December 31 Q4 2017 Q4 2016 Variance FY 2017 FY 2016 Variance GAAP Earnings, in millions SJ ENERGY GROUP $5.1 $19.5 ($14.4) ($21.8) $33.6 ($55.4) Retail Commodity $1.9 $3.0 ($1.1) $1.4 $7.4 ($6.0) Fuel Management $1.7
Slide 22: South Jersey Energy Services GAAP Earnings – 2017 v 2016
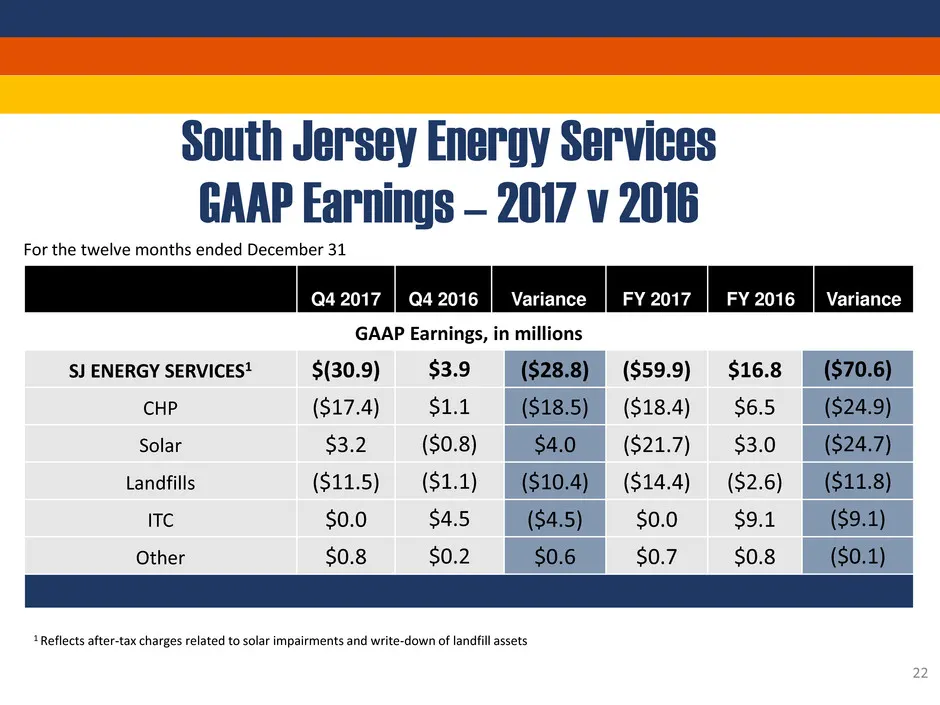
South Jersey Energy Services GAAP Earnings – 2017 v 2016 For the twelve months ended December 31 Q4 2017 Q4 2016 Variance FY 2017 FY 2016 Variance GAAP Earnings, in millions SJ ENERGY SERVICES1 $(30.9) $3.9 ($28.8) ($59.9) $16.8 ($70.6) CHP ($17.4) $1.1 ($18.5) ($18.4) $6.5 ($24.9) Solar $3.2 ($0.8)
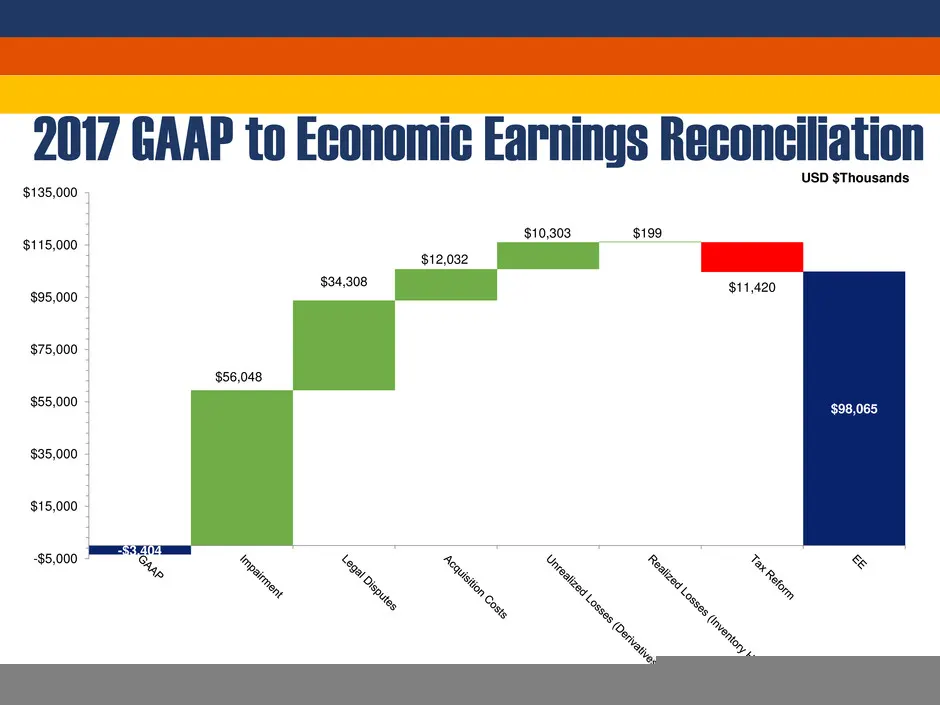
Slide 23: 2017 GAAP to Economic Earnings Reconciliation
2017 GAAP to Economic Earnings Reconciliation -$3,404 $98,065 $56,048 $34,308 $12,032 $10,303 $199 $11,420 -$5,000 $15,000 $35,000 $55,000 $75,000 $95,000 $115,000 $135,000 USD $Thousands 23
Source: SEC EDGAR · 8-K filed Feb 27, 2018
More decks from South Jersey Industries Inc
 FY2021 Earnings Presentation29 slides · Feb 24, 2022
 Q3 2021 Earnings Presentation31 slides · Nov 3, 2021
 Q2 2021 Earnings Presentation31 slides · Aug 4, 2021
 Investor Day (May 2021)88 slides · May 6, 2021
 FY2020 Earnings Presentation31 slides · Feb 24, 2021
 Q3 2020 Earnings Presentation37 slides · Nov 4, 2020