Del Monte Foods — Deutsche Bank Securities Global High Yield Conference 2002
39 slides from Del Monte Foods's conference presentation, Sep 26, 2002
Slide 1: Del Monte Foods Company
Del Monte Quality Del Monte Foods Company Deutsche Bank Securities Global High Yield Conference September 26, 2002
Slide 2: Forward-looking Statement Disclaimer
Forward-looking Statement Disclaimer During the course of our discussion today, we will make statements that constitute projections, expectations, beliefs or similar forward-looking statements. We would like to caution you that the Company’s actual results could differ materially from the results an
Slide 3: Management Representatives
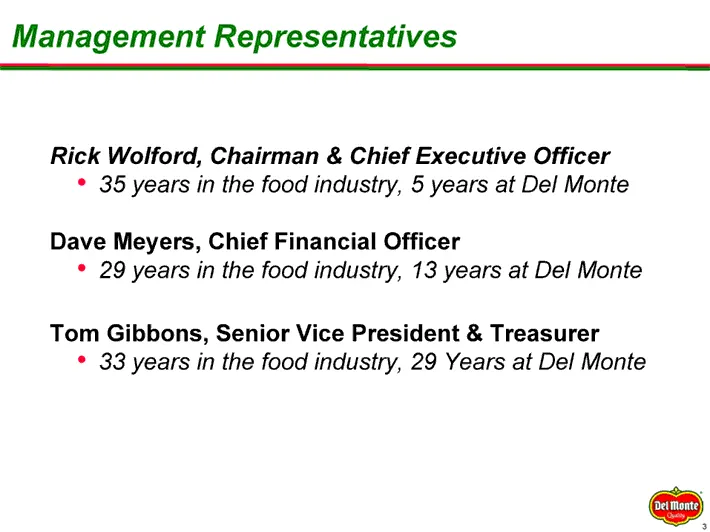
Management Representatives Rick Wolford, Chairman & Chief Executive Officer *° 35 years in the food industry, 5 years at Del Monte Dave Meyers, Chief Financial Officer * 29 years in the food industry, 13 years at Del Monte Tom Gibbons, Senior Vice President & Treasurer * 33 years in the food industr

Slide 4: Company Overview
Del Monte Quality Company Overview
Slide 5: Del Monte Overview
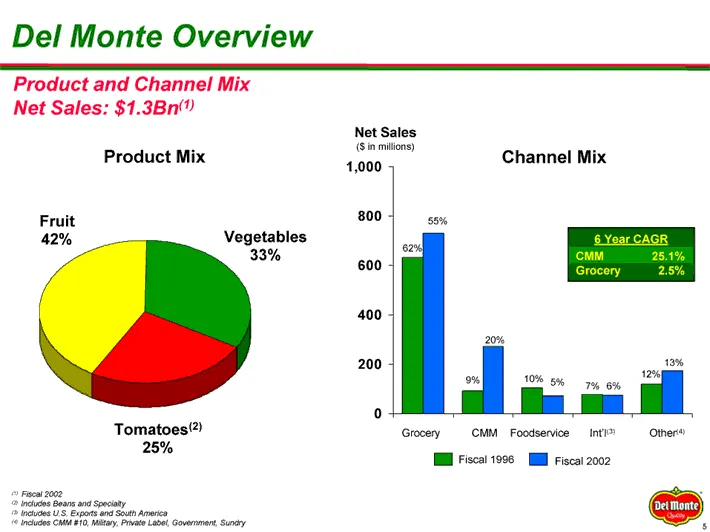
Del Monte Overview Product and Channel Mix Net Sales: $1.3Bn Net Sales : (Sin milions) . Product Mix 4,000 Channel Mix Fruit 800 55% 42% Vegetables wo 33% 600 400 Tomatoes?) Grocery CMM Foodservice nti Other 25% I Fiscal 1996 [| Fiscal 2002
Slide 6: Branded Leader
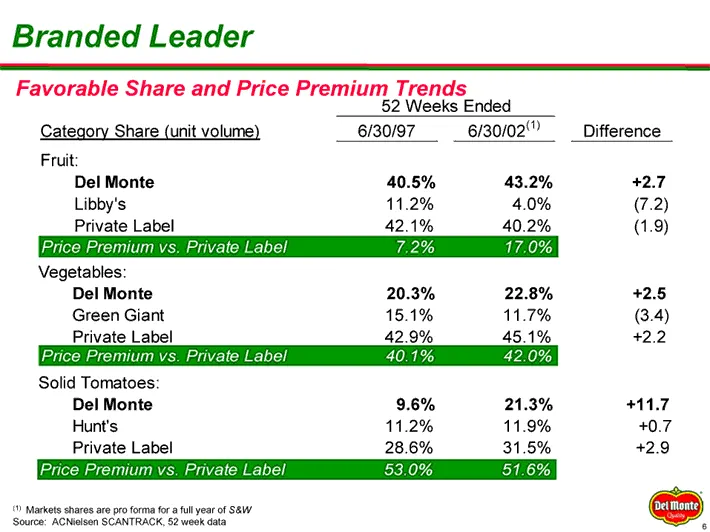
Branded Leader Favorable Share and Price Premium Trends 52 Weeks Ended Category Share (unit volume) 6/30/97 6/30/02" __Difference Fruit: Del Monte 40.5% 43.2% 42.7 Libby's 11.2% 4.0% (7.2) Private Label 42.1% 40.2% (1.9) Vegetables: Del Monte 20.3% 22.8% 42.5 Green Giant 15.1% 11.7% (3.4) Private La
Slide 7: Strong Retailer Relationships
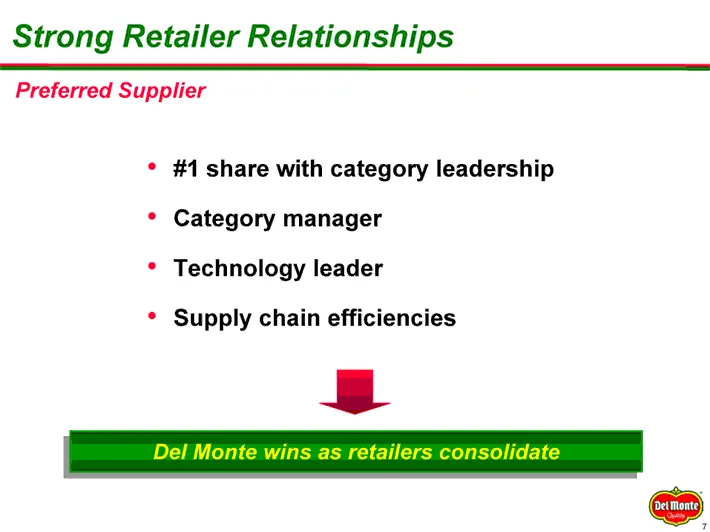
Strong Retailer Relationships Preferred Supplier ° #1 share with category leadership * Category manager * Technology leader ° Supply chain efficiencies Ss —ZZ=_z @S
Slide 8: Strong Retailer Relationships
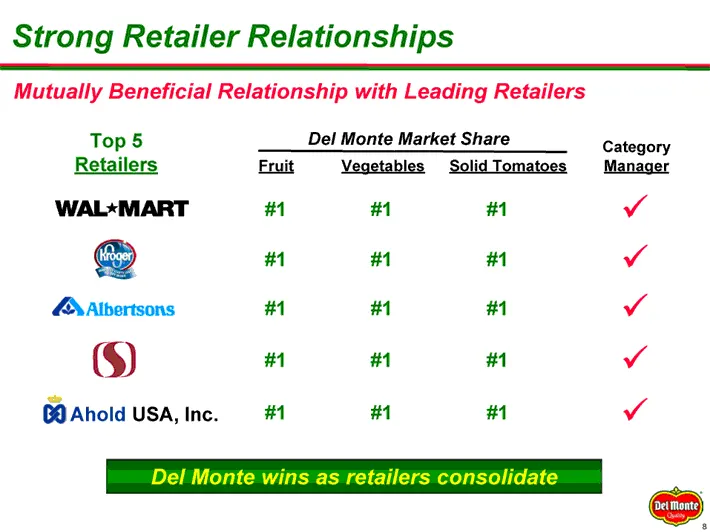
Strong Retailer Relationships Mutually Beneficial Relationship with Leading Retailers Top 5 Del Monte Market Share Category Retailers Eruit Vegetables Solid Tomatoes WAL*MART #1 #1 #1 v © a fal ca) v @\Albertsons #1 #1 #1 v 69) “1 ta “1 v = G@Ahold USA, Inc. #1 1 1 v
Slide 9: New Product Innovation
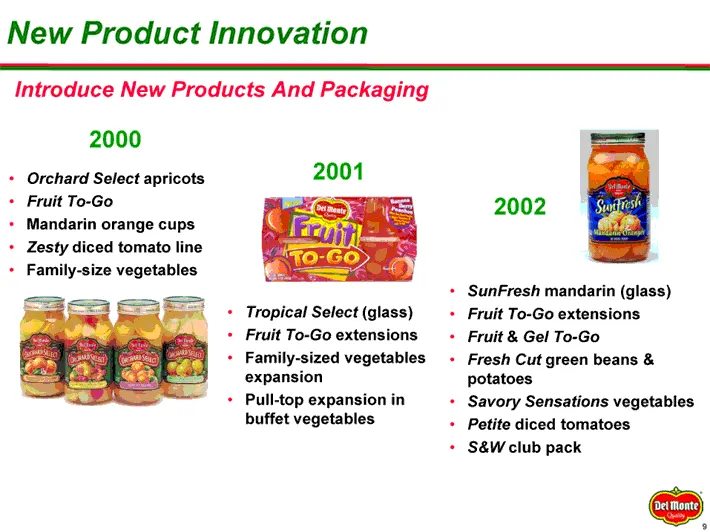
New Product Innovation Introduce New Products And Packaging 2000 Orchard Select apricots Fruit To-Go Mandarin orange cups Zesty diced tomato line Family-size vegetables 2001 Tropical Select (glass) Fruit To-Go extensions Family-sized vegetables expansion Pull-top expansion in buffet vegetables 2002
Slide 10: Going Forward
Del Monte Quality Going Forward
Slide 11: Grow Strategic Core Business
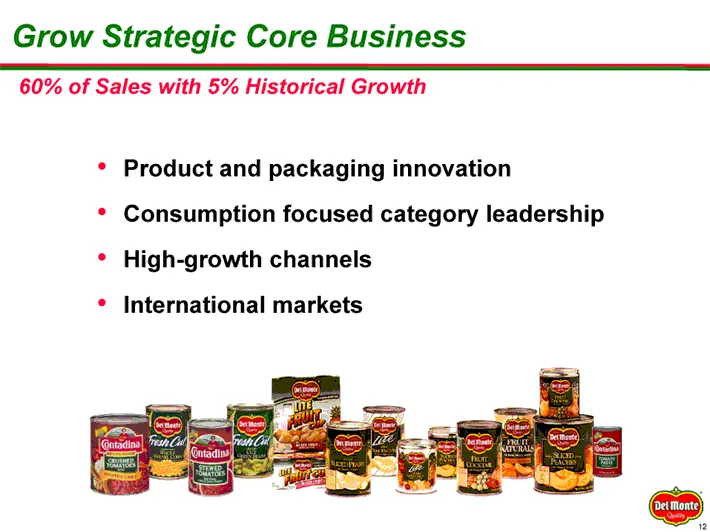
Grow Strategic Core Business 60% of Sales with 5% Historical Growth ° Product and packaging innovation * Consumption focused category leadership ° High-growth channels * International markets
Slide 12: Grow Top Line Through Innovation
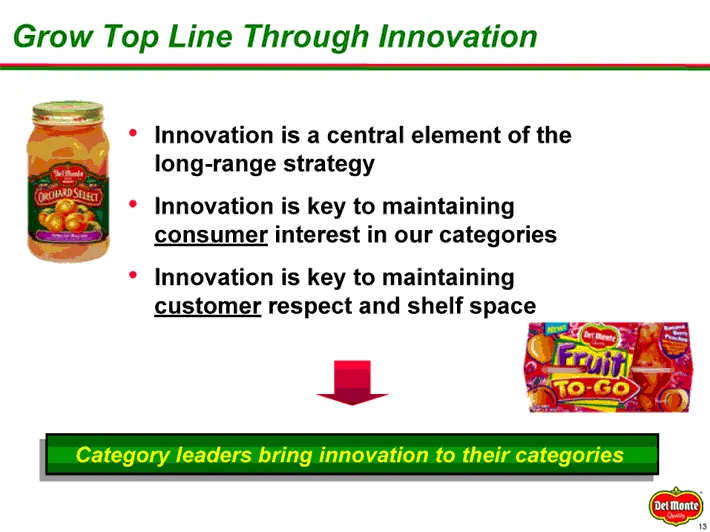
Grow Top Line Through Innovation — * Innovation is a central element of the long-range strategy * Innovation is key to maintaining consumer interest in our categories * Innovation is key to maintaining customer respect and shelf space
Slide 13: Focus on Costs
Focus on Costs Contain Growth in Costs ° Full utilization of plant capacity ° Streamline operating costs * Capture cost savings targets * Selective Cap Ex spending
Slide 14: Capability Improvement Program
Capability Improvement Program Structure and Systems Changes ° Upgrade the organization’s analytical skills ° Leverage the experience of Accenture * Total cost of $36 million * Substantial forecasting and planning benefits
Slide 15: Focused Acquisitions
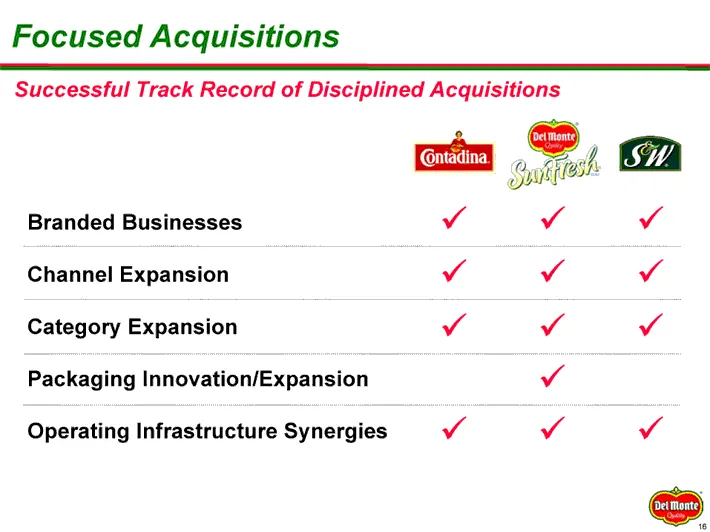
Focused Acquisitions Successful Track Record of Disciplined Acquisitions S, Supe G4 Branded Businesses v v v Channel Expansion v v v Category Expansion v v v Packaging Innovation/Expansion v Operating Infrastructure Synergies v v v
Slide 16

Slide 17: Financial Review
Del Monte Quality Financial Review
Slide 18: Del Monte Fiscal 2002 Results
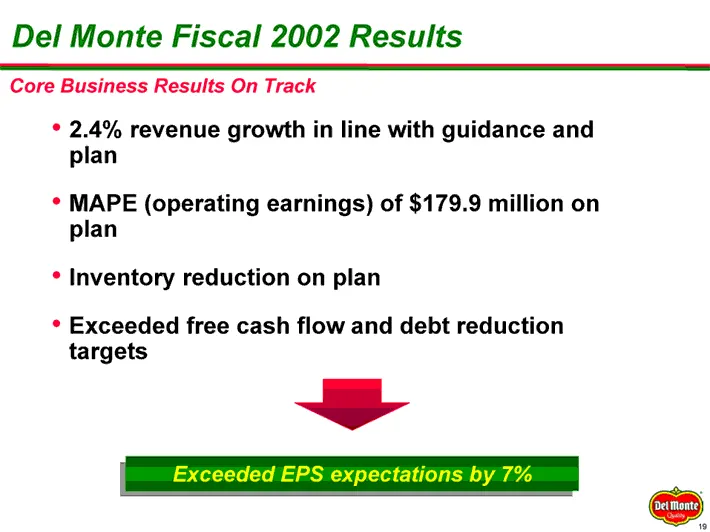
Del Monte Fiscal 2002 Results Core Business Results On Track * 2.4% revenue growth in line with guidance and plan ° MAPE (operating earnings) of $179.9 million on plan * Inventory reduction on plan ° Exceeded free cash flow and debt reduction targets —— @S
Slide 19: Summary of Earnings
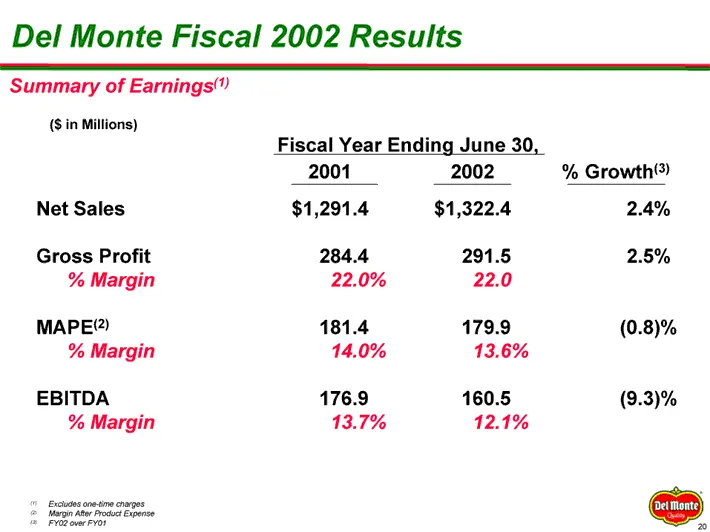
Del Monte Fiscal 2002 Results Summary of Earnings” ($ in Millions) Fiscal Year Ending June 30, 2001 2002 % Growth’) Net Sales $1,291.4 $1,322.4 2.4% Gross Profit 284.4 291.5 2.5% % Margin 22.0% 22.0 MAPE?) 181.4 179.9 (0.8)% % Margin 14.0% 13.6% EBITDA 176.9 160.5 (9.3)% % Margin 13.7% 12.1% css ce
Slide 20: Cash Flow Summary
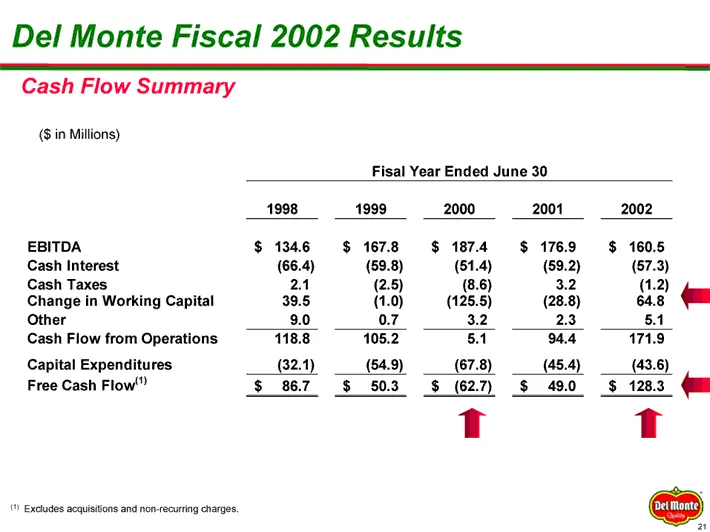
Del Monte Fiscal 2002 Results Cash Flow Summary (Sin Millions) Fisal Year Ended June 30 1998 1999 2000 2001 2002 EBITDA $ 1346 $ 1678 $ 1874 $ 176.9 §$ 160.5 Cash Interest (66.4) (59.8) (51.4) (59.2) (87.3) Cash Taxes 2A (2.5) (8.6) 3.2 (1.2) Change in Working Capital 39.8 (40) (125.5) (28.8) 64.8 O
Slide 21: Debt Structure
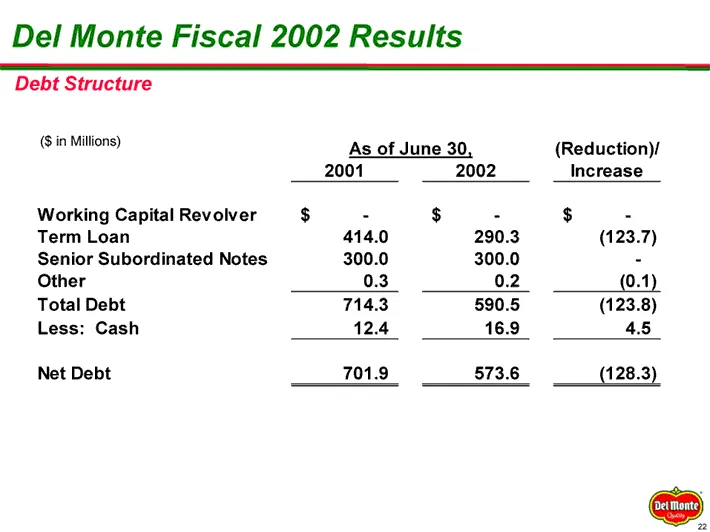
Del Monte Fiscal 2002 Results Debt Structure (Sin Millions) As of June 30. (Reduction)! 2001 2002 Increase Working Capital Revolver $ : $ - $ - Term Loan 414.0 290.3 (123.7) Senior Subordinated Notes 300.0 300.0 : Other 0.3 0.2 (0.1) Total Debt 714.3 590.5 (123.8) Less: Cash 12.4 16.9 45 Net Debt 70
Slide 22: Credit Statistics
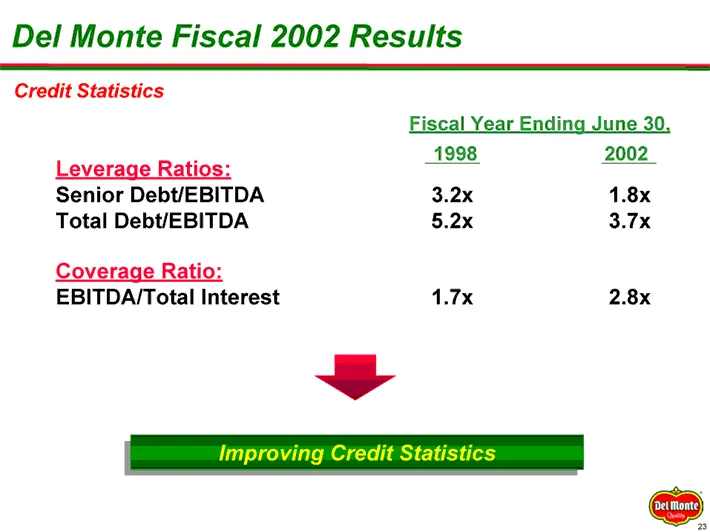
Del Monte Fiscal 2002 Results Credit Statistics Fiscal Year Ending June 30. 1 2002 Leverage Ratios: $98 00 Senior Debt/EBITDA 3.2x 1.8x Total Debt/EBITDA 5.2x 3.7x Coverage Ratio: EBITDA/Total Interest 1.7x 2.8x a @S
Slide 23: The New Del Monte
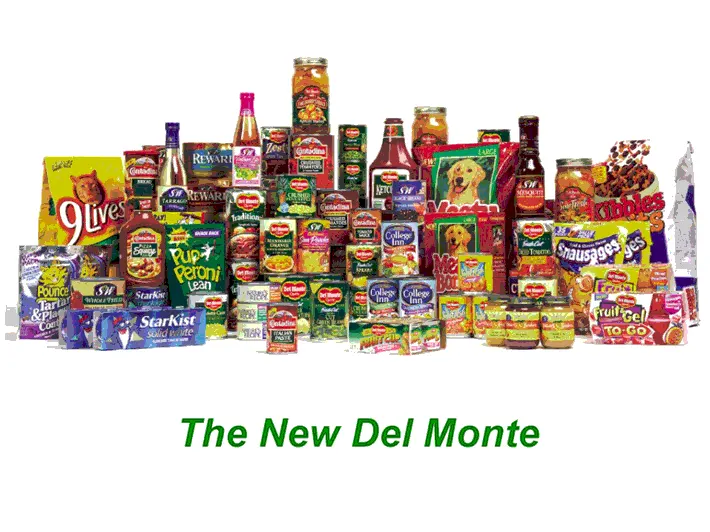
The New Del Monte
Slide 24: Transaction Overview
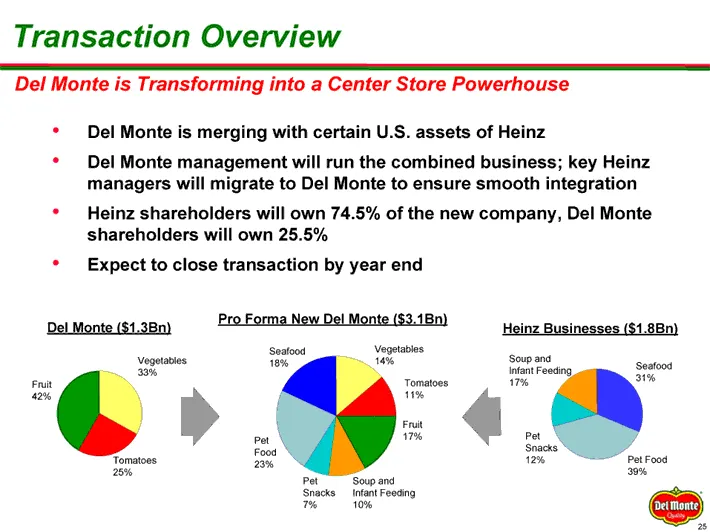
Transaction Overview Del Monte is Transforming into a Center Store Powerhouse * Del Monte is merging with certain U.S. assets of Heinz * Del Monte management will run the combined business; key Heinz managers will migrate to Del Monte to ensure smooth integration * Heinz shareholders will own 74.5%
Slide 25: Strategic Rationale
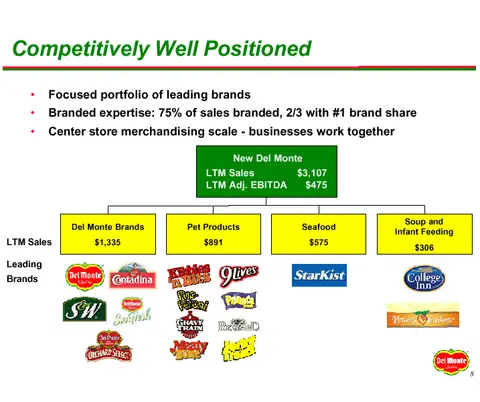
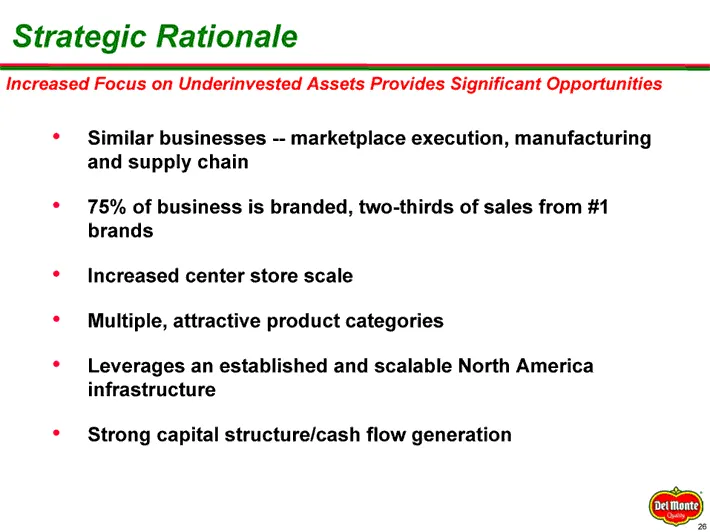
Strategic Rationale Increased Focus on Underinvested Assets Provides Significant Opportunities ° Similar businesses -- marketplace execution, manufacturing and supply chain * 75% of business is branded, two-thirds of sales from #1 brands * Increased center store scale * Multiple, attractive product
Slide 26: Diversified Product Base in Attractive Categories
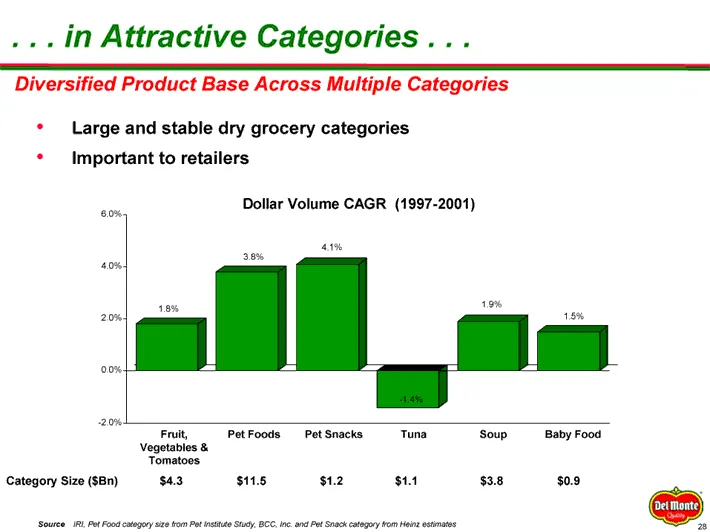
. in Attractive Categories Diversified Product Base Across Multiple Categories * Large and stable dry grocery categories * Important to retailers Dollar Volume CAGR (1997-2001) Fruit, PetFoods PatSnacks Tuna Soup Baby Food Vegetables & Tomatoes Category Size ($Bn) $4.3 sts $12 st $38 $0.9 ‘Seuree Pe
Slide 27: Results in a Premier Mid Cap Food Co
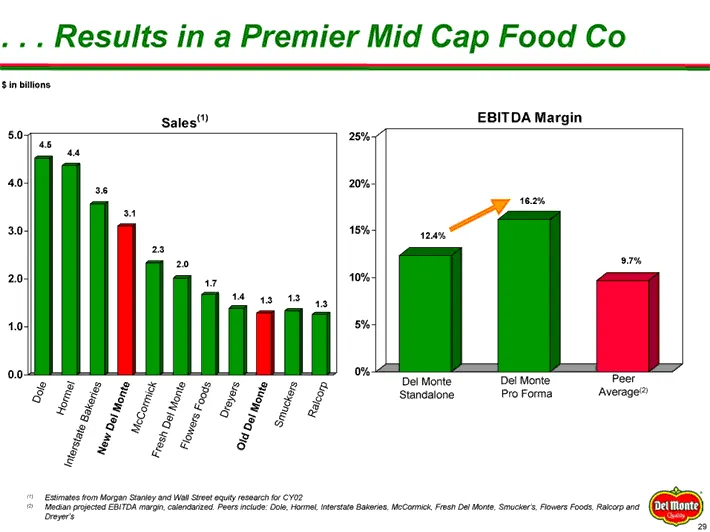
... Results in a Premier Mid Cap Food Co Sin bitlons Sales” EBITDA Margin 50: 40. 30. Del Monte Del Monte Standalone Pro Forma 1 Eximates tom Magan Sie nd Wa Set aut ena C02 lean preted ERIOA mar caendated Pees ace Coe, Meme ete Bones MeComeck Fen Del Mente. Smwckes. Rovers Foods. ROC ard Boyer
Slide 28: New Del Monte Strong Financial Foundation
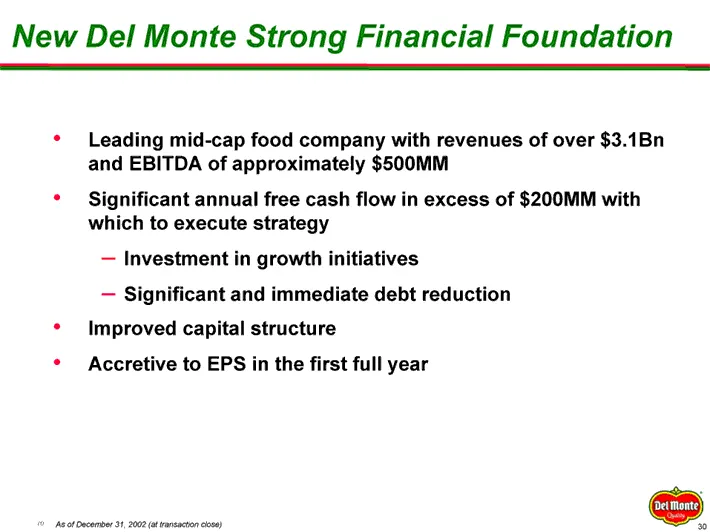
New Del Monte Strong Financial Foundation * Leading mid-cap food company with revenues of over $3.1Bn and EBITDA of approximately $500MM * Significant annual free cash flow in excess of $200MM with which to execute strategy — Investment in growth initiatives — Significant and immediate debt reductio
Slide 29: The New Del Monte
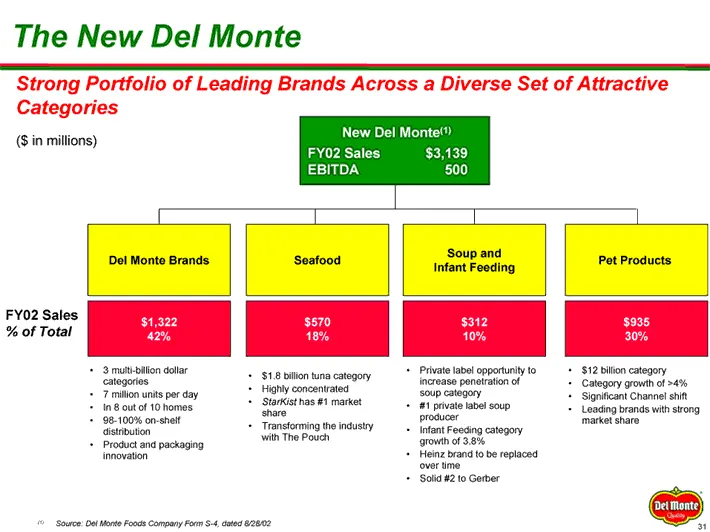
The New Del Monte Strong Portfolio of Leading Brands Across a Diverse Set of Attractive Categories New Del Monte’) (S in millions) FY02 Sales $3,139 EBITDA 500 Soup and rod Dol Monte Brands Seafood Infant Pewsing Pot Products FY02 Sales $1,322 $570 $312 % of Total 42% 18% 10% +3 mupton doar = $1.8 p
Slide 30: The New Del Monte
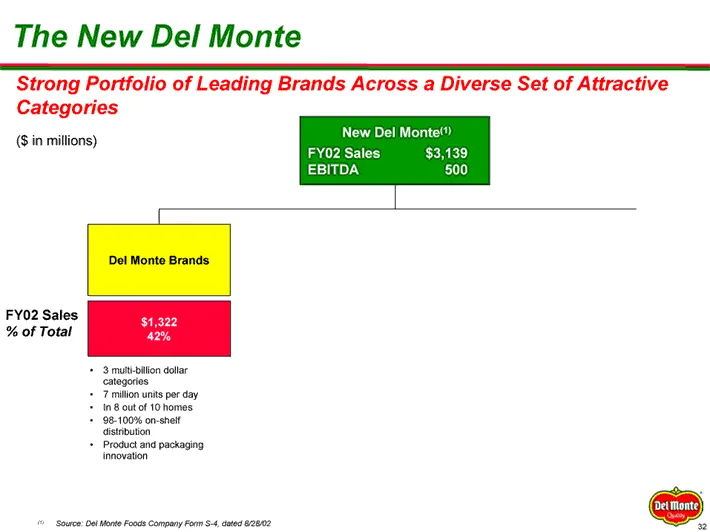
The New Del Monte Strong Portfolio of Leading Brands Across a Diverse Set of Attractive Categories (Sin millions) New Del Monte’) FY02 Sales $3,139 EBITDA 500 FY02 Sales % of Total + 3 muit-blon dollar catogorios + 7 millon units por day + in Boutol 10 homes + 98-100% on-sheit ‘istnbuten + Product a
Slide 31: The New Del Monte
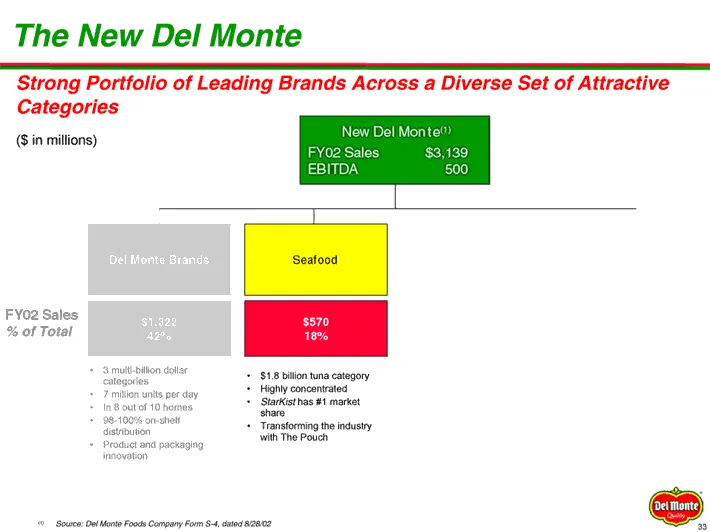
The New Del Monte Strong Portfolio of Leading Brands Across a Diverse Set of Attractive Categories (Sin millions) New Del Monte"! FYo2 1S $3,139 EBITDA 500 FY02 Sales % of Total + $1.8 bition tuna category + Highly concentrated + Starkisthas #1 market share er day + Transforming the industry with Th
Slide 32: Seafood Case Study: Tuna Pouch
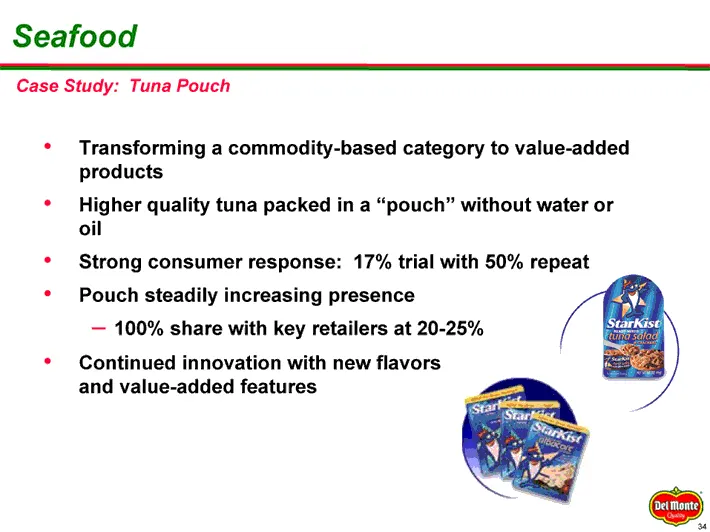
Seafood Case Study: Tuna Pouch * Transforming a commodity-based category to value-added products ° Higher quality tuna packed in a “pouch” without water or oil * Strong consumer response: 17% trial with 50% repeat ° Pouch steadily increasing presence — 100% share with key retailers at 20-25% * Conti
Slide 33: Inside the Store
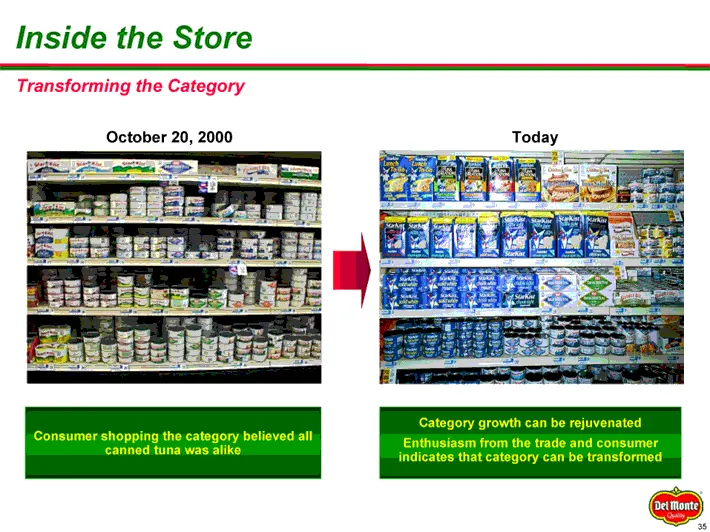
Inside the Store October 20, 2000 Category growth can be rejuvenated Enthusiasm from the trade and consumer indicates that category can be transformed Consumer shopping the category believed all canned tuna was alike
Slide 34: The New Del Monte
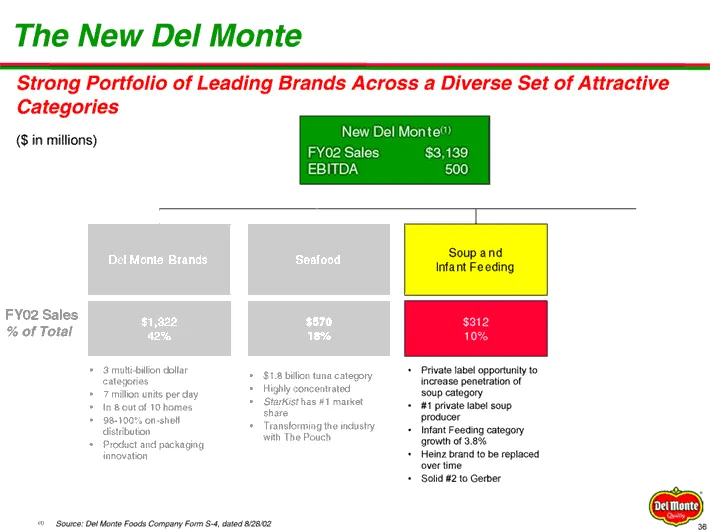
The New Del Monte Strong Portfolio of Leading Brands Across a Diverse Set of Attractive Categories (S in millions) New Del Monte" lad $3,139 EBITDA 500 FY02 Sales % of Total + $1.8 bition tuna category ring the industry wit The Pouch «© Souwce: Del Monte Foods Company Form §-4, dated 82802 + Privat
Slide 35: Challenges and Strategy
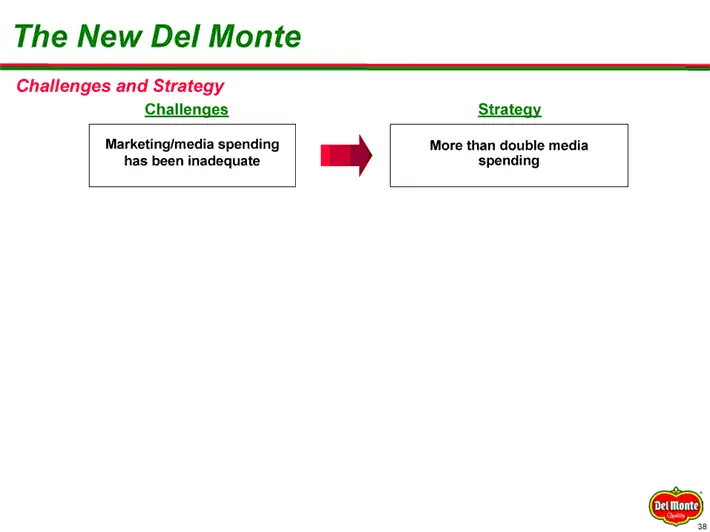
The New Del Monte Challenges and Strategy Challenges Strateay Marketing/media spending More than double media has been inadequate =" spending
Slide 36: Investment in Quality, Brands and Innovation
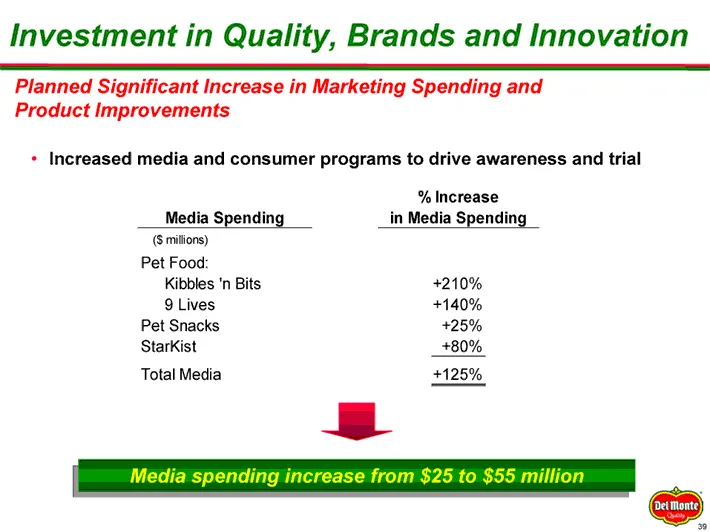
Investment in Quality, Brands and Innovation Planned Significant Increase in Marketing Spending and Product Improvements * Increased media and consumer programs to drive awareness and trial % Increase Media Spending in Media Spending _ (Gmilions) Pet Food: Kibbles 'n Bits +210% 9 Lives +140% Pet Sna
Slide 37: Challenges and Strategy
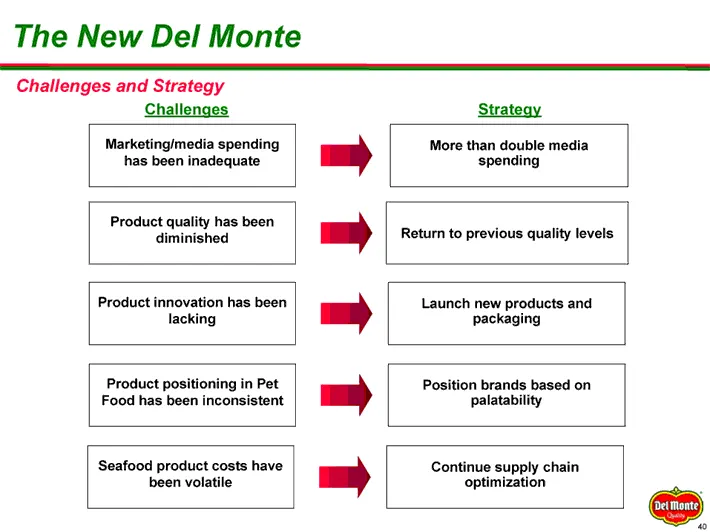
The New Del Monte Challenges and Strategy Challenges Strateay Marketing/media spending More than double media has been inadequate spending Product quality has been diminished Return to previous quality levels Product innovation has been lacking Launch new products and packaging Product positioning i
Slide 38: Execution
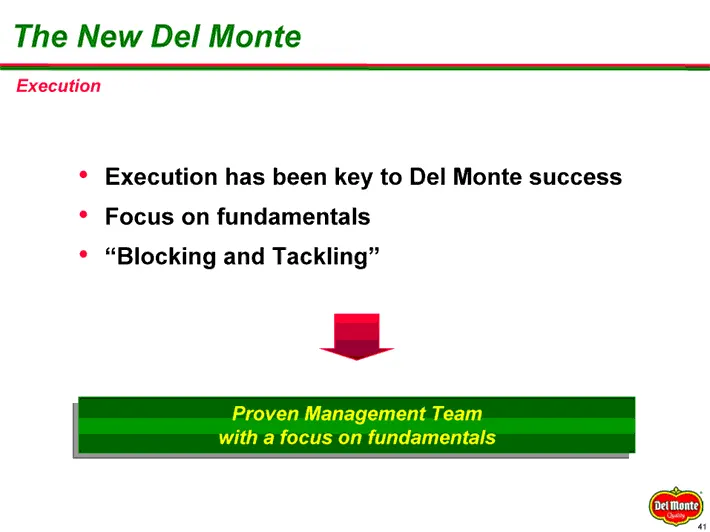
The New Del Monte Execution * Execution has been key to Del Monte success * Focus on fundamentals ° “Blocking and Tackling” J ———
Slide 39
Source: SEC EDGAR · 425 filed Sep 26, 2002