Diversicare Healthcare Services Inc
Diversicare Healthcare Services — JMP Securities Research Conference 2013
27 slides from Diversicare Healthcare Services's conference presentation, May 13, 2013

Slide 1: JMP Securities Research Conference
_ Xp IVERSICARE JMP Securities Research Conference May 13, 2013
Slide 2: Forward-Looking Statements
Forward-Looking Statements Forward-looking statements made in this presentation involve a number of risks and uncertainties, but not limited to, our ability to increase census at our renovated facilities, changes in governmental reimbursement, including the impact of the CMS final rule that has resu
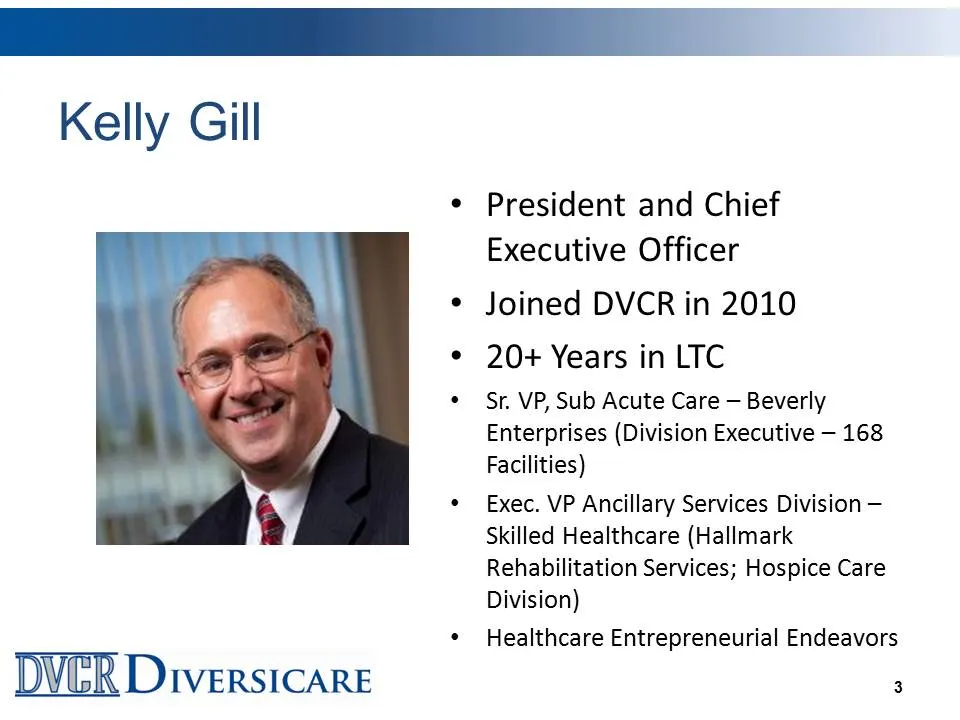
Slide 3: Kelly Gill, President and Chief Executive Officer
Kelly Gill DVER Diversicare President and Chief Executive Officer Joined DVCR in 2010 20+ Years in LTC Sr. VP, Sub Acute Care — Beverly Enterprises (Division Executive — 168 Facilities) Exec. VP Ancillary Services Division — Skilled Healthcare (Hallmark Rehabilitation Services; Hospice Care Division
Slide 4: Who Is Diversicare?
rl lll Who Is Diversicare? « Pure playskilled nursing facility operator * Formerly known as Advocat Inc. * Parent company name changed to conform to operating company naming and brandingin Q1 2013 * Ticker changed with Nasdaq from AVCAto DVCR * Redefined on our mission and core values * Our Mission
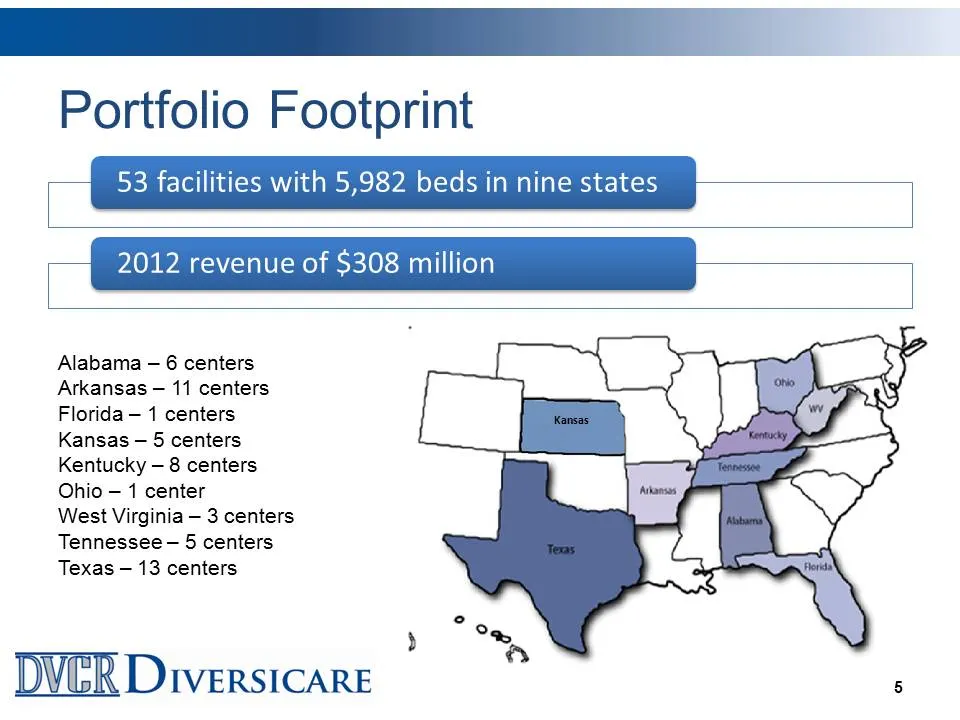
Slide 5: Portfolio Footprint: facilities with 5,982 beds in nine states
ES Portfolio Footprint 53 facilities with 5,982 beds in nine states 2012 revenue of $308 million Alabama — 6 centers Arkansas — 11 centers Florida — 1 centers Kansas — 5 centers Kentucky — 8 centers Ohio — 1 center West Virginia — 3 centers Tennessee — 5 centers Texas — 13 centers DVER Diversicare :
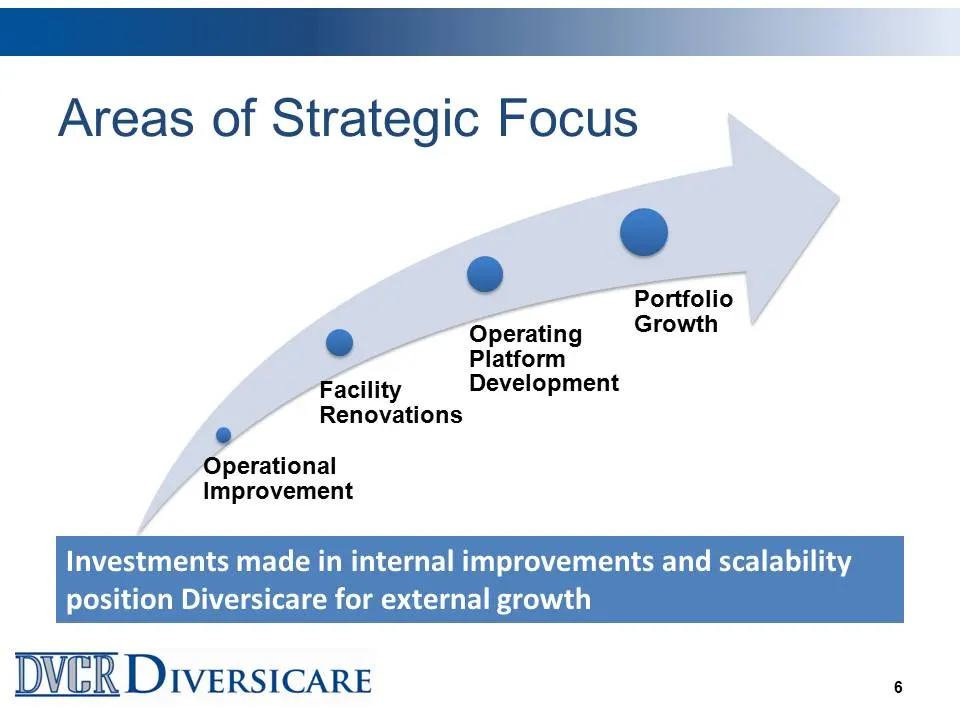
Slide 6: Areas of Strategic Focus
Areas of Strategic Focus ] v y Portfolio Growth =) Operating Platform ‘acility Development Renovations perational | 4 Improvement f Investments made in internal improvements and scalability position Diversicare for external growth DVER Diversicare :
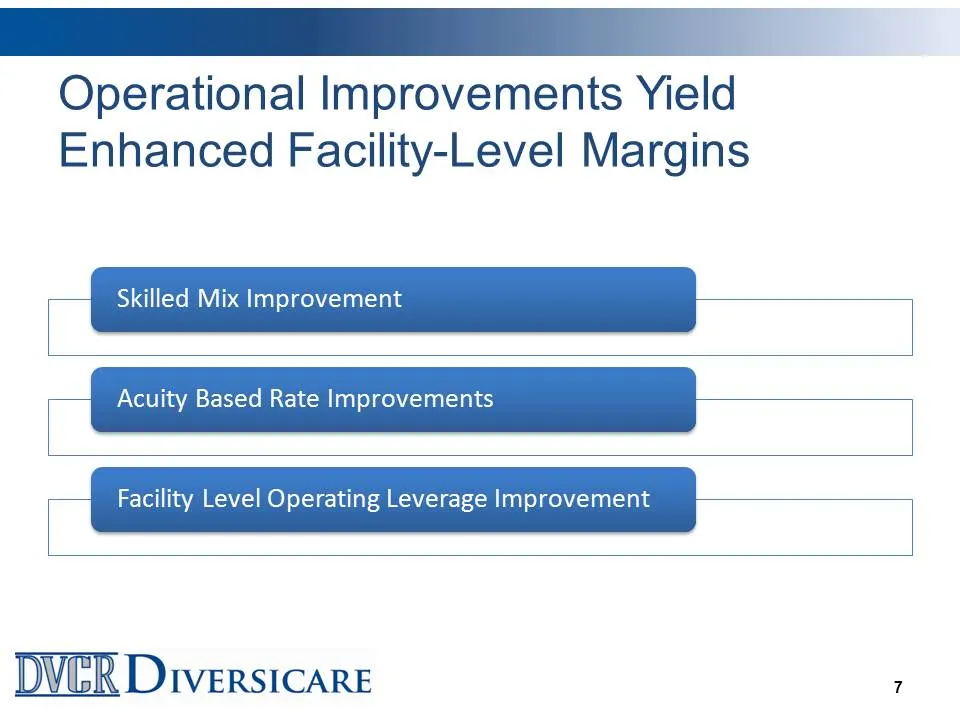
Slide 7: Operational Improvements Yield Enhanced Facility-Level Margins
Operational Improvements Yield Enhanced Facility-Level Margins Skilled Mix Improvement Acuity Based Rate Improvements Facility Level Operating Leverage Improvement DVER Diversicare ,
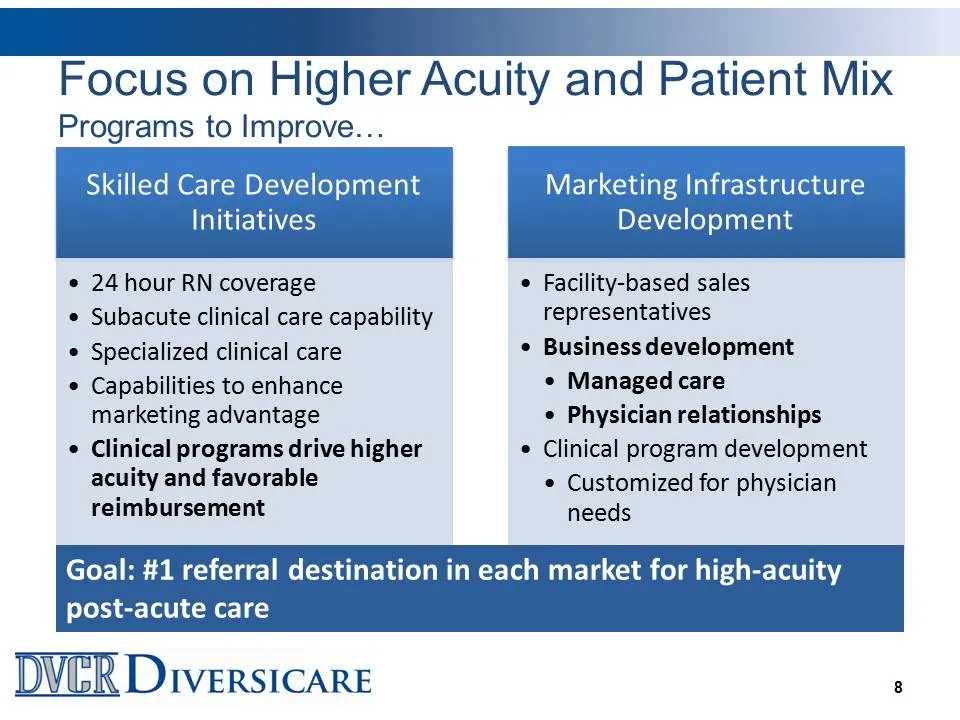
Slide 8: Focus on Higher Acuity and Patient Mix
LULU eee Focus on Higher Acuity and Patient Mix Programs to Improve... Development Initiatives , « 24 hour RN coverage * Facility-based sales ¢ Subacute clinical care capability representatives * Specialized clinical care Business development * Capabilities to enhance ¢ Managed care marketing advant
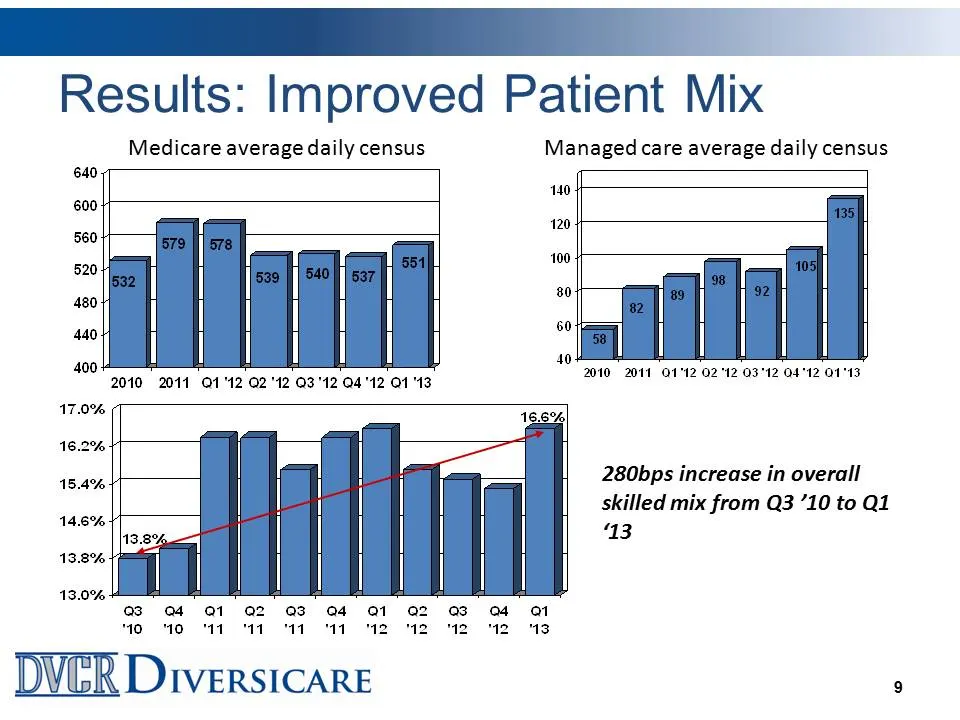
Slide 9: Results: Improved Patient Mix
lla Results: Improved Patient Mix Medicare average daily census Managed care average daily census 2010 2011 0142 0242 0312 0442 0113 140 120 100 80 17.0% 16.2% 15.4% 146% 138% 13.0% 03 O4 Q1 Q2 O83 O4 Q1 O2 O83 O4 a 40 40 1 11 414 4412912421248. DVER Diversicare 92 a 89 2010 2011 0112 0212 03°12 041
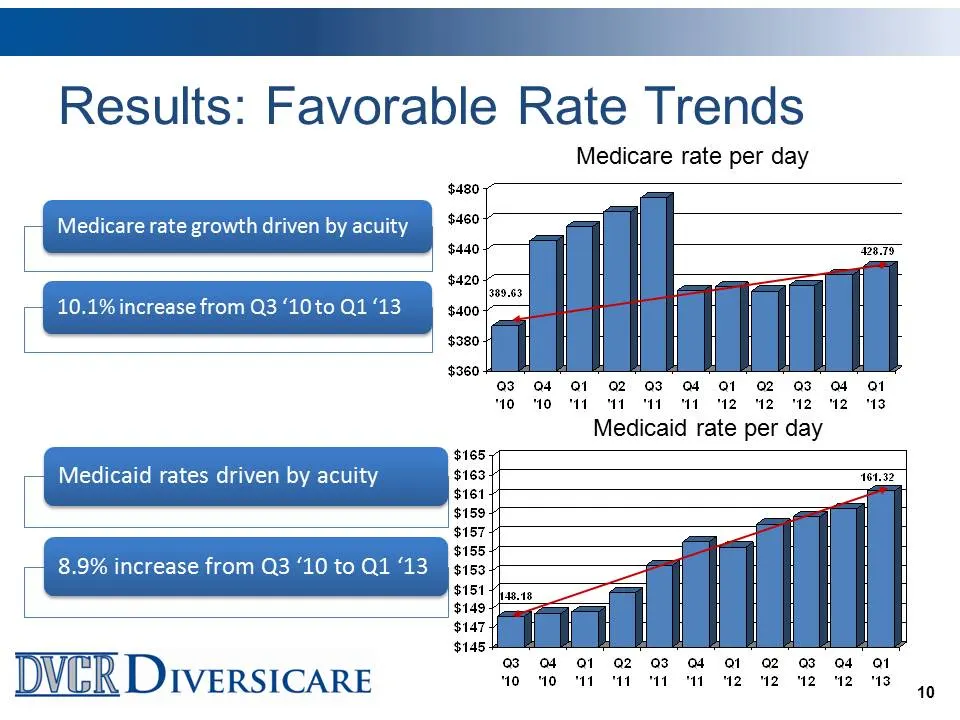
Slide 10: Results: Favorable Rate Trends
Results: Favorable Rate Trends $480 $460 $440 Medicare rate per day ETD . $420 $400 $380 $360 [389.63 3 04 1 40 40 "11 02 03 O4 O1 02 O38 OF O1 WOM MT M2 42 42 42 13 Medicaid rate per day | Medicaid rates driven by acuity. .9% increase from Q3 ‘10 to Q1 ‘13. i i DVER Diversicare a1 43 02 03 O4 os a4
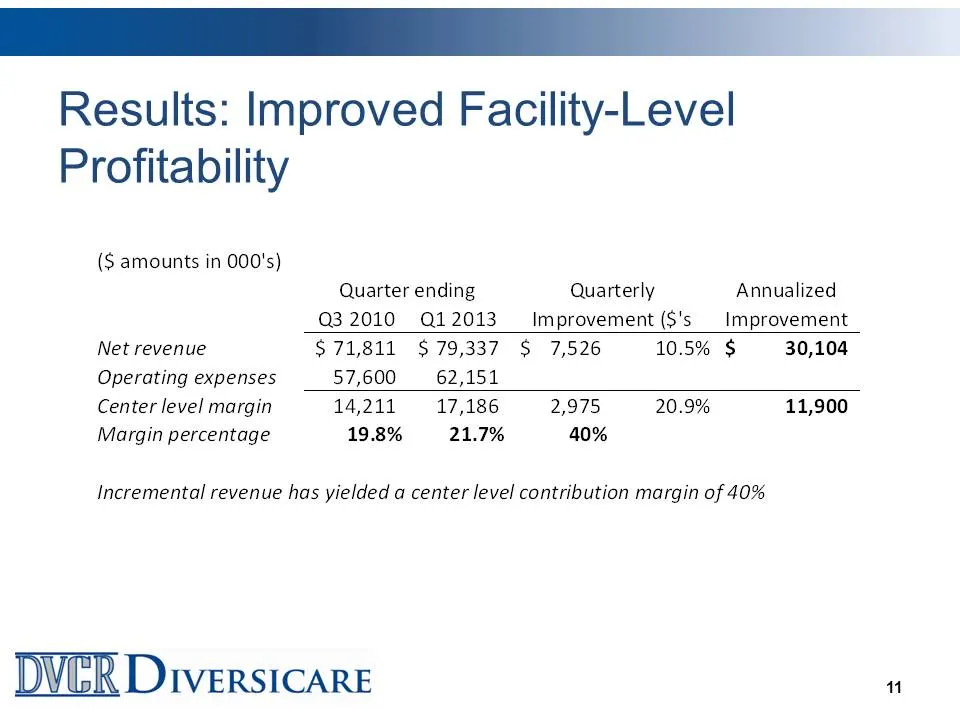
Slide 11: Results: Improved Facility-Level Profitability
Results: Improved Facility-Level Profitability ($ amounts in 000's) Quarter ending Quarterly Annualized Q3 2010 Q12013 Improvement (S's Improvement Net revenue $71,811 $79,337 $ 7,526 10.5% $ 30,104 Operating expenses 57,600 62,151 Center level margin 14,211 17,186 2,975 20.9% 11,900 Margin percenta
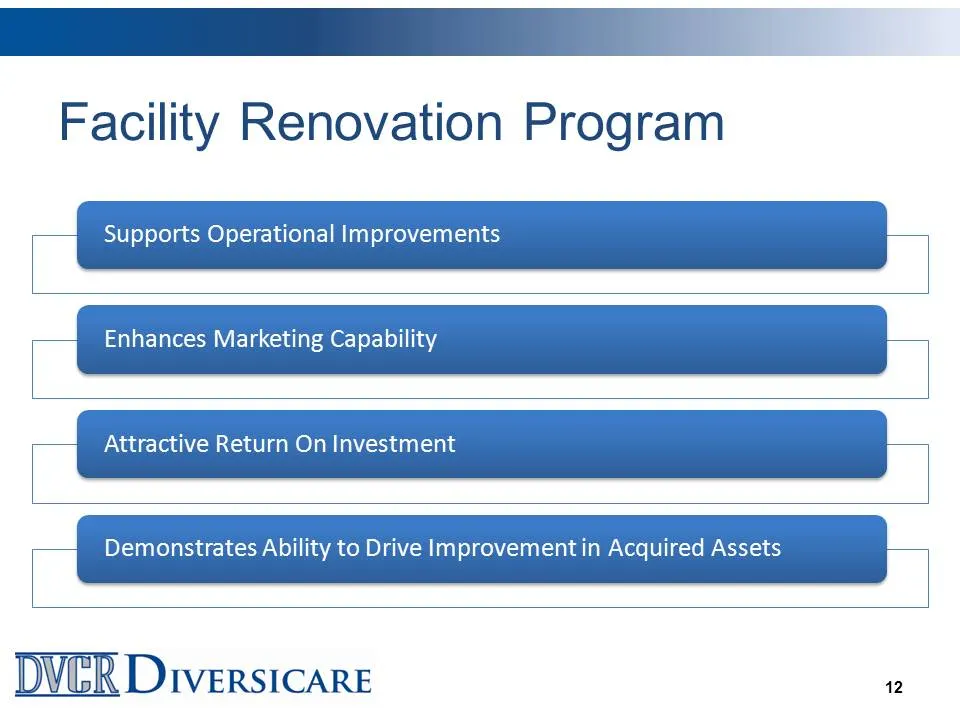
Slide 12: Facility Renovation Program
Facility Renovation Program Supports Operational Improvements Enhances Marketing Capability Attractive Return On Investment Demonstrates Ability to Drive Improvementin Acquired Assets DVER Diversicare 12
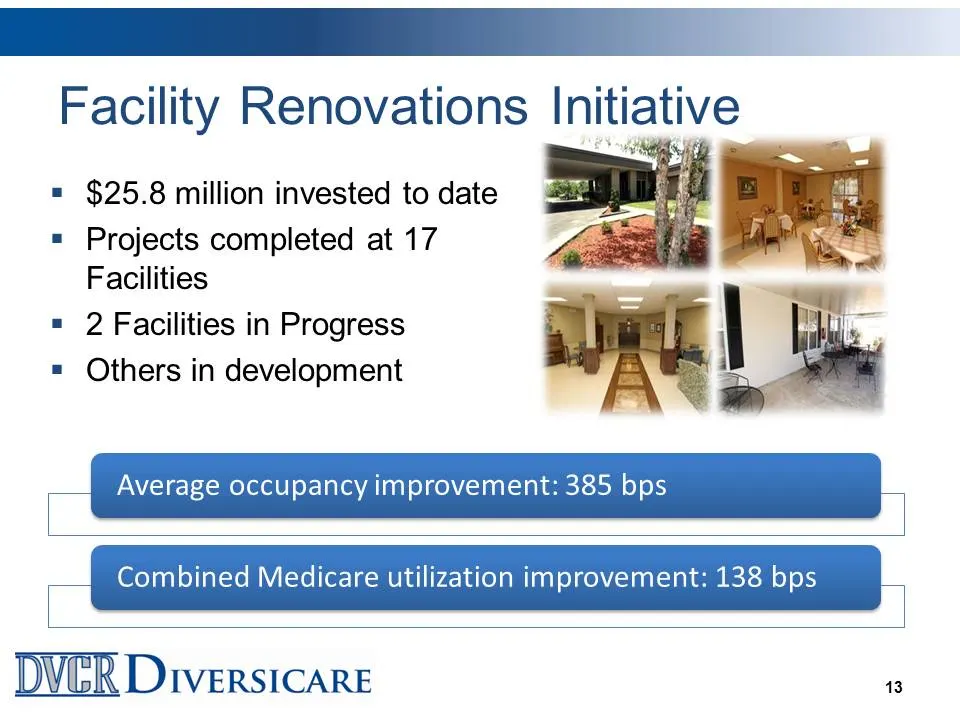
Slide 13: $25.8 million invested to date
= $25.8 million invested to date = Projects completed at 17 Facilities = 2 Facilities in Progress = Others in development DVER Diversicare 13
Slide 14: Operating Platform Development
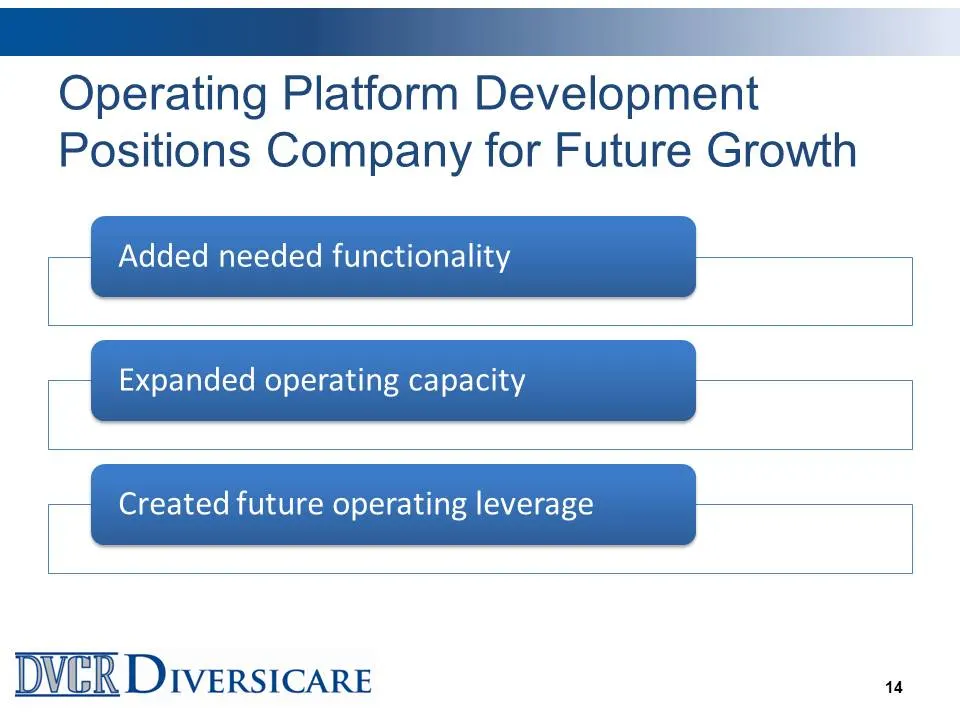
Operating Platform Development Positions Company for Future Growth Added needed functionality Expanded operating capacity Created future operating leverage ll DVER Diversicare 1
Slide 15: Expanded Operating Infrastructure
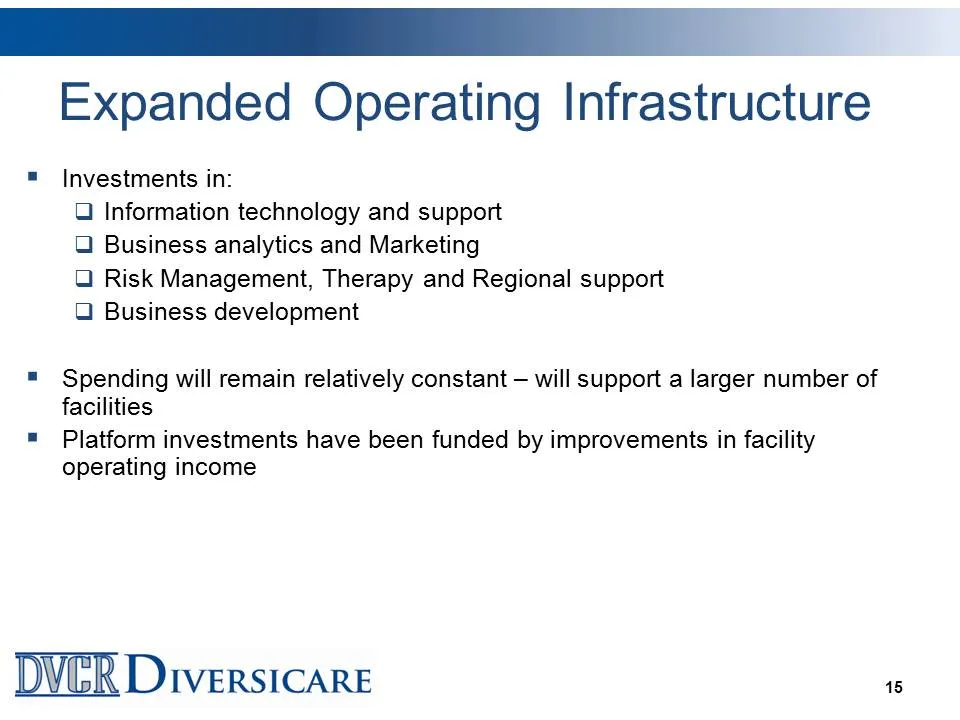
TT ee Expanded Operating Infrastructure = Investments in: Q Information technology and support U Business analytics and Marketing QO Risk Management, Therapy and Regional support Q Business development = Spending will remain relatively constant — will support a larger number of facilities = Platform
Slide 16: Portfolio Growth Is Now Primary Focus
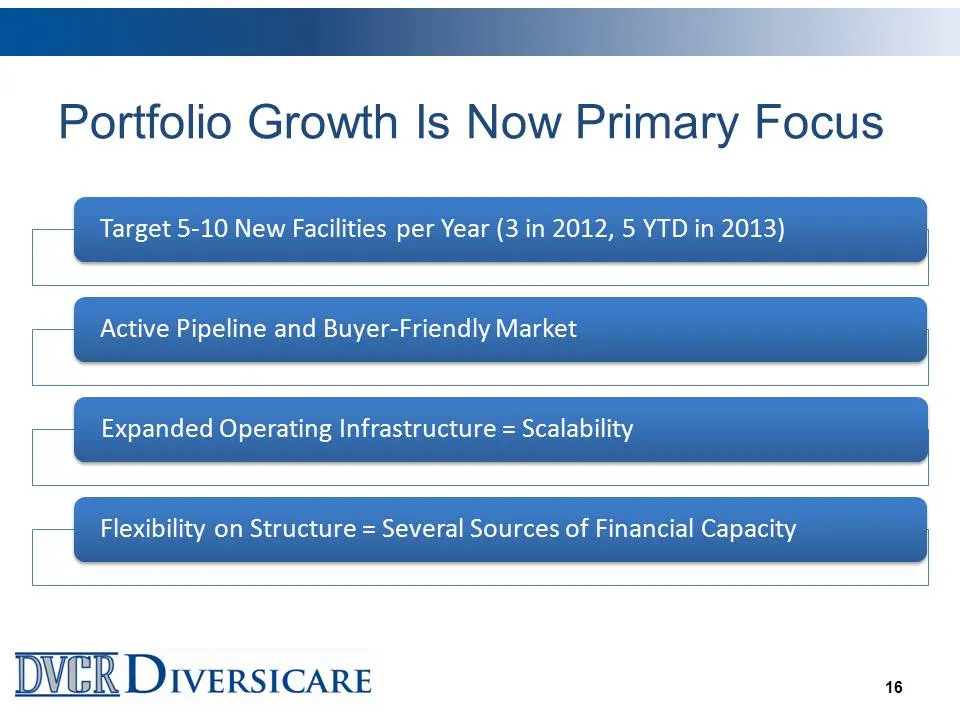
Portfolio Growth Is Now Primary Focus Target 5-10 New Facilities per Year (3 in 2012, 5 YTD in 2013) Active Pipeline and Buyer-Friendly Market Expanded Operating Infrastructure = Scalability Flexibility on Structure = Several Sources of Financial Capacity DVER Diversicare ‘s
Slide 17: Flexibility on Acquisition Structure Broadens Pipeline
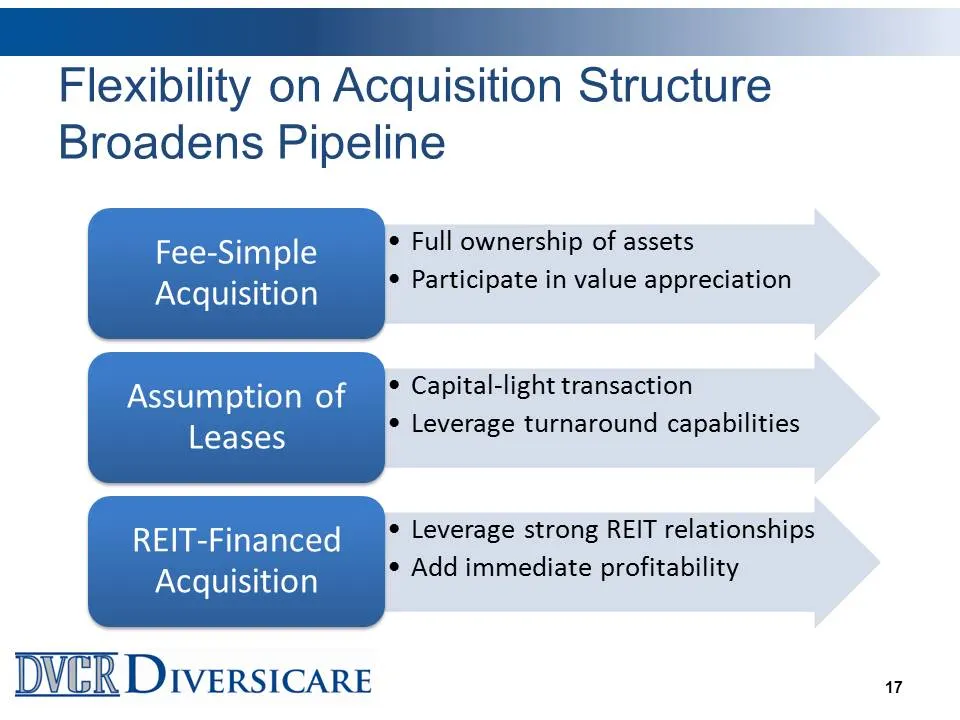
FETT DDO Flexibility on Acquisition Structur Broadens Pipeline Fee-Simple © Full ownership of assets Acquisition ° Participate in value appreciation Assumption of Capital-light transaction Leases ¢ Leverage turnaround capabilities ‘aie aiaelelece) 9° Leverage strong REIT relationships Acquisition ©
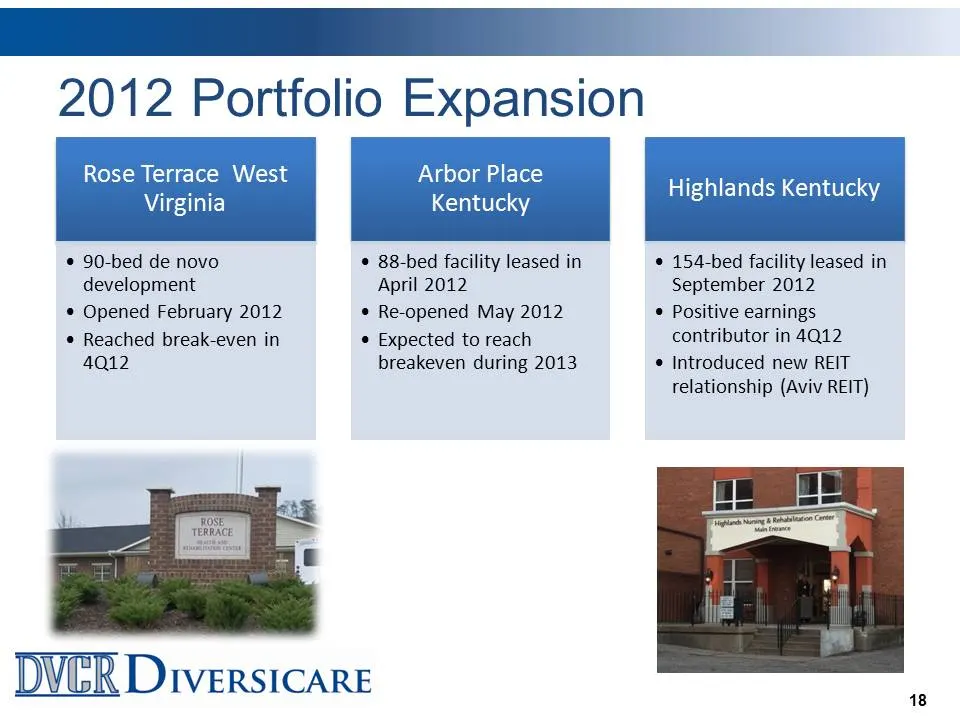
Slide 18: 2012 Portfolio Expansion
eee 2012 Portfolio Expansion * 90-bed de novo © 88-bed facility leased in * 154-bed facility leased in development April 2012 September 2012 ® Opened February 2012 * Re-opened May 2012 *® Positive earnings Reached break-even in Expected to reach contributor in 4Q12 4Q12 breakeven during 2013 © Intro
Slide 19: 2013 Acquisition of Kansas Portfolio
2013 Acquisition of Kansas Portfolio Five facilities adding ~$24 million of annual revenue Represents a new operating region and the opportunity to expand our footprint Favorable business climate Location allows for leverage of existing operations team with opportunity to expand Opportunity to impro
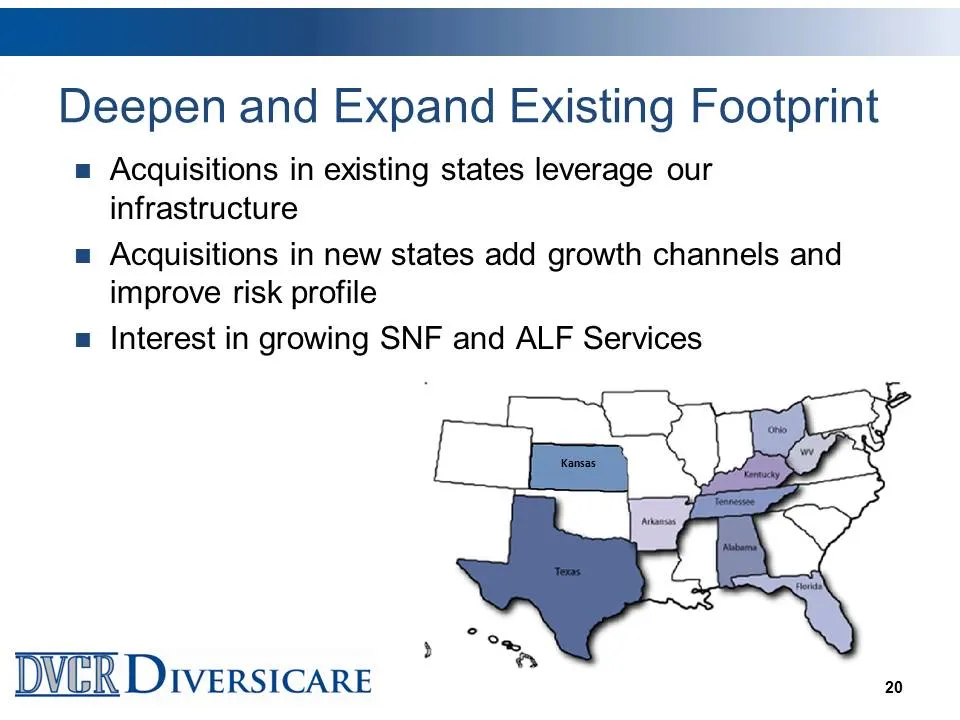
Slide 20: Deepen and Expand Existing Footprint
Tl Deepen and Expand Existing Footprint = Acquisitions in existing states leverage our infrastructure = Acquisitions in new states add growth channels and improve risk profile = Interest in growing SNF and ALF Services DVER DiversicarE
Slide 21: Financial and Operating Trends
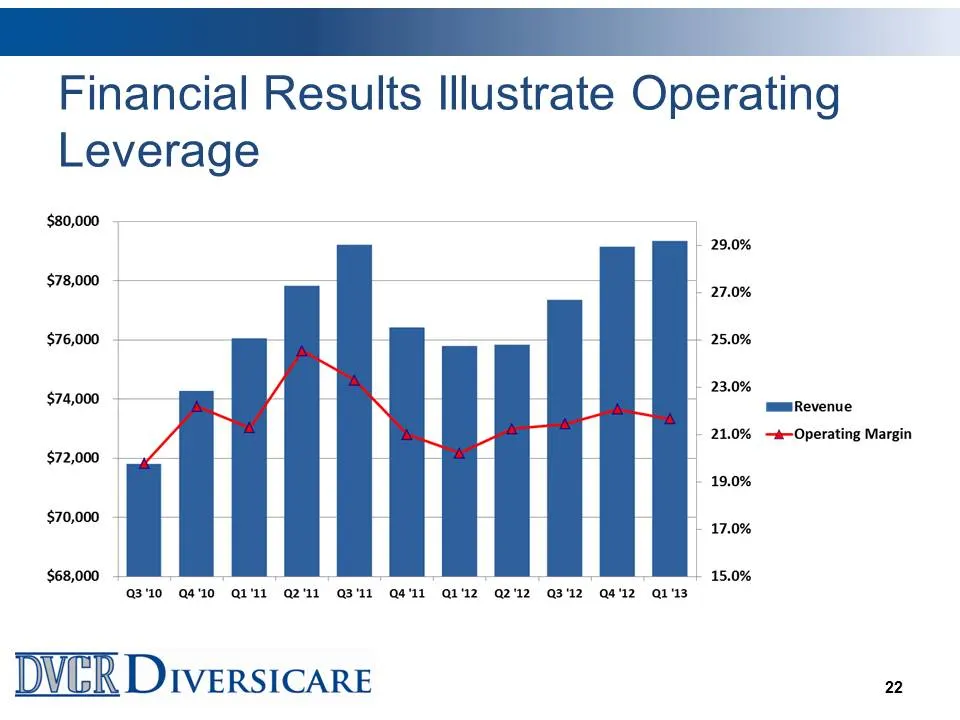
Financial and Operating Trends Financial Results Demonstrate Operating Leverage Focused on G&A Streamlining in Response to Medicare Cuts Portfolio Expansion Activity Accelerated DVER Diversicare ,
Slide 22: Financial Results Illustrate Operating Leverage
Financial Results Illustrate Operating Leverage $80,000 $78,000 $76,000 $74,000 — $72,000 $70,000 | $68,000 310 Q4'10 Q1'11 Q2'11 311 Q4'11 Qi'12 azz 312 QsI2 ais DVER Diversicare 29.0% - 27.0% 25.0% |» 23.0% - 21.0% 19.0% | 17.0% 15.0% mm Revenue —+-Operating Margin 22
Slide 23: Accelerated G&A Reduction
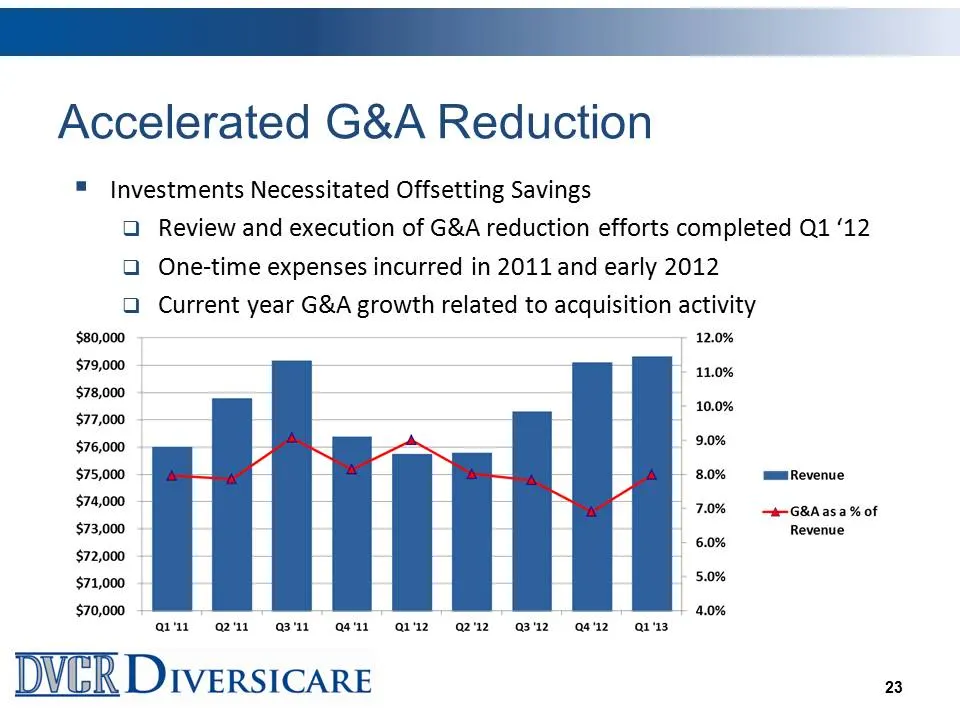
si tk; le Accelerated G&A Reduction = Investments Necessitated Offsetting Savings Q Review and execution of G&A reduction efforts completed Q1 ‘12 Q One-time expenses incurred in 2011 and early 2012 Q Current year G&A growth related to acquisition activity 12.0% 8.0% mmmRevenue | 70% te G&Aasa% of R
Slide 24: Financial and Operating Trends
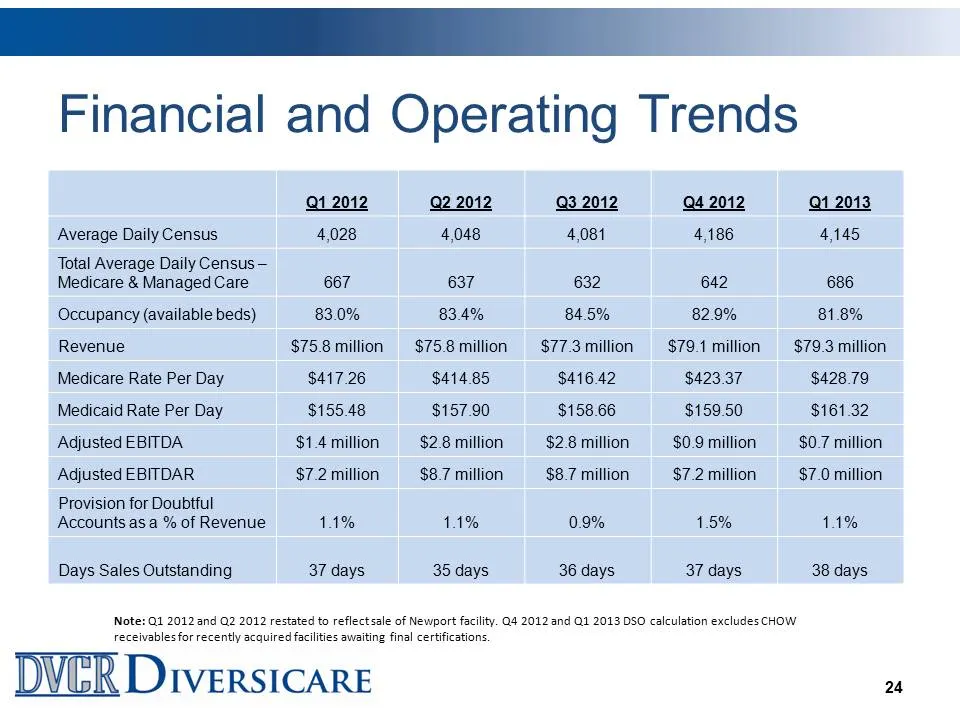
eee EE ES Financial and Operating Trends Q1 2012 2 2012 Q3 2012 Q4 2012 Q1 2013 Average Daily Census 4,028 4,048 4,081 4,186 4,145 Total Average Daily Census — Medicare & Managed Care 667 637 632 642 686 Occupancy (available beds) 83.0% 83.4% 84.5% 82.9% 81.8% Revenue $758 million $758million $773 m
Slide 25: Forward Strategy
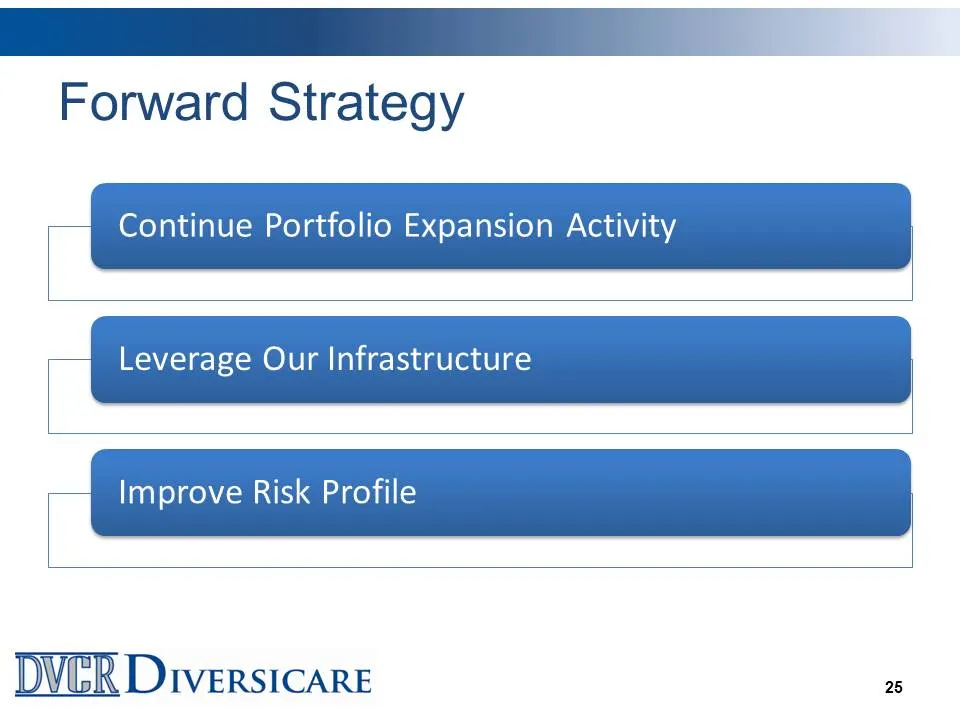
Forward Strategy Continue Portfolio Expansion Activity Leverage Our Infrastructure Improve Risk Profile ll DVER Diversicare 0s
Slide 26: Investment Highlights
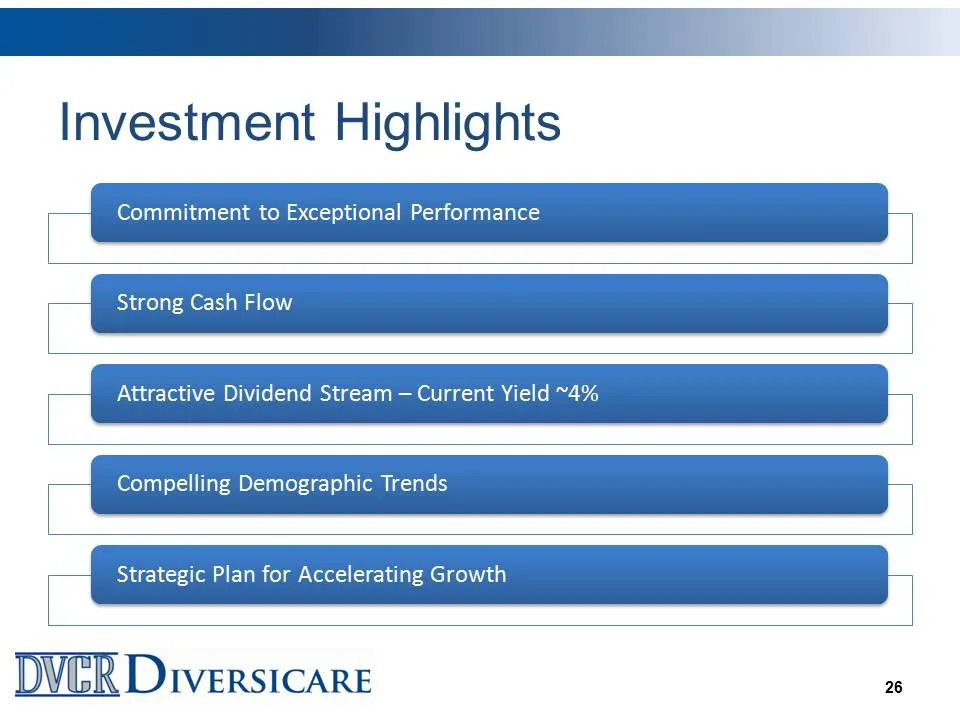
Investment Highlights Commitment to Exceptional Performance Strong Cash Flow Attractive Dividend Stream — Current Yield ~4% Compelling Demographic Trends Strategic Plan for Accelerating Growth DVER Diversicare 0s
Slide 27: Appendix A: Reconciliation of Net Income to Adjusted EBITDA and Adjusted EBITDAR
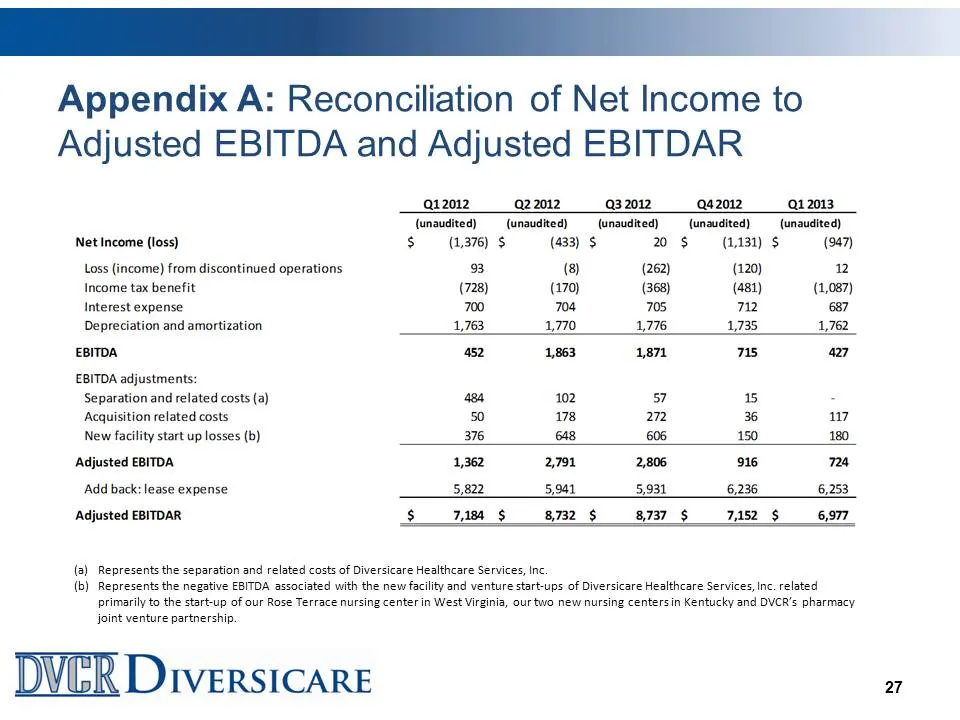
Appendix A: Reconciliation of Net Income to Adjusted EBITDA and Adjusted EBITDAR Q12012 Q22012 32012 42012 12013 (unaudited) (unaudited) (unaudited) (unaudited) (unaudited) Net Income (loss) S$ (1,376) $ (433) $ 20 $ = (1,131) $ (947) Loss (income) from discontinued operations B (8) (262) (120) 2 In
Source: SEC EDGAR · 8-K filed May 13, 2013
More decks from Diversicare Healthcare Services Inc
 Q2 2021 Earnings Presentation31 slides · Aug 10, 2021
 Q1 2021 Earnings Presentation31 slides · May 11, 2021
 Q4 2020 Earnings Presentation31 slides · Mar 11, 2021
 Q3 2019 Earnings Presentation5 slides · Oct 31, 2019
 Q2 2018 Earnings Presentation35 slides · Aug 2, 2018
 Q1 2018 Earnings Presentation35 slides · May 3, 2018