Comerica — Comerica Inc /New/ — Barclays Global Financials Conference 2020
34 slides from Comerica's conference presentation, Sep 11, 2020
Slide 1: Comerica Incorporated Barclays Global Financials Conference
Comerica Incorporated Barclays Global Financials Conference September 14, 2020 Curt Farmer Jim Herzog Chief Executive Officer Chief Financial Officer Peter Sefzik Melinda Chausse Executive Director Chief Credit Officer Commercial Bank
Slide 2: Safe Harbor Statement
Safe Harbor Statement Any statements in this presentation that are not historical facts are forward-looking statements as defined in the Private Securities Litigation Reform Act of 1995. Words such as “anticipates,” “believes,” “contemplates,” “feels,” “expects,” “estimates,” “seeks,” “strives,” “pl
Slide 3: Well positioned to navigate these challenging times
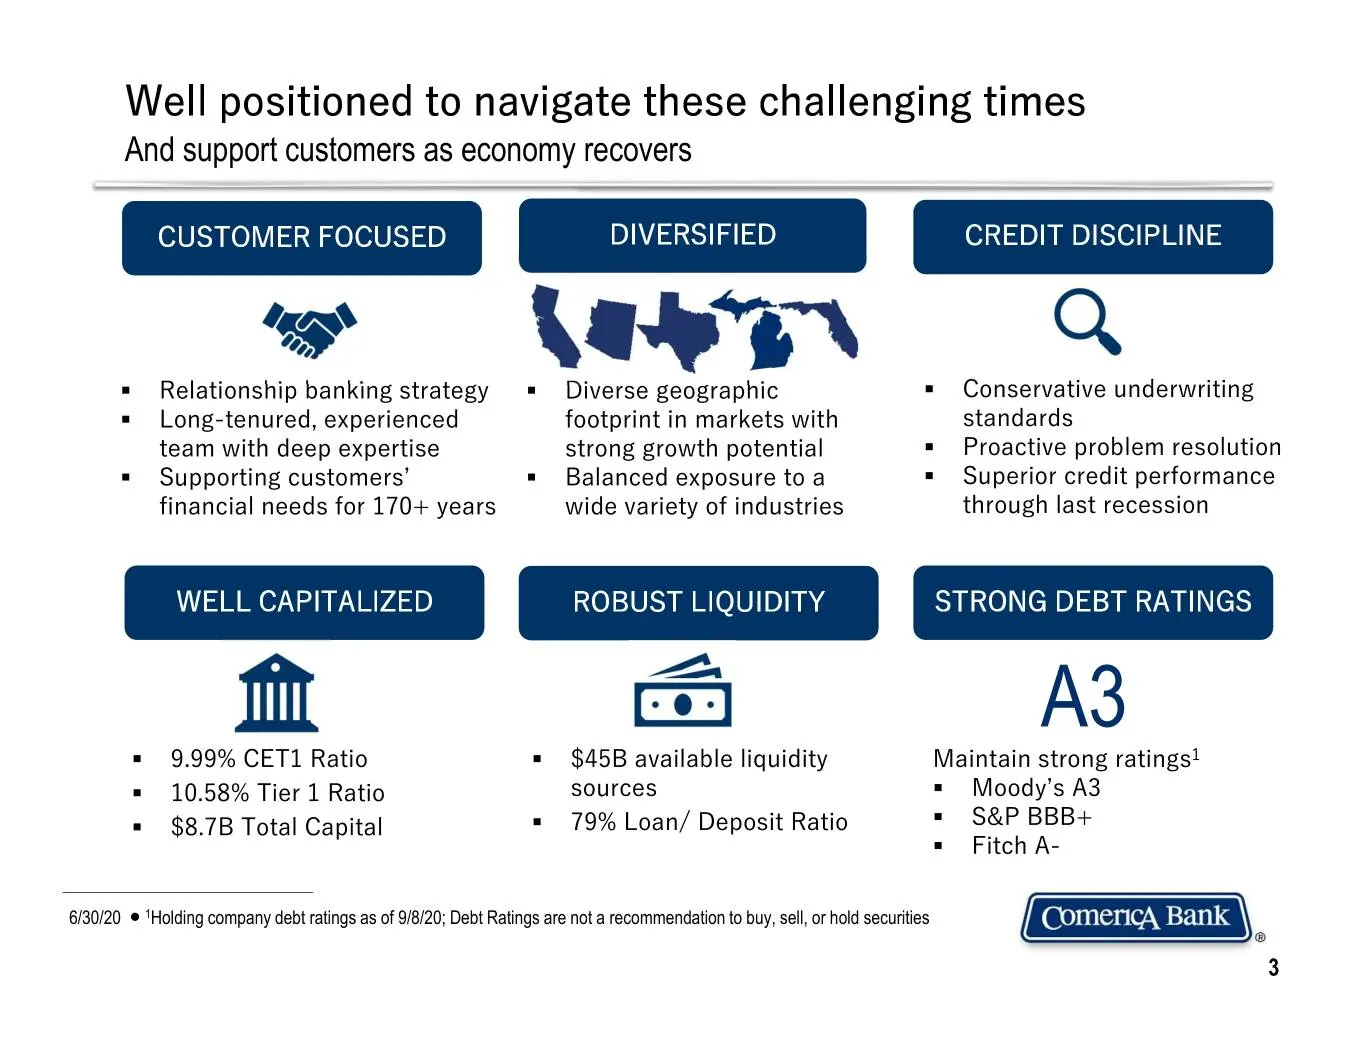
Well positioned to navigate these challenging times And support customers as economy recovers CUSTOMER FOCUSED DIVERSIFIED CREDIT DISCIPLINE . Relationship banking strategy . Diverse geographic . Conservative underwriting . Long-tenured, experienced footprint in markets with standards team with deep
Slide 4: 3Q20 Loan Update
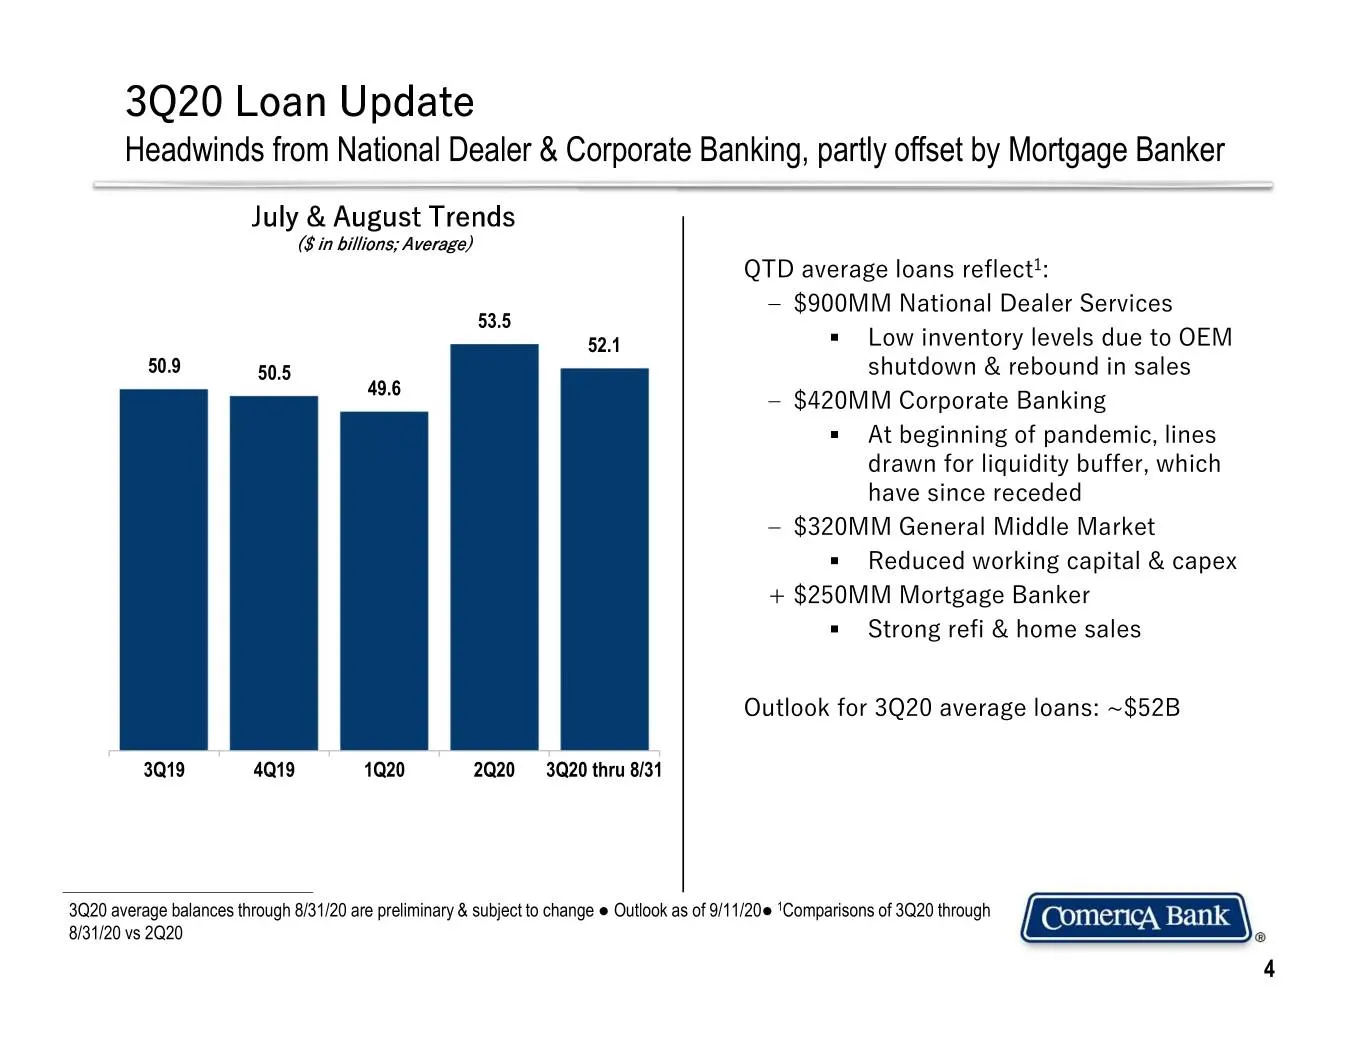
3Q20 Loan Update Headwinds from National Dealer & Corporate Banking, partly offset by Mortgage Banker July & August Trends ($ in billions; Average) QTD average loans reflect1: ‒ $900MM National Dealer Services 53.5 52.1 . Low inventory levels due to OEM 50.9 50.5 shutdown & rebound in sales 49.6 ‒ $
Slide 5: 3Q20 Deposit Update
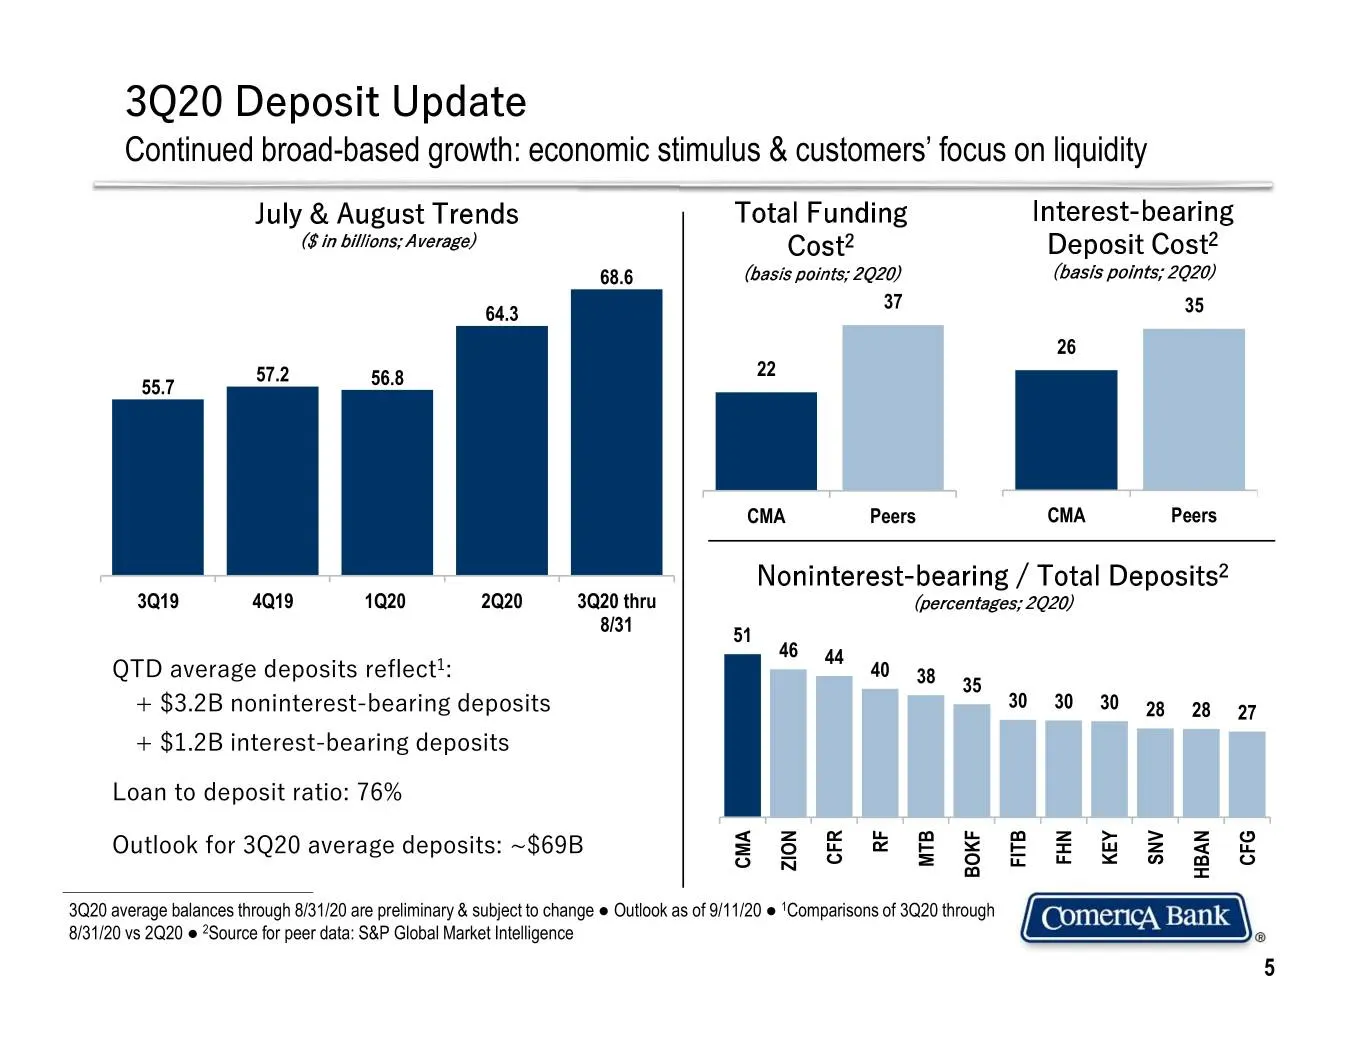
3Q20 Deposit Update Continued broad-based growth: economic stimulus & customers’ focus on liquidity July & August Trends Total Funding Interest-bearing ($ in billions; Average) Cost2 Deposit Cost2 68.6 (basis points; 2Q20) (basis points; 2Q20) 37 64.3 35 26 57.2 22 55.7 56.8 CMA Peers CMA Peers Noni
Slide 6: Diverse Portfolio
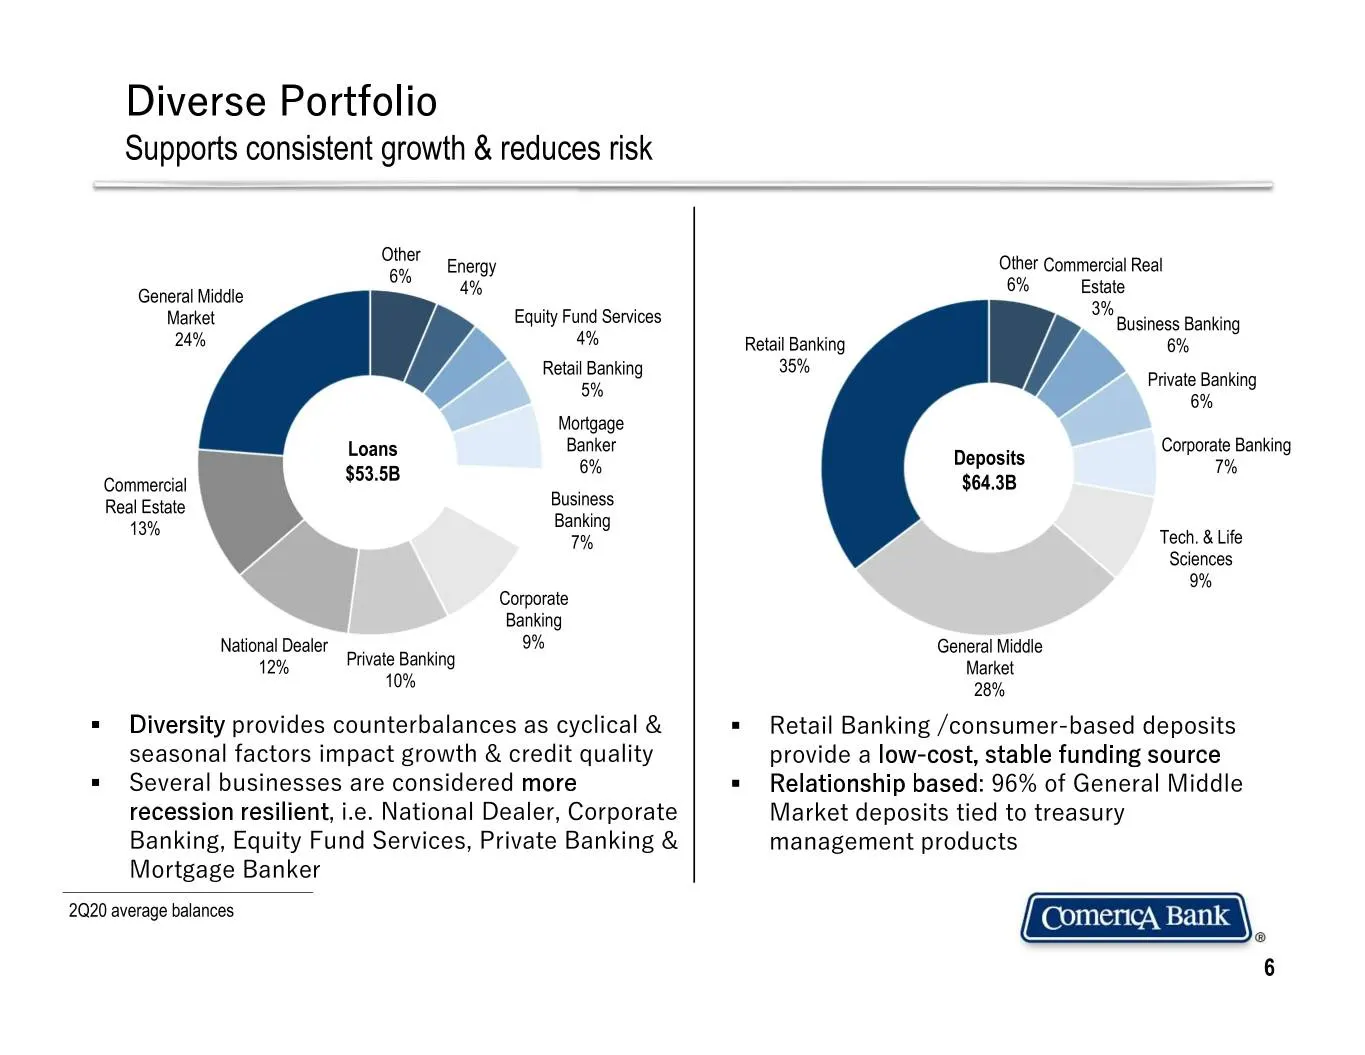
Diverse Portfolio Supports consistent growth & reduces risk Other Energy Other Commercial Real 6% 6% Estate General Middle 4% 3% Market Equity Fund Services Business Banking 24% 4% Retail Banking 6% Retail Banking 35% Private Banking 5% 6% Mortgage Banker Corporate Banking Loans Deposits $53.5B 6% 7
Slide 7: Net Interest Income
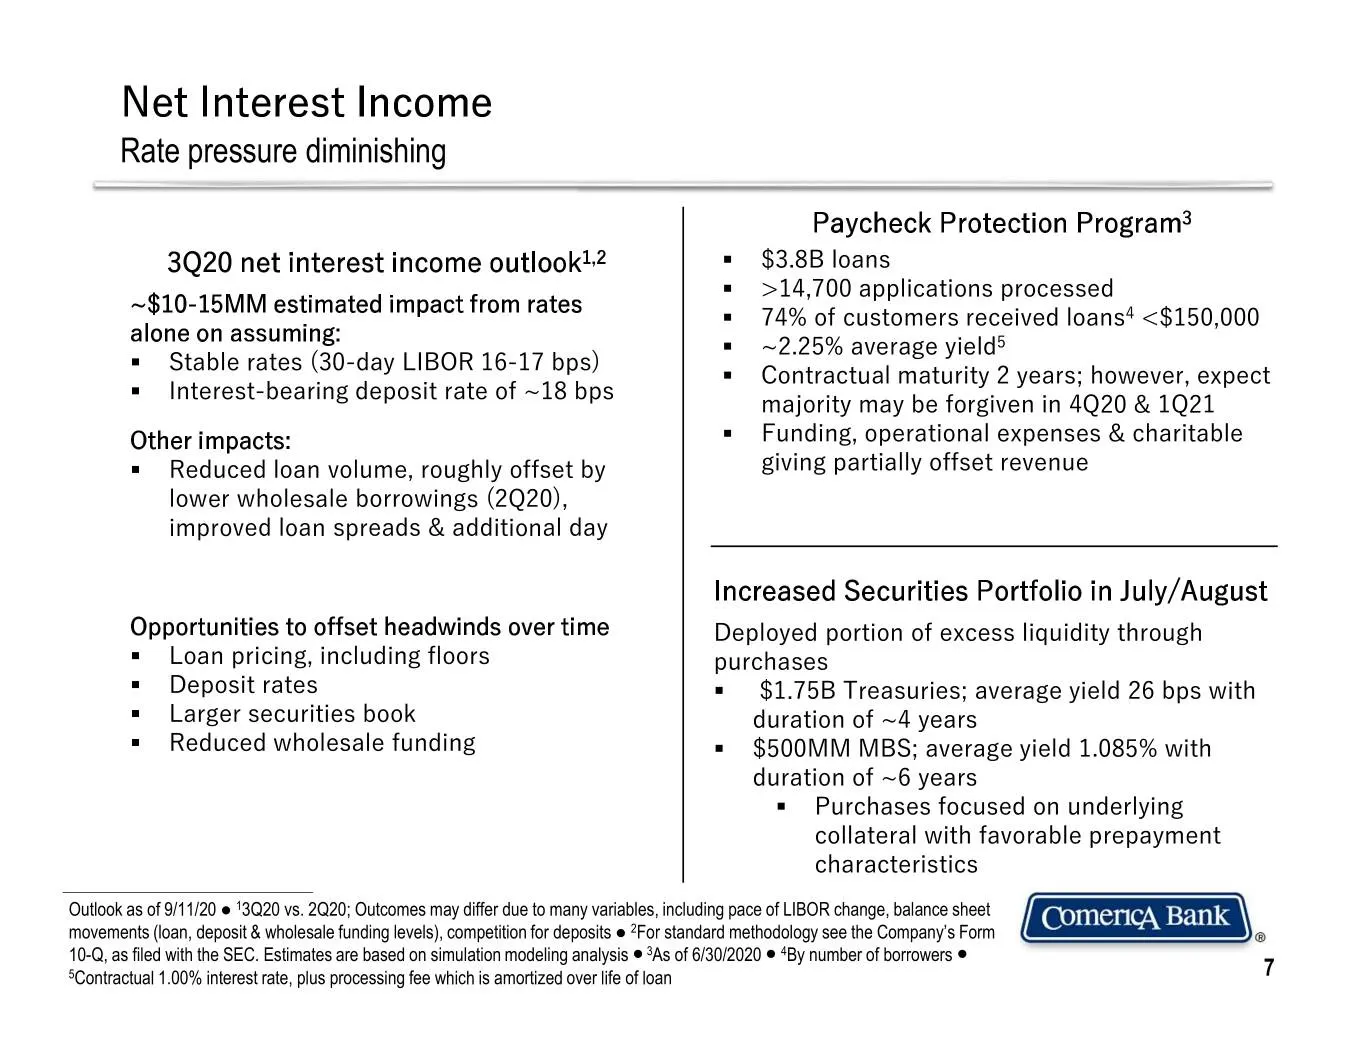
Net Interest Income Rate pressure diminishing Paycheck Protection Program3 3Q20 net interest income outlook1,2 . $3.8B loans . >14,700 applications processed ~$10-15MM estimated impact from rates . 74% of customers received loans4 <$150,000 alone on assuming: . ~2.25% average yield5 . Stable rates (
Slide 8: Revenue Opportunities
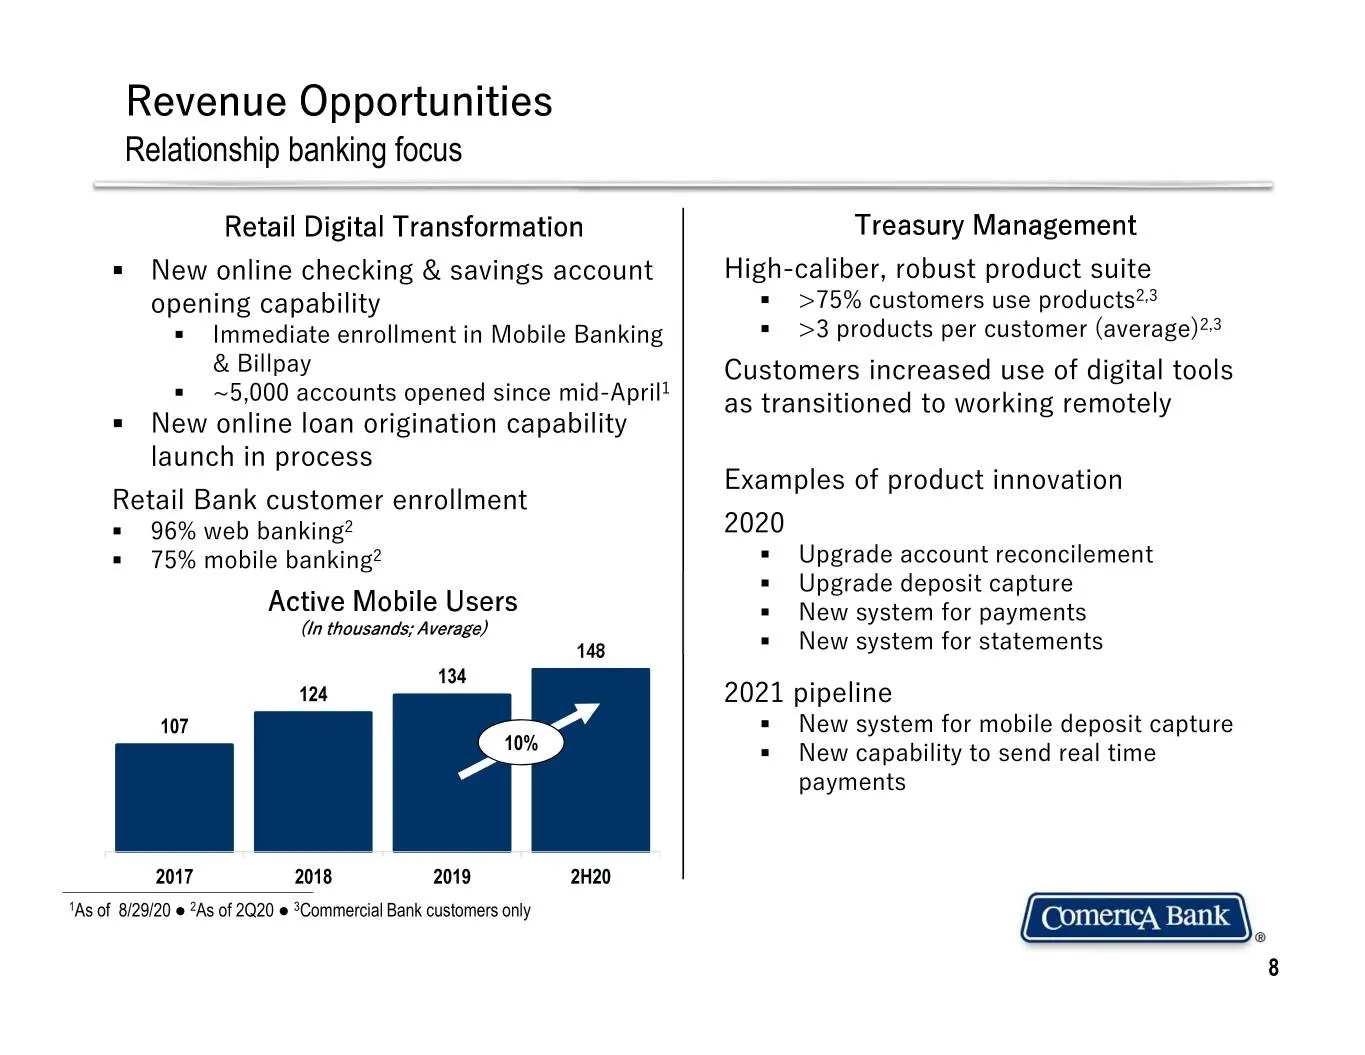
Revenue Opportunities Relationship banking focus Retail Digital Transformation Treasury Management . New online checking & savings account High-caliber, robust product suite opening capability . >75% customers use products2,3 . Immediate enrollment in Mobile Banking . >3 products per customer (avera
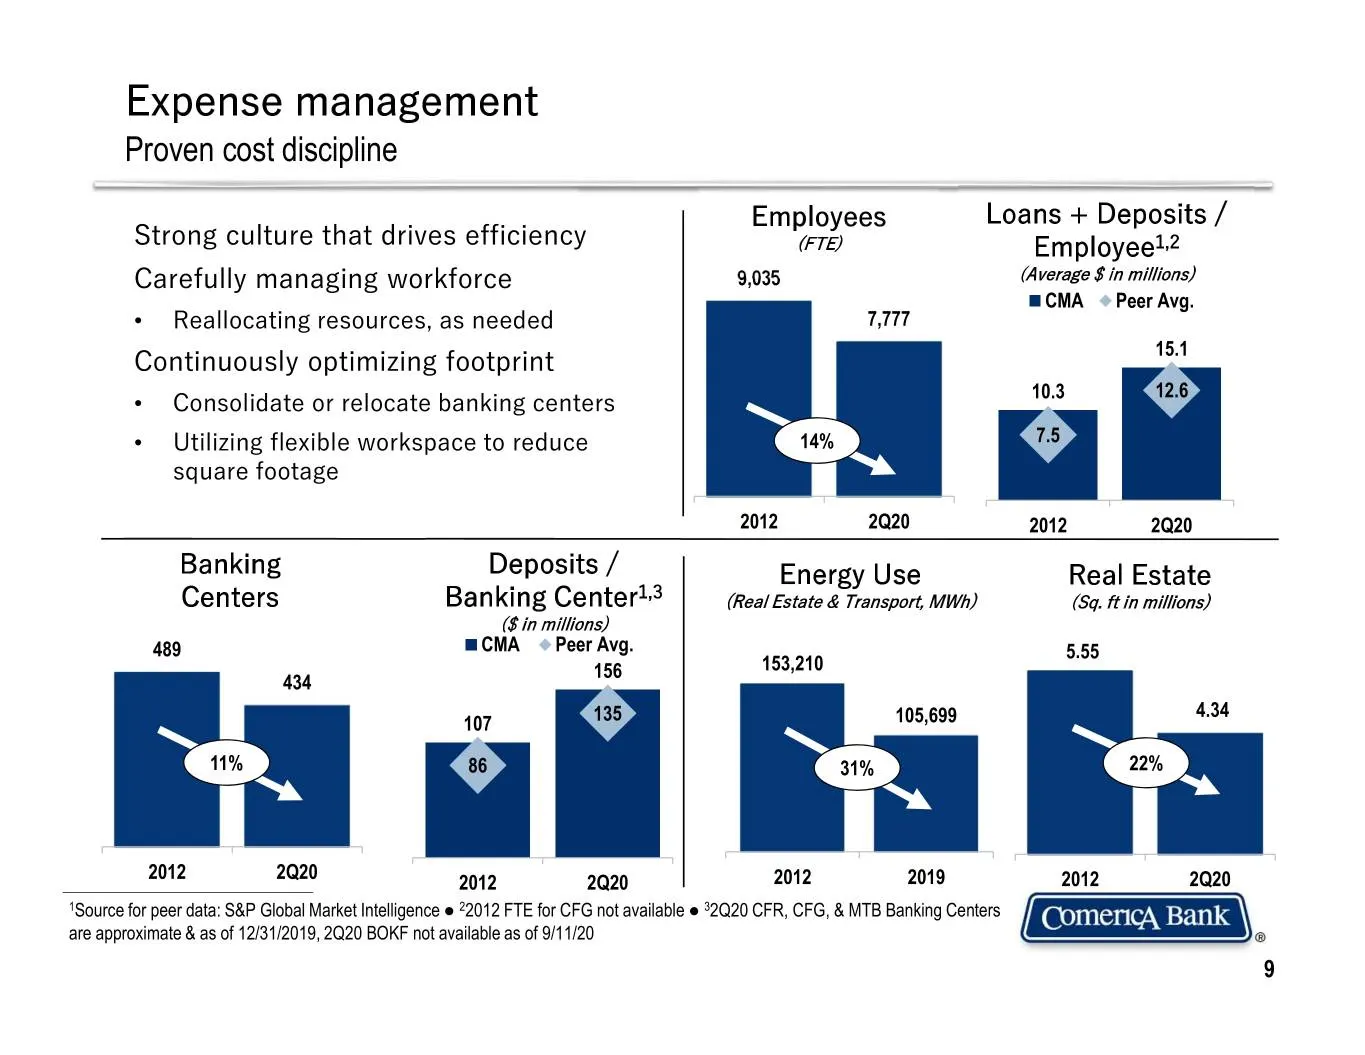
Slide 9: Expense management
Expense management Proven cost discipline Employees Loans + Deposits / Strong culture that drives efficiency (FTE) Employee1,2 Carefully managing workforce 9,035 (Average $ in millions) CMA Peer Avg. • Reallocating resources, as needed 7,777 15.1 Continuously optimizing footprint 10.3 12.6 • Consoli
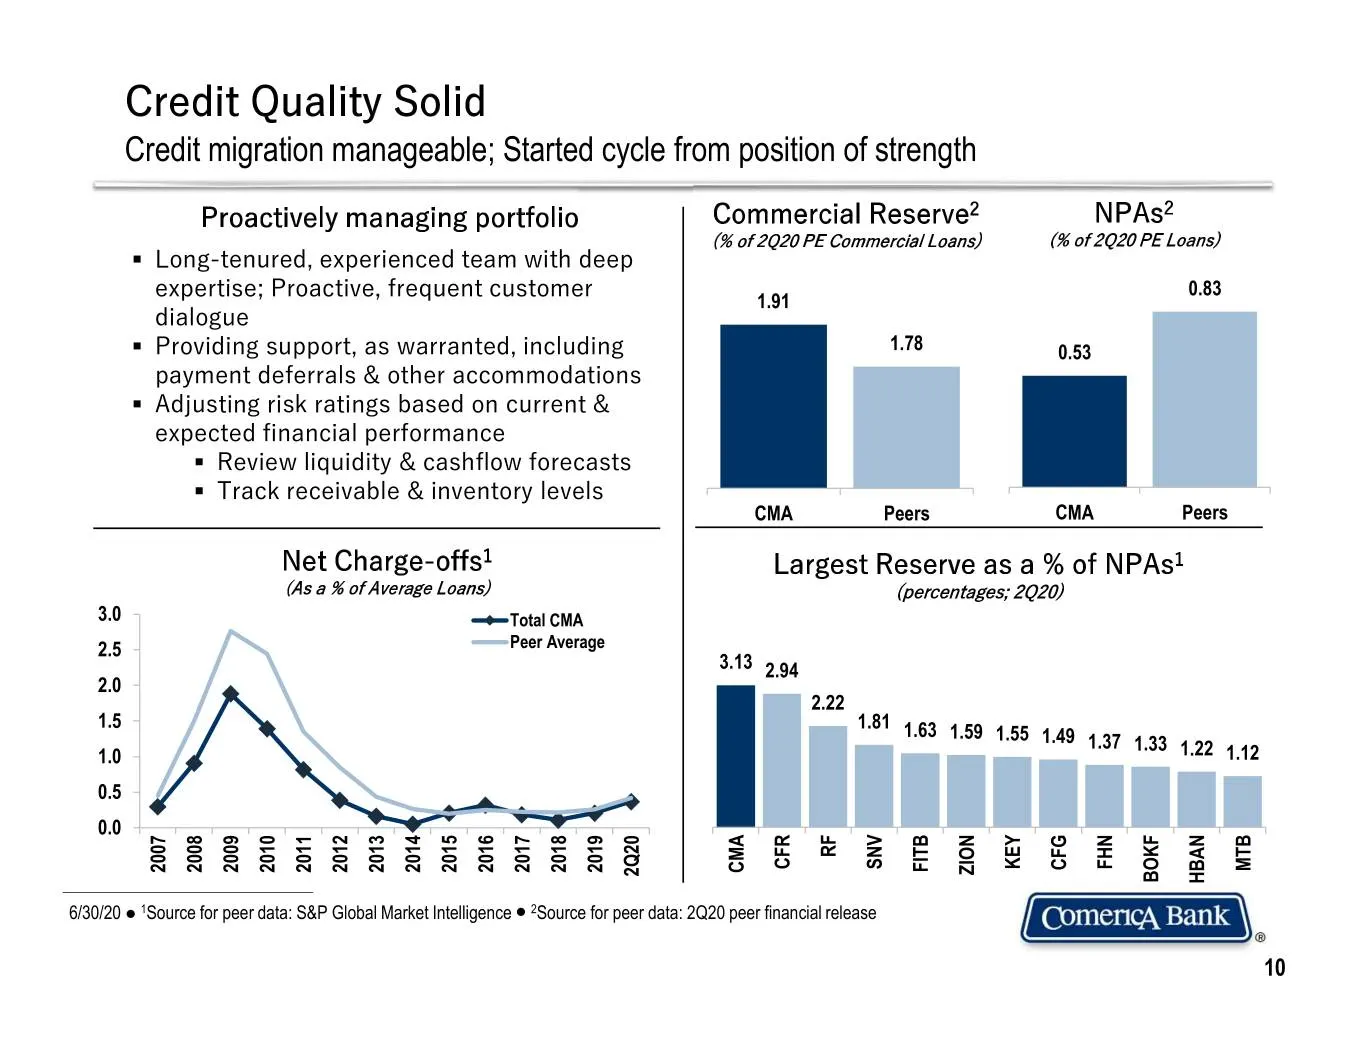
Slide 10: Credit Quality
Credit Quality Solid Credit migration manageable; Started cycle from position of strength Proactively managing portfolio Commercial Reserve2 NPAs2 (% of 2Q20 PE Commercial Loans) (% of 2Q20 PE Loans) . Long-tenured, experienced team with deep 0.83 expertise; Proactive, frequent customer 1.91 dialogu
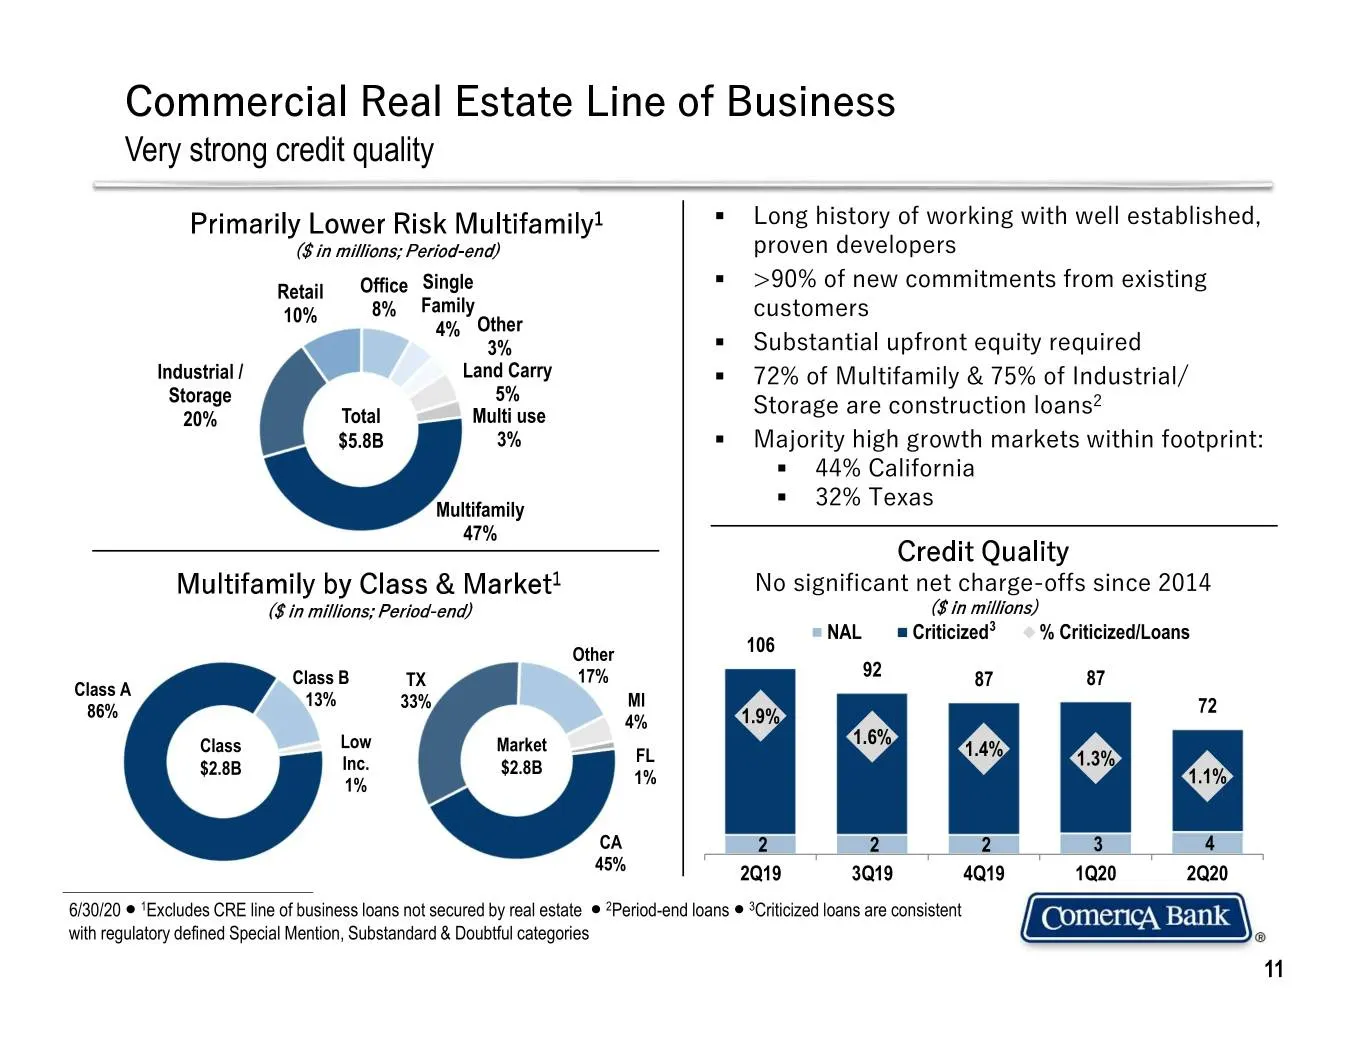
Slide 11: Commercial Real Estate Line of Business
Commercial Real Estate Line of Business Very strong credit quality Primarily Lower Risk Multifamily1 . Long history of working with well established, ($ in millions; Period-end) proven developers . Retail Office Single >90% of new commitments from existing 10% 8% Family customers 4% Other 3% . Subst
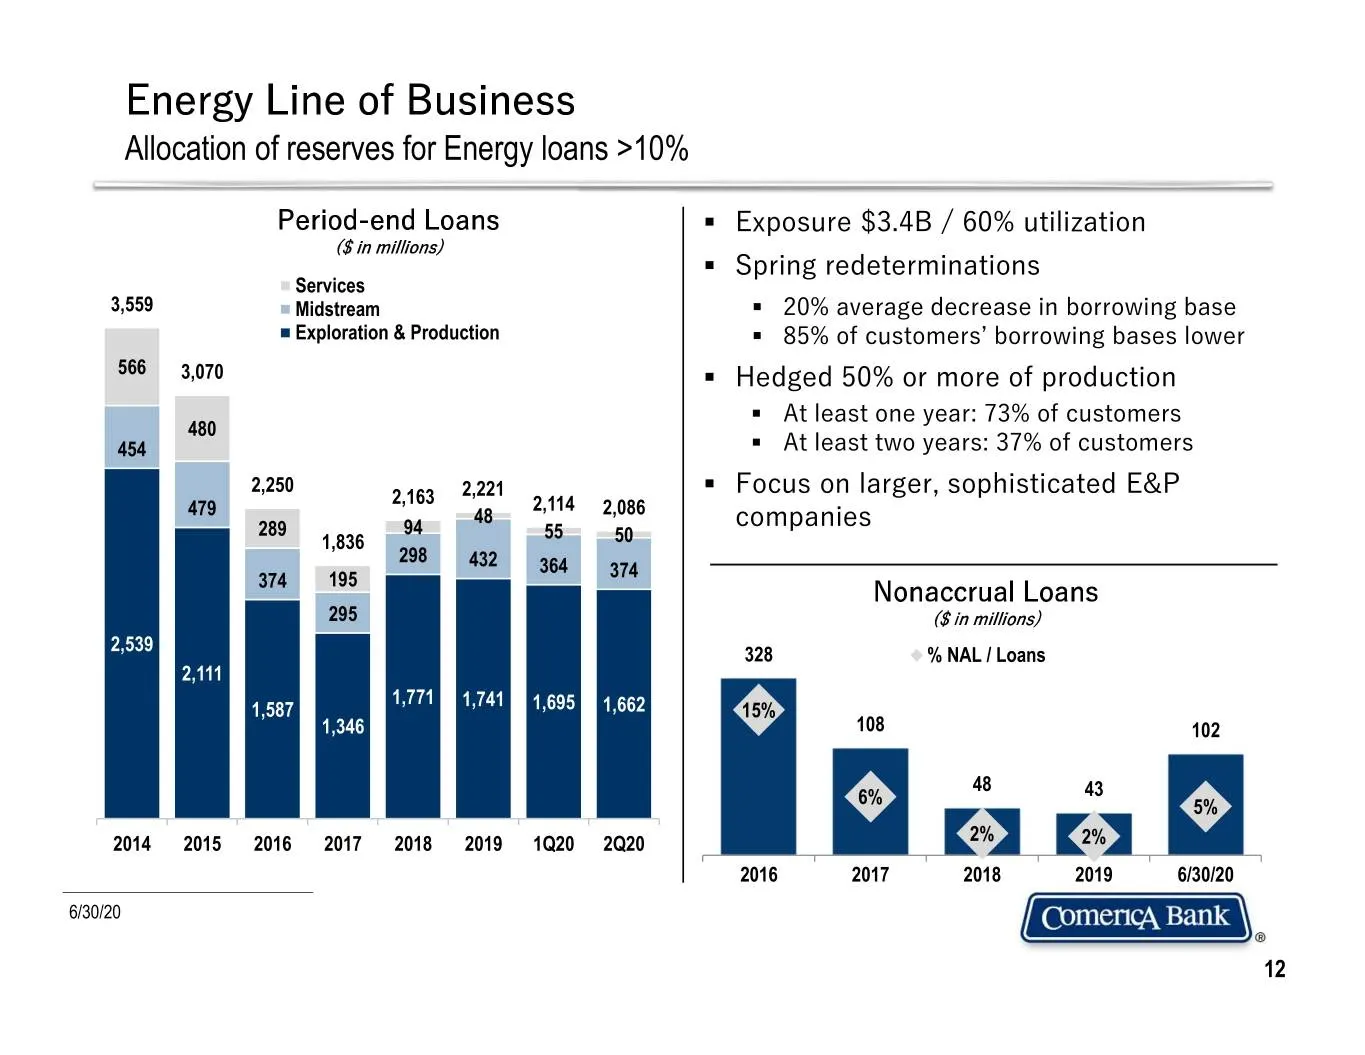
Slide 12: Energy Line of Business
Energy Line of Business Allocation of reserves for Energy loans >10% Period-end Loans . Exposure $3.4B / 60% utilization ($ in millions) . Spring redeterminations Services 3,559 Midstream . 20% average decrease in borrowing base Exploration & Production . 85% of customers’ borrowing bases lower 566
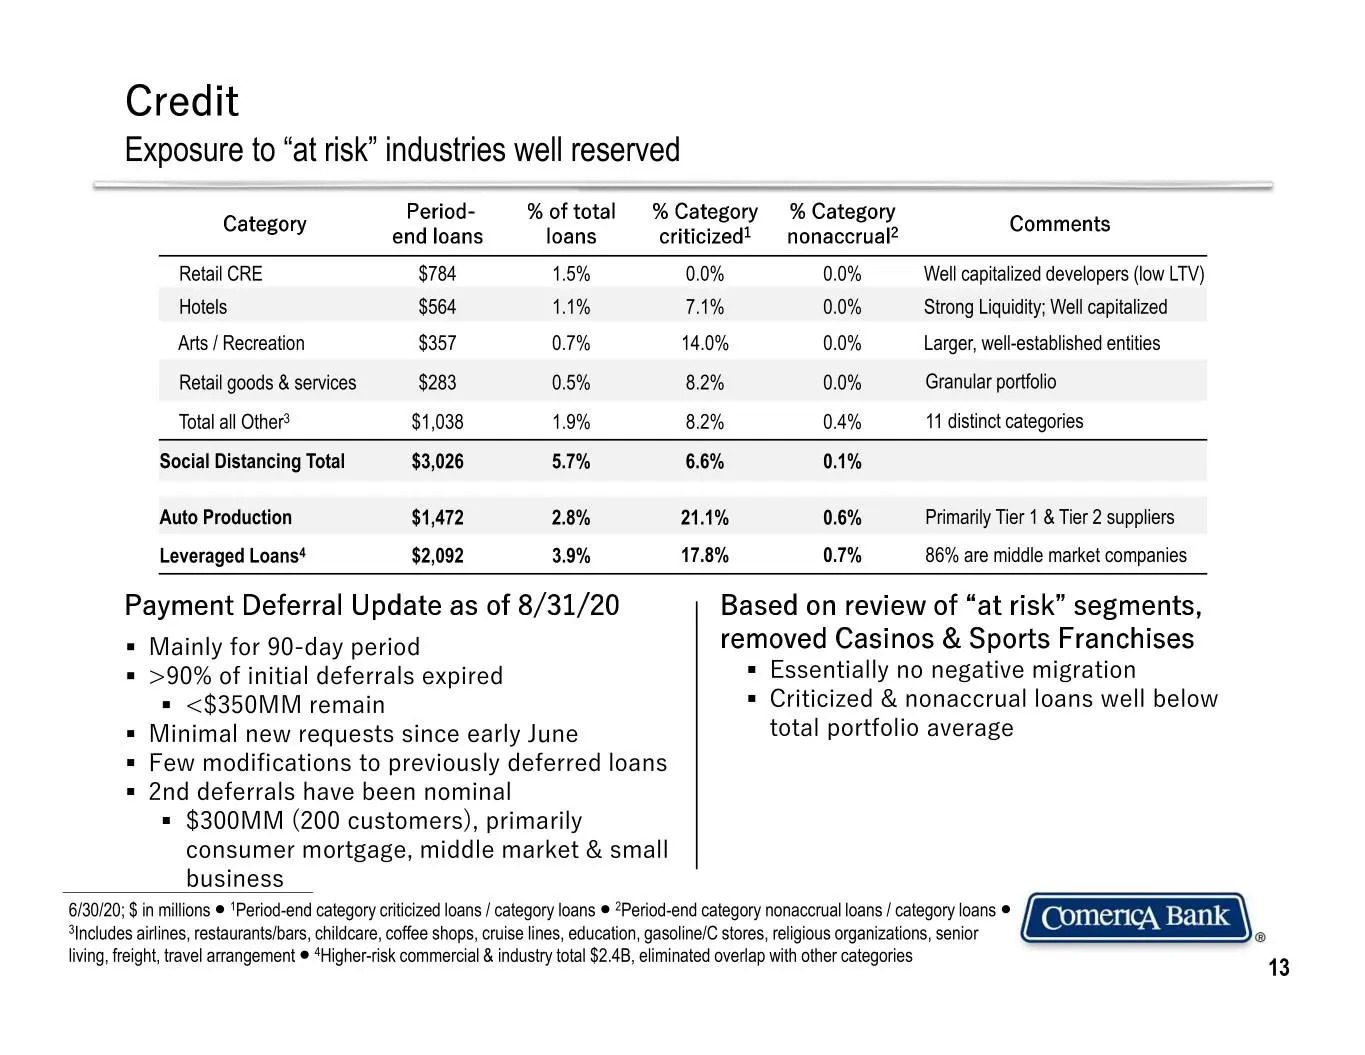
Slide 13: Credit Exposure to "at risk" industries well reserved
Credit Exposure to “at risk” industries well reserved Period- % of total % Category % Category Category Comments end loans loans criticized1 nonaccrual2 Retail CRE $784 1.5% 0.0% 0.0% Well capitalized developers (low LTV) Hotels $564 1.1% 7.1% 0.0% Strong Liquidity; Well capitalized Arts / Recreatio
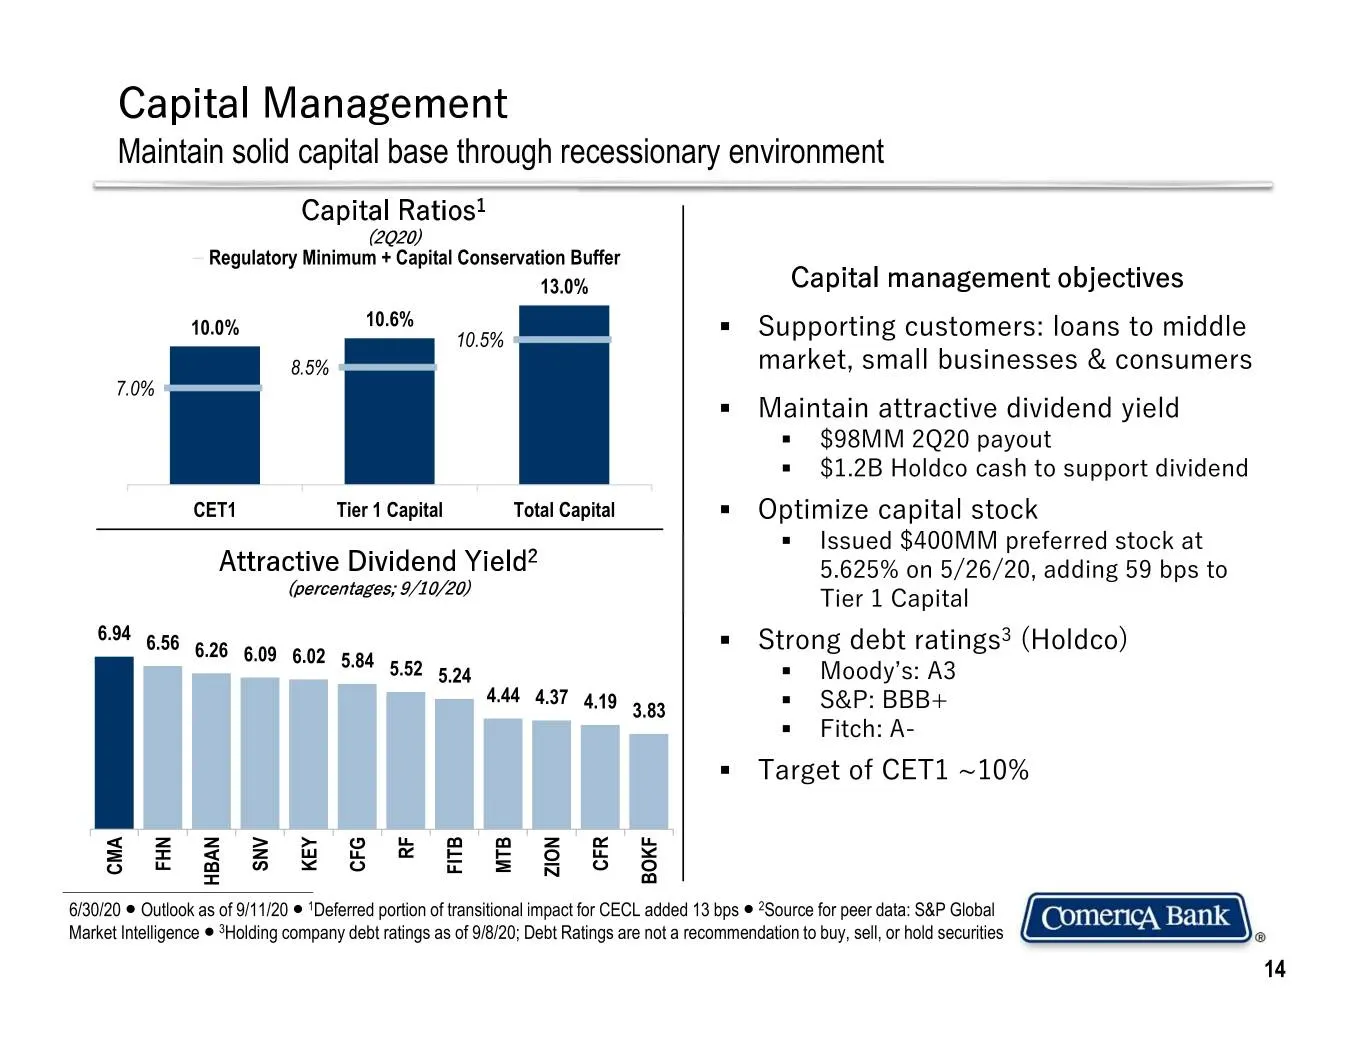
Slide 14: Capital Management
Capital Management Maintain solid capital base through recessionary environment Capital Ratios1 (2Q20) Regulatory Minimum + Capital Conservation Buffer 13.0% Capital management objectives 10.0% 10.6% 10.5% . Supporting customers: loans to middle 8.5% market, small businesses & consumers 7.0% . Maint
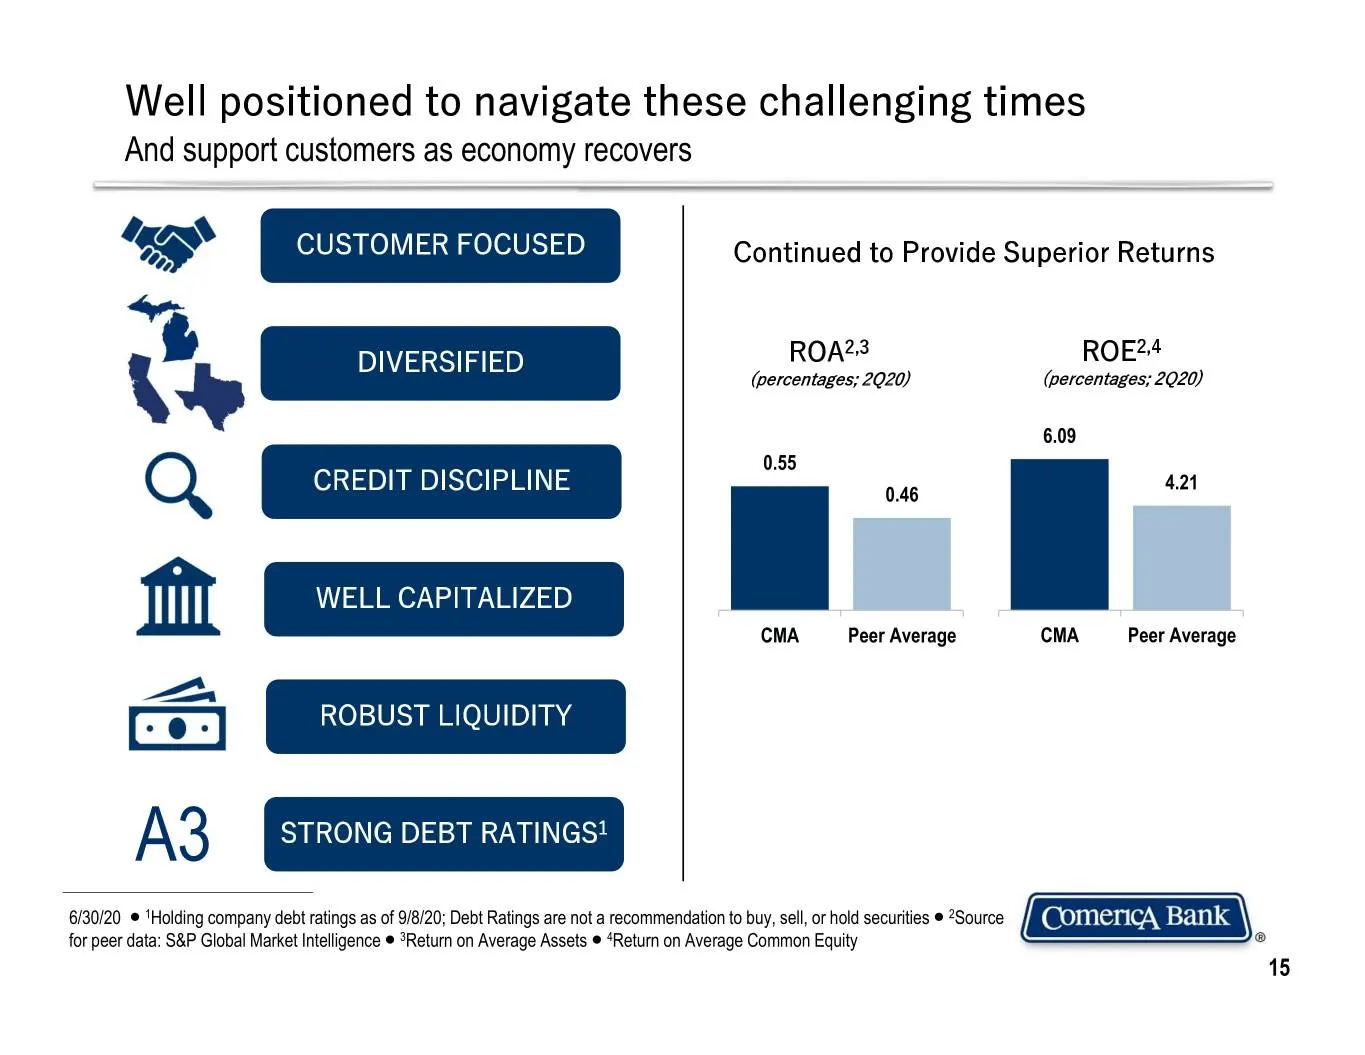
Slide 15: Well positioned to navigate these challenging times
Well positioned to navigate these challenging times And support customers as economy recovers CUSTOMER FOCUSED Continued to Provide Superior Returns 2,3 2,4 DIVERSIFIED ROA ROE (percentages; 2Q20) (percentages; 2Q20) 6.09 0.55 4.21 CREDIT DISCIPLINE 0.46 WELL CAPITALIZED CMA Peer Average CMA Peer Av
Slide 16: Appendix
Appendix / ComenicA Bank \
Slide 17: 2Q20 Results
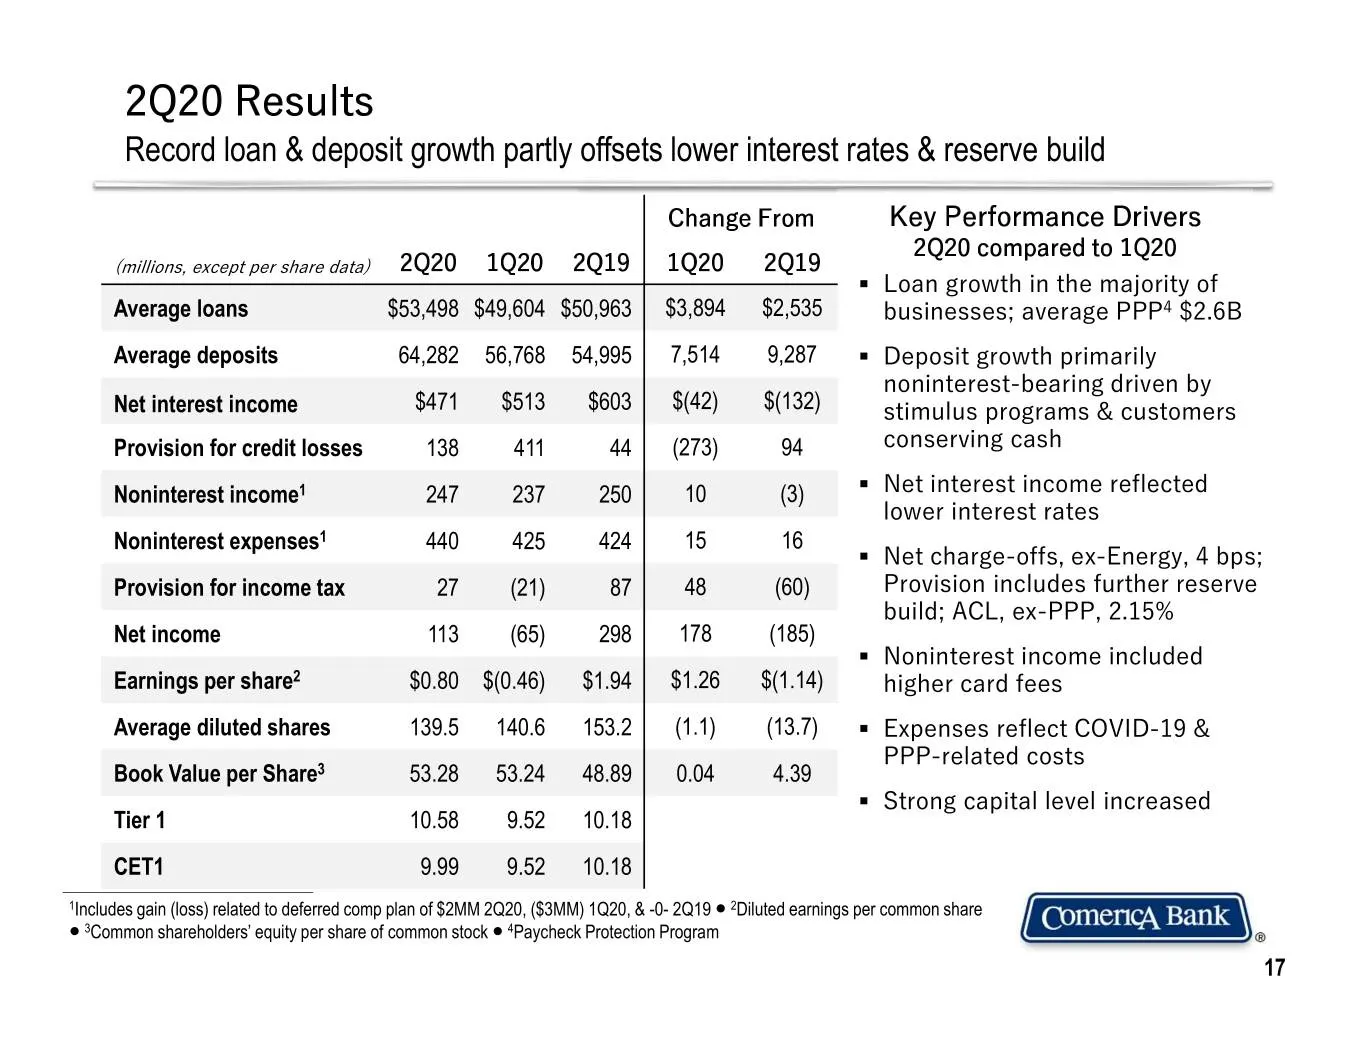
2Q20 Results Record loan & deposit growth partly offsets lower interest rates & reserve build Change From Key Performance Drivers 2Q20 compared to 1Q20 (millions, except per share data) 2Q20 1Q20 2Q19 1Q20 2Q19 . Loan growth in the majority of Average loans $53,498 $49,604 $50,963 $3,894 $2,535 busi
Slide 18: Loans Increased 8% to Record Level
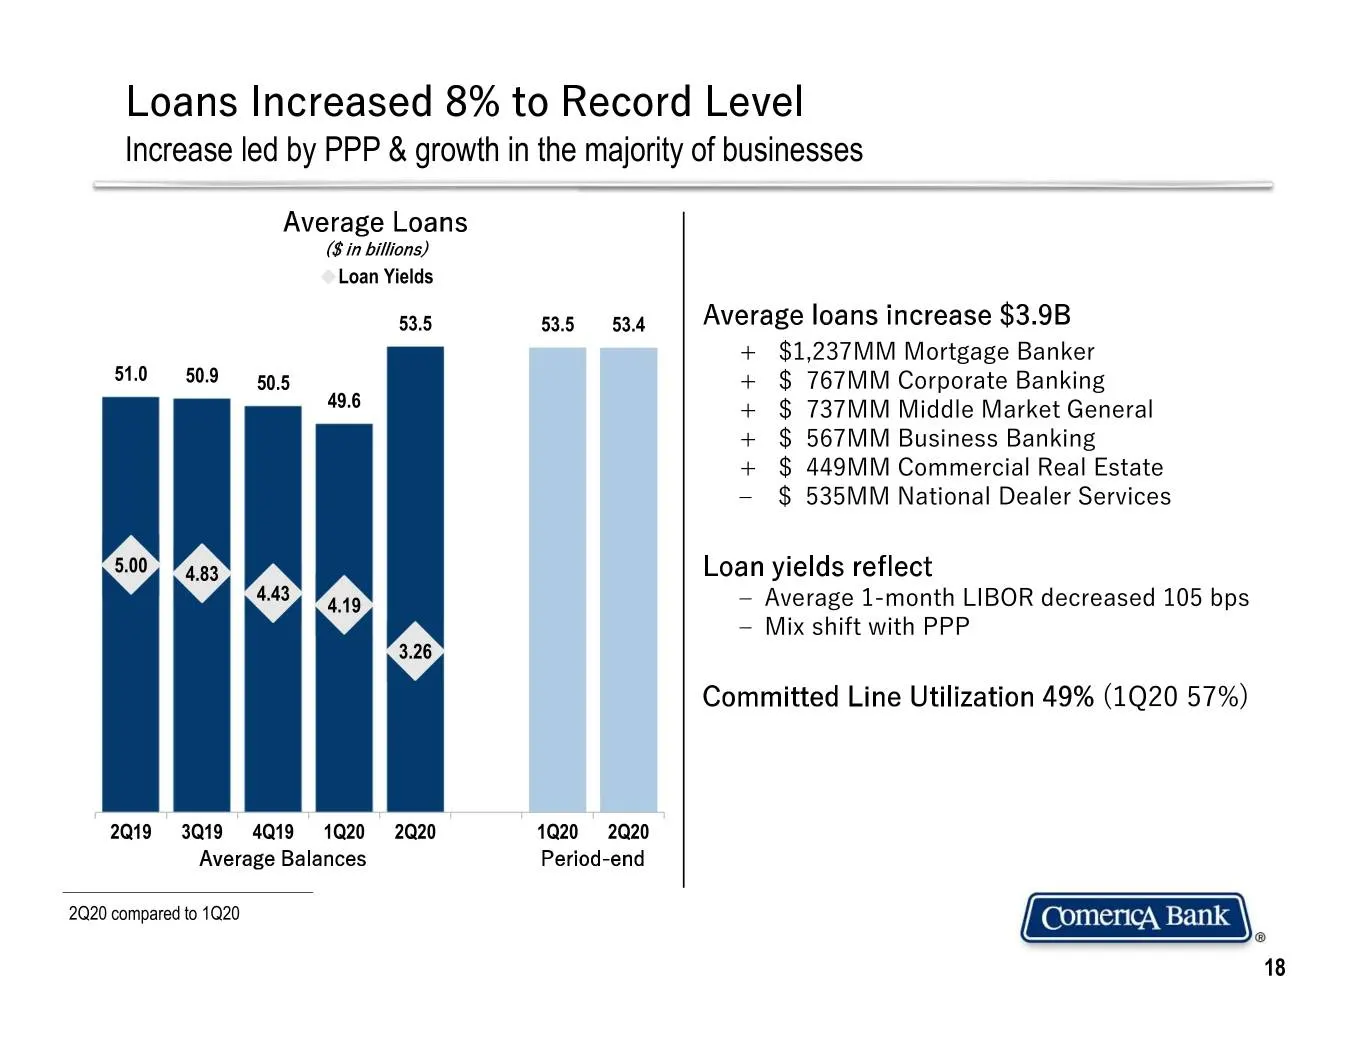
Loans Increased 8% to Record Level Increase led by PPP & growth in the majority of businesses Average Loans ($ in billions) Loan Yields 53.5 53.5 53.4 Average loans increase $3.9B + $1,237MM Mortgage Banker 51.0 50.9 50.5 + $ 767MM Corporate Banking 49.6 + $ 737MM Middle Market General + $ 567MM Bus
Slide 19: Average Loans by Business and Market
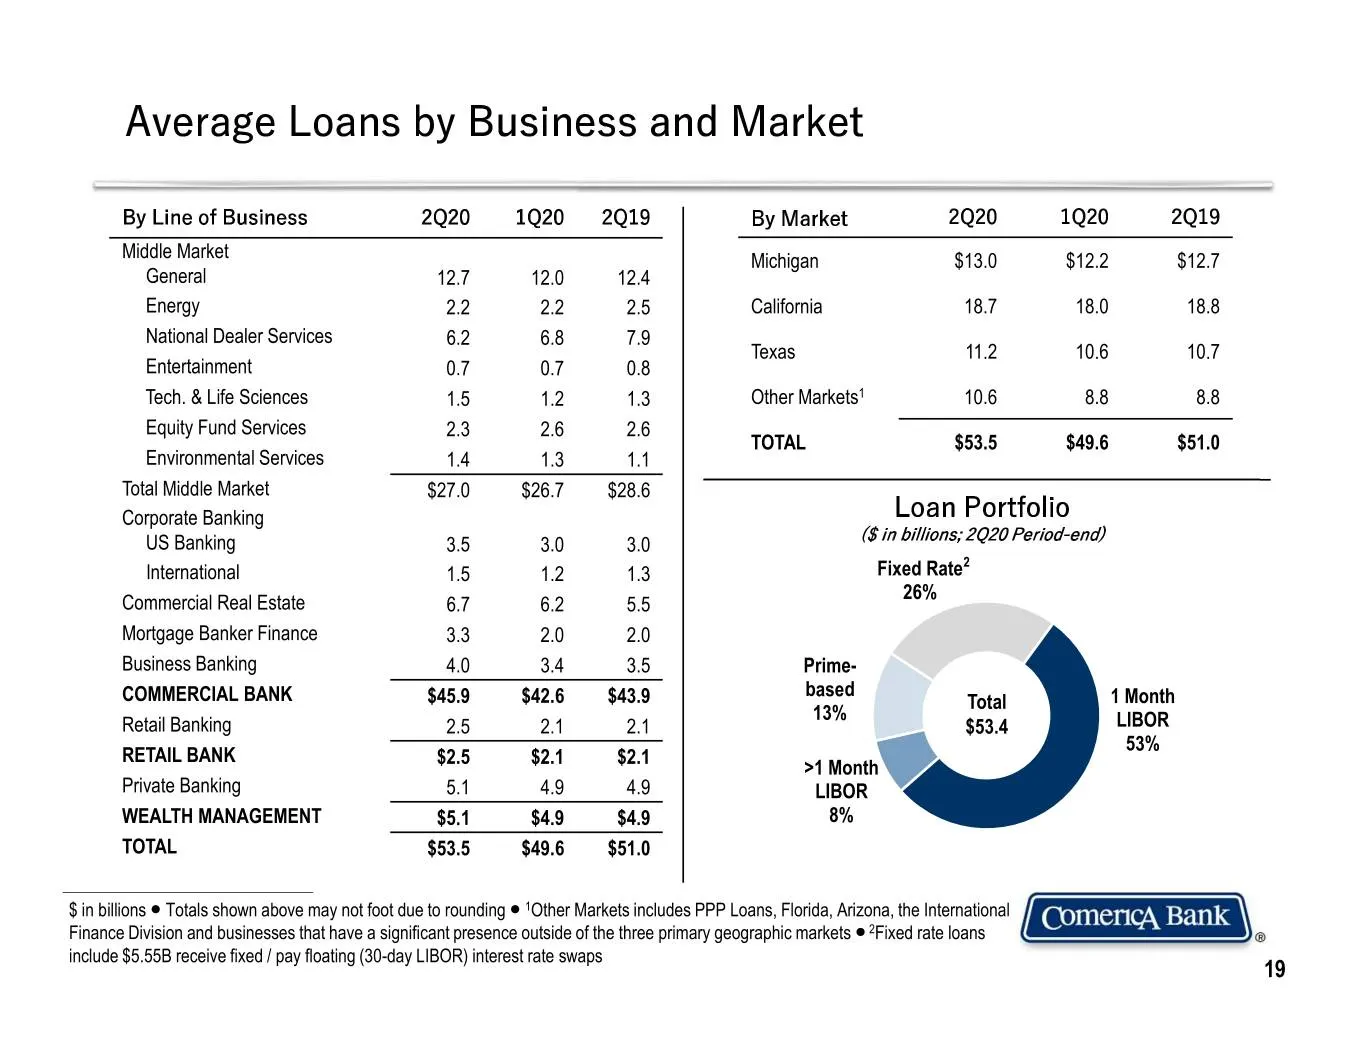
Average Loans by Business and Market By Line of Business 2Q20 1Q20 2Q19 By Market 2Q20 1Q20 2Q19 Middle Market Michigan $13.0 $12.2 $12.7 General 12.7 12.0 12.4 Energy 2.2 2.2 2.5 California 18.7 18.0 18.8 National Dealer Services 6.2 6.8 7.9 Texas 11.2 10.6 10.7 Entertainment 0.7 0.7 0.8 Tech. & Li
Slide 20: Deposits Grew 13% to Record Level
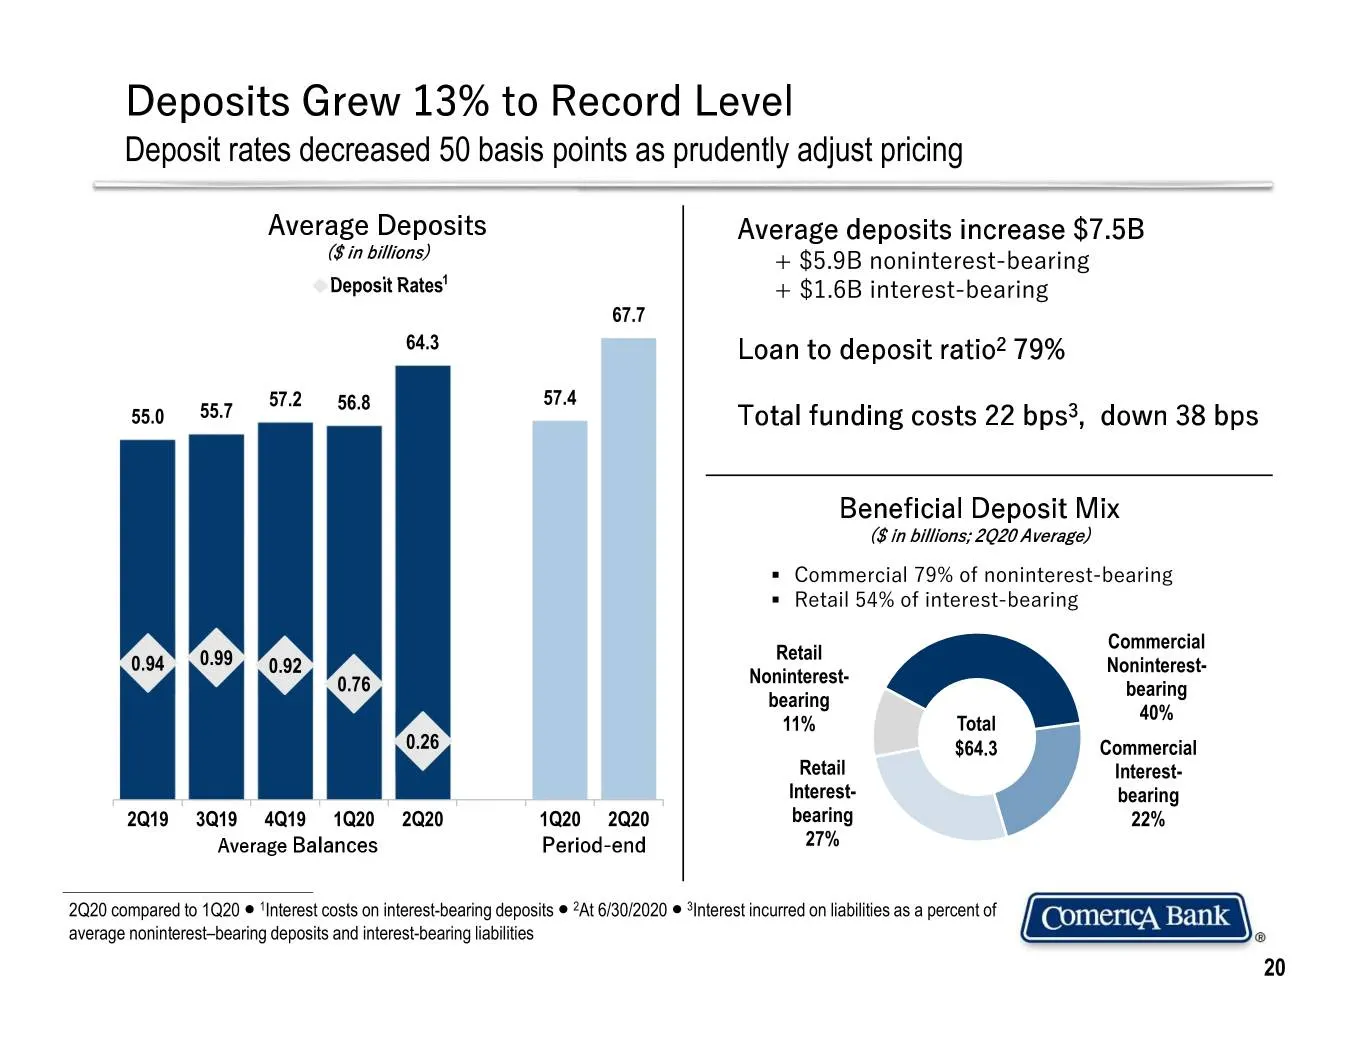
Deposits Grew 13% to Record Level Deposit rates decreased 50 basis points as prudently adjust pricing Average Deposits Average deposits increase $7.5B ($ in billions) + $5.9B noninterest-bearing 1 Deposit Rates + $1.6B interest-bearing 67.7 64.3 Loan to deposit ratio2 79% 57.2 56.8 57.4 55.0 55.7 To
Slide 21: Average Deposits by Business and Market
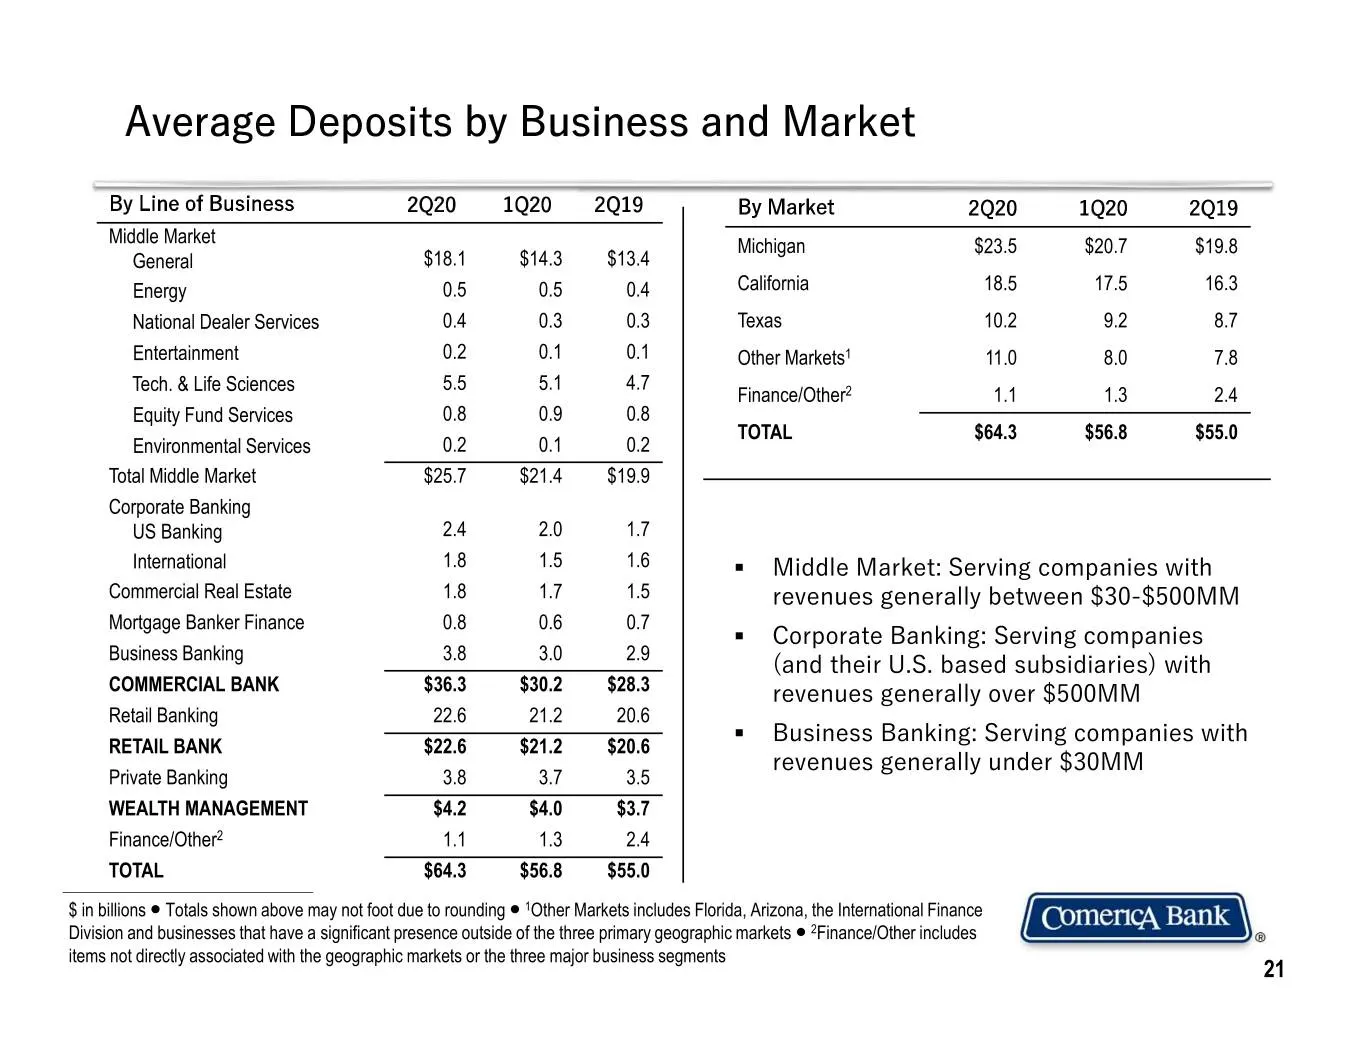
Average Deposits by Business and Market By Line of Business 2Q20 1Q20 2Q19 By Market 2Q20 1Q20 2Q19 Middle Market Michigan $23.5 $20.7 $19.8 General $18.1 $14.3 $13.4 Energy 0.5 0.5 0.4 California 18.5 17.5 16.3 National Dealer Services 0.4 0.3 0.3 Texas 10.2 9.2 8.7 Entertainment 0.2 0.1 0.1 Other
Slide 22: Mortgage Banker Finance
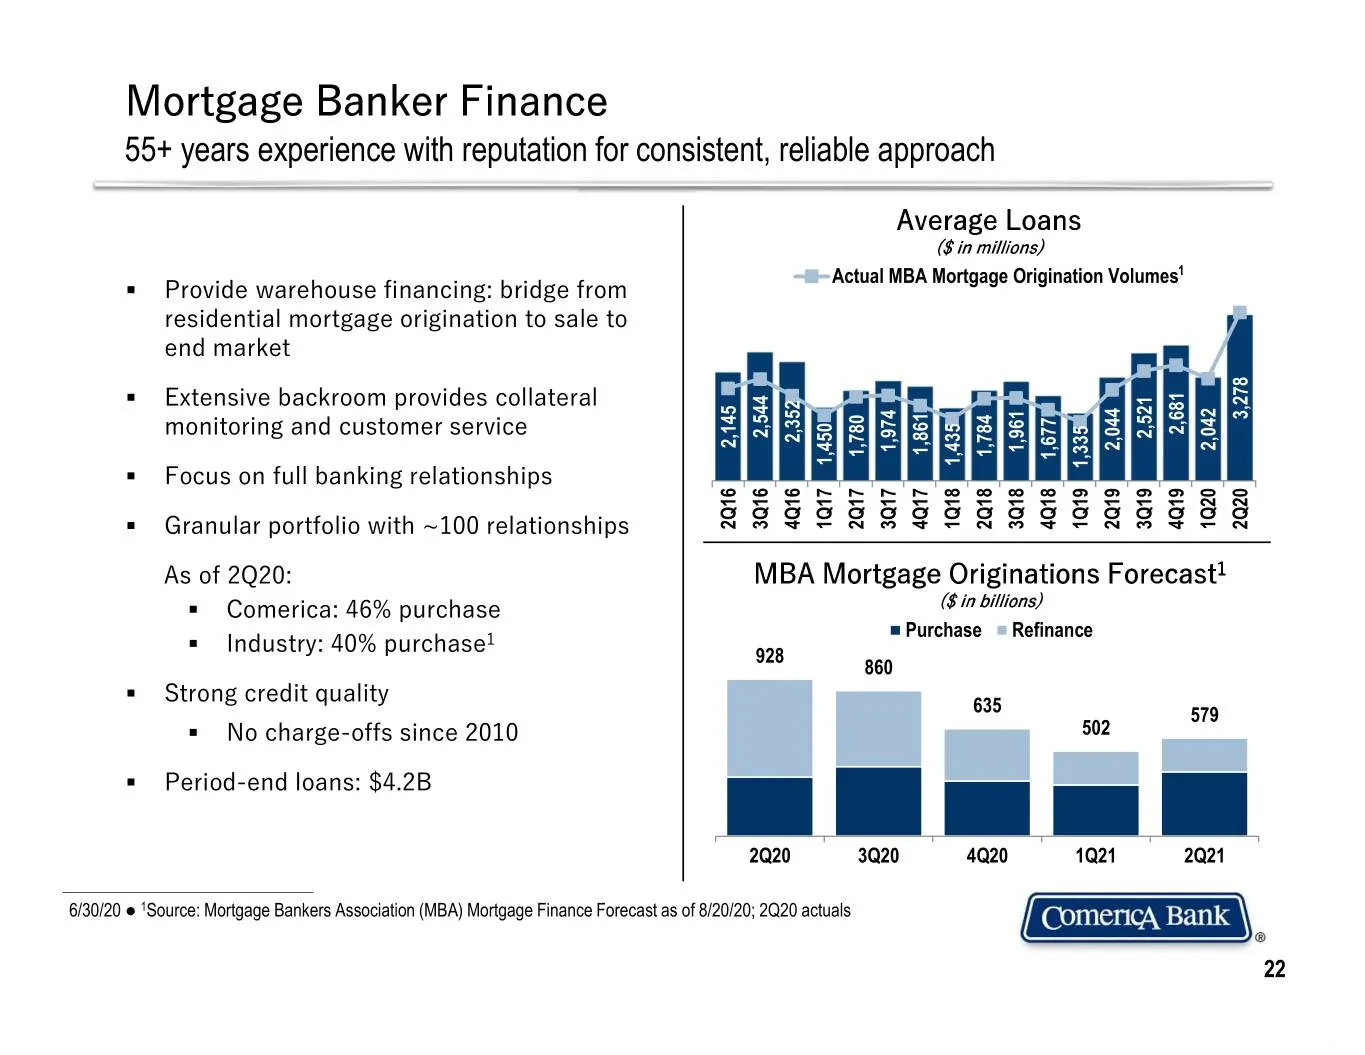
Mortgage Banker Finance 55+ years experience with reputation for consistent, reliable approach Average Loans ($ in millions) Actual MBA Mortgage Origination Volumes1 . Provide warehouse financing: bridge from 1000 residential mortgage origination to sale to 900 800 end market 700 600 500 . Extensive
Slide 23: Technology & Life Sciences
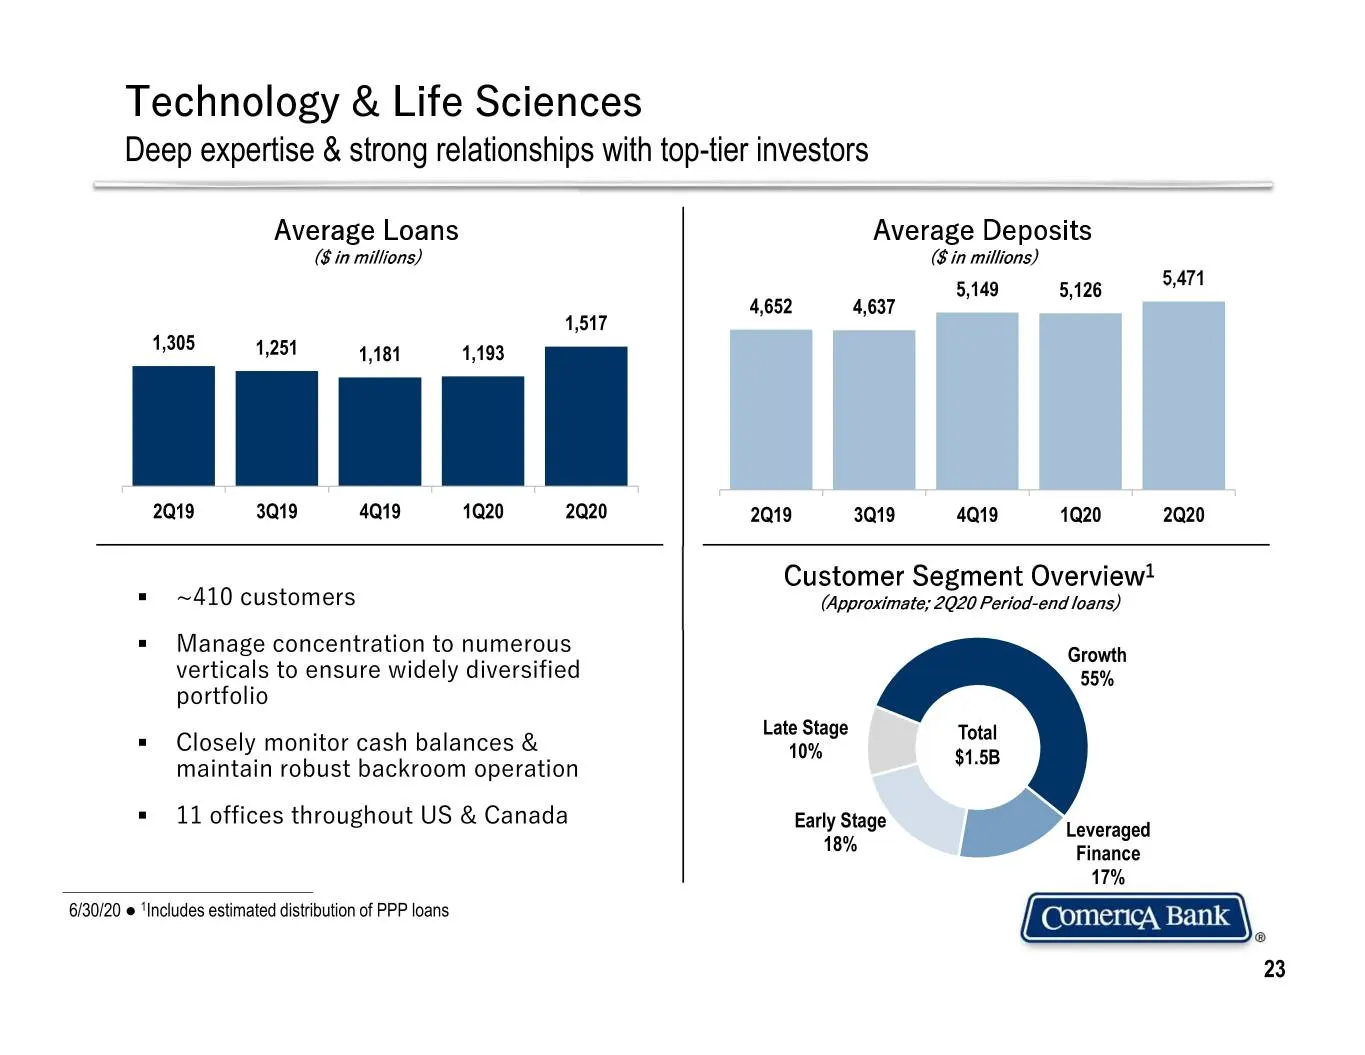
Technology & Life Sciences Deep expertise & strong relationships with top-tier investors Average Loans Average Deposits ($ in millions) ($ in millions) 5,471 5,149 5,126 4,652 4,637 1,517 1,305 1,251 1,181 1,193 2Q19 3Q19 4Q19 1Q20 2Q20 2Q19 3Q19 4Q19 1Q20 2Q20 Customer Segment Overview1 . ~410 cust
Slide 24: National Dealer Services
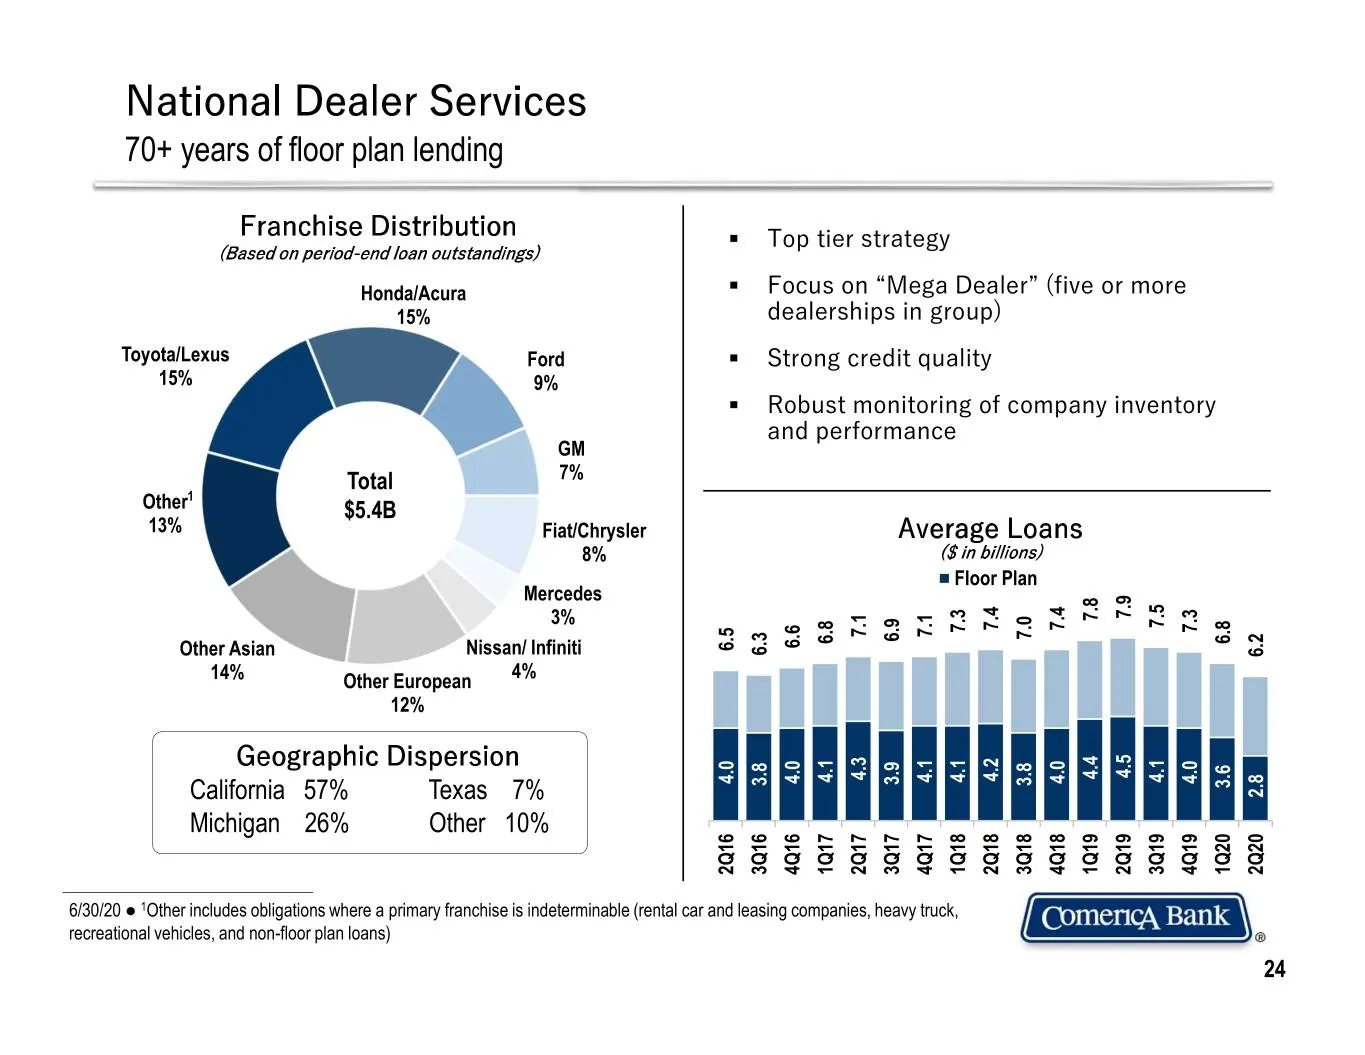
recreational recreational vehicles, and non-floor plan loans) 6/30/20 Toyota/Lexus 70+ years70+ of floor planlending National Dealer Services ● 1 Other Other includes obligations where primary a franchise is indeterminable (rental car and leasing companies, heavy truck, 13% 15% Other Other Asian 1 M
Slide 25: Equity Fund Services
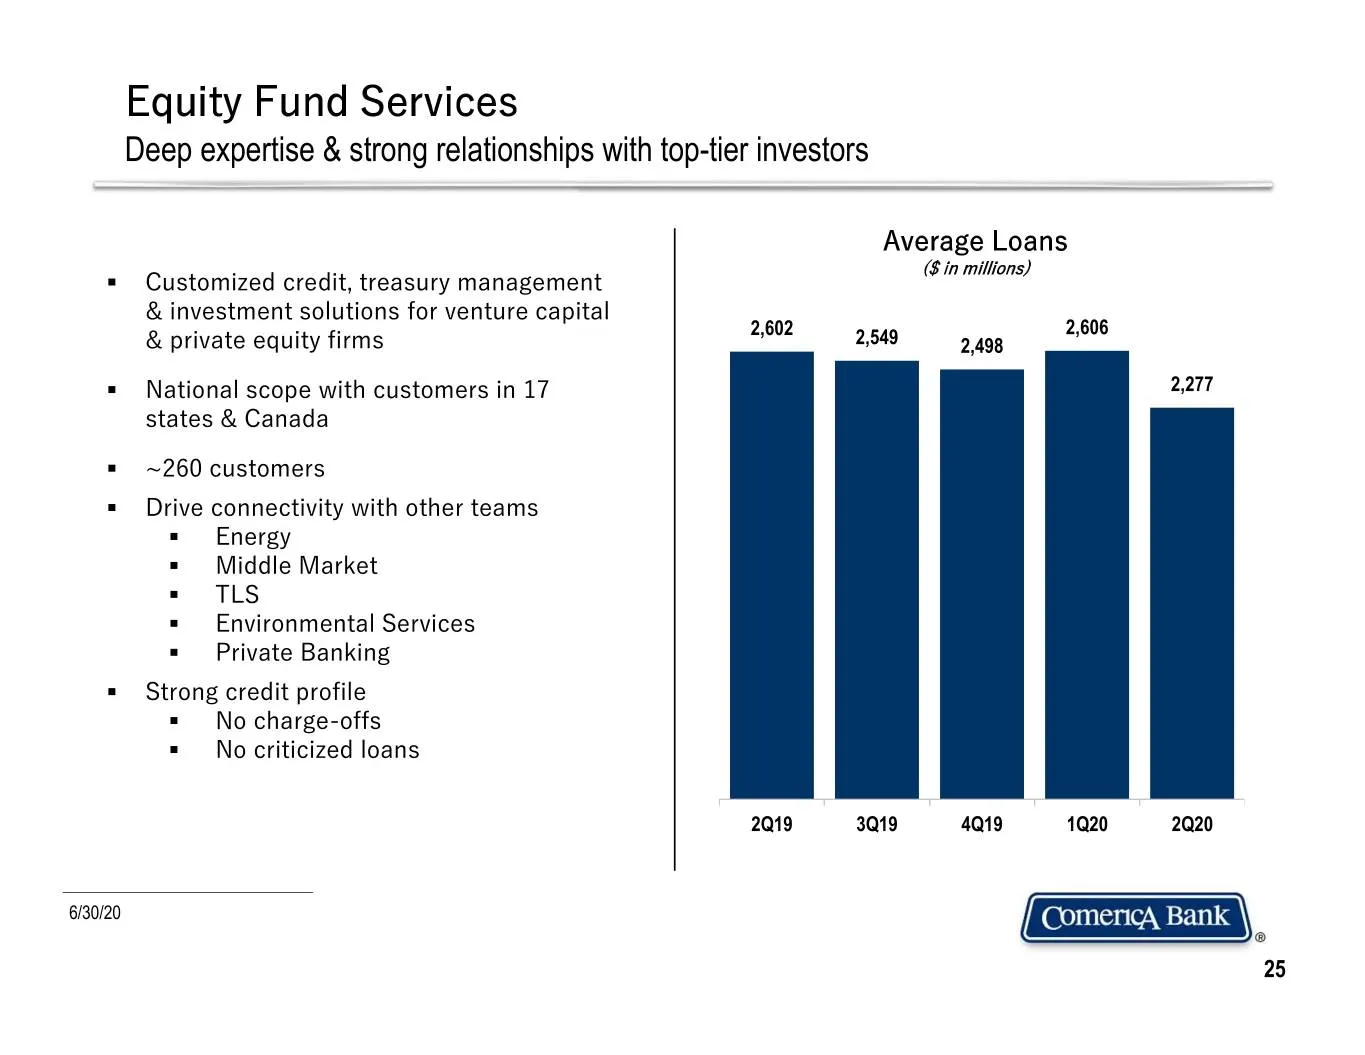
Equity Fund Services Deep expertise & strong relationships with top-tier investors Average Loans ($ in millions) . Customized credit, treasury management & investment solutions for venture capital 2,602 2,606 & private equity firms 2,549 2,498 . National scope with customers in 17 2,277 states & Can
Slide 26: Credit Quality
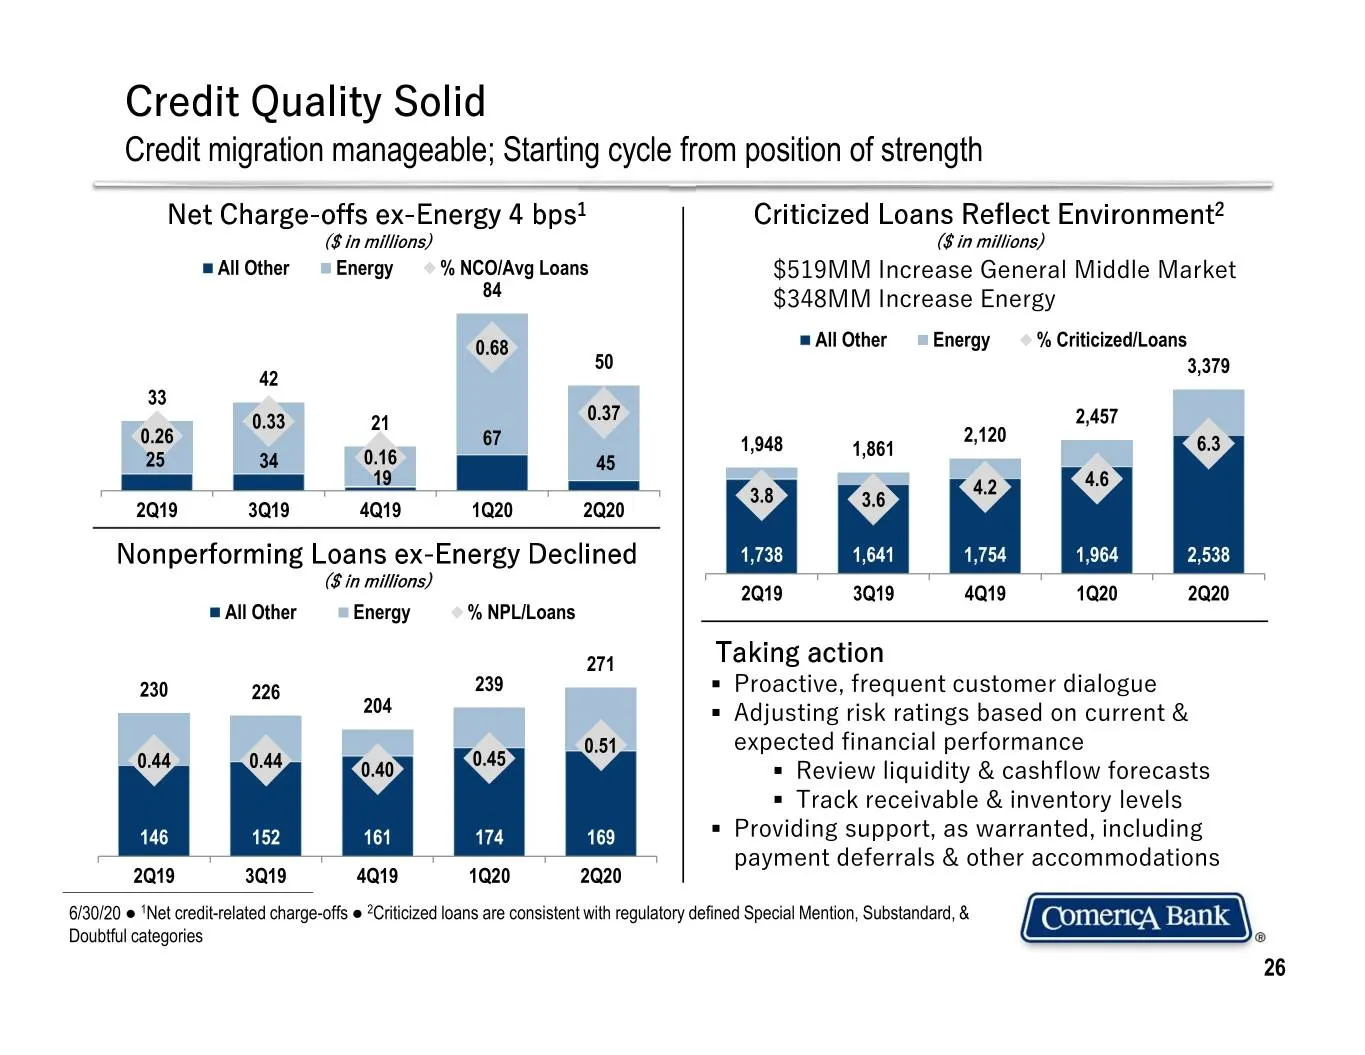
Credit Quality Solid Credit migration manageable; Starting cycle from position of strength Net Charge-offs ex-Energy 4 bps1 Criticized Loans Reflect Environment2 ($ in millions) ($ in millions) All Other Energy % NCO/Avg Loans 1.00 $519MM Increase General Middle Market 84 0.90 $348MM Increase Energy
Slide 27: Credit Quality
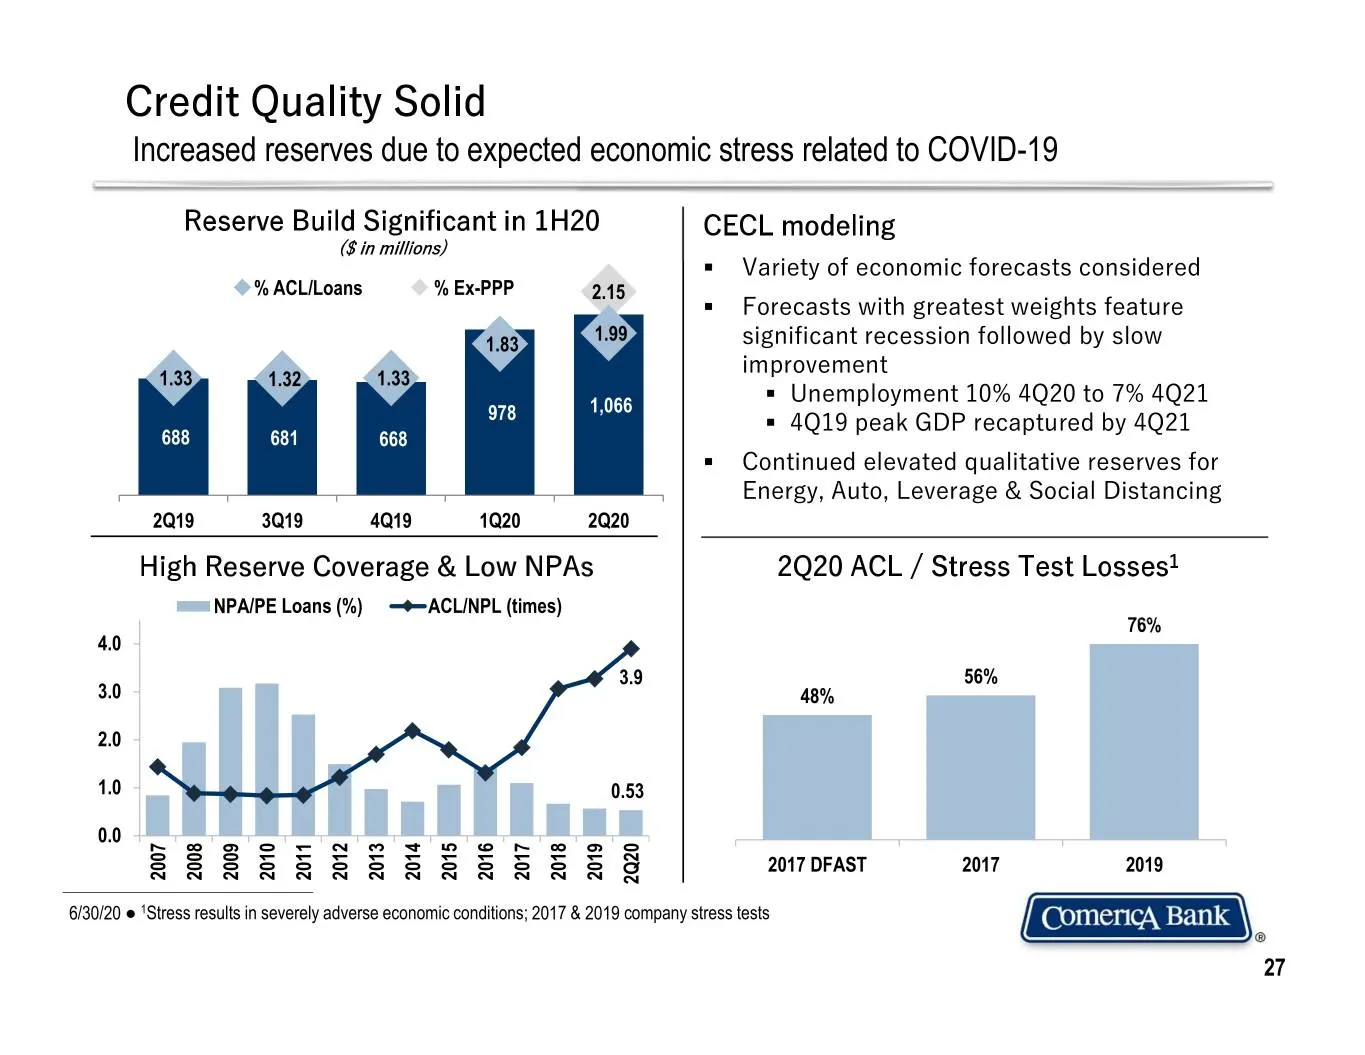
Credit Quality Solid Increased reserves due to expected economic stress related to COVID-19 Reserve Build Significant in 1H20 CECL modeling ($ in millions) . Variety of economic forecasts considered 1,200 % ACL/Loans % Ex-PPP 2.15 2.6 . Forecasts with greatest weights feature 1,000 1.99 2.1 1.83 sig
Slide 28: Securities Portfolio
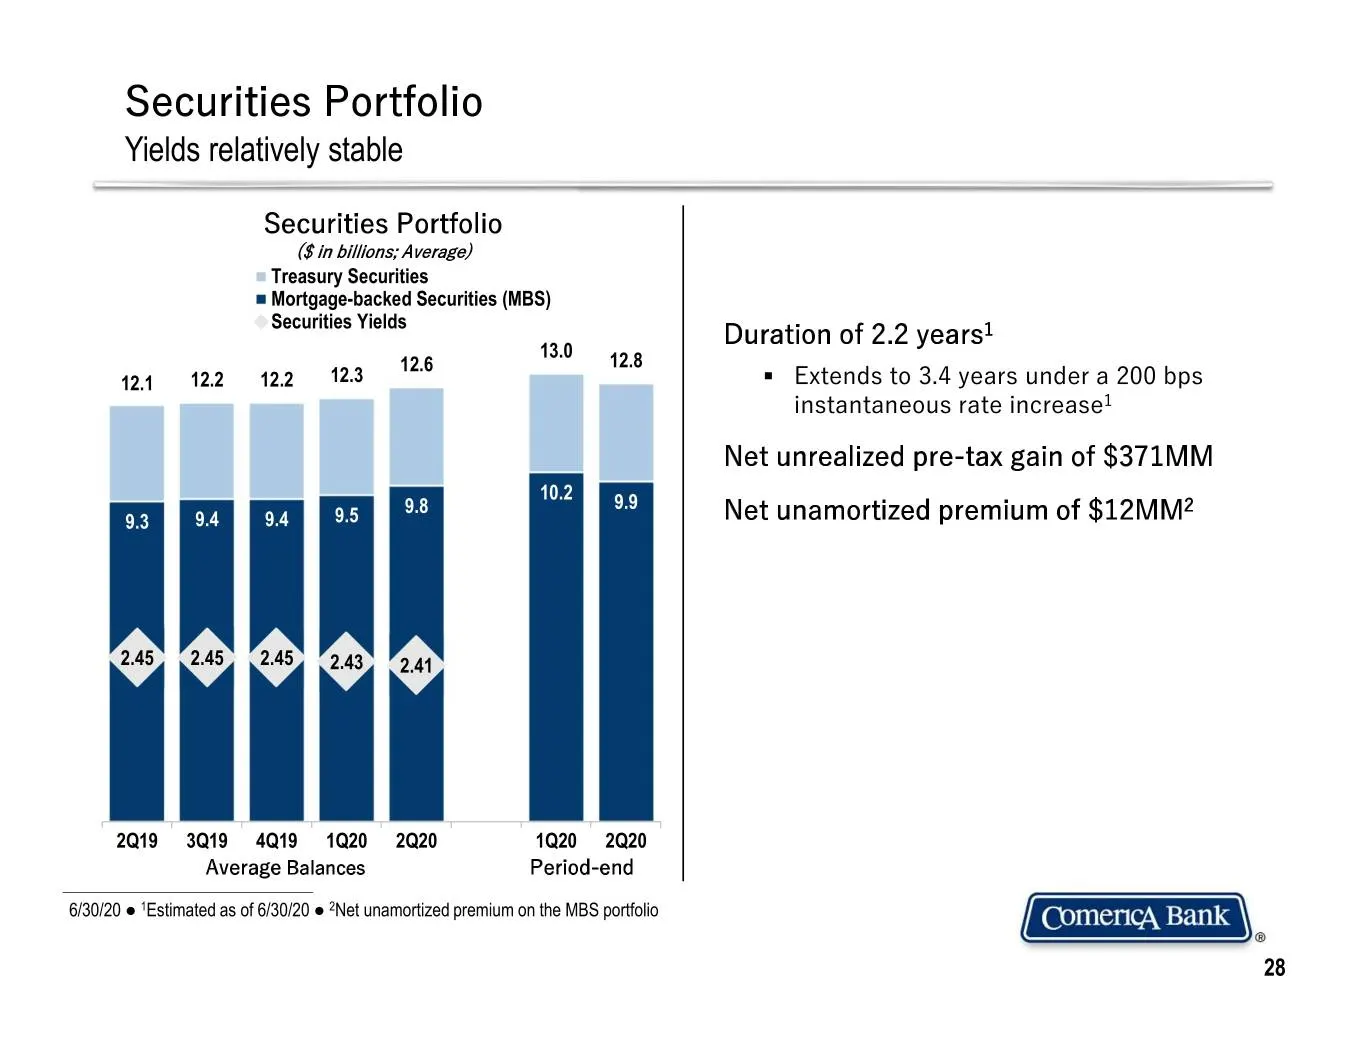
Securities Portfolio Yields relatively stable Securities Portfolio ($ in billions; Average) Treasury Securities Mortgage-backed Securities (MBS) Securities Yields 1 13.0 Duration of 2.2 years 12.6 12.8 12.1 12.2 12.2 12.3 . Extends to 3.4 years under a 200 bps instantaneous rate increase1 Net unreal
Slide 29: Net Interest Income
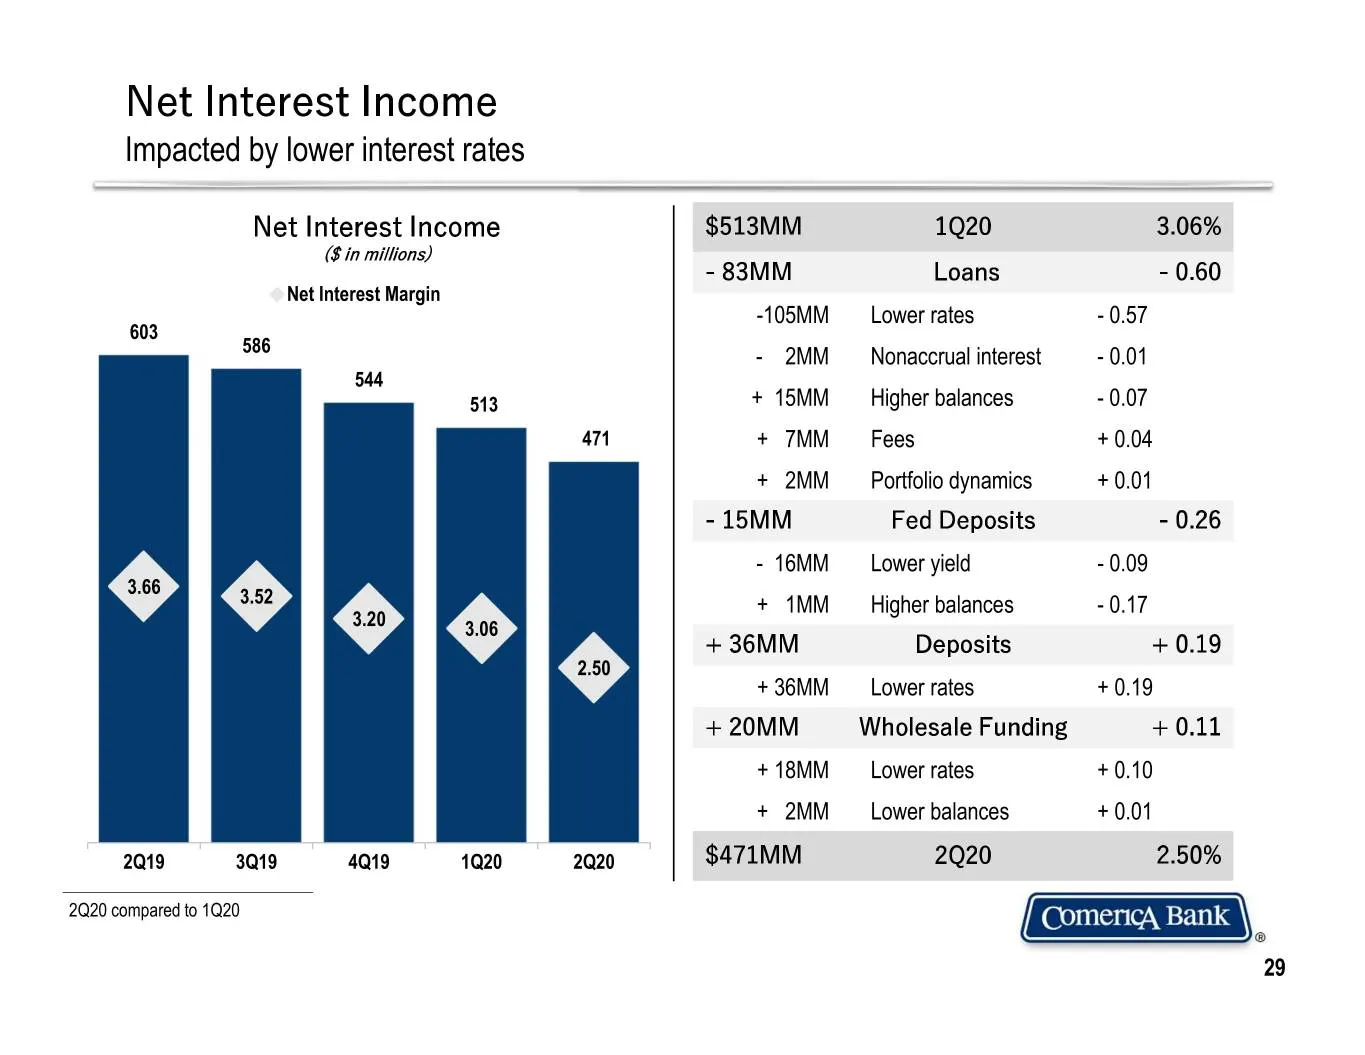
Net Interest Income Impacted by lower interest rates Net Interest Income $513MM 1Q20 3.06% ($ in millions) - 83MM Loans - 0.60 Net Interest Margin -105MM Lower rates - 0.57 603 586 - 2MM Nonaccrual interest - 0.01 544 513 + 15MM Higher balances - 0.07 471 + 7MM Fees + 0.04 + 2MM Portfolio dynamics +
Slide 30: Noninterest Income
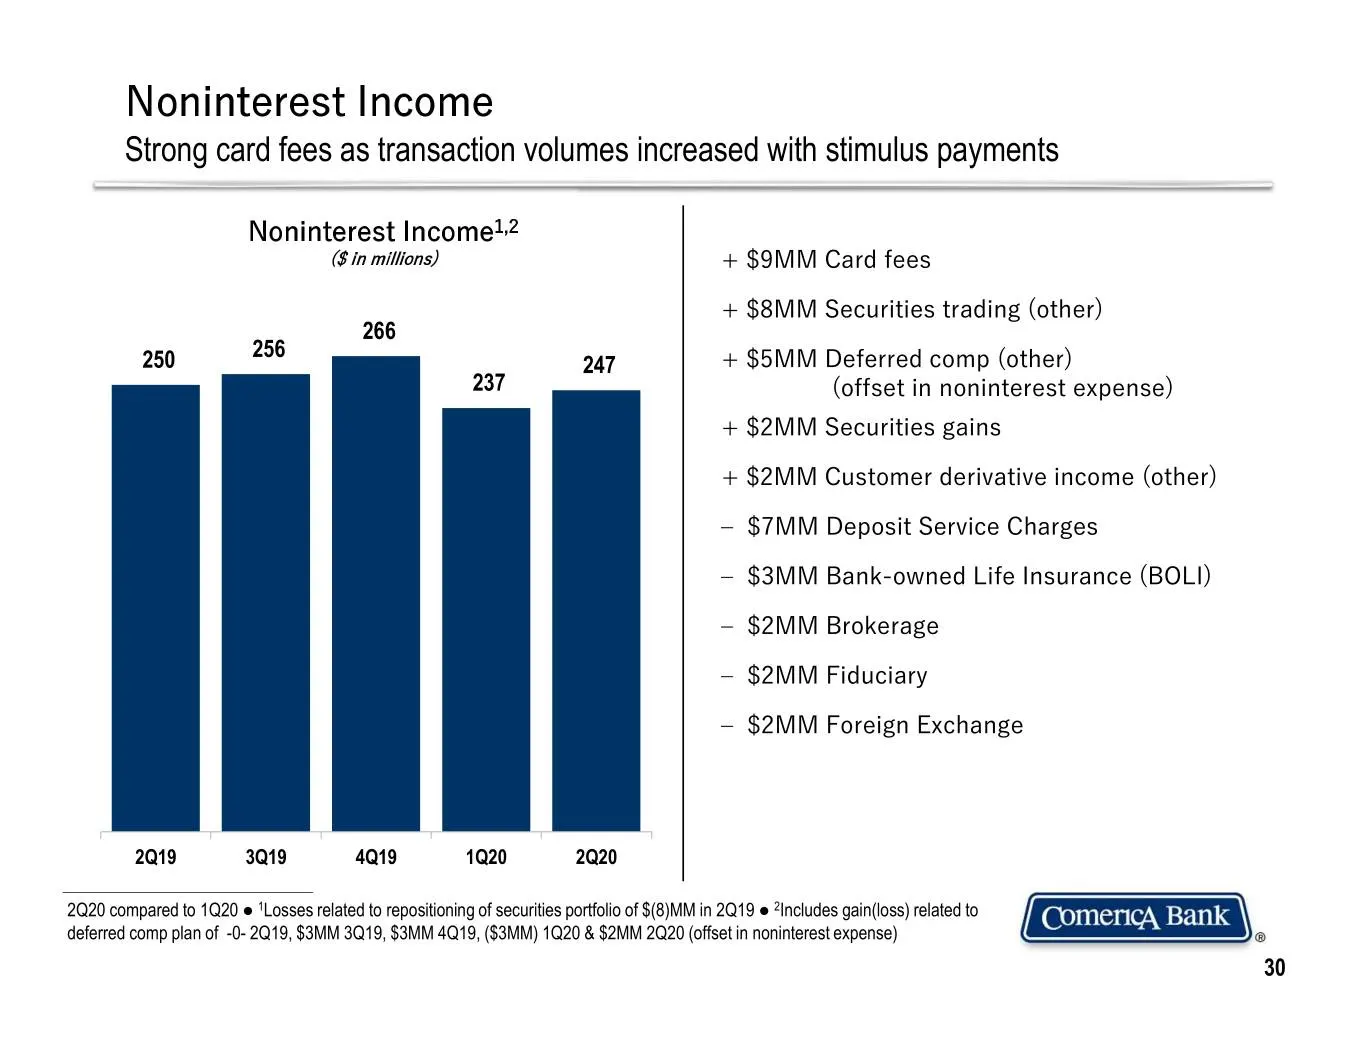
Noninterest Income Strong card fees as transaction volumes increased with stimulus payments Noninterest Income1,2 ($ in millions) + $9MM Card fees + $8MM Securities trading (other) 266 256 250 247 + $5MM Deferred comp (other) 237 (offset in noninterest expense) + $2MM Securities gains + $2MM Custome
Slide 31: Noninterest Expense
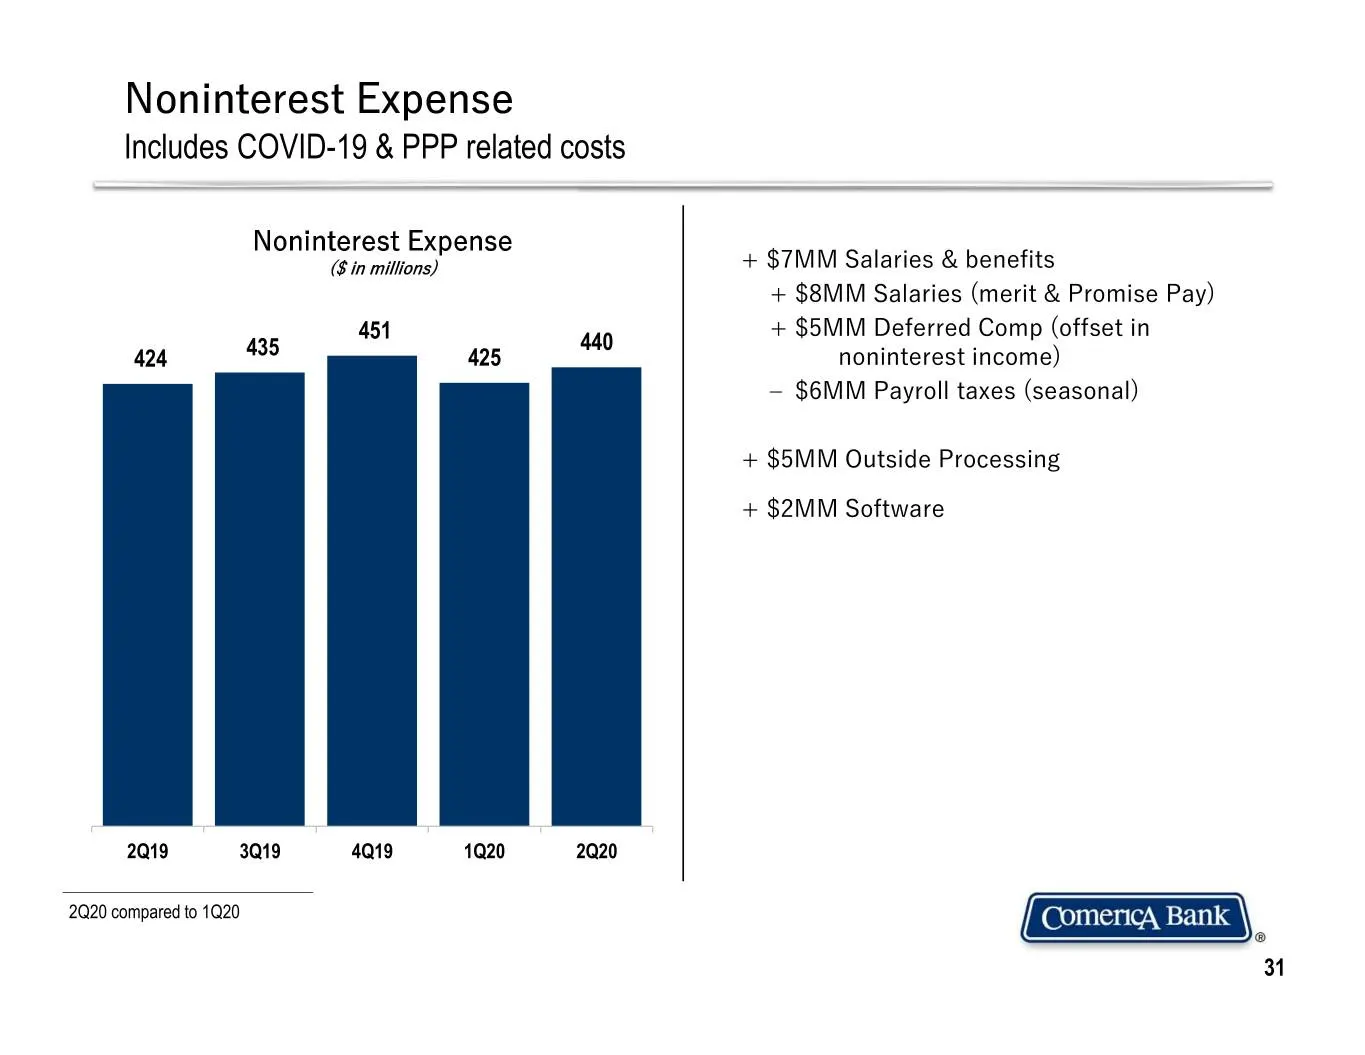
Noninterest Expense Includes COVID-19 & PPP related costs Noninterest Expense ($ in millions) + $7MM Salaries & benefits + $8MM Salaries (merit & Promise Pay) 451 440 + $5MM Deferred Comp (offset in 424 435 425 noninterest income) ‒ $6MM Payroll taxes (seasonal) + $5MM Outside Processing + $2MM Soft
Slide 32: Capital Management
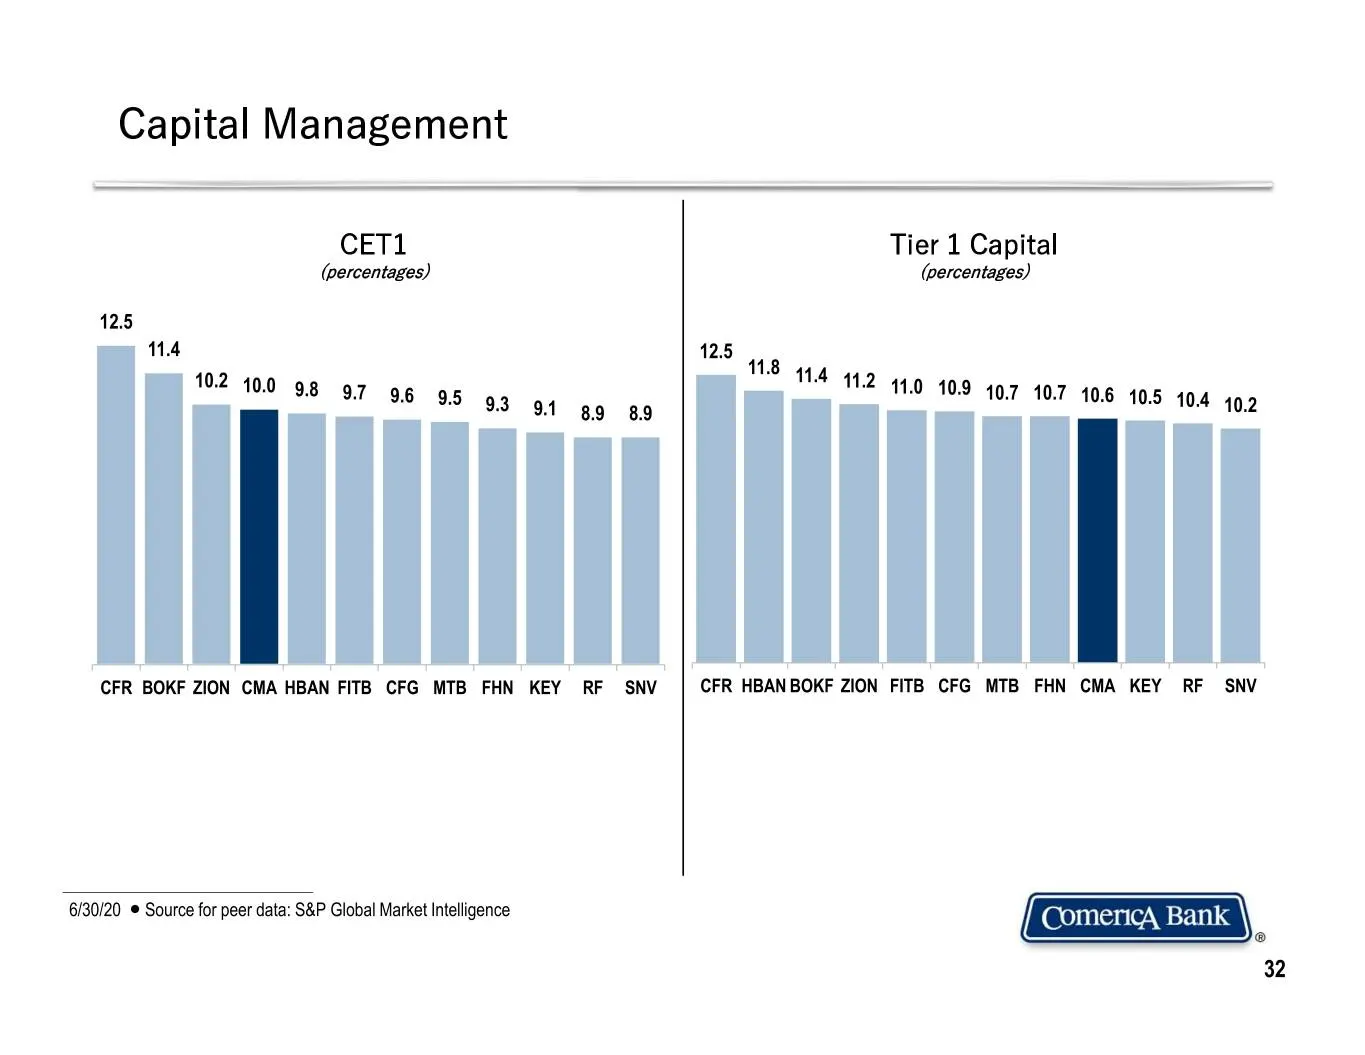
Capital Management CET1 Tier 1 Capital (percentages) (percentages) 12.5 11.4 12.5 11.8 11.4 10.2 10.0 9.8 11.2 11.0 10.9 9.7 9.6 9.5 10.7 10.7 10.6 10.5 10.4 9.3 9.1 8.9 8.9 10.2 CFR BOKF ZION CMA HBAN FITB CFG MTB FHN KEY RF SNV CFR HBAN BOKF ZION FITB CFG MTB FHN CMA KEY RF SNV 6/30/20 ● Source fo
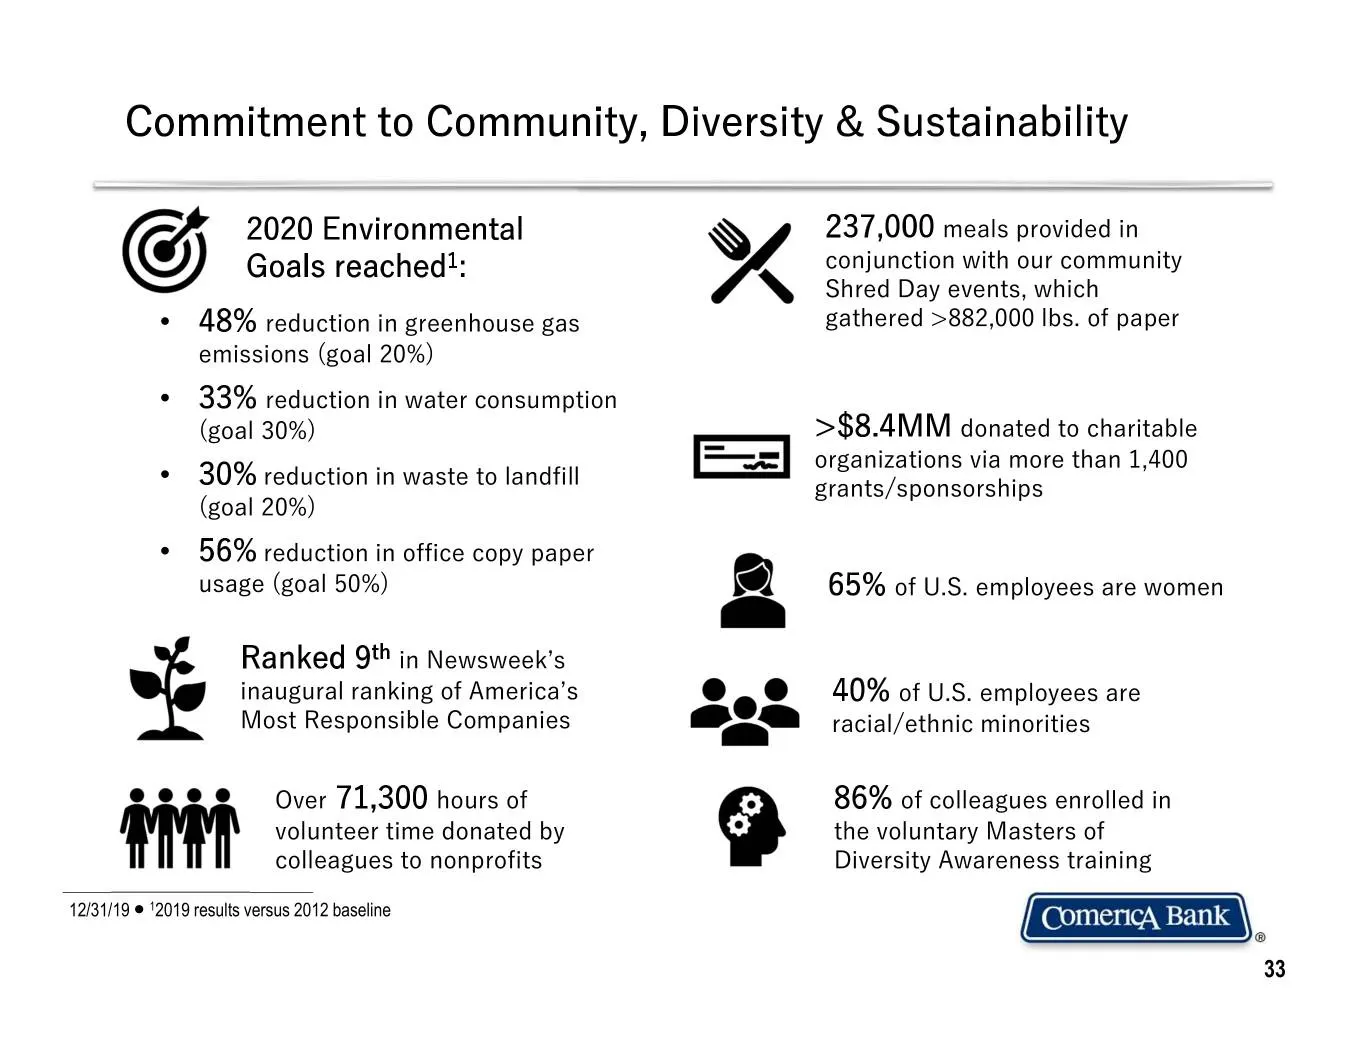
Slide 33: Commitment to Community, Diversity & Sustainability
Commitment to Community, Diversity & Sustainability 2020 Environmental 237,000 meals provided in Goals reached1: conjunction with our community Shred Day events, which • 48% reduction in greenhouse gas gathered >882,000 lbs. of paper emissions (goal 20%) • 33% reduction in water consumption (goal 30
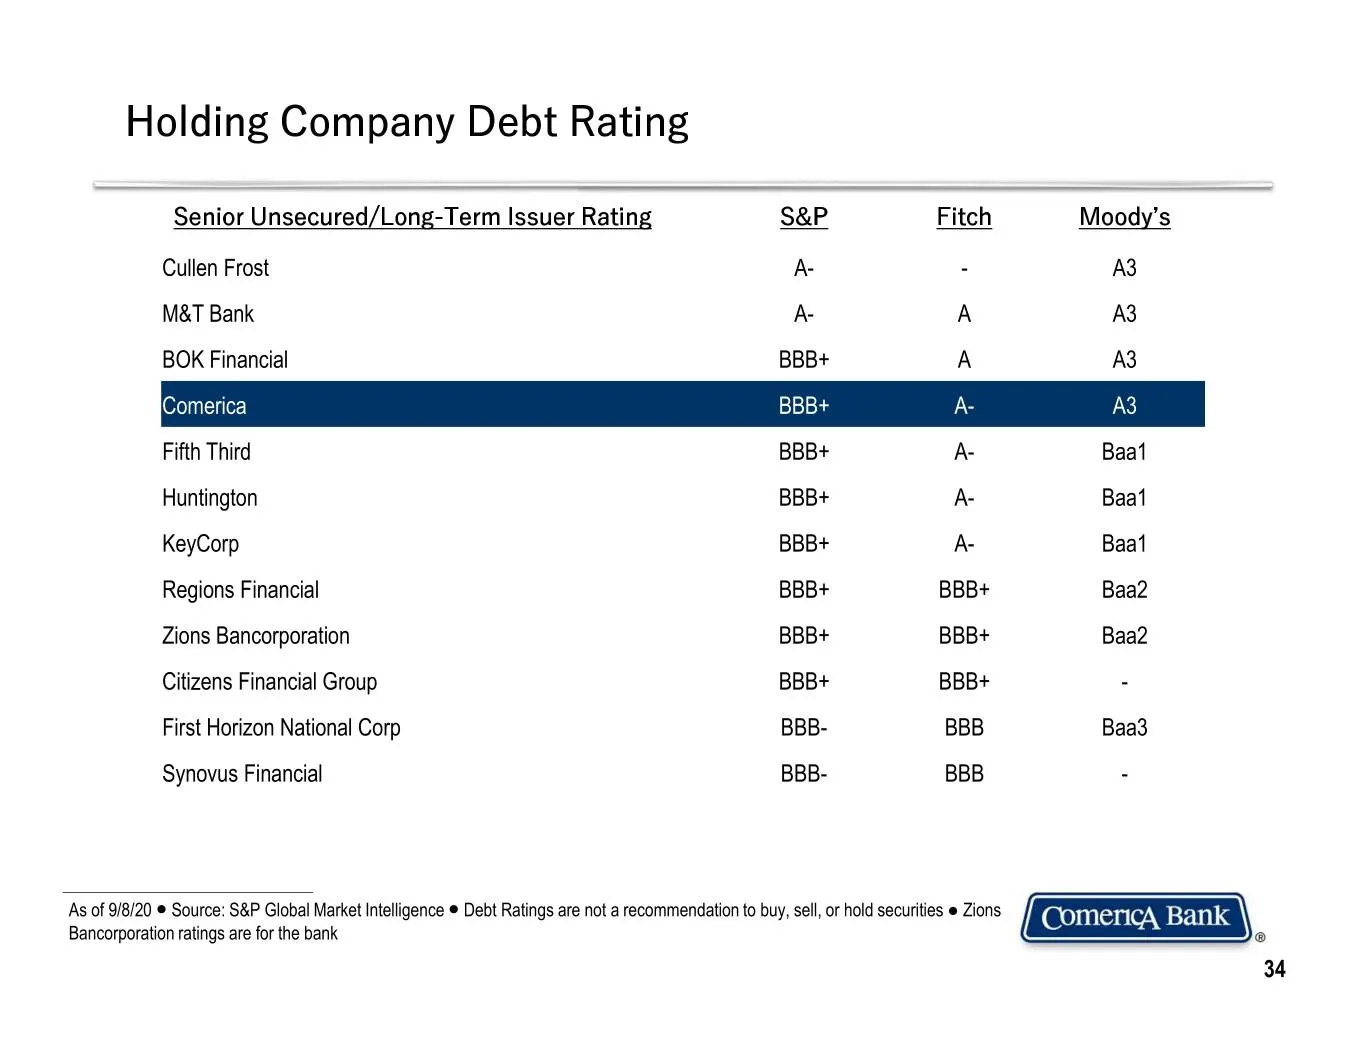
Slide 34: Holding Company Debt Rating
Holding Company Debt Rating Senior Unsecured/Long-Term Issuer Rating S&P Fitch Moody’s Cullen Frost A- - A3 M&T Bank A- A A3 BOK Financial BBB+ A A3 Comerica BBB+ A- A3 Fifth Third BBB+ A- Baa1 Huntington BBB+ A- Baa1 KeyCorp BBB+ A- Baa1 Regions Financial BBB+ BBB+ Baa2 Zions Bancorporation BBB+ BB
Source: SEC EDGAR · 8-K filed Sep 11, 2020
More decks from Comerica Incorporated
 Goldman Sachs Financial Services Conference 202520 slides · Dec 11, 2025
 Merger or Acquisition (October 2025)18 slides · Oct 6, 2025
 Barclays Global Financial Services Conference 202524 slides · Sep 8, 2025
 Q2 2025 Earnings Presentation24 slides · Jul 18, 2025
 Q1 2025 Earnings Presentation21 slides · Apr 21, 2025
 Q4 2024 Earnings Presentation24 slides · Jan 22, 2025