Sun Healthcare — Merger or Acquisition (May 2005)
33 slides from Sun Healthcare's merger presentation, May 17, 2005
Slide 1: A Healthcare Services Company Presentation to Investors
A Healthcare Services Company Presentation to Investors New York, NY May 17, 2005
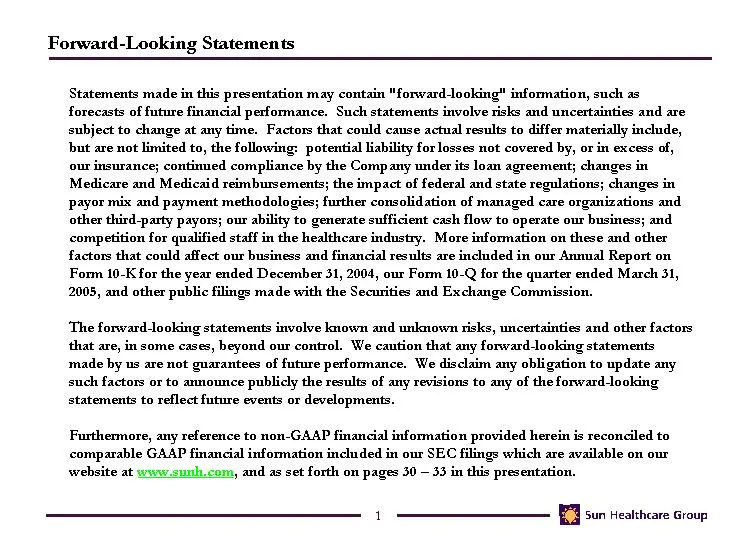
Slide 2: Forward-Looking Statements
Forward-Looking Statements Statements made in this presentation may contain "forward-looking" information, such as forecasts of future financial performance. Such statements involve risks and uncertainties and are subject to change at any time. Factors that could cause actual results to differ mater
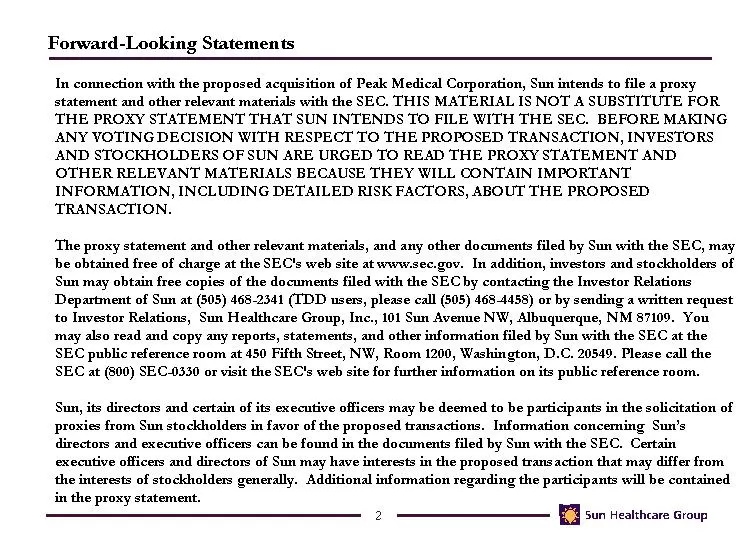
Slide 3: Forward-Looking Statements (Peak acquisition proxy)
Forward-Looking Statements In connection with the proposed acquisition of Peak Medical Corporation, Sun intends to file a proxy statement and other relevant materials with the SEC. THIS MATERIAL IS NOT A SUBSTITUTE FOR THE PROXY STATEMENT THAT SUN INTENDS TO FILE WITH THE SEC. BEFORE MAKING ANY VOTI
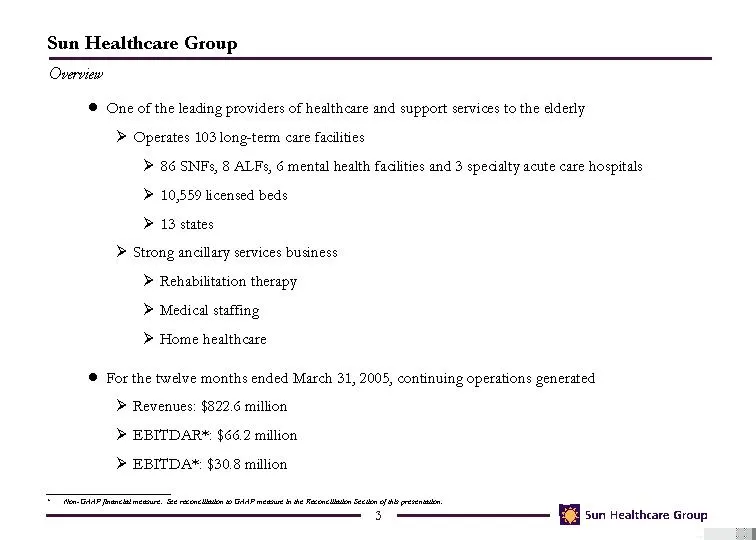
Slide 4: Sun Healthcare Group Overview
Sun Healthcare Group One of the leading providers of healthcare and support services to the elderly Operates 103 long-term care facilities 86 SNFs, 8 ALFs, 6 mental health facilities and 3 specialty acute care hospitals 10,559 licensed beds 13 states Strong ancillary services business Rehabilitation
Slide 5: Company Map
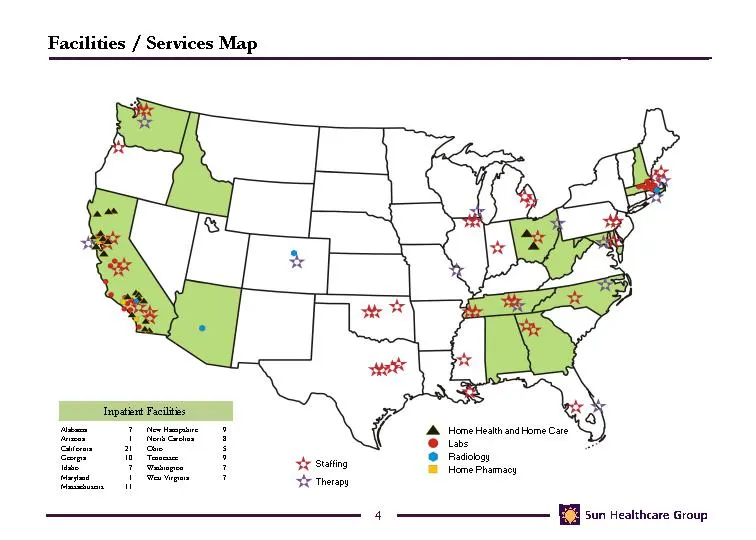
Company Map Facilities / Services Map Inpatient Facilities Alabama 7 New Hampshire 9 Arizona 1 North Carolina 8 California 21 Ohio 5 Georgia 10 Tennessee 9 Idaho 7 Washington 7 Maryland 1 West Virginia 7 Massachusetts 11 Staffing Therapy Home Health and Home Care Labs Radiology Home Pharmacy
Slide 6: Segment Revenues LTM March 31, 2005
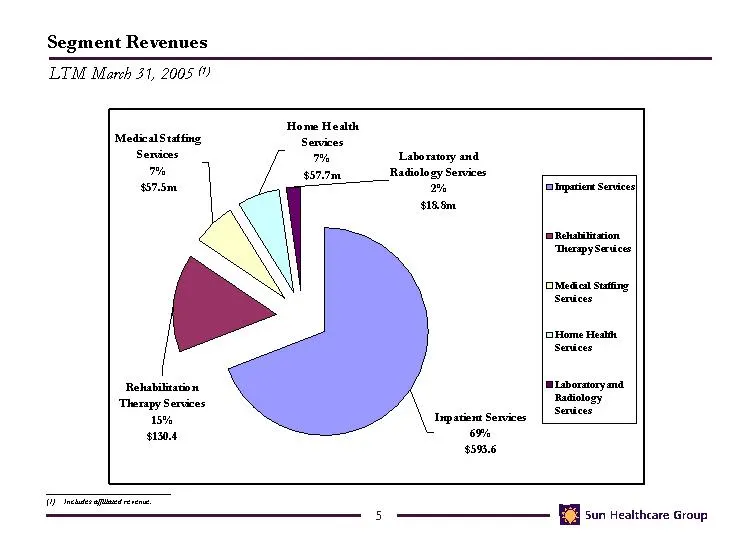
Segment Revenues LTM March 31, 2005 (1) (1) Includes affiliated revenue.
Slide 7: SunBridge Overview
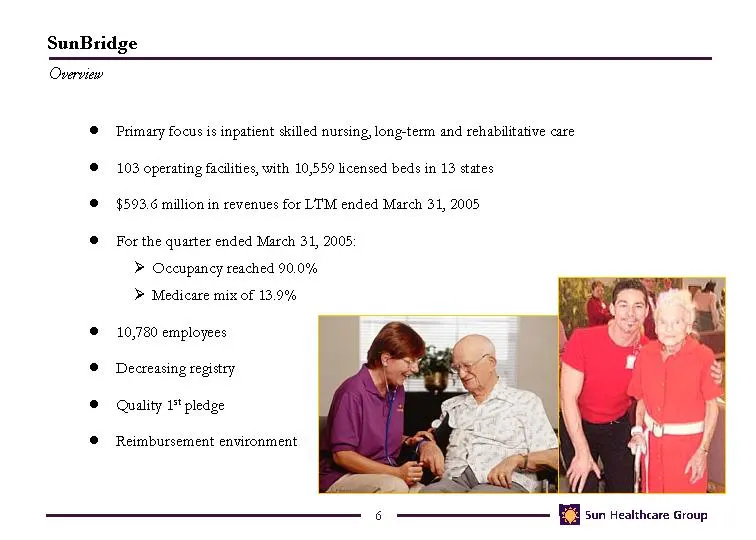
SunBridge Overview Primary focus is inpatient skilled nursing, long-term and rehabilitative care 103 operating facilities, with 10,559 licensed beds in 13 states $593.6 million in revenues for LTM ended March 31, 2005 For the quarter ended March 31, 2005: Occupancy reached 90.0% Medicare mix of 13.9
Slide 8: SunBridge Strategy
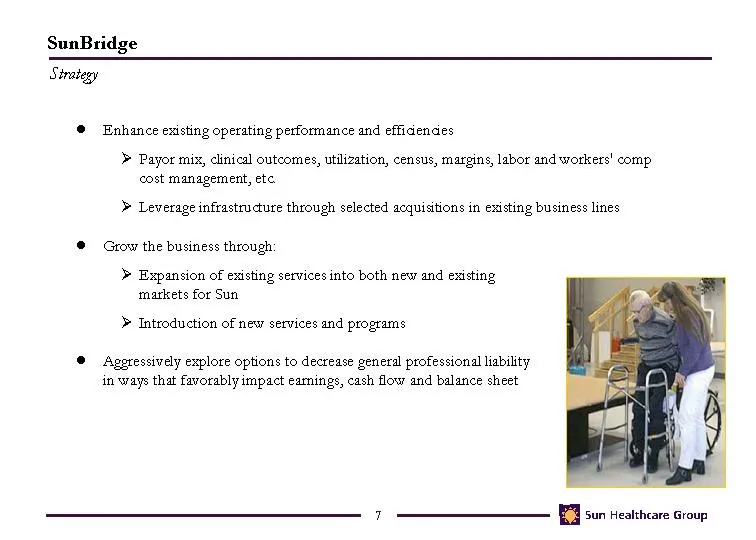
SunBridge Strategy Enhance existing operating performance and efficiencies Payor mix, clinical outcomes, utilization, census, margins, labor and workers' comp cost management, etc. Leverage infrastructure through selected acquisitions in existing business lines Grow the business through: Expansion o
Slide 9: SunDance Overview
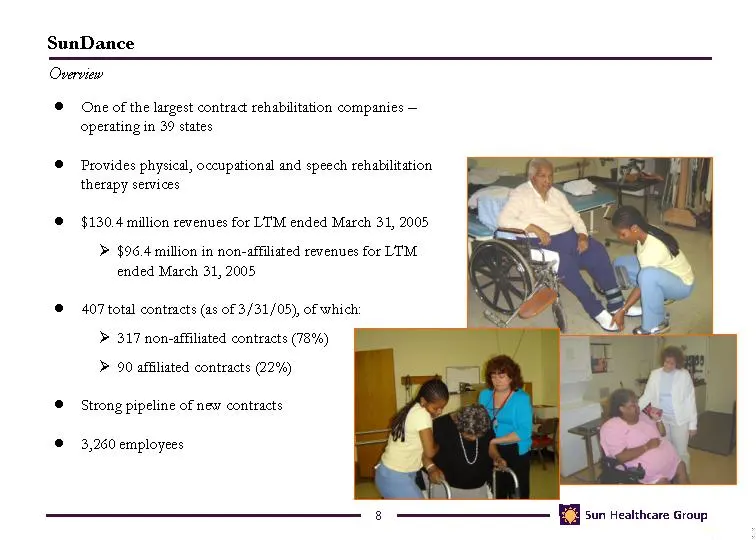
One of the largest contract rehabilitation companies - operating in 39 states Provides physical, occupational and speech rehabilitation therapy services $130.4 million revenues for LTM ended March 31, 2005 $96.4 million in non-affiliated revenues for LTM ended March 31, 2005 407 total contracts (as
Slide 10: CareerStaff Overview
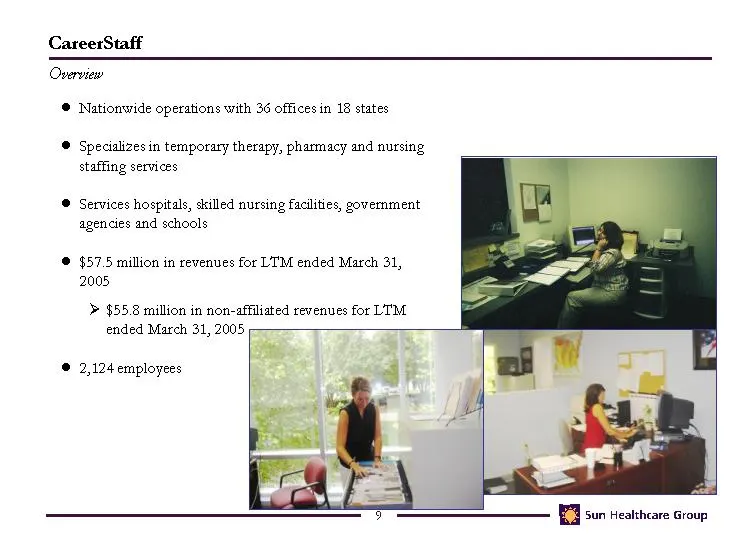
Nationwide operations with 36 offices in 18 states Specializes in temporary therapy, pharmacy and nursing staffing services Services hospitals, skilled nursing facilities, government agencies and schools $57.5 million in revenues for LTM ended March 31, 2005 $55.8 million in non-affiliated revenues
Slide 11: SunPlus Overview
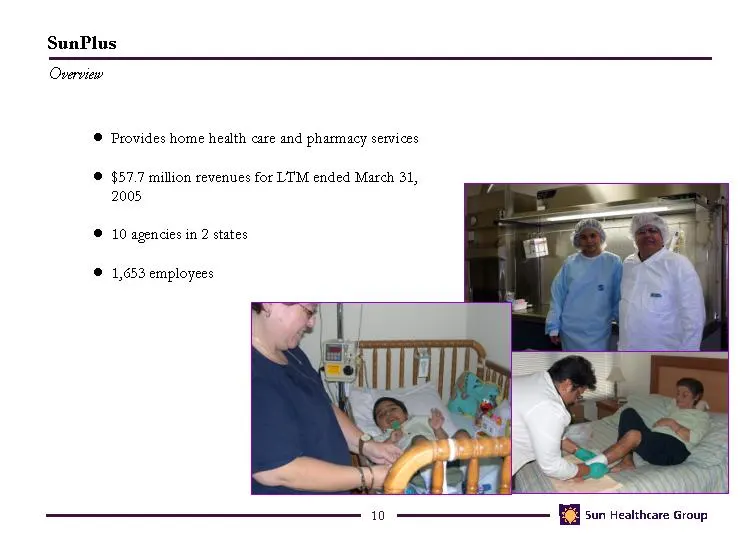
Provides home health care and pharmacy services $57.7 million revenues for LTM ended March 31, 2005 10 agencies in 2 states 1,653 employees SunPlus Overview
Slide 12: Break Through Story
Break Through Story Restructuring Substantially Complete Only 2 more facilities targeted for disposition Improving Operations Since 2002, substantial year-over-year increases in revenues, EBITDAR and EBITDA Reducing Overhead Focused on process improvement Controlling Risks Declining number of claims
Slide 13: Restructuring Substantially Complete
Restructuring Substantially Complete Management has executed a structural, operational and financial turnaround In 2004, completed year-long portfolio restructuring during which it reduced portfolio from 243 facilities to the 103 today Issued a $56 million secondary offering in February 2004 2005 ma
Slide 14: Improving Operations: Occupancy
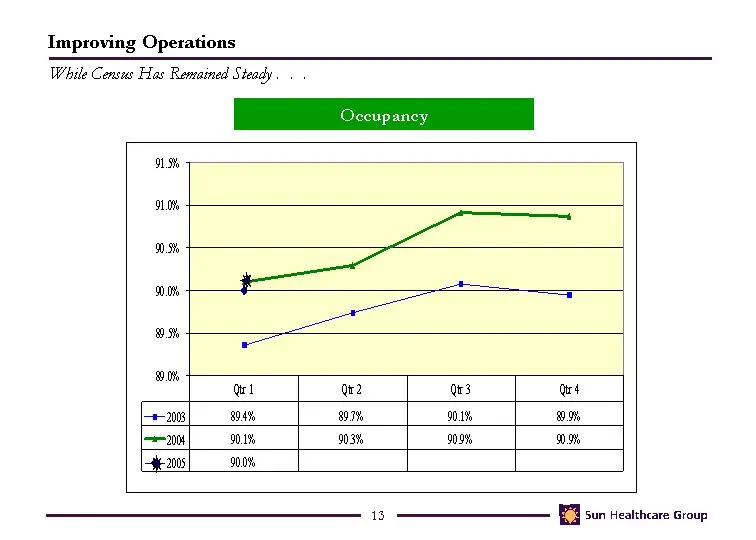
Improving Operations While Census Has Remained Steady . . . Occupancy
Slide 15: Improving Operations: Medicare Mix
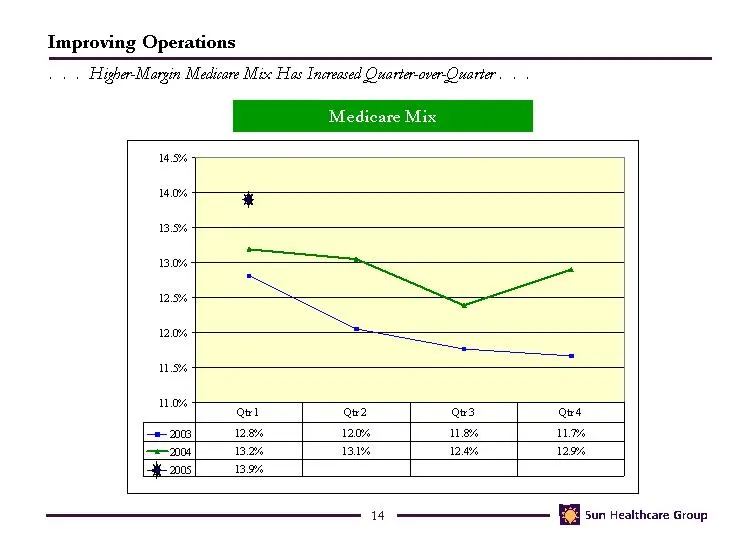
Improving Operations .. . . Higher-Margin Medicare Mix Has Increased Quarter-over-Quarter . . . Medicare Mix
Slide 16: Improving Operations: Medicare Revenues
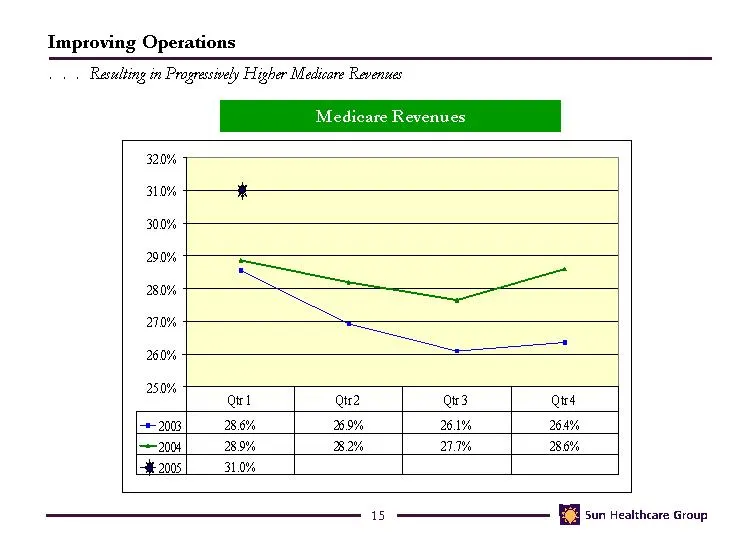
Improving Operations .. . . Resulting in Progressively Higher Medicare Revenues Medicare Revenues
Slide 17: Reducing Overhead
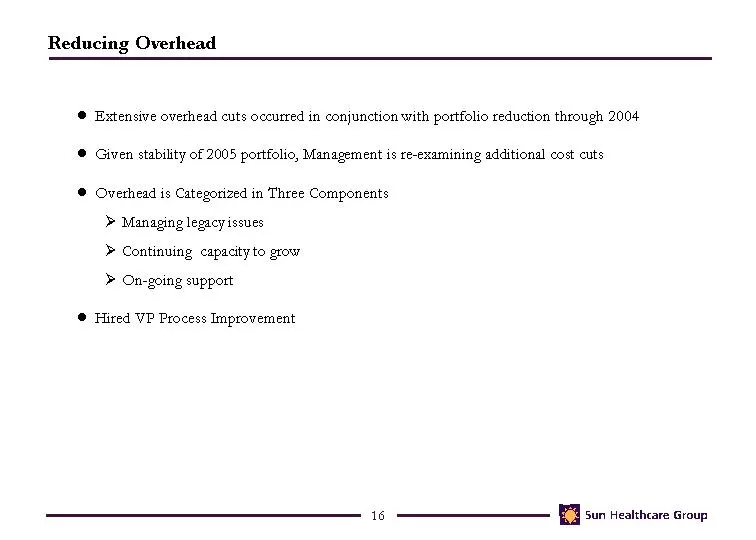
Reducing Overhead Extensive overhead cuts occurred in conjunction with portfolio reduction through 2004 Given stability of 2005 portfolio, Management is re-examining additional cost cuts Overhead is Categorized in Three Components Managing legacy issues Continuing capacity to grow On-going support H
Slide 18: Controlling Risks
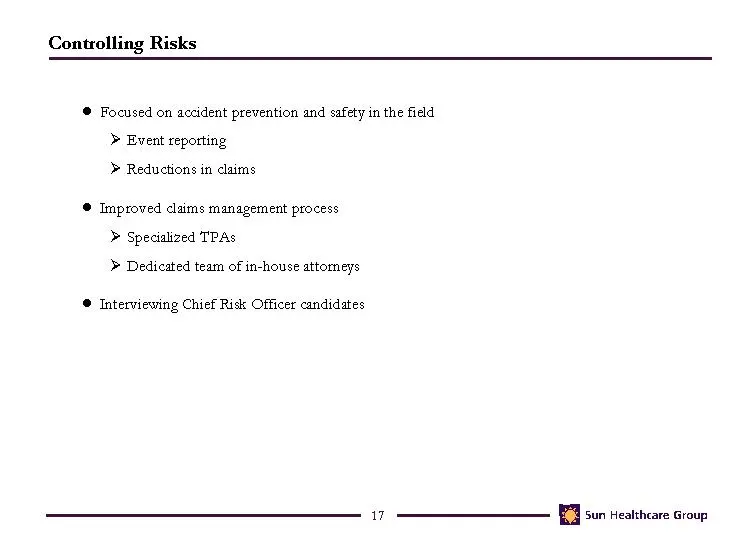
Controlling Risks Focused on accident prevention and safety in the field Event reporting Reductions in claims Improved claims management process Specialized TPAs Dedicated team of in-house attorneys Interviewing Chief Risk Officer candidates
Slide 19: Management Team
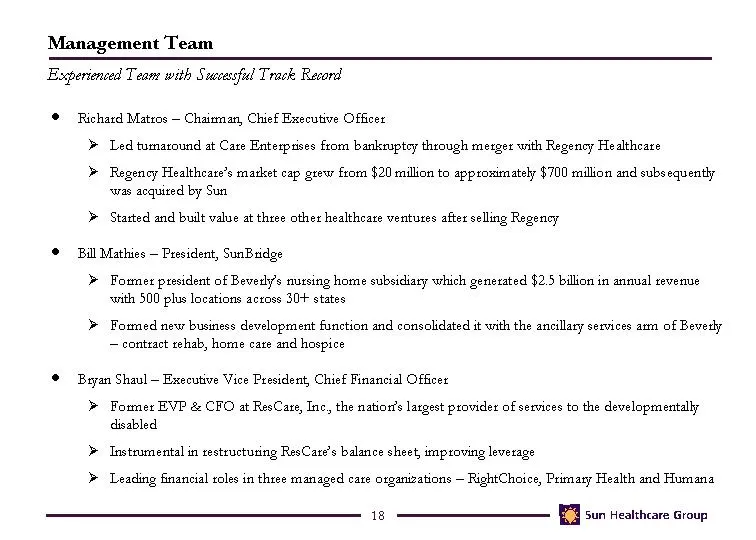
Management Team Experienced Team with Successful Track Record Richard Matros - Chairman, Chief Executive Officer Led turnaround at Care Enterprises from bankruptcy through merger with Regency Healthcare Regency Healthcare's market cap grew from $20 million to approximately $700 million and subsequen
Slide 20: Poised for Growth
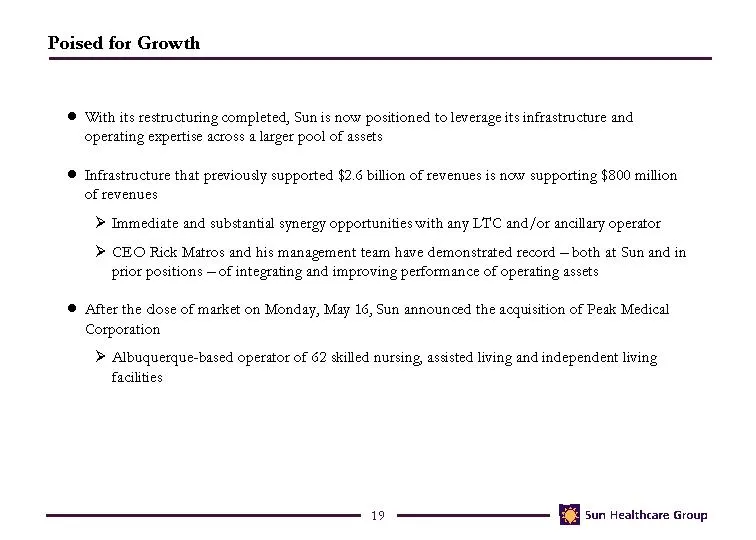
Poised for Growth With its restructuring completed, Sun is now positioned to leverage its infrastructure and operating expertise across a larger pool of assets Infrastructure that previously supported $2.6 billion of revenues is now supporting $800 million of revenues Immediate and substantial syner
Slide 21: Peak Overview
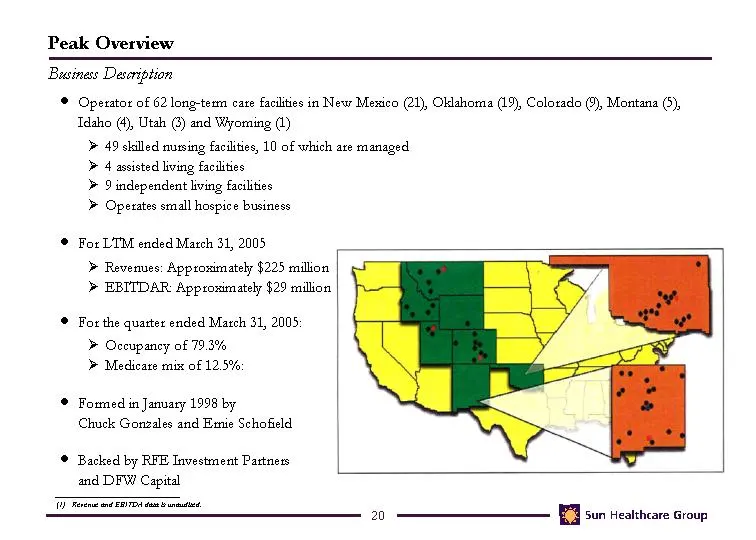
Peak Overview Business Description Operator of 62 long-term care facilities in New Mexico (21), Oklahoma (19), Colorado (9), Montana (5), Idaho (4), Utah (3) and Wyoming (1) 49 skilled nursing facilities, 10 of which are managed 4 assisted living facilities 9 independent living facilities Operates s
Slide 22: Compelling Rationale for Peak Acquisition
Compelling Rationale for Peak Acquisition Swift, meaningful step to accelerate growth plan Diversification into new states Accretive transaction Synergies Overlapping Albuquerque back-office operations Larger, more leverageable asset / earnings base Leverages industry-leading EBITDAR multiple
Slide 23: Transaction Summary
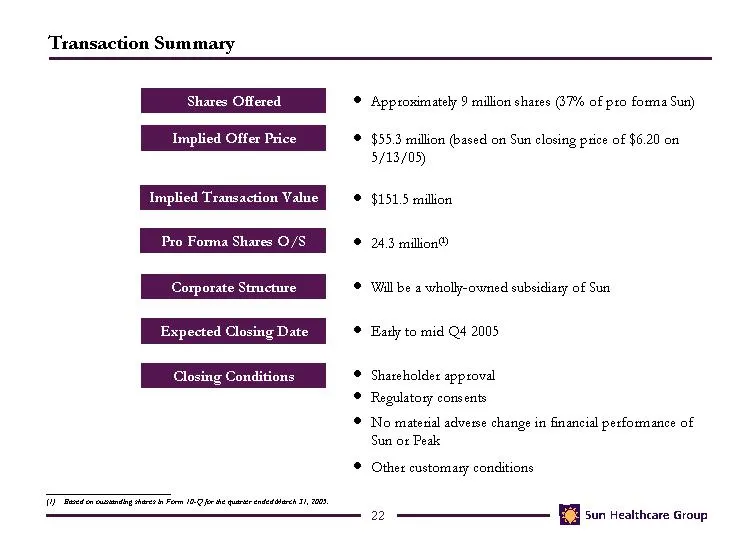
Transaction Summary Approximately 9 million shares (37% of pro forma Sun) $55.3 million (based on Sun closing price of $6.20 on 5/13/05) $151.5 million 24.3 million(1) Will be a wholly-owned subsidiary of Sun Early to mid Q4 2005 Shareholder approval Regulatory consents No material adverse change in
Slide 24: Financials
Financials
Slide 25: Financial Overview: Net Revenues
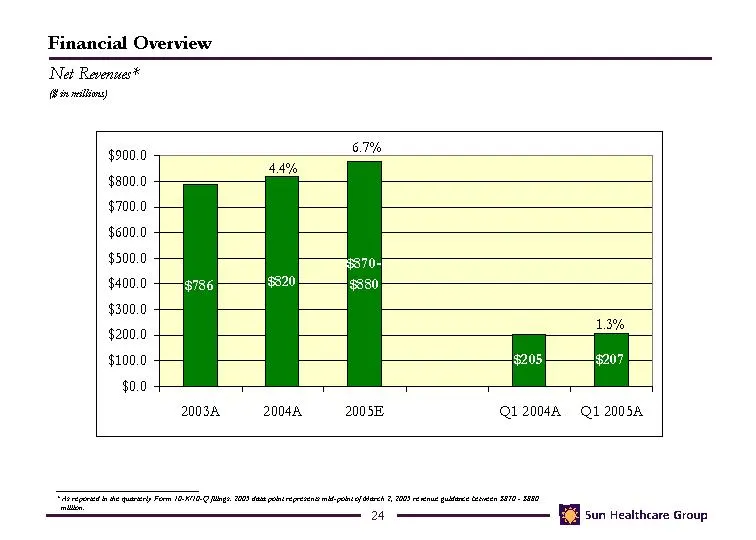
Net Revenues* Financial Overview Net Revenues* ($ in millions) * As reported in the quarterly Form 10-K/10-Q filings. 2005 data point represents mid-point of March 2, 2005 revenue guidance between $870 - $880 million.
Slide 26: Financial Overview: EBITDAR - Normalized
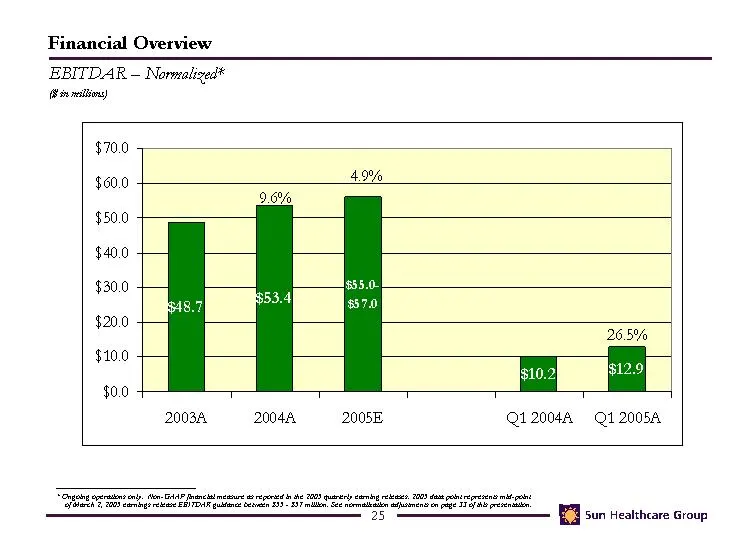
EBITDAR - Normalized* ($ in millions) * Ongoing operations only. Non-GAAP financial measure as reported in the 2005 quarterly earning releases. 2005 data point represents mid-point of March 2, 2005 earnings release EBITDAR guidance between $55 - $57 million. See normalization adjustments on page 33
Slide 27: Financial Overview: EBITDA - Normalized
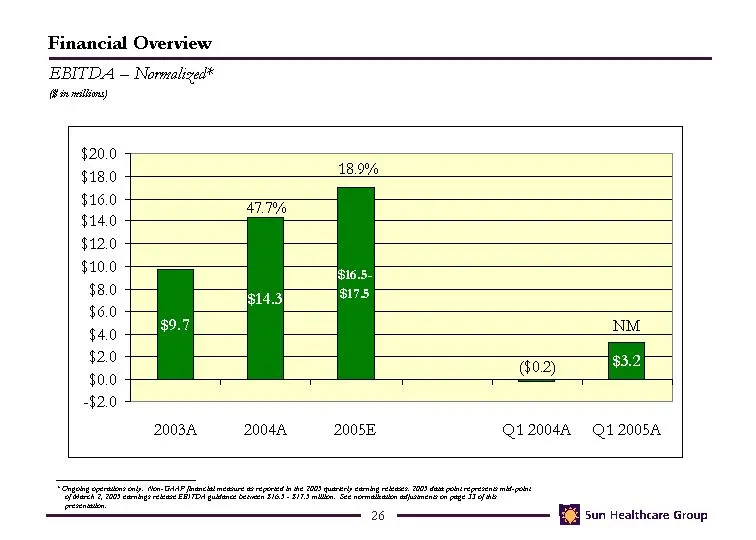
EBITDA - Normalized* ($ in millions) Financial Overview * Ongoing operations only. Non-GAAP financial measure as reported in the 2005 quarterly earning releases. 2005 data point represents mid-point of March 2, 2005 earnings release EBITDA guidance between $16.5 - $17.5 million. See normalization ad
Slide 28: Balance Sheet Has Significantly Improved
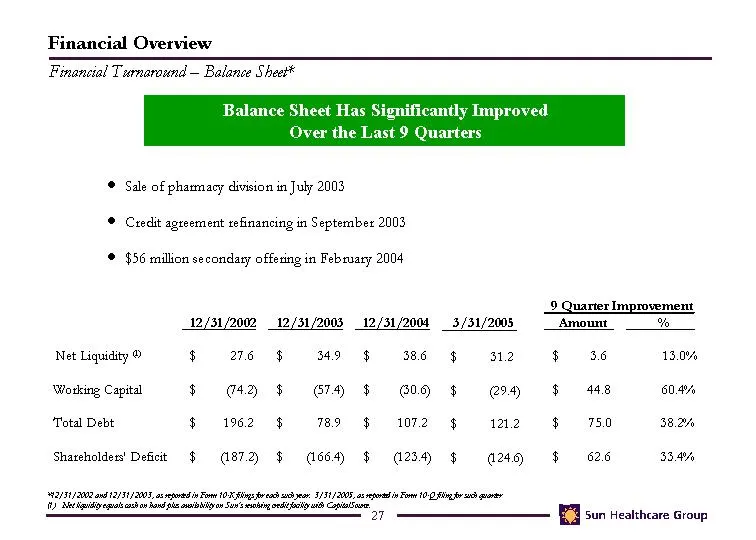
Balance Sheet Balance Sheet Has Significantly Improved Over the Last 9 Quarters *12/31/2002 and 12/31/2003, as reported in Form 10-K filings for each such year. 3/31/2005, as reported in Form 10-Q filing for such quarter (1) Net liquidity equals cash on hand plus availability on Sun's revolving cred

Slide 29: Reconciliation Section
Reconciliation Section
Slide 30: Certain Financial Terms
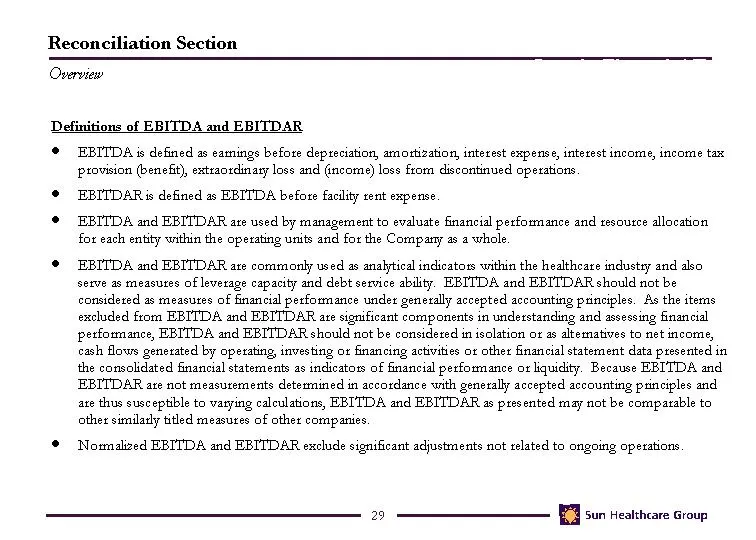
Certain Financial Terms Definitions of EBITDA and EBITDAR EBITDA is defined as earnings before depreciation, amortization, interest expense, interest income, income tax provision (benefit), extraordinary loss and (income) loss from discontinued operations. EBITDAR is defined as EBITDA before facilit
Slide 31: Reconciliation of Net Income to EBITDA and EBITDAR
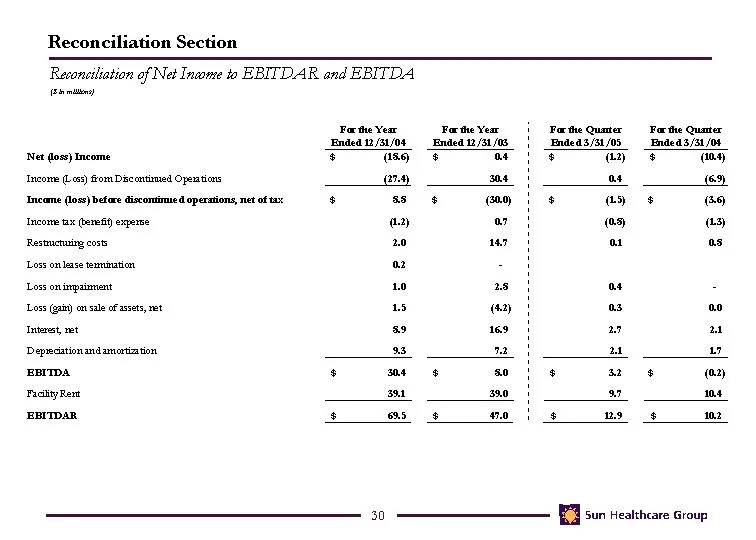
Reconciliation of Net Income to EBITDA and EBITDAR Reconciliation Section Reconciliation of Net Income to EBITDAR and EBITDA ($ in millions)
Slide 32: Reconciliation of Normalized EBITDA and EBITDAR
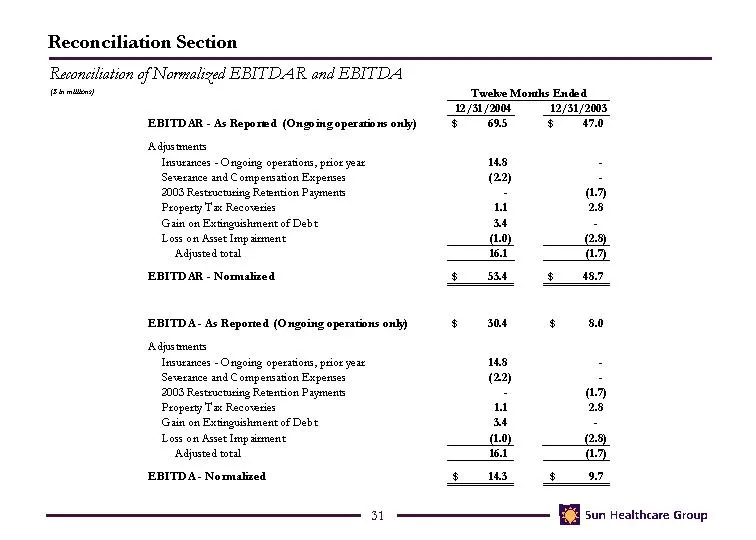
Reconciliation of Normalized EBITDA and EBITDAR Reconciliation Section Reconciliation of Normalized EBITDAR and EBITDA ($ in millions)
Slide 33: A Healthcare Services Company
A Healthcare Services Company
Source: SEC EDGAR · DEFA14A filed May 17, 2005
More decks from Sun Healthcare Group Inc
 Jefferies 2012 Global Healthcare Conference17 slides · Jun 6, 2012
 J.P. Morgan Healthcare Conference 201219 slides · Jan 10, 2012
 Investor Presentation (March 2011)36 slides · Mar 29, 2011
 JPMorgan Healthcare Conference (January 2011)27 slides · Jan 10, 2011
 Non-Deal Roadshow (July 2010)33 slides · Jul 12, 2010
 Wells Fargo Securities 2010 Healthcare Conference25 slides · Jun 24, 2010