Professional — Q2 2020 Earnings Presentation
24 slides from Professional's earnings presentation, Jul 28, 2020

Slide 1: Second Quarter 2020 Earnings Presentation
SECOND QUARTER 2020 EARNINGS PRESENTATION PAGE EARNINGS PRESENTATION SECOND QUARTER 2020 PFHD:NASDAQ
Slide 2: Forward Looking Statements
SECOND QUARTER 2020 EARNINGS PRESENTATION PAGE 2 FORWARD LOOKING STATEMENTS ! This slide presentation contains forward-looking statements within the meaning of the Private Securities Litigation Reform Act of 1995. Any statements contained in this presentation that are not statements of historical fa
Slide 3: A Growing Franchise in South Florida
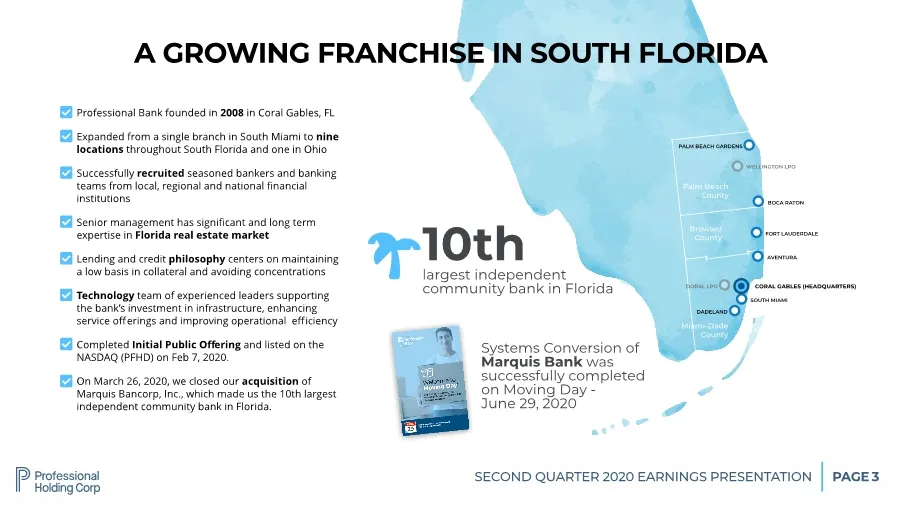
SECOND QUARTER 2020 EARNINGS PRESENTATION PAGE CORAL GABLES (HEADQUARTERS) SOUTH MIAMI FORT LAUDERDALE BOCA RATON WELLINGTON LPO DADELAND PALM BEACH GARDENS DORAL LPO Palm Beach County Broward County Miami-Dade County 3 A GROWING FRANCHISE IN SOUTH FLORIDA 10th largest independent community bank in
Slide 4: Net Interest Income and Margin
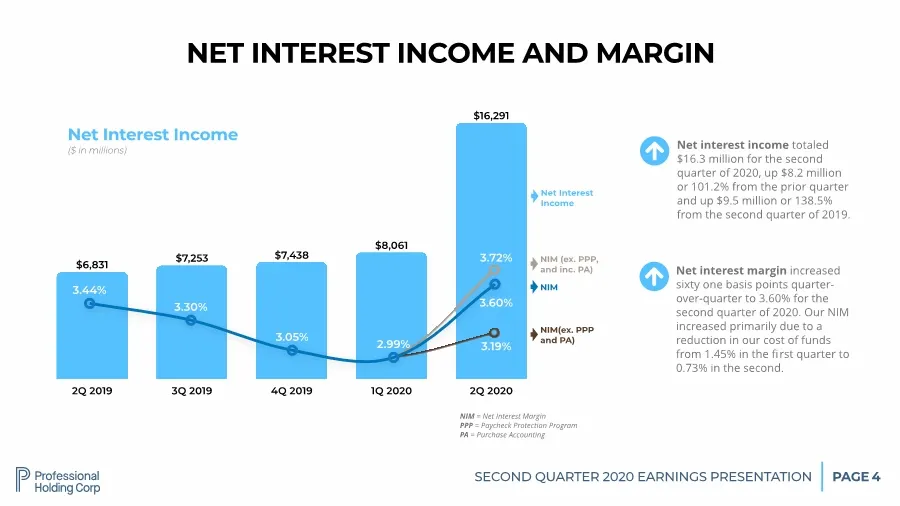
SECOND QUARTER 2020 EARNINGS PRESENTATION PAGE 4 2Q 2019 3Q 2019 4Q 2019 1Q 2020 2Q 2020 $16,291 $8,061 $7,438 $7,253 $6,831 NET INTEREST INCOME AND MARGIN Net Interest Income ($ in millions) Net Interest Income NIM " Net interest income totaled $16.3 million for the second quarter of 2020, up $8.2
Slide 5: Consistent Loan Growth
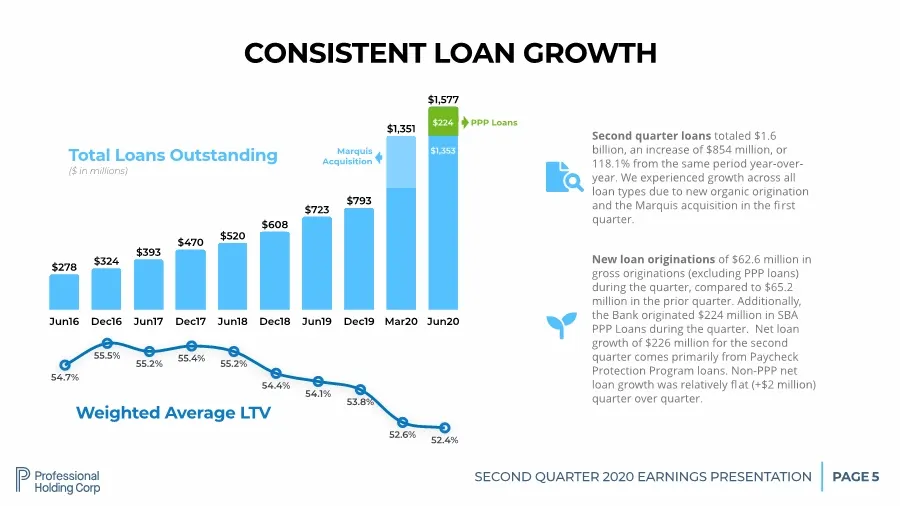
SECOND QUARTER 2020 EARNINGS PRESENTATION PAGE 5 Jun16 Dec16 Jun17 Dec17 Jun18 Dec18 Jun19 Dec19 Mar20 Jun20 $1,577 $1,351 $793 $723 $608 $520 $470 $393 $324 $278 CONSISTENT LOAN GROWTH Total Loans Outstanding ($ in millions) # Second quarter loans totaled $1.6 billion, an increase of $854 million,
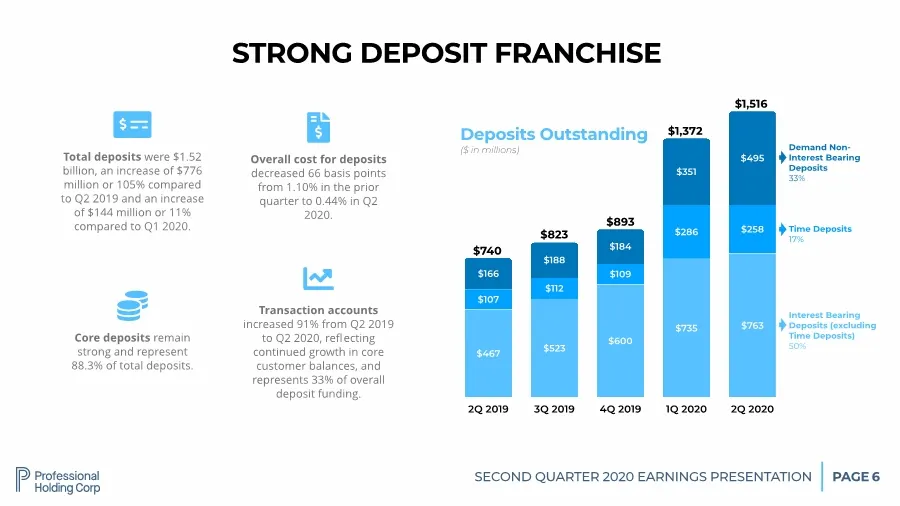
Slide 6: Strong Deposit Franchise
SECOND QUARTER 2020 EARNINGS PRESENTATION PAGE 6 2Q 2019 3Q 2019 4Q 2019 1Q 2020 2Q 2020 $495 $351 $184 $188 $166 $258 $286 $109 $112 $107 $763 $735 $600 $523 $467 STRONG DEPOSIT FRANCHISE Deposits Outstanding ($ in millions) $740 $823 $893 $1,516 Interest Bearing Deposits (excluding Time Deposits)
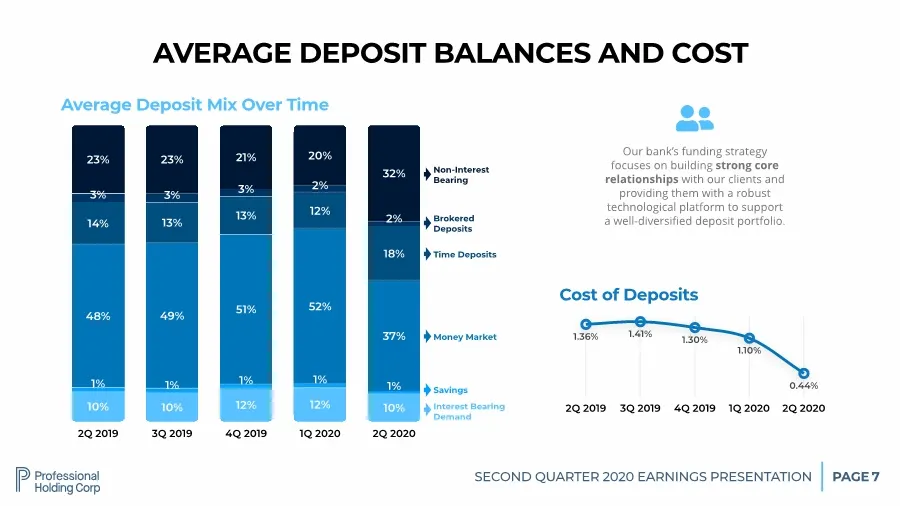
Slide 7: Average Deposit Balances and Cost
SECOND QUARTER 2020 EARNINGS PRESENTATION PAGE 7 2Q 2019 3Q 2019 4Q 2019 1Q 2020 2Q 2020 32% 20% 21% 23% 23% 2% 2% 3% 3% 3% 18% 12% 13% 13% 14% 37% 52% 51% 49% 48% 1% 1% 1% 1% 1% 10% 12% 12% 10% 10% Average Deposit Mix Over Time Interest Bearing Demand Savings Money Market Our bank’s funding strateg
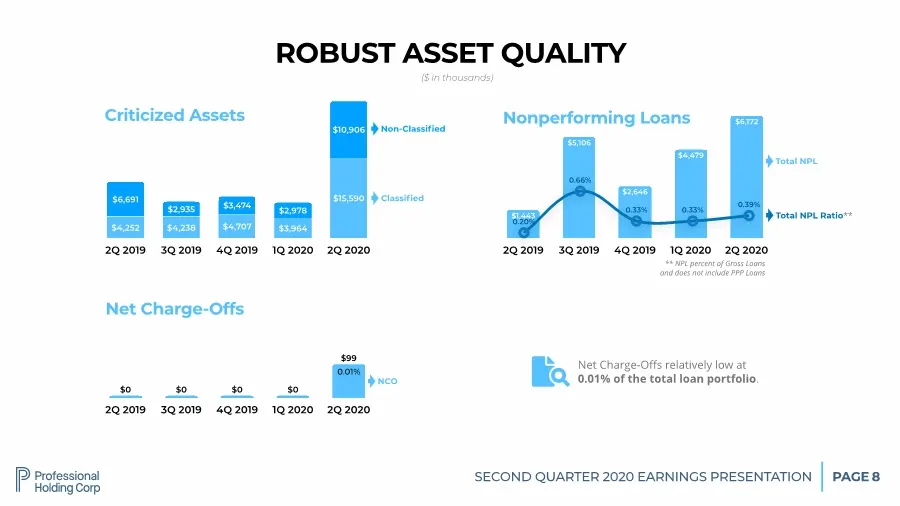
Slide 8: Robust Asset Quality
SECOND QUARTER 2020 EARNINGS PRESENTATION PAGE 8 ROBUST ASSET QUALITY 2Q 2019 3Q 2019 4Q 2019 1Q 2020 2Q 2020 $99 $0 $0 $0 $0 Net Charge-Offs NCO 2Q 2019 3Q 2019 4Q 2019 1Q 2020 2Q 2020 $10,906 $2,978 $3,474 $2,935 $6,691 $15,590 $3,964 $4,707 $4,238 $4,252 Criticized Assets Classified Non-Classified
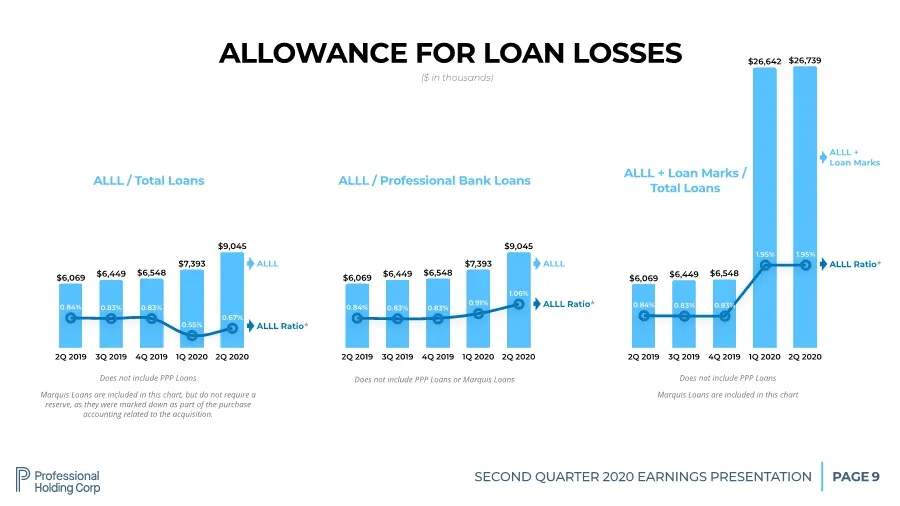
Slide 9: Allowance for Loan Losses
SECOND QUARTER 2020 EARNINGS PRESENTATION PAGE 9 ALLOWANCE FOR LOAN LOSSES 2Q 2019 3Q 2019 4Q 2019 1Q 2020 2Q 2020 $9,045 $7,393 $6,548 $6,449 $6,069 ALLL / Total Loans ALLL ALLL Ratio* 0.67% 0.55% 0.83% 0.83% 0.84% Does not include PPP Loans Marquis Loans are included in this chart, but do not requ
Slide 10: Digital Focus
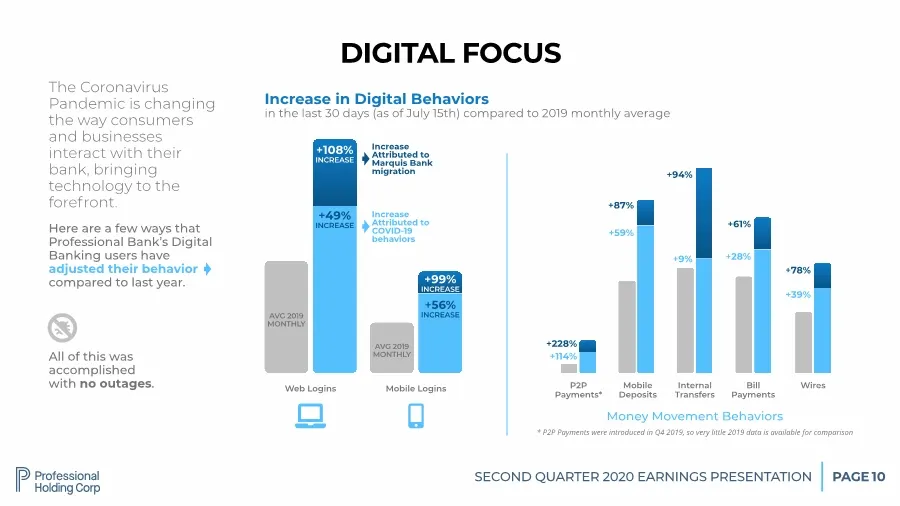
SECOND QUARTER 2020 EARNINGS PRESENTATION PAGE 10 DIGITAL FOCUS The Coronavirus Pandemic is changing the way consumers and businesses interact with their bank, bringing technology to the forefront. Here are a few ways that Professional Bank’s Digital Banking users have adjusted their behavior compar
Slide 11: Steady Shareholder Value
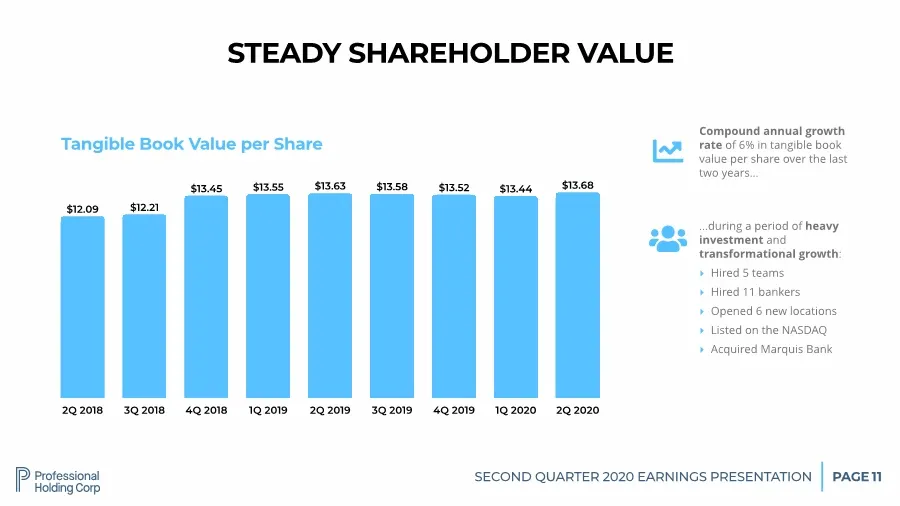
SECOND QUARTER 2020 EARNINGS PRESENTATION PAGE 11 2Q 2018 3Q 2018 4Q 2018 1Q 2019 2Q 2019 3Q 2019 4Q 2019 1Q 2020 2Q 2020 $13.68 $13.44 $13.52 $13.58 $13.63 $13.55 $13.45 $12.21 $12.09 STEADY SHAREHOLDER VALUE Tangible Book Value per Share & Compound annual growth rate of 6% in tangible book value p
Slide 12: Loan Portfolio Highlights
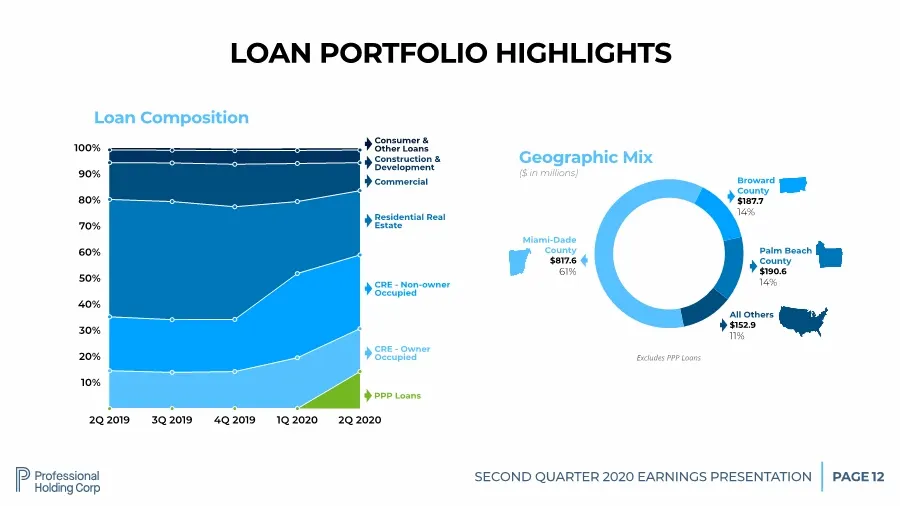
SECOND QUARTER 2020 EARNINGS PRESENTATION PAGE 12 Geographic Mix ($ in millions) Miami-Dade County $817.6 61% Broward County $187.7 14% Palm Beach County $190.6 14% LOAN PORTFOLIO HIGHLIGHTS 10% 20% 30% 40% 50% 60% 70% 80% 90% 100% 2Q 2019 3Q 2019 4Q 2019 1Q 2020 2Q 2020 Loan Composition CRE - Owner
Slide 13: Interest Rate Sensitivity
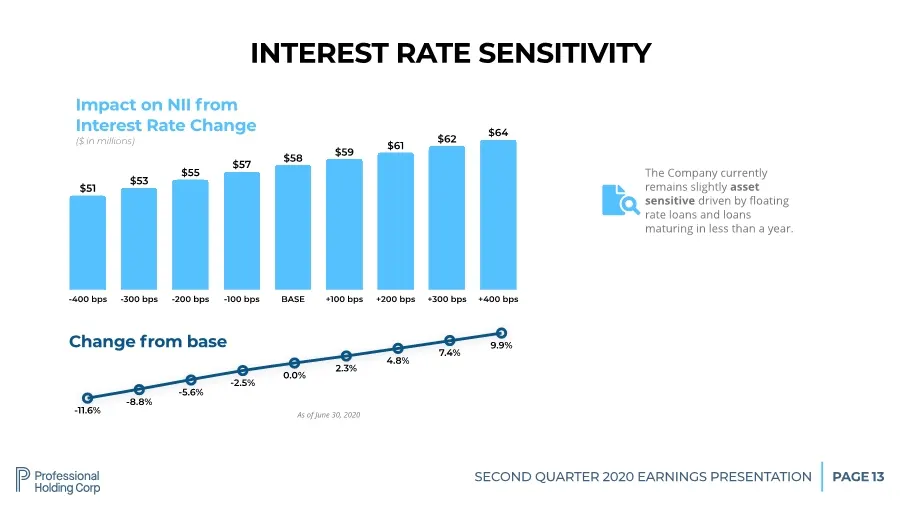
SECOND QUARTER 2020 EARNINGS PRESENTATION PAGE 13 -400 bps -300 bps -200 bps -100 bps BASE +100 bps +200 bps +300 bps +400 bps $64 $62 $61 $59 $58 $57 $55 $53 $51 INTEREST RATE SENSITIVITY Impact on NII from Interest Rate Change ($ in millions) # The Company currently remains slightly asset sensitiv
Slide 14: Asset Liability Management Trends
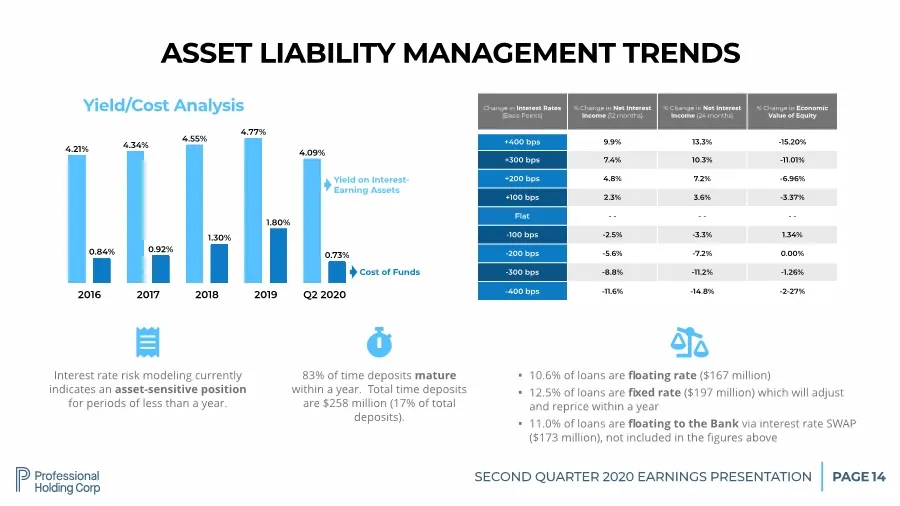
SECOND QUARTER 2020 EARNINGS PRESENTATION PAGE 14 Interest rate risk modeling currently indicates an asset-sensitive position for periods of less than a year. ( ASSET LIABILITY MANAGEMENT TRENDS • 10.6% of loans are floating rate ($167 million) • 12.5% of loans are fixed rate ($197 million) which will
Slide 15: Investment Portfolio
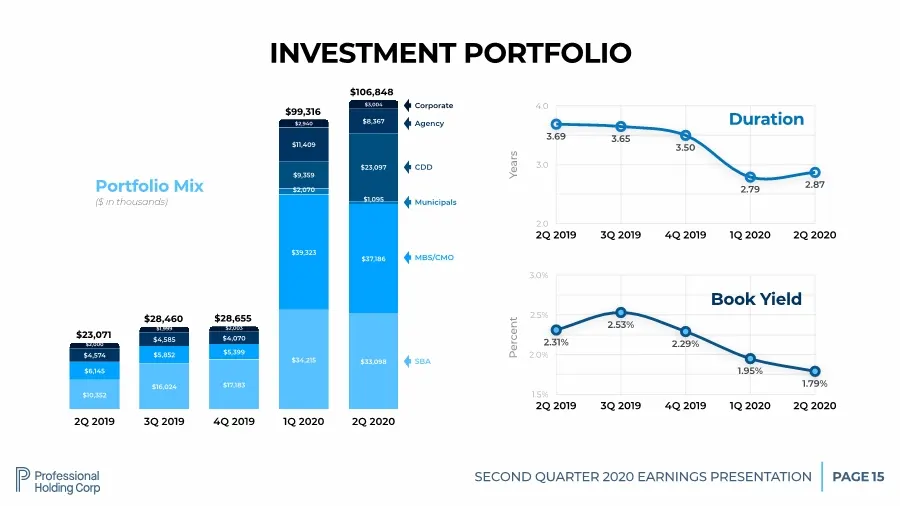
SECOND QUARTER 2020 EARNINGS PRESENTATION PAGE 1.5% 2.0% 2.5% 3.0% 2Q 2019 3Q 2019 4Q 2019 1Q 2020 2Q 2020 1.79% 1.95% 2.29% 2.53% 2.31% 15 2Q 2019 3Q 2019 4Q 2019 1Q 2020 2Q 2020 $3,004 $2,940 $2,003 $1,999 $2,000 $8,367 $11,409 $4,070 $4,585 $4,574 $23,097 $9,359 $1,095 $2,070 $37,186 $39,323 $5,3
Slide 16: Spotlight: Marquis Conversion
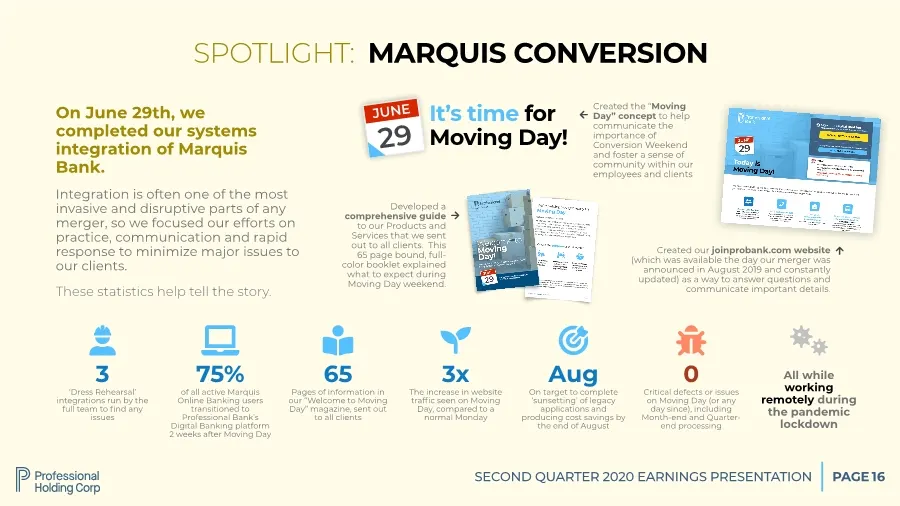
SECOND QUARTER 2020 EARNINGS PRESENTATION PAGE 16 On June 29th, we completed our systems integration of Marquis Bank. Integration is often one of the most invasive and disruptive parts of any merger, so we focused our efforts on practice, communication and rapid response to minimize major issues to

Slide 17: Operational Response and Bank Preparedness COVID-19
OPERATIONAL RESPONSE AND BANK PREPAREDNESS COVID-19
Slide 18: COVID-19 Timeline of Actions
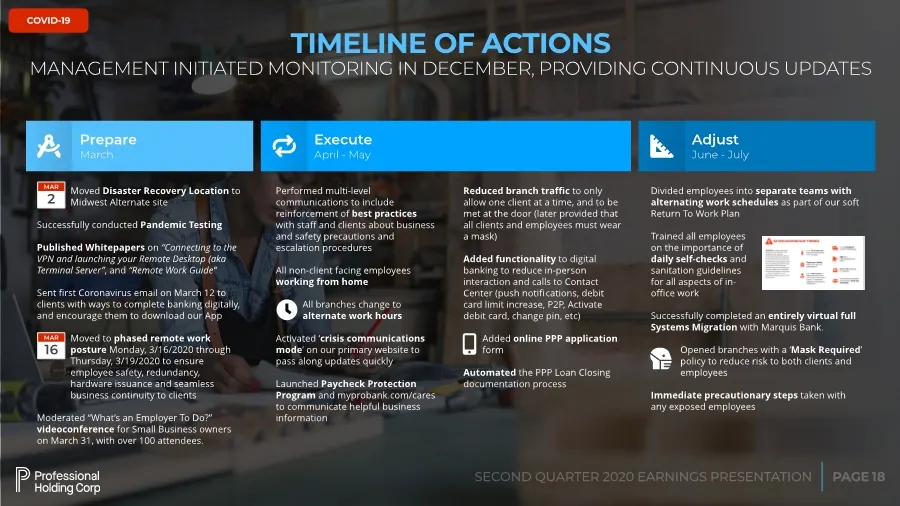
PAGE SECOND QUARTER 2020 EARNINGS PRESENTATION COVID-19 18 TIMELINE OF ACTIONS MANAGEMENT INITIATED MONITORING IN DECEMBER, PROVIDING CONTINUOUS UPDATES Prepare March Execute April - May Adjust June - July 0 1 2 Moved Disaster Recovery Location to Midwest Alternate site Successfully conducted Pandem
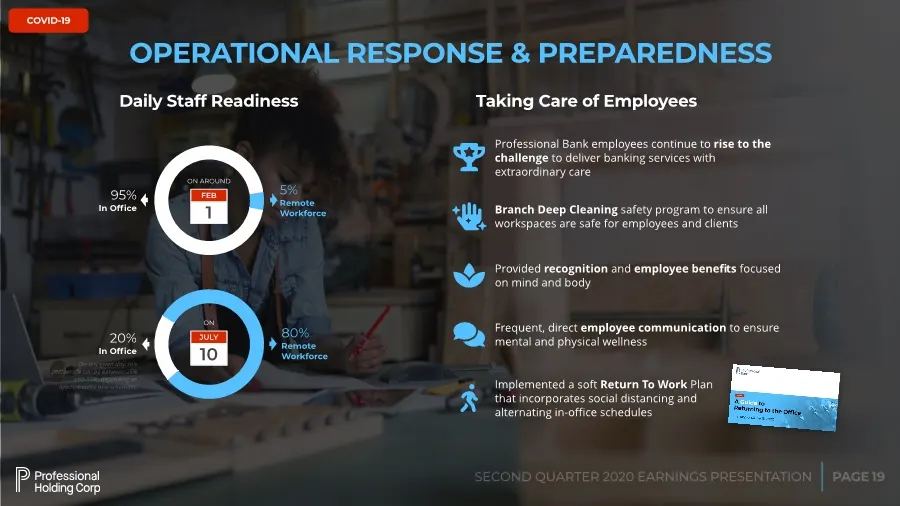
Slide 19: Operational Response & Preparedness
PAGE SECOND QUARTER 2020 EARNINGS PRESENTATION COVID-19 19 Daily Staff Readiness 5% Remote Workforce 95% In Office OPERATIONAL RESPONSE & PREPAREDNESS 4 Professional Bank employees continue to rise to the challenge to deliver banking services with extraordinary care Taking Care of Employees 諾 Branch
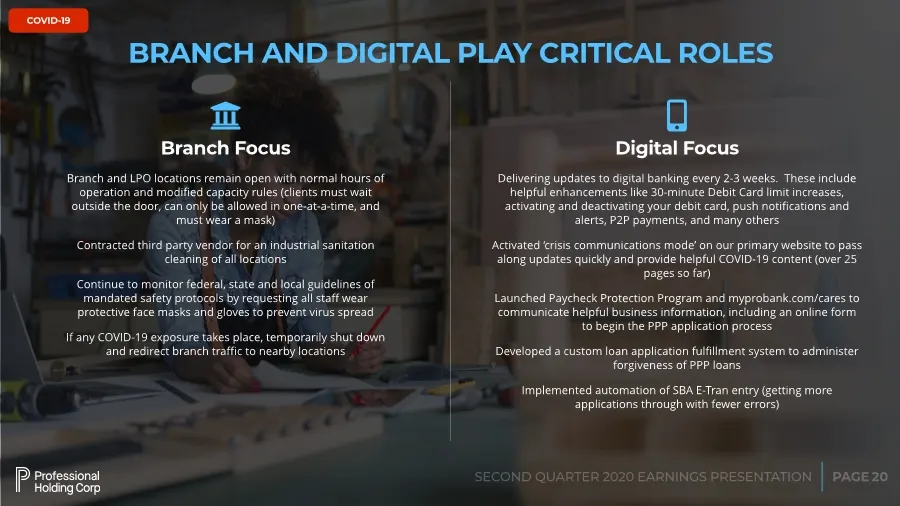
Slide 20: Branch and Digital Play Critical Roles
PAGE SECOND QUARTER 2020 EARNINGS PRESENTATION COVID-19 20 BRANCH AND DIGITAL PLAY CRITICAL ROLES 9 Branch Focus Digital Focus : Delivering updates to digital banking every 2-3 weeks. These include helpful enhancements like 30-minute Debit Card limit increases, activating and deactivating your debit
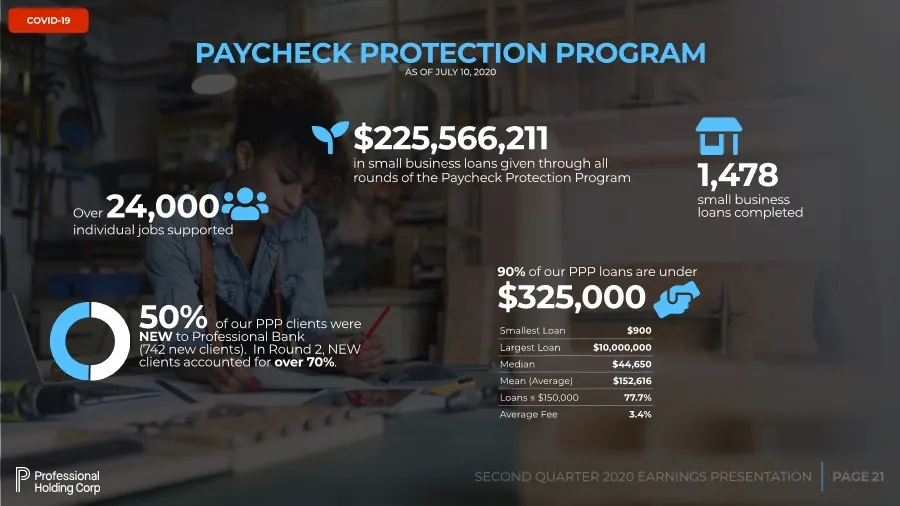
Slide 21: Paycheck Protection Program
PAGE SECOND QUARTER 2020 EARNINGS PRESENTATION COVID-19 21 Over 24,000 individual jobs supported .. PAYCHECK PROTECTION PROGRAM AS OF JULY 10, 2020 1,478 small business loans completed / COVID-19 $225,566,211 in small business loans given through all rounds of the Paycheck Protection Program , 50% o
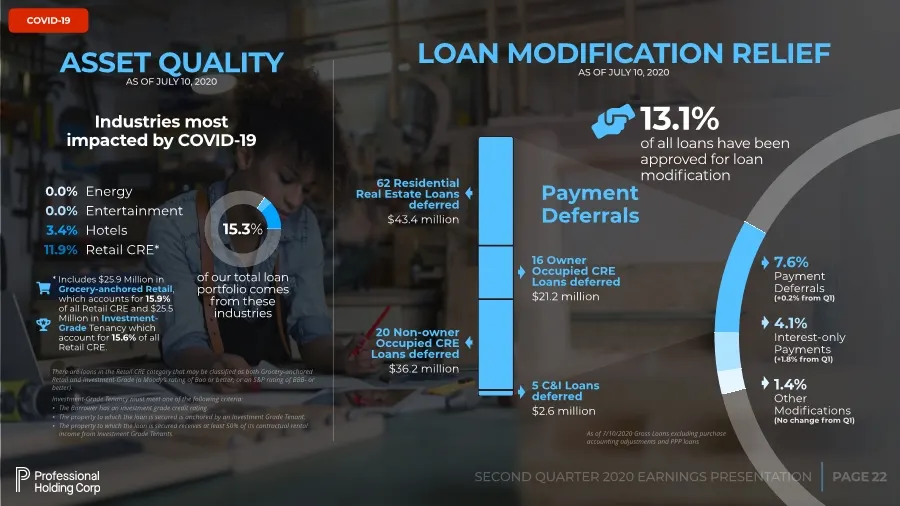
Slide 22: COVID-19 Asset Quality and Loan Modification Relief
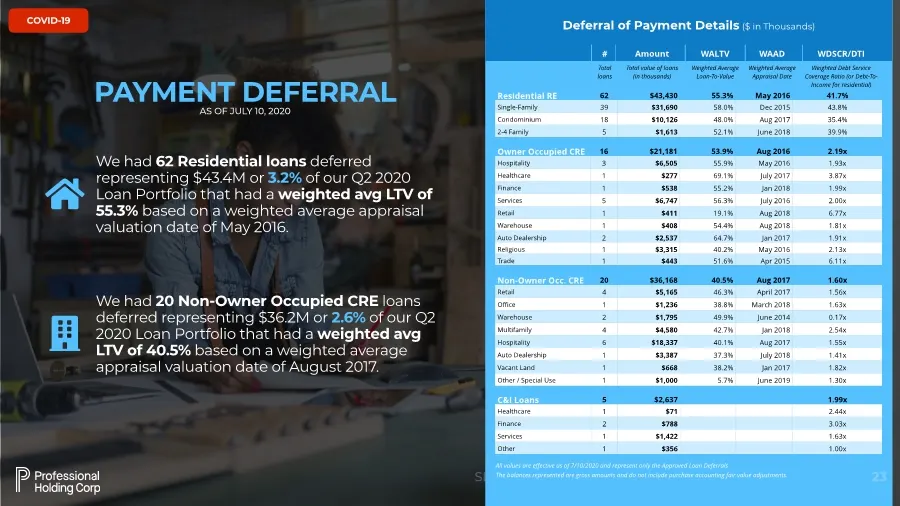
PAGE SECOND QUARTER 2020 EARNINGS PRESENTATION COVID-19 22 ASSET QUALITY AS OF JULY 10, 2020 Energy Entertainment Hotels Retail CRE* Industries most impacted by COVID-19 0.0% 0.0% 3.4% 11.9% 13.1% of all loans have been approved for loan modification Payment Deferrals 20 Non-owner Occupied CRE Loans
Slide 23: Approved Loan Deferrals by Loan Type
PAGE SECOND QUARTER 2020 EARNINGS PRESENTATION COVID-19 23 C&I Loans 5 $2,637 1.99x Healthcare 1 $71 2.44x Finance 2 $788 3.03x Services 1 $1,422 1.63x Other 1 $356 1.00x All values are effective as of 7/10/2020 and represent only the Approved Loan Deferrals The balances represented are gross amounts
Slide 24: Quarterly Payment Deferral Activity
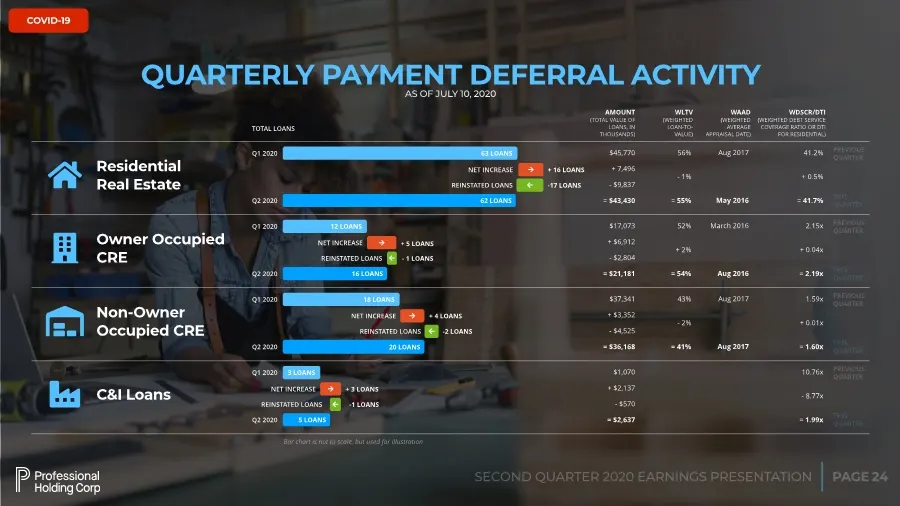
PAGE SECOND QUARTER 2020 EARNINGS PRESENTATION COVID-19 24 QUARTERLY PAYMENT DEFERRAL ACTIVITY AS OF JULY 10, 2020 < Q1 2020 Residential Real Estate 63 LOANS Q2 2020 62 LOANS NET INCREASE / + 16 LOANS REINSTATED LOANS . -17 LOANS $45,770 + 7,496 - $9,837 = $43,430 56% - 1% = 55% TOTAL LOANS AMOUNT (
Source: SEC EDGAR · 8-K filed Jul 28, 2020
More decks from Professional Holding Corp
 Q3 2022 Earnings Presentation19 slides · Oct 28, 2022
 Q2 2022 Earnings Presentation20 slides · Jul 28, 2022
 Q1 2022 Earnings Presentation21 slides · Apr 29, 2022
 Q4 2021 Earnings Presentation19 slides · Jan 27, 2022
 Q3 2021 Earnings Presentation19 slides · Oct 28, 2021
 Q2 2021 Earnings Presentation18 slides · Jul 29, 2021