Officemax — Investor Day (November 2011)
36 slides from Officemax's investor day presentation, Nov 16, 2011

Slide 1: Company Strategy
Exhibit 99.2 Company Strategy
Slide 2: Forward-Looking Statement and Non-GAAP Measures
Forward -Looking Statement and Non -GAAP Measures Forward -Looking Statements Certain statements made in this presentation and other written or oral statements made by or on behalf of the company constitute “forward -looking statements” within the meaning of the federal securities laws, including st

Slide 3: Presenters
Presenters Ravi Saligram Bruce Besanko Michael Lewis Mary Dunnam President & CEO EVP, CFO & Chief EVP, President of Retail SVP, Customer Advocacy Administrative Officer Steve Mongeau Reuben Slone Jim Barr SVP, Sales & Growth Initiatives EVP, Supply Chain & EVP, Chief Digital Officer GM, Services
Slide 4: Company Strategy Agenda
Company Strategy Agenda 1. Strategy Process and Key Issues 2. OfficeMax Overview and Opportunities 3. New Roadmap For Success: Total Company Strategic Pillars 4. Individual Business Strategies Source: Company estimates and industry data, unless otherwise marked
Slide 5: Robust process with multiple inputs informed strategy
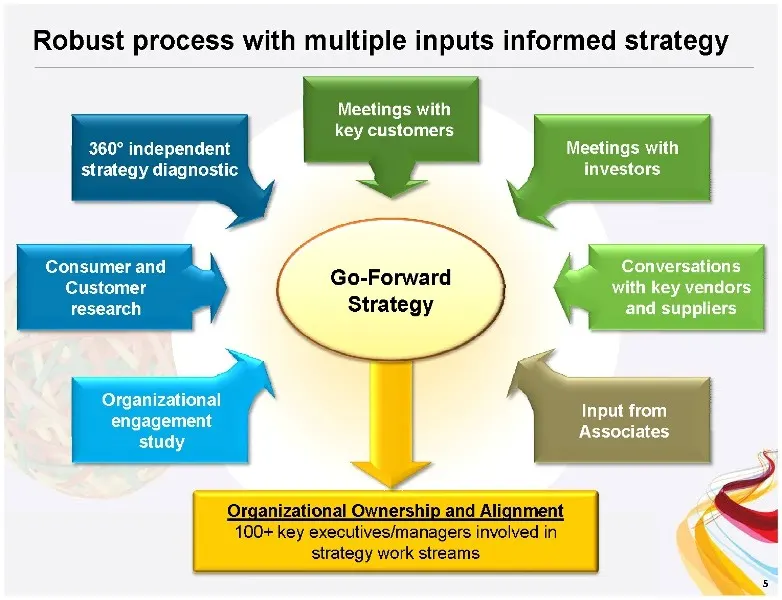
Robust process with multiple inputs informed strategy Meetings with key customers 360°° independent Meetings with strategy diagnostic investors Consumer and Conversations Go-Forward with key vendors Customer research Strategy and suppliers Organizational Input from engagement Associates study Organi
Slide 6: Strategic Questions for OfficeMax and Sector Issues
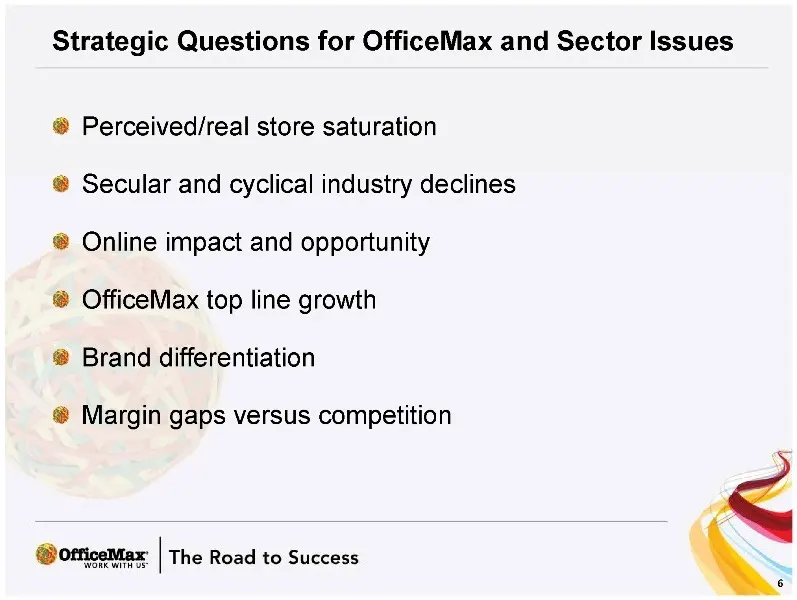
Strategic Questions for OfficeMax and Sector Issues Perceived/real store saturation Secular and cyclical industry declines Online impact and opportunity OfficeMax top line growth Brand differentiation Margin gaps versus competition
Slide 7: Investor perceptions/feedback
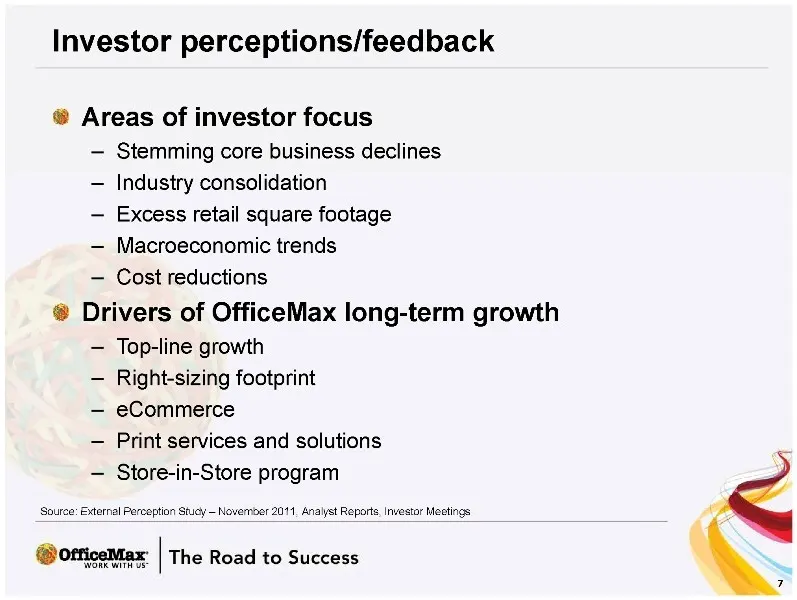
Investor perceptions/feedback Areas of investor focus – Stemming core business declines – Industry consolidation – Excess retail square footage – Macroeconomic trends – Cost reductions Drivers of OfficeMax long-term growth – Top-line growth – Right-sizing footprint – eCommerce – Print services and s
Slide 8: A New Roadmap for Success
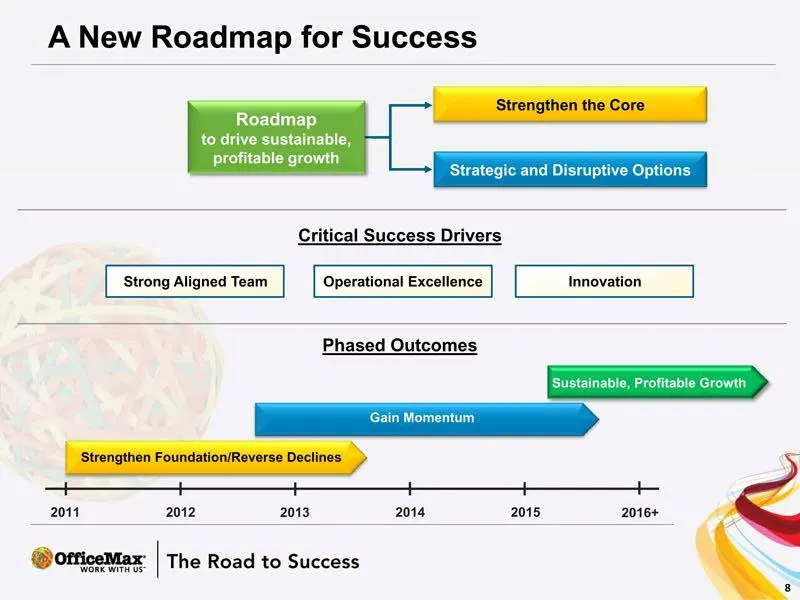
A New Roadmap for Success Strengthen the Core Roadmap to drive sustainable, profitable growth Strategic and Disruptive Options Critical Success Drivers Strong Aligned Team Operational Excellence Innovation Phased Outcomes Sustainable, Profitable Growthrowth Gain Momentum Strengthen Foundation/Revers
Slide 9: Who we are
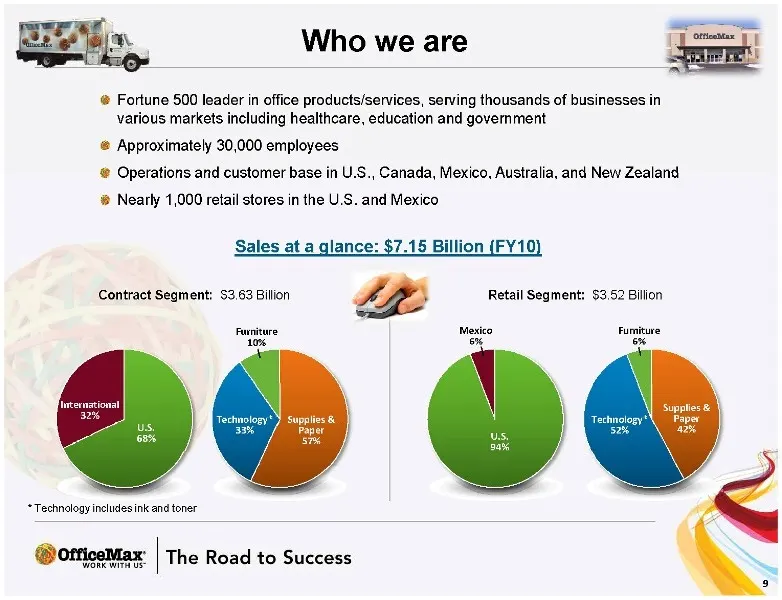
Who we are Fortune 500 leader in office products/services, serving thousands of businesses in various markets including healthcare, education and government Approximately 30,000 employees Operations U Canada Mexico . , . , , Australia S and customer base in , and New Zealand Nearly 1,000 retail stor
Slide 10: OfficeMax operates in a $230B+ market in the U.S.
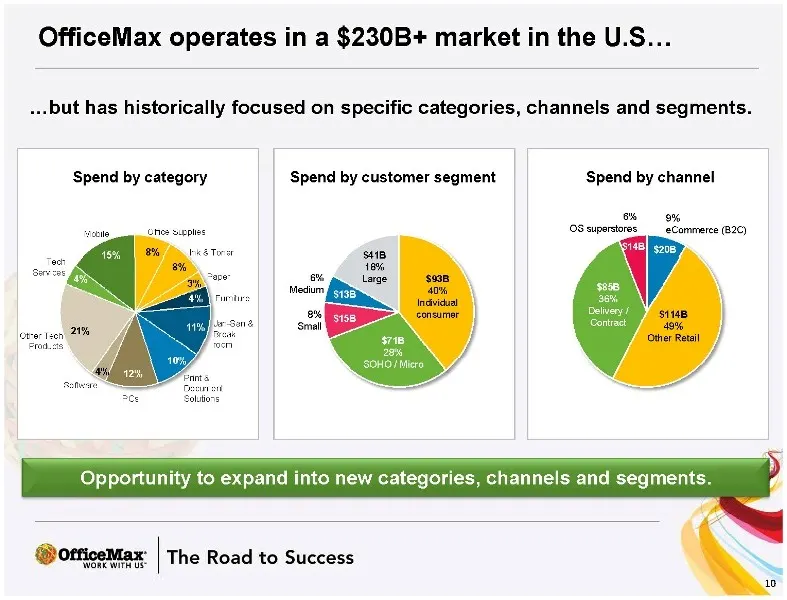
OfficeMax operates in a $230B+ market in the U.S… …but has historically focused on specific categories, channels and segments. Spend by category Spend by customer segment Spend by channel 6% 9% Office Supplies OS superstores eCommerce (B2C) Mobile $14B $20B 15% 8% Ink & Toner $41B Tech 8% 18% Servic
Slide 11: OfficeMax International operations
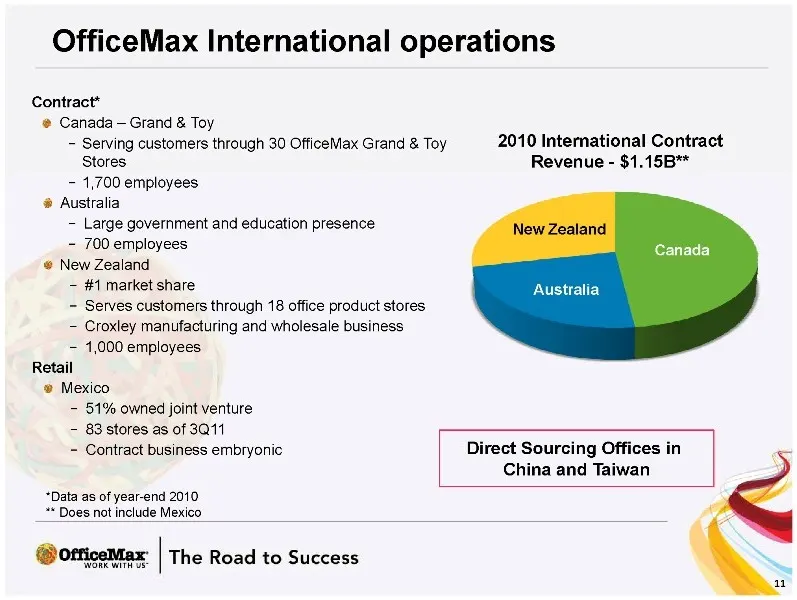
OfficeMax International operations Contract* Canada – Grand & Toy Serving customers through 30 OfficeMax Grand & Toy 2010 International Contract Stores Revenue—$1.15B** 1,700 employees Australia Large government and education presence New Zealand 700 employees Canada New Zealand #1 market share Aust
Slide 12: Where we have been: 5-year performance
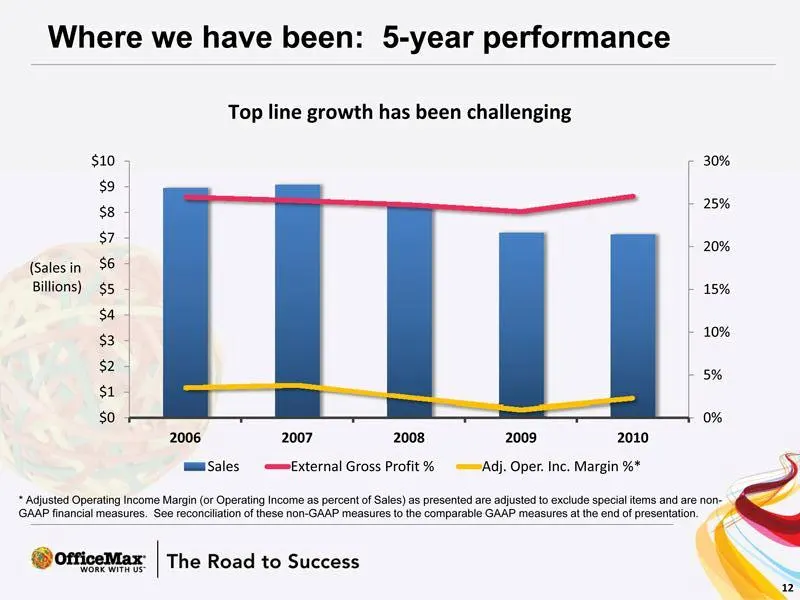
Where we have been: 5-year performance Top line growth has been challenging $10 30% $9 25% $8 $7 20% (Sales in $6 Billions) $5 15% $4 10% $3 $2 5% $1 $0 0% 2006 2007 2008 2009 2010 Sales External Gross Profit % Adj. Oper. Inc. Margin %* * Adjusted Operating Income Margin (or Operating Income as perc
Slide 13: Remained profitable during the past years despite continued economic challenges
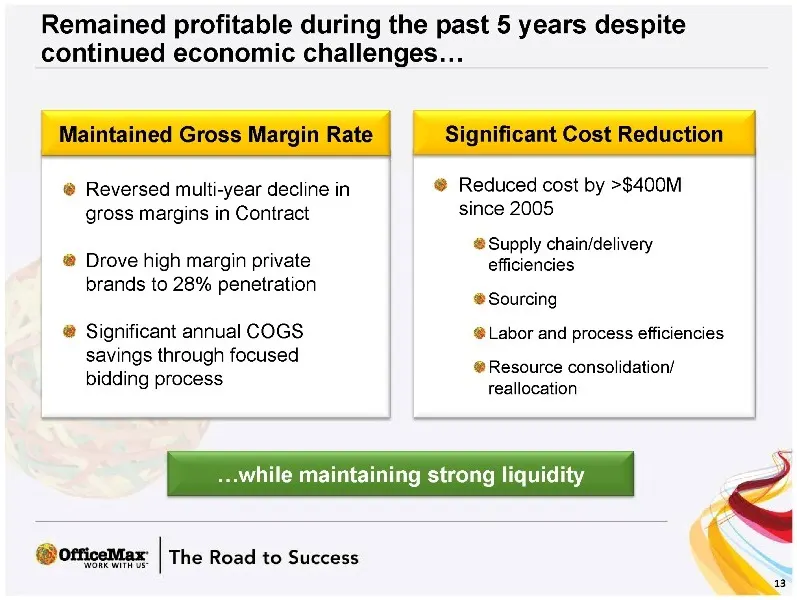
Remained profitable during the past 5 years despite continued economic challenges … Maintained Gross Margin Rate Significant Cost Reduction Reversed multi-year decline in Reduced cost by >$400M gross margins in Contract since 2005 Supply chain/delivery Drove high margin private efficiencies brands t
Slide 14: Actions in 2011
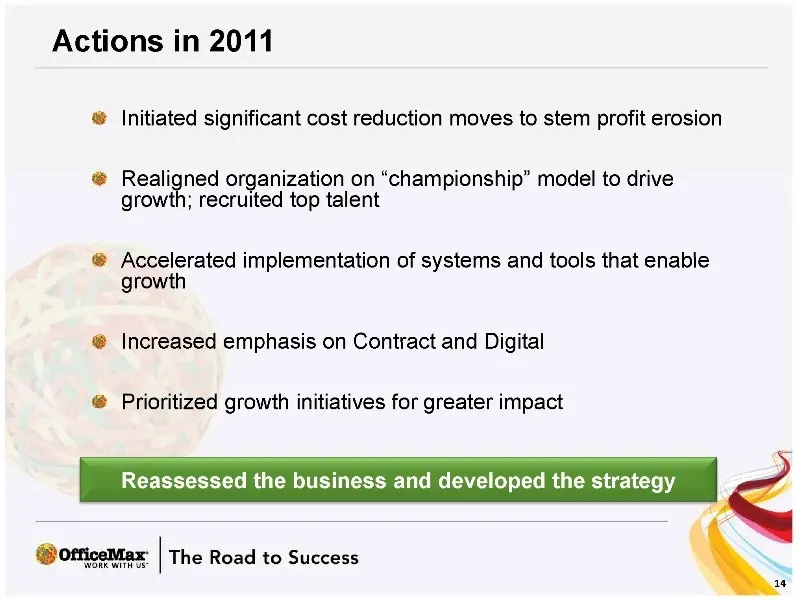
Actions in Initiated significant cost reduction moves to stem profit erosion Realigned organization on “championship” model to drive growth; recruited top talent Accelerated implementation of systems and tools that enable growth Increased emphasis on Contract and Digital Prioritized growth initiativ
Slide 15: Strengths and Opportunities
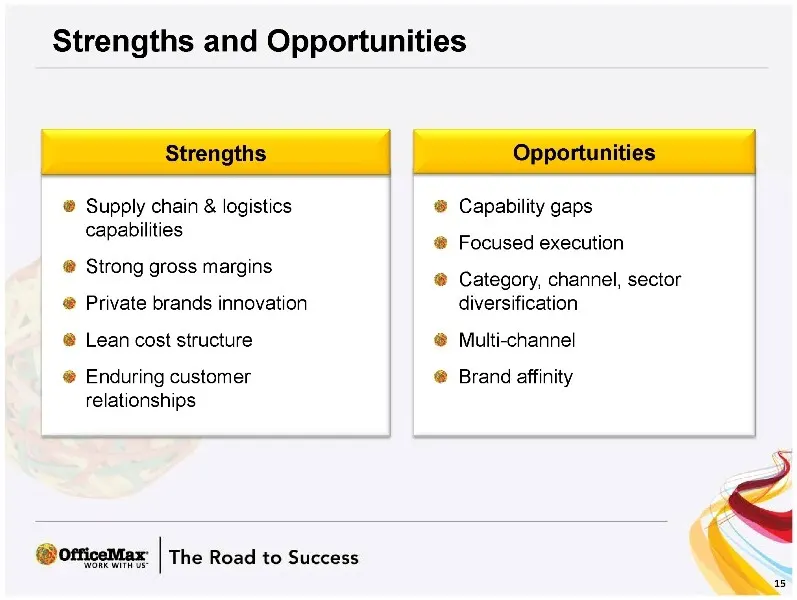
Strengths and Opportunities Strengths Opportunities Supply chain & logistics Capability gaps capabilities Focused execution Strong gross margins Category, channel, sector Private brands innovation diversification Lean cost structure Multi-channel Enduring customer Brand affinity relationships
Slide 16: A New Roadmap for Success: Total company strategic pillars
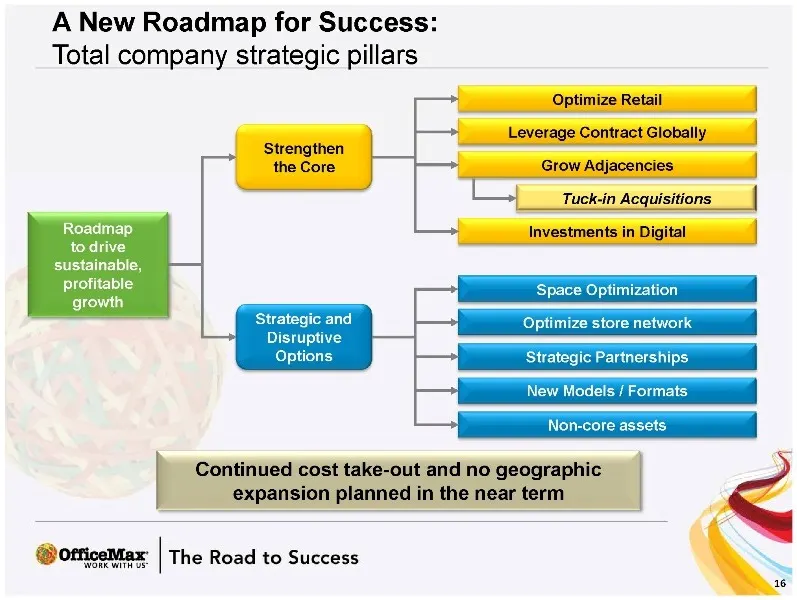
A New Roadmap for Success: Total company strategic pillars Optimize Retail Leverage Contract Globally Strengthen the Core Grow Adjacencies Tuck-in Acquisitions Roadmap Investments in Digital to drive sustainable, profitable Space Optimization growth Strategic and Optimize store network Disruptive Op
Slide 17: Individual business strategies: Retail
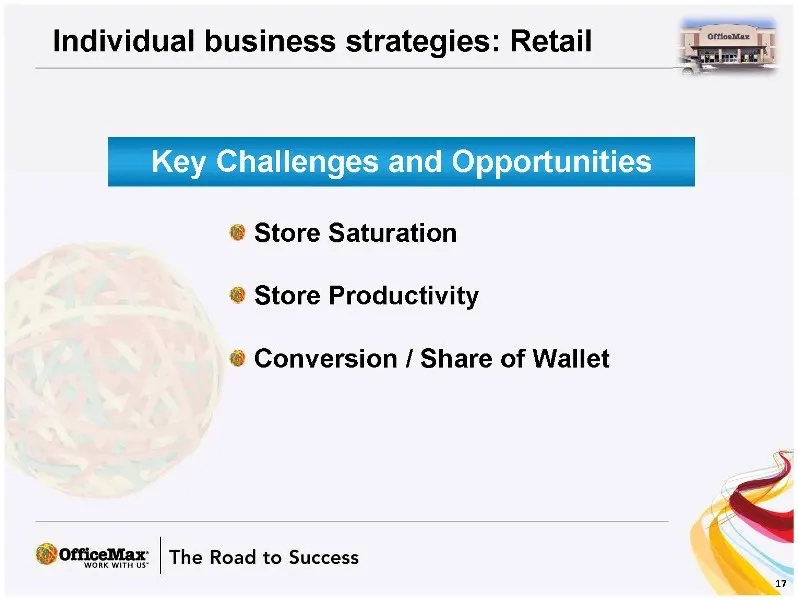
Individual business strategies: Retail Key Challen ges and Opportunities Store Saturation Store Productivity Conversion / Share of Wallet
Slide 18: Retail challenges: Industry productivity
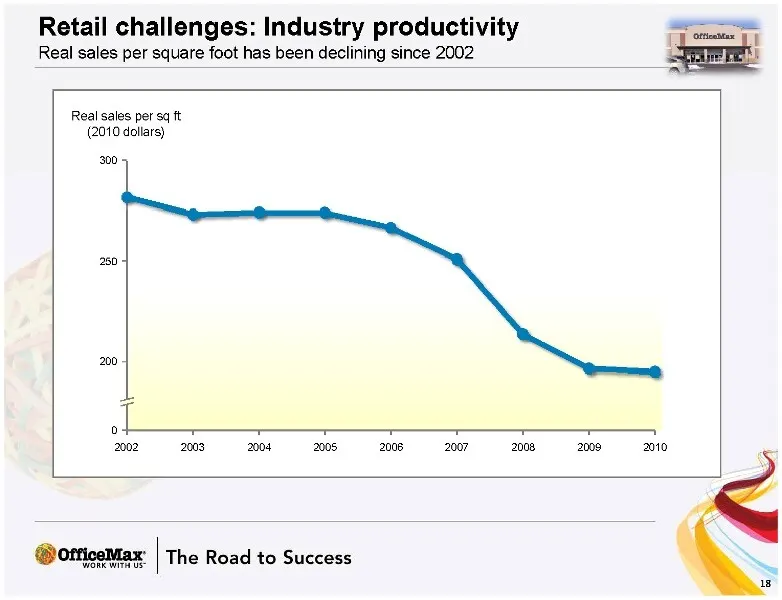
Retail challenges: Industry productivity Real sales per square foot has been declining since 2002 Real sales per sq ft (2010 dollars) 2002 2003 2004 2005 2006 2007 2008 2009 2010
Slide 19: Retail opportunity: To address store saturation
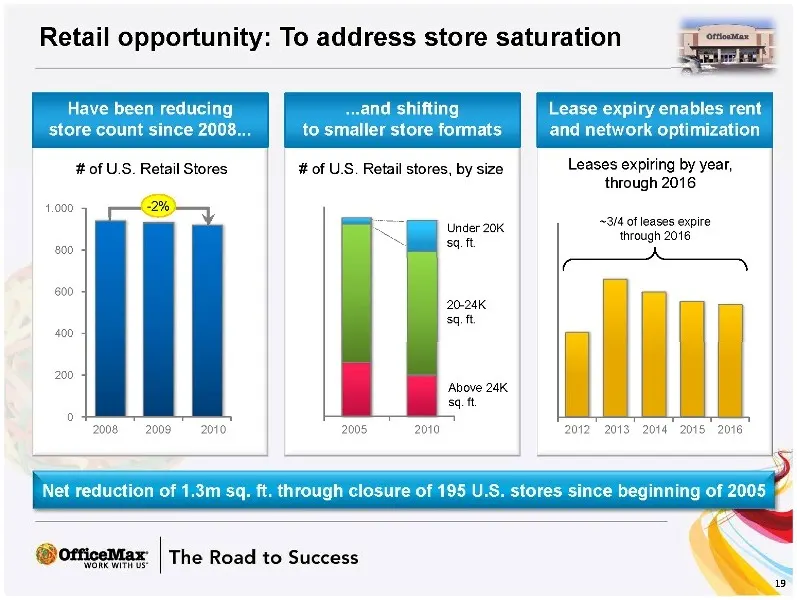
Retail opportunity: To address store saturation Have been reducing .and shifting Lease expiry enables rent store count since 2008. to smaller store formats and network optimization # of U.S. Retail Stores # of U.S. Retail stores, by size Leases expiring by year, through 2016 1,000 -2% ~3/4 of leases
Slide 20: Retail opportunity: Conversion and share of wallet
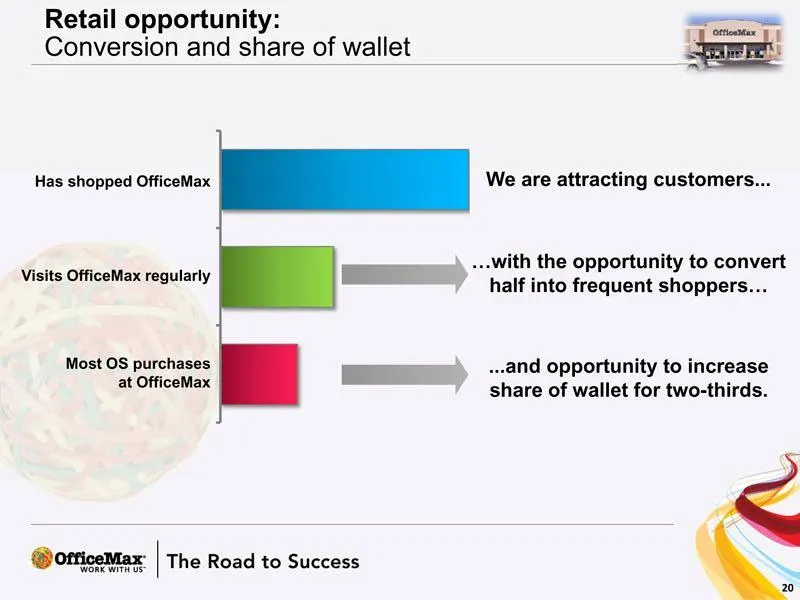
Retail opportunity: Conversion and share of wallet Has shopped OfficeMax We are attracting customers …with the opportunity to convert Visits OfficeMax regularly half into frequent shoppers … Most OS purchases .and opportunity to increase at OfficeMax share of wallet for two-thirds.
Slide 21: Retail Strategies
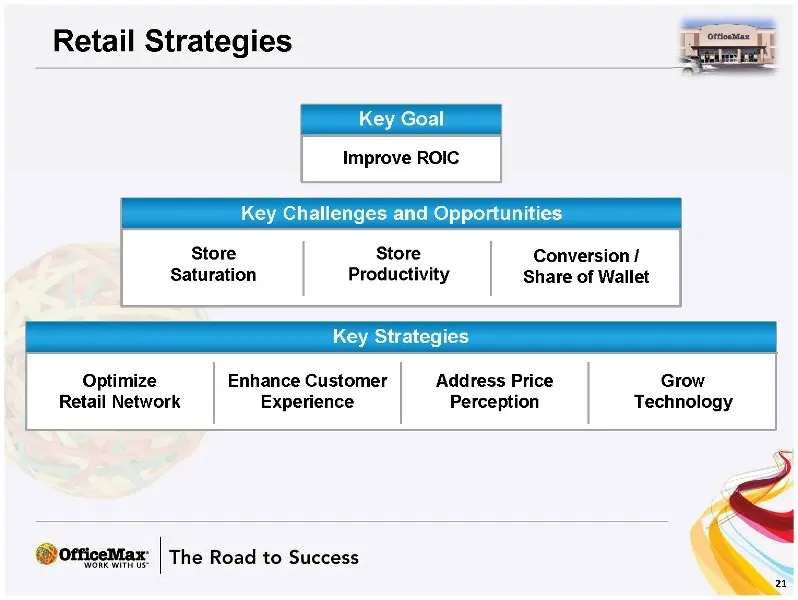
Retail Strategies Key Goal Improve ROIC Key Challenges and Opportunities Store Store Conversion / Saturation Productivity Share of Wallet Key Strategies Optimize Enhance Customer Address Price Grow Retail Network Experience Perception Technology
Slide 22: Individual business strategies: U.S. Contract
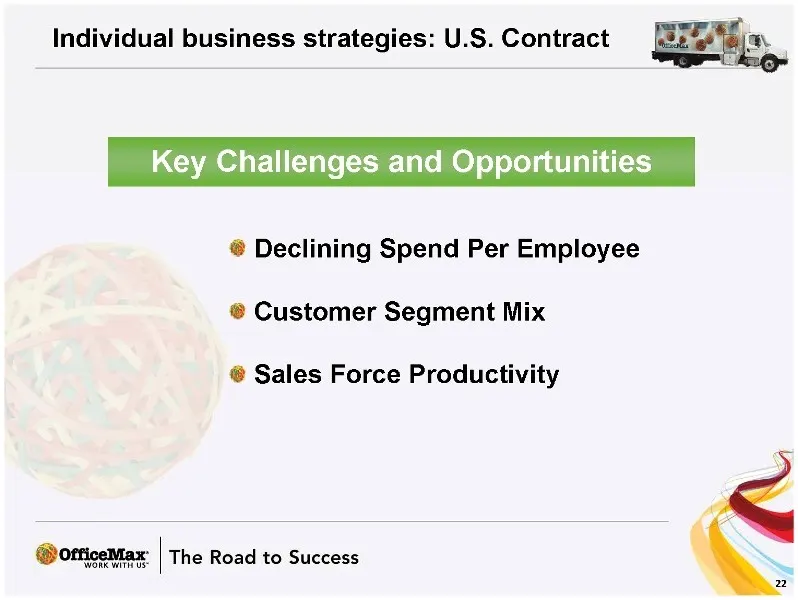
Individual business strategies: U.S. Contract Key Challen ges and Opportunities Declinin g Spend Per Employee Customer Segment Mix Sales Force Productivity
Slide 23: Opportunity gaps – U.S. Contract
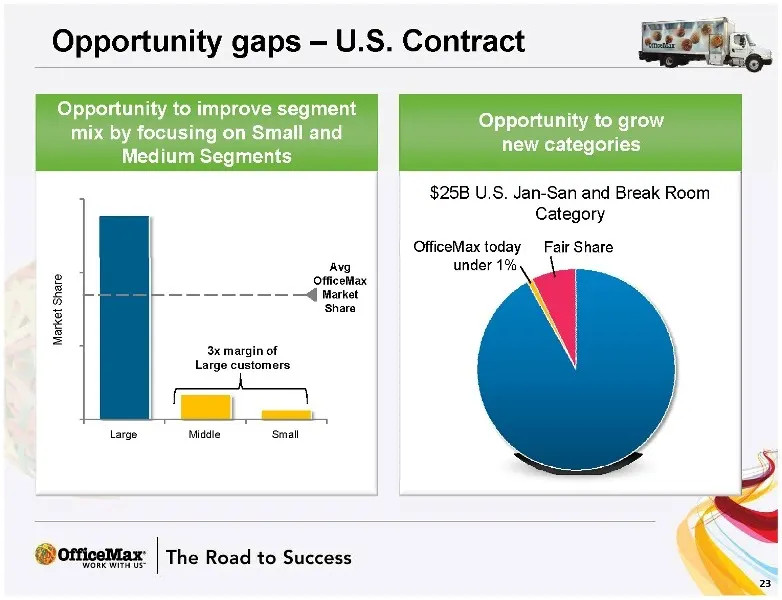
Opportunity gaps – U.S. Contract Opportunity to improve segment Opportunity to grow mix by focusing on Small and new categories Medium Segments $25B U.S. Jan-San and Break Room Category OfficeMax today Fair Share Avg under 1% OfficeMax Share Market arket Share M 3x margin of Large customers Large Mi
Slide 24: Opportunity gaps – U.S. Contract
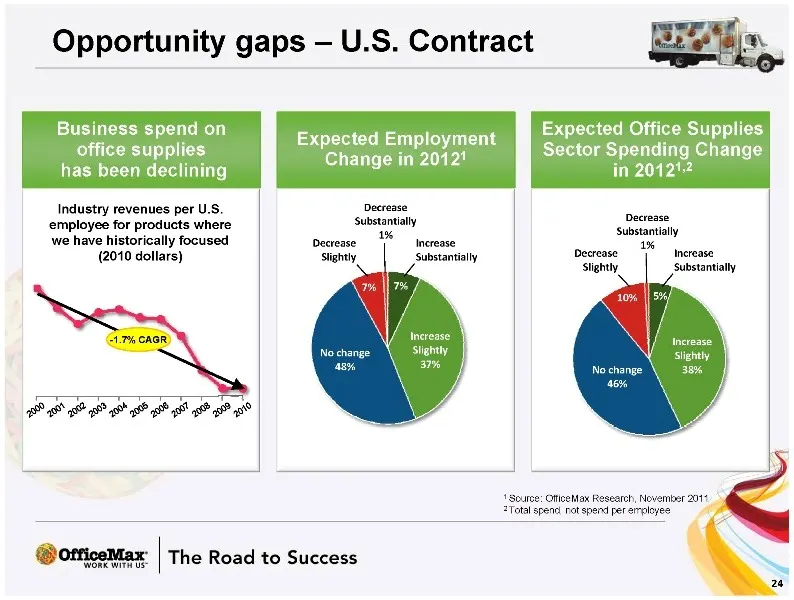
Opportunity gaps – U.S. Contract Business spend on Expected Office Supplies Expected Employment office supplies 1 Sector Spending Change Change in 2012 1,2 has been declining in 2012 Industry revenues per U.S. Decrease Substantially Decrease employee for products where 1% Substantially we have histo
Slide 25: OfficeMax performing similar to OSS competitors on most key elements
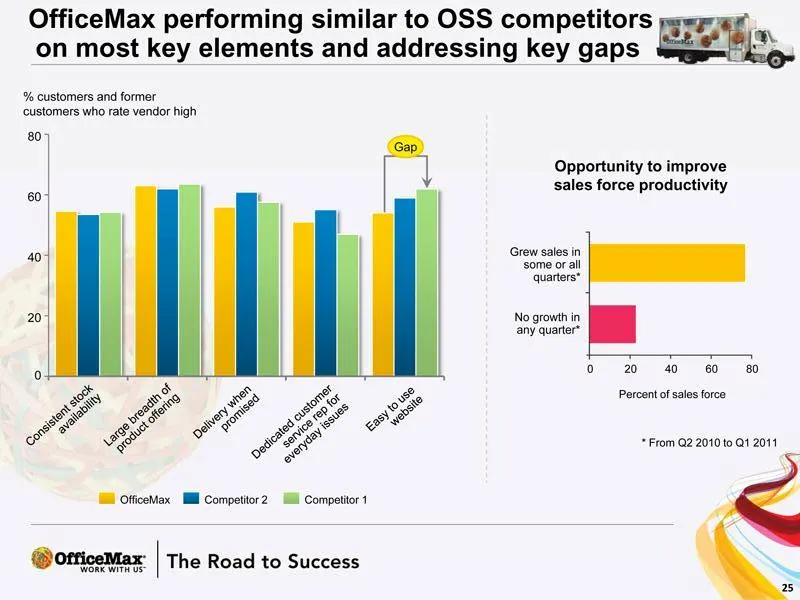
OfficeMax performing similar to OSS competitors on most key elements and addressing key gaps % customers and former customers who rate vendor high Gap Oppo rtunity to improve 60 sales force productivity 40 Grew sales in some or all quarters* 20 No growth in any quarter* 0 20 40 60 80 0 Percent of sa
Slide 26: U.S. Contract Strategies
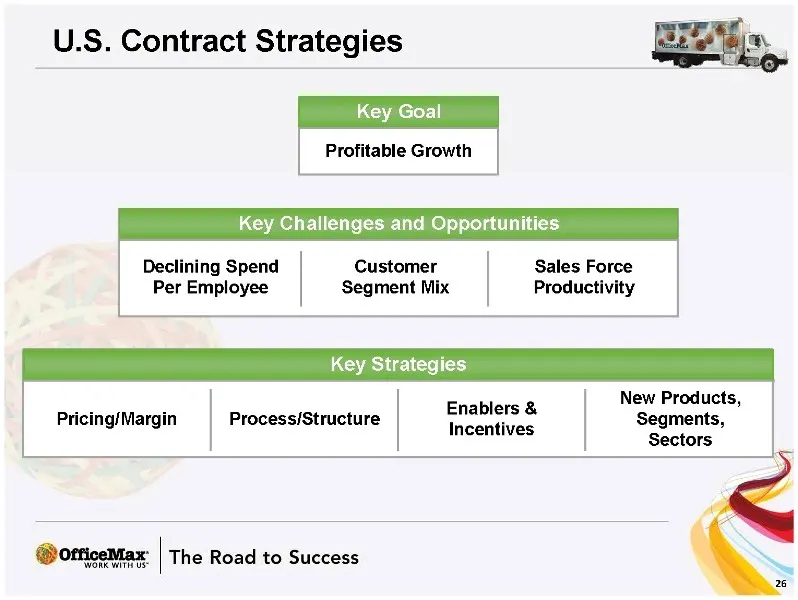
U.S. Contract Strategies Key Goal Profitable Growth Key Challenges and Opportunities Declining Spend Customer Sales Force Per Employee Segment Mix Productivity Key Strategies New Products, Enablers & Pricing/Margin Process/Structure Segments, Incentives Sectors
Slide 27: International Contract Strategies
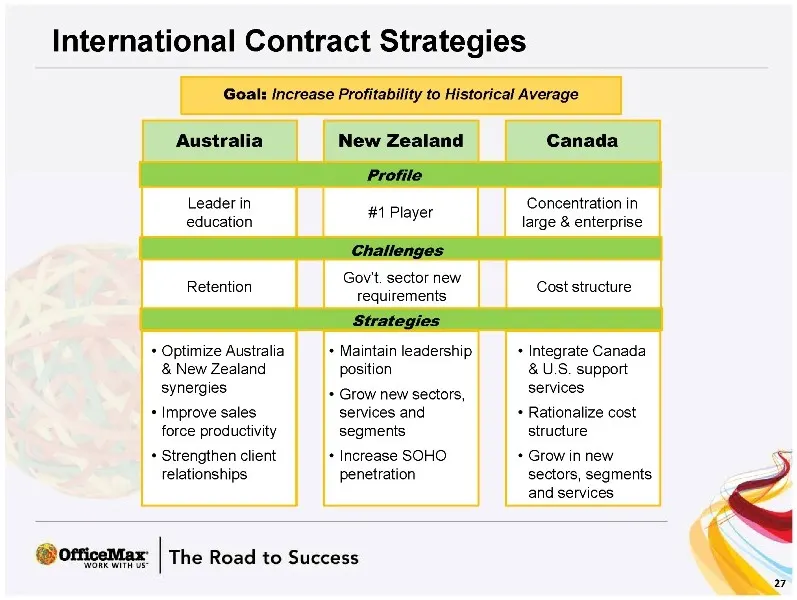
International Contract Strategies Goal: Increase Profitability to Historical Average Australia New Zealand Canada Profile Leader in Concentration in #1 Player education large & enterprise Challen ges Gov’t. sector new Retention Cost structure requirements Strategies • Optimize Australia • Maintain l
Slide 28: Significant Upside in Adjacent Categories
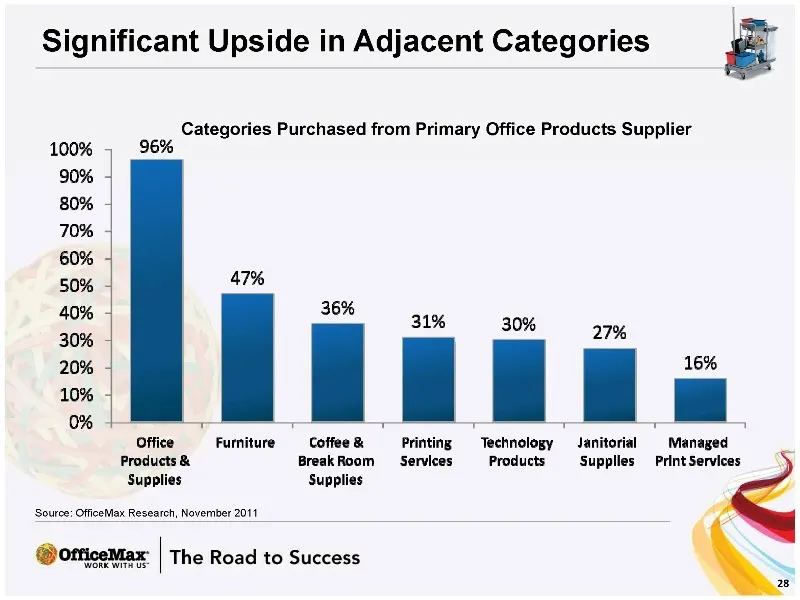
Significant Upside in Adjacent Categories Categories Purchased from Primary Office Products Supplier Source: OfficeMa x Research, November 2011
Slide 29: Adjacency Strategies: Focus on five key growth adjacencies
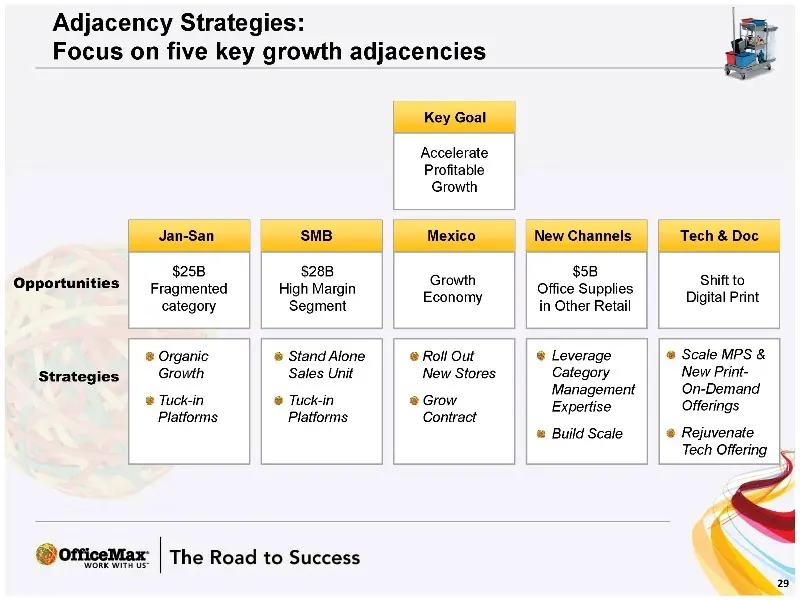
Adjacency Strategies: Focus on five key growth adjacencies Key Goal Accelerate Profitable Growth Jan-San SMB Mexico New Channels Tech & Doc $25B $28B $5B Opportunities Growth Shift to Fragmented High Margin Office Supplies Economy Digital Print category Segment in Other Retail Organic Stand Alone Ro
Slide 30: Digital Strategies: Major focus to drive growth
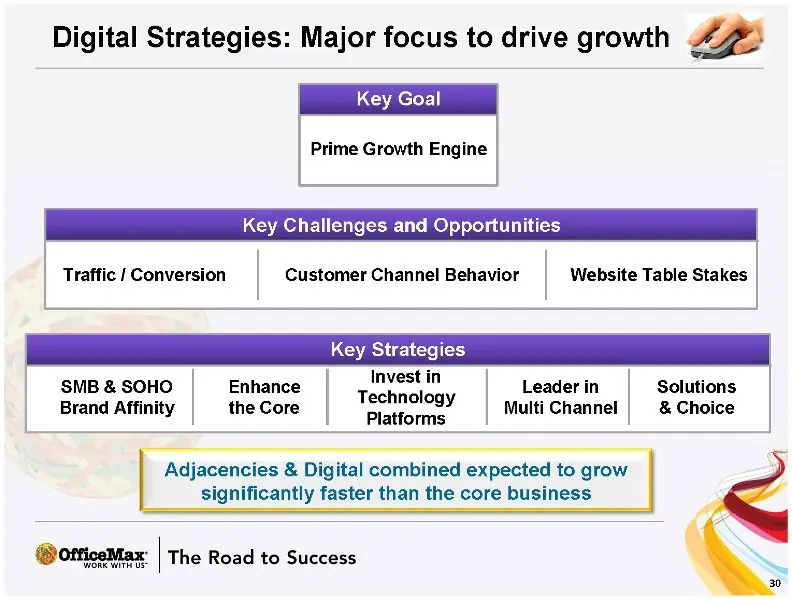
Digital Strategies: Major focus to drive growth Key Goal Prime Growth Engine Key Challenges and Opportunities Traffic / Conversion Customer Channel Behavior Website Table Stakes Key Strategies Invest in SMB & SOHO Enhance Leader in Solutions Technology Brand Affinity the Core Multi Channel & Choice
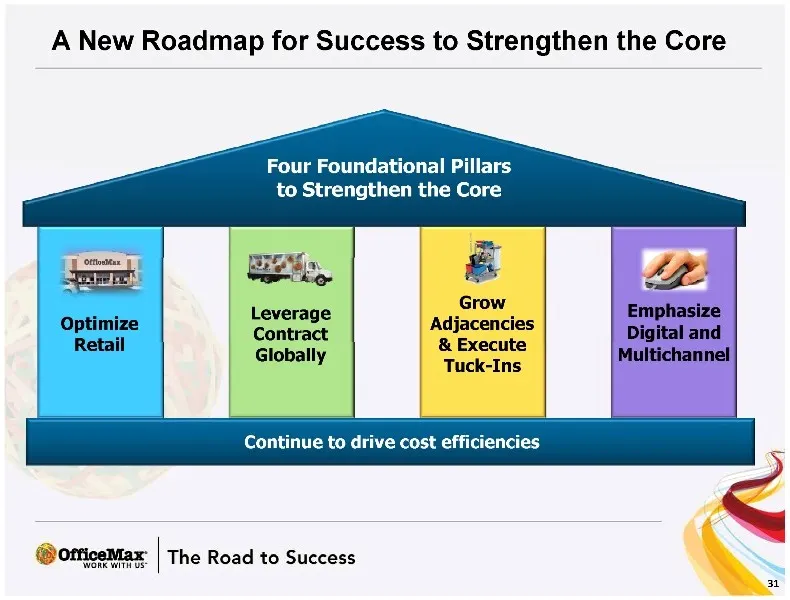
Slide 31: Four Foundational Pillars to Strengthen the Core
Four Foundational Pillars to Strengthen the Core Grow Emphasize Leverage Optimize Adjacencies Contract Digital and Retail & Execute Globally Multichannel Tuck-Ins Continue to drive cost efficiencies
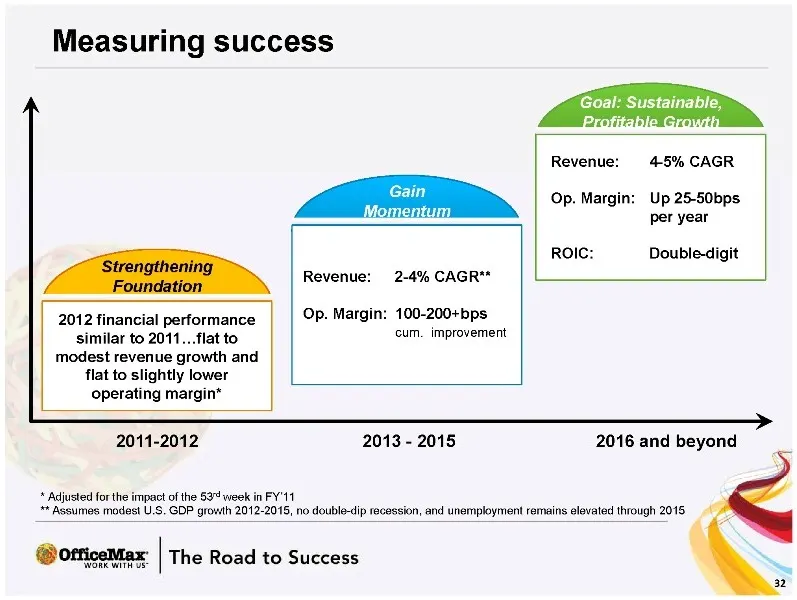
Slide 32: Measuring success
Measuring success Goal: Sustainable, Profitable Growth Revenue: 4-5% CAGR Gain Op. Margin: Up 25-50bps Momentum per year ROIC: Double -digit Strengthening Revenue: 2-4% CAGR** Foundation 2012 financial performance Op. Margin: 100-200+bps similar to 2011…flat to cum. improvement modest revenue growth
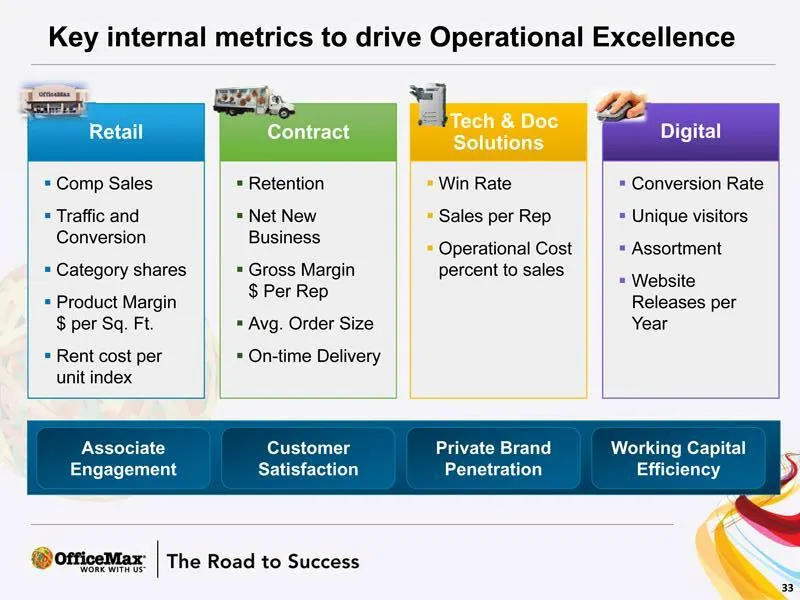
Slide 33: Key internal metrics to drive Operational Excellence
Key internal metrics to drive Operational Excellence Tech & Doc Retail Contract Digital Solutions Comp Sales Retention Win Rate Conversion Rate Traffic and Net New Sales per Rep Unique visitors Conversion Business Operational Cost Assortment Category shares Gross Margin percent to sales Website $ Pe

Slide 34: Conclusion: Road to Success
@ OfficeMax: WORK WITH US” ROAD TO SUCCESS Conclusion 2011 INVESTOR DAY November 16, 2011 - New York City
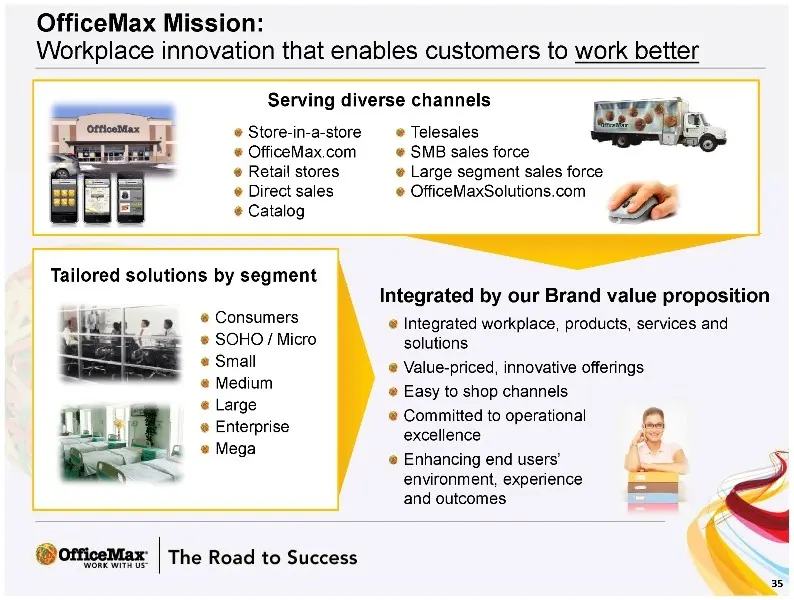
Slide 35: OfficeMax Mission
OfficeMax Mission: Workplace innovation that enables customers to work better Serving diverse channels Store-in-a-store Telesales OfficeMax. com SMB sales force Retail stores Large segment sales force Direct sales OfficeMaxSolutions. com Catalog Tailored solutions by segment Integrated by our Brand
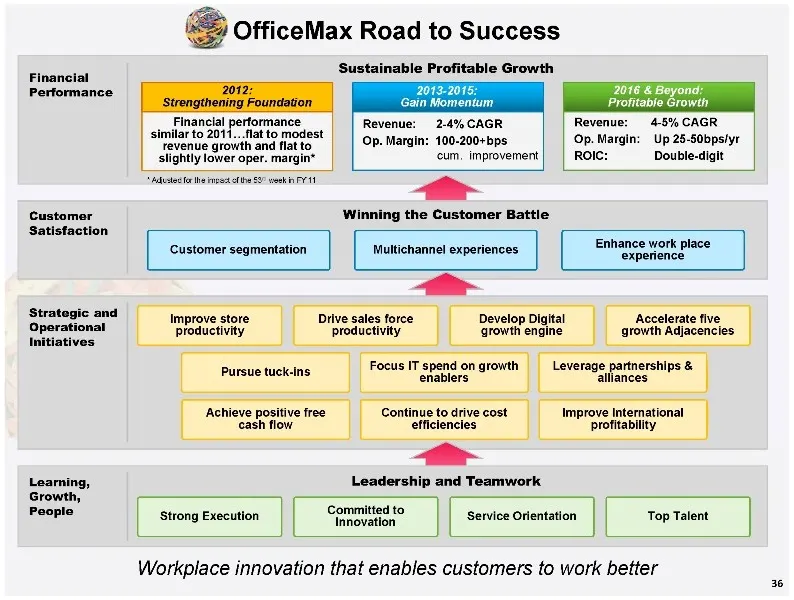
Slide 36: OfficeMax Road to Success
OfficeMax Road to Success Sustainable Profitable Growth Financial Performance 2012: 2013-2015: 2016 & Beyond: Strengthening Foundation Gain Momentum Profitable Growth Financial performance Revenue: 2-4% CAGR Revenue: 4-5% CAGR similar to 2011…flat to modest Op. Margin: Up 25-50bps/yr revenue growth
Source: SEC EDGAR · 8-K filed Nov 16, 2011
More decks from Officemax Inc
 Merger or Acquisition (May 2013)8 slides · May 1, 2013
 Merger or Acquisition (February 2013)18 slides · Feb 28, 2013
 Merger or Acquisition (February 2013)14 slides · Feb 25, 2013
 Merger or Acquisition (February 2013)16 slides · Feb 20, 2013
 Investor Presentation (November 2011)15 slides · Nov 16, 2011
 Investor Presentation (November 2011)10 slides · Nov 16, 2011