Duke Realty — Wells Fargo Real Estate Securities Conference 2016
38 slides from Duke Realty's conference presentation, Feb 24, 2016

Slide 1: Wells Fargo Real Estate Securities Conference
Wells Fargo Real Estate Securities Conference February 24, 2016 RELIABLE. ANSWERS. wy, DutikereAtty
Slide 2: Contents
Contents Asset Strategy = Industrial Portfolio 4 = Medical Office Portfolio 10 = Development Capabilities 16 Capital Recycling 22 Operating Strategy 24 Capital Strategy 30 Why Duke Realty 35 2016 Duke Really Corporation | 2
Slide 3: Strategy for Increasing Shareholder Value
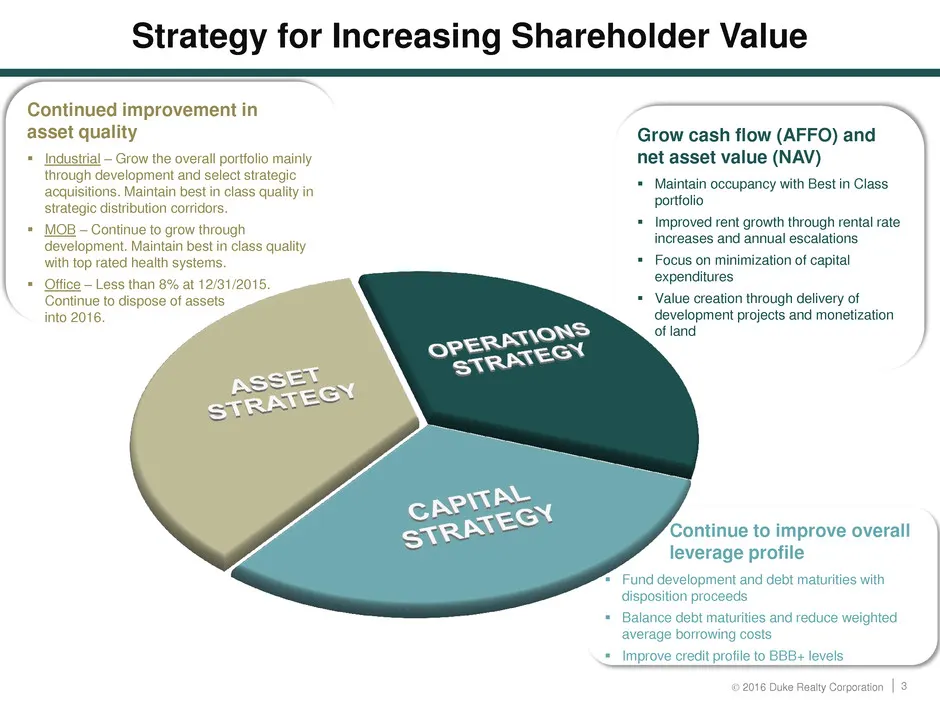
Strategy for Increasing Shareholder Value / Continued improvement in asset quality Grow cash flow (AFFO) and \ net asset value (NAV) . eed occupancy with Best in Class folio . i nite rt ro te ots rate increases and annual esc: Focus on puneazaton of mii expenditure: = Value creation through delivery

Slide 4: Asset Strategy: Industrial Portfolio
ASSET STRATEGY INDUSTRIAL PORTFOLIO
Slide 5: Industrial Strategy
Industrial Strategy Leverage 40 years of industrial operating and development experience as primary driver of company growth Focus on larger, modern bulk distribution product which results in higher credit quality tenants with fewer overall tenants to manage Geographic strategy focused on major mark
Slide 6: Premier Quality Industrial Portfolio
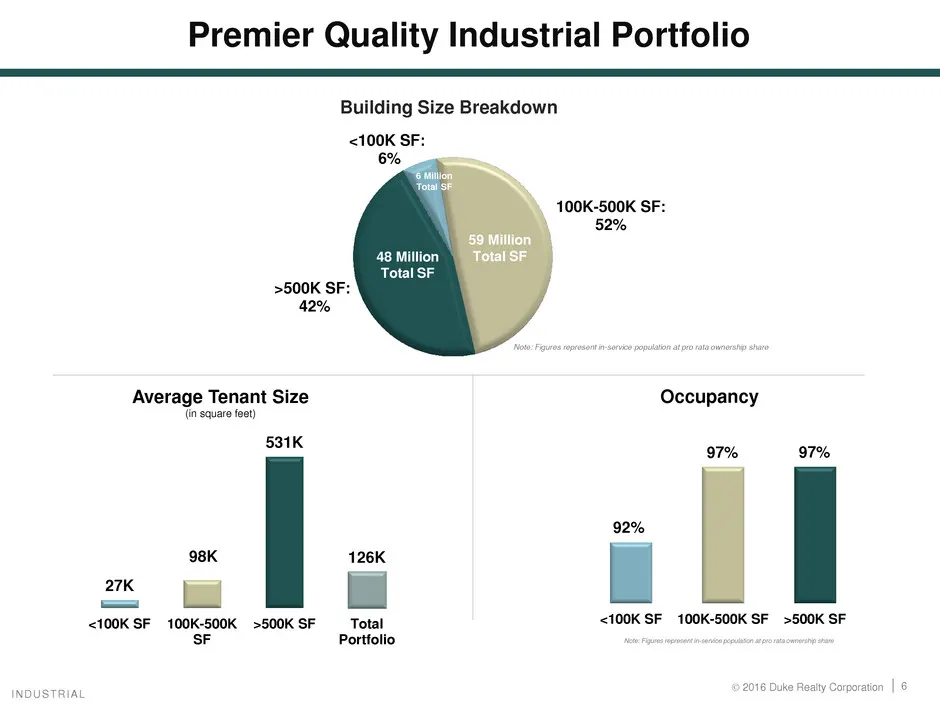
Premier Quality Industrial Portfolio Building Size Breakdown <100K SF: 6% tion 100K-500K SF: 52% 59 Million 48 Million tetas >500K SF: 42% Average Tenant Size Occupancy {in square foot) 531K 98K 126K 27K — <100K SF 100K-500K >500KSF —_Total SF Portfolio
Slide 7: In-Service Industrial Portfolio - Peer Comparison
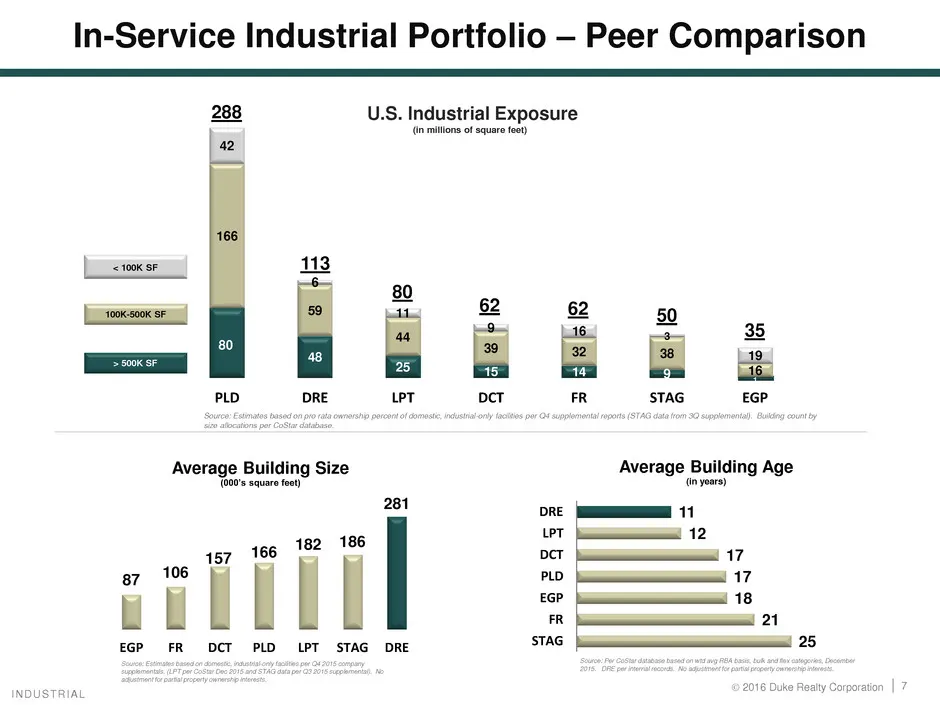
In-Service Industrial Portfolio - Peer Comparison U.S. Industrial Exposure m 288 oe 42 “<100K SF 113 80 (Lwosoocsr a “ s2 50 35 z Boe D ABER Average Building Size Average Building Age Too0s square fet) Ainyour) at a 11 TT a 12 186 157 i @ Oct a 17 ‘i i PLO | 17 EGP 18 i a! 21 LPT STAG DRE NDUSTRIAL
Slide 8: Industrial Portfolio Transformation
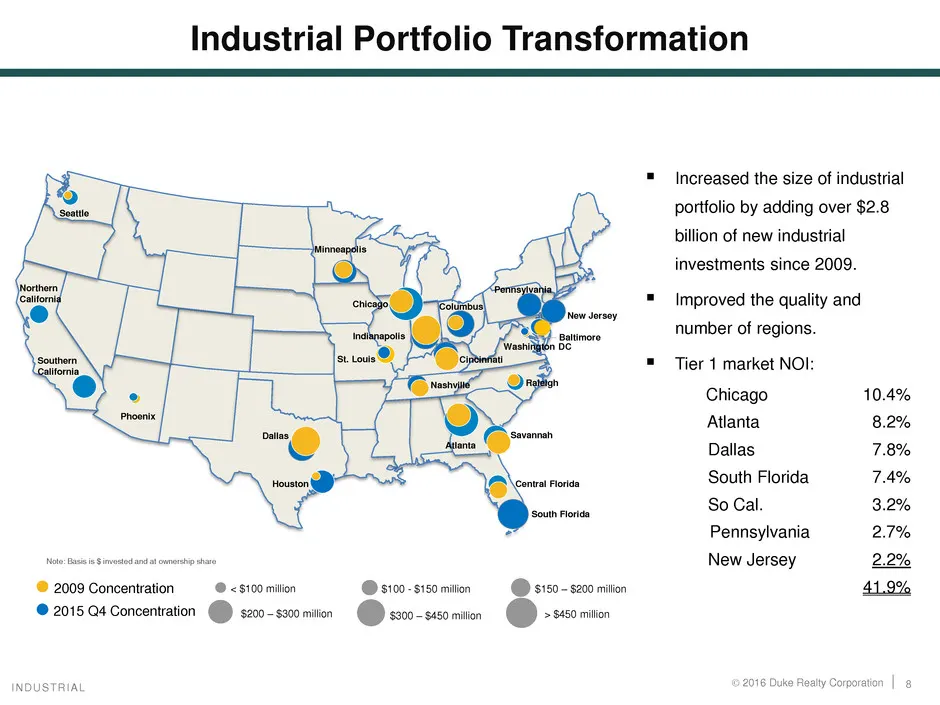
Industrial Portfolio Transformation Increased the size of industrial portfolio by adding over $2.8 billion of new industrial investments since 2009. Improved the quality and number of regions. Tier 1 market NOI: Chicago 10.4% Atlanta 8.2% Dallas 7.8% South Florida 74% So Cal. 3.2% Pennsylvania 2.7%

Slide 9: Leading the Nation in E-commerce Relationships
Leading the Nation in E-commerce Relationships amazon BON-TON Carter's’ Crate&Barrel Walmart ><

Slide 10: Asset Strategy: Medical Office Portfolio
ASSET STRATEGY MEDICAL OFFICE PORTFOLIO
Slide 11: Medical Office Platform Enhances Risk-adjusted Returns
Medical Office Platform Enhances Risk-adjusted Returns Growth industry with recession resistant performance Best in class development team able to produce consistent development opportunities through economic cycles Substantially all on-campus and/or aligned with major hospital systems Long term lea
Slide 12: Medical Office Portfolio
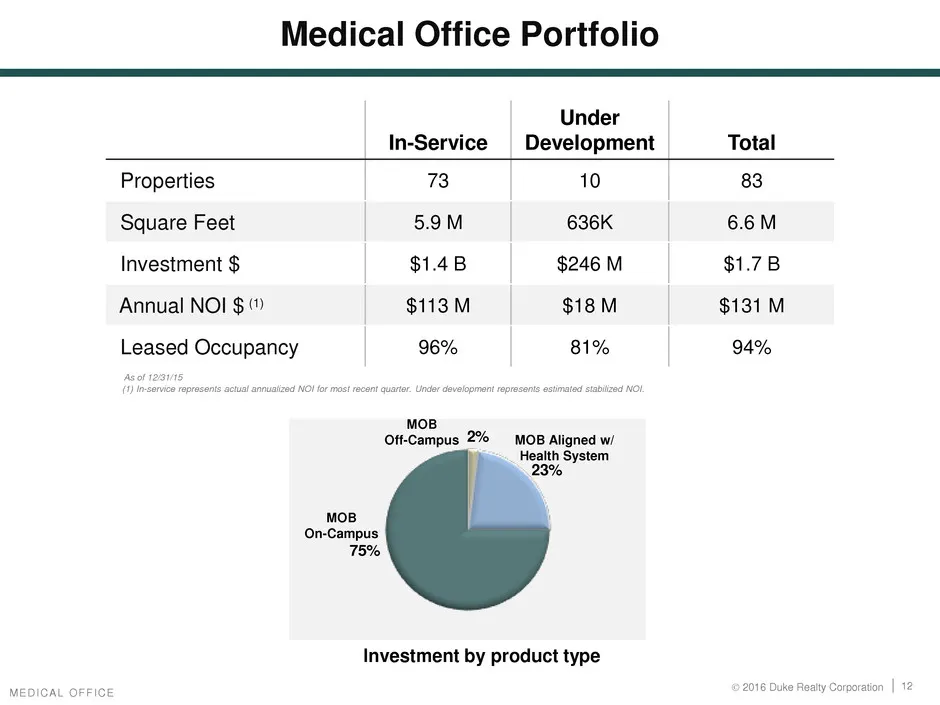
Medical Office Portfolio Under In-Service Total Properties 73 10 83 Square Feet 5.9M 636K 6.6M Investment $ $1.4B $246 M $1.7B Annual NOI $ $113M $18M $131 M Leased Occupancy 96% 81% 94% MOB Off-Campus 2% — MOB Aligned w/ Health System 23% MoB On-Campus 75% Investment by product type
Slide 13: Top Health System Relationships
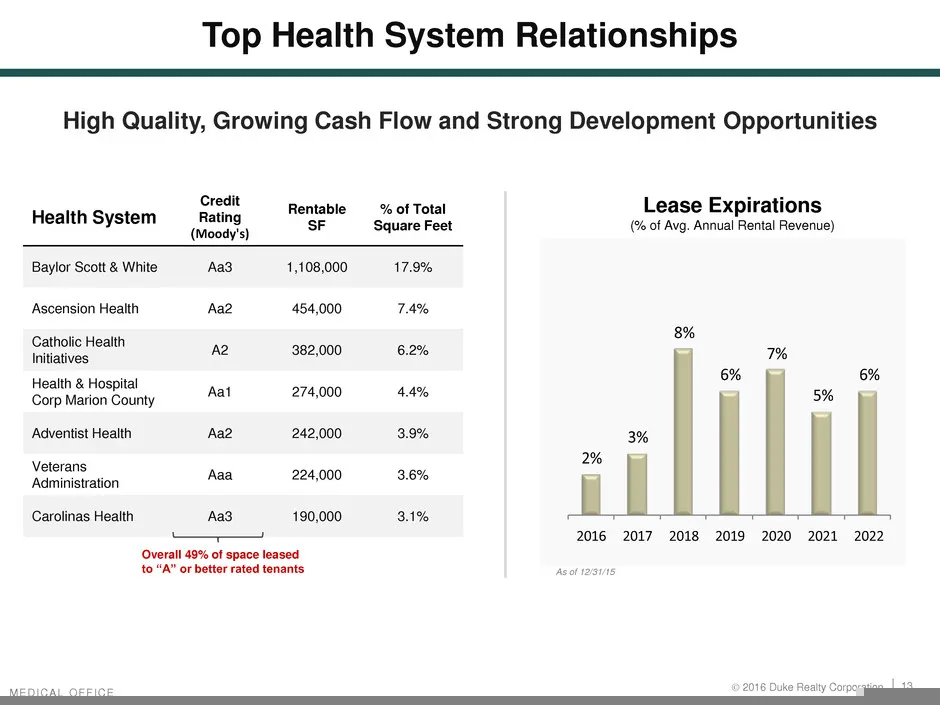
Top Health System Relationships High Quality, Growing Cash Flow and Strong Development Opportunities Credit Rentable _% of Total Health System y ‘hone SF Square Feet, Baylor Scott & White Aas 1,108,000 17.9% ‘Ascension Health ag 454,000 7.4% Poe a2 382,000 6.2% Health & Hospital Corp Marion County f
Slide 14: Best in Class Medical Office Platform
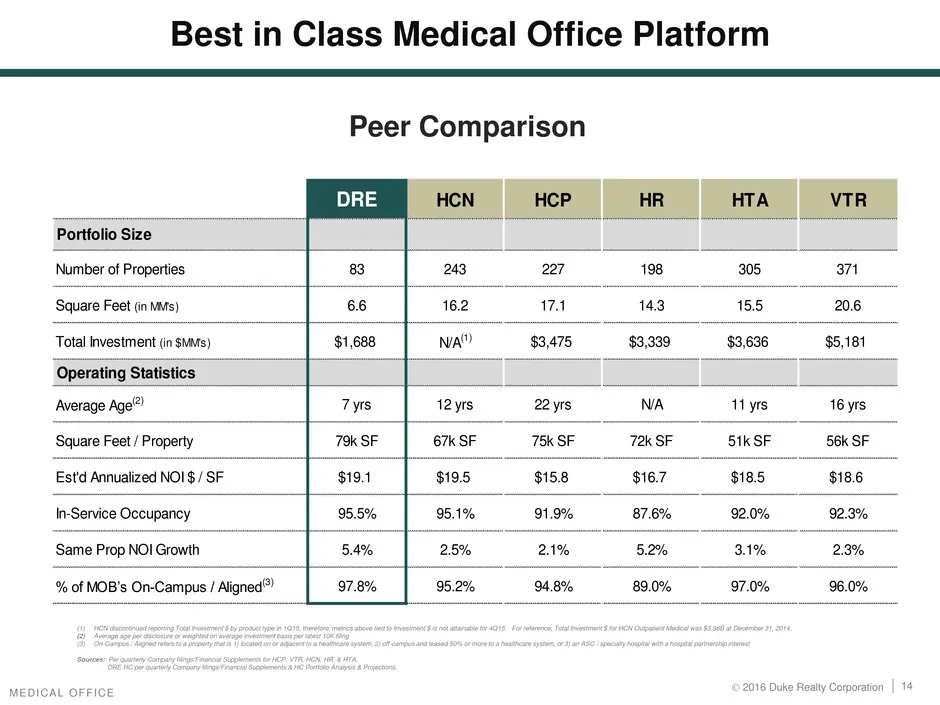
Best in Class Medical Office Platform Peer Comparison Portfolio Size Number of Properties 83 243 227 198 305 37 ‘Square Feet (in vats) 66 162 174 143 155 206 Total Investment (in wits) $1,688 NA” $3,475 $3,339 $3,636 $5,181 Operating Statistics Average Age”) Tyts 12yrs 22 yrs NA 11 yrs 16 yrs ‘Squar
Slide 15: Very Strong Pricing for Top Quality Assets
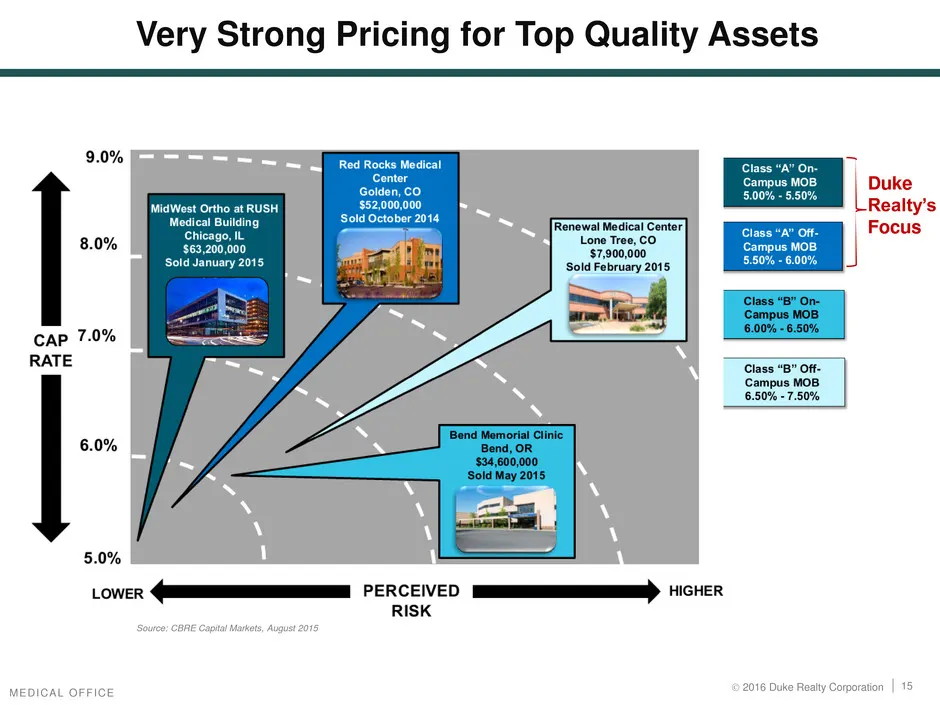
Very Strong Pricing for Top Quality Assets y aad Red Rocks Medical Center Golden, Co MiaWest Ortho at RUSH $52,000,000 Medical Building Sold October 2014 8.0% Chicago, i “ 0% $63,200,000 900,000 Sold January 2015 Sold February 2015 hie | “ait cap 7.0% RATE 6.0% 5.0% LOWER SE PERCEIVED E> HIGHER RISK
Slide 16: Asset Strategy: Development Capabilities
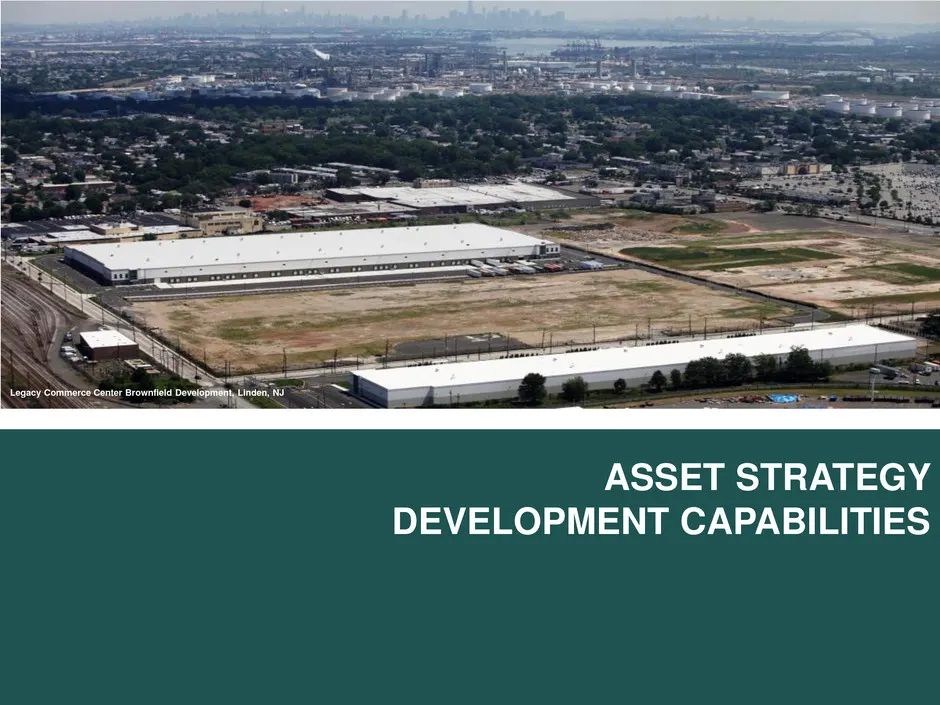
ASSET STRATEGY DEVELOPMENT CAPABILITIES
Slide 17: Development Strategic Advantages
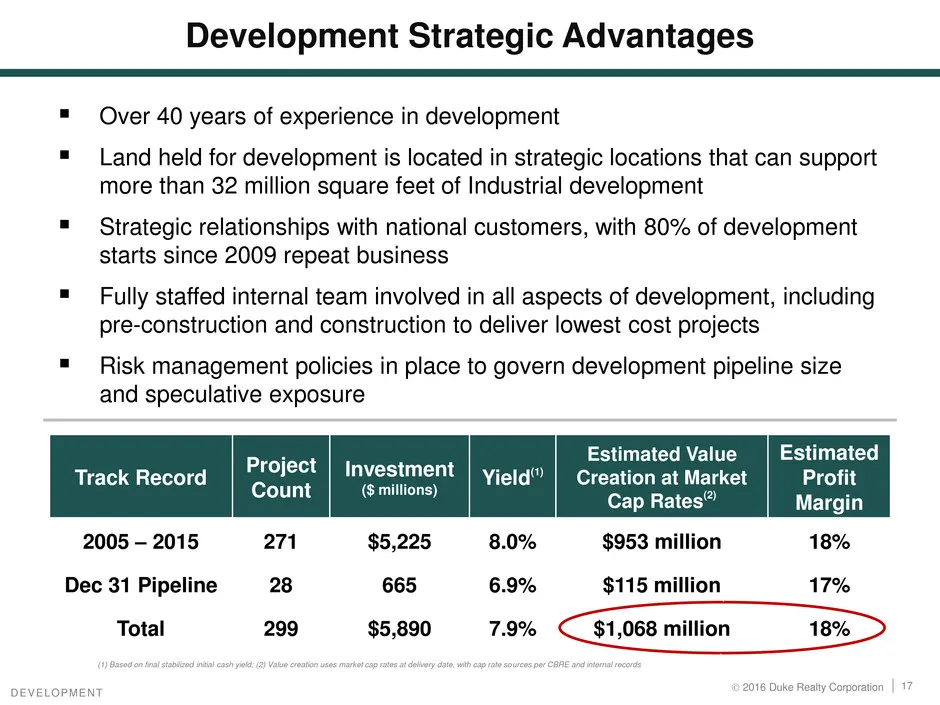
Development Strategic Advantages Over 40 years of experience in development Land held for development is located in strategic locations that can support more than 32 million square feet of Industrial development Strategic relationships with national customers, with 80% of development starts since 20
Slide 18: Scalable Development Platform - Proven through Cycles
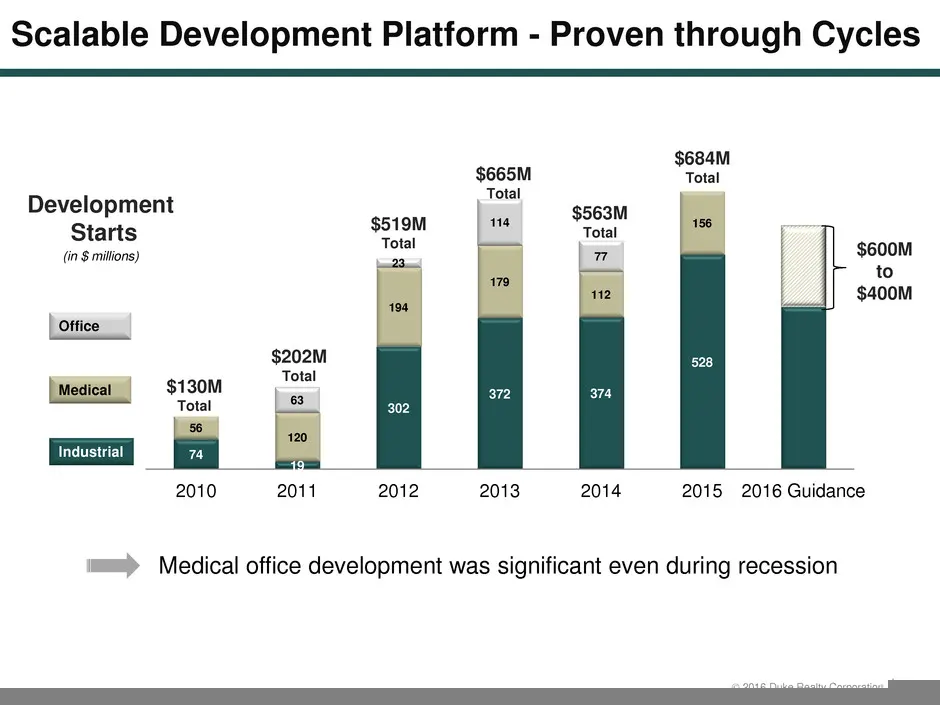
Scalable Development Platform - Proven through Cycles $665M Development Total Starts (in $ millions) 2010 2011 2012 2013 2014 2015 2016 Guidance ==> Medical office development was significant even during recession
Slide 19: Successful Execution of Speculative Developments
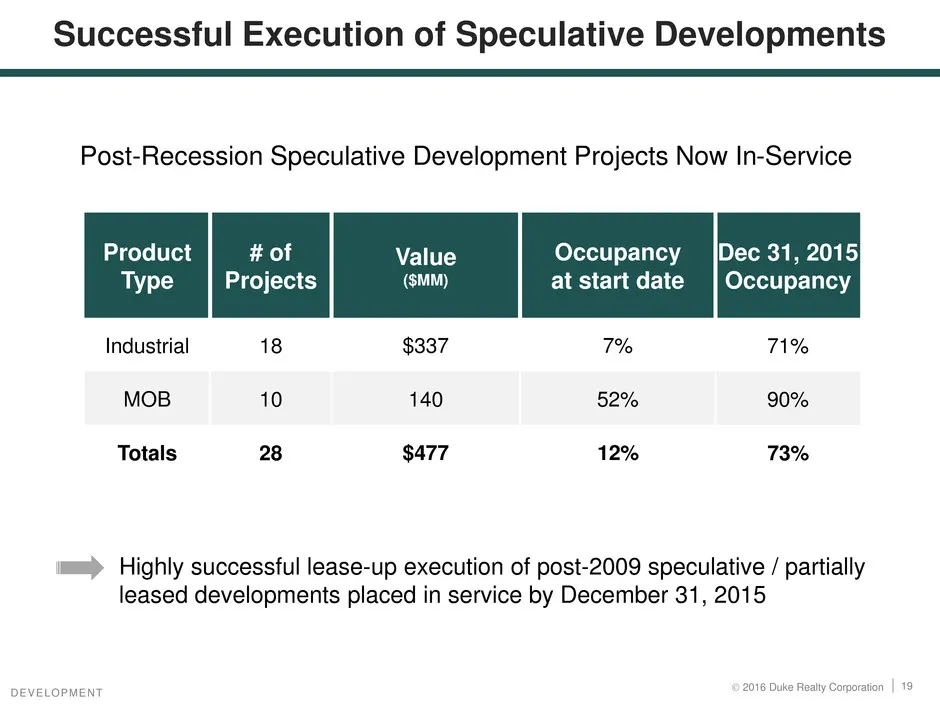
Successful Execution of Speculative Developments Post-Recession Speculative Development Projects Now In-Service Product # of Value Occupancy Dec 31, 2015) Type Projects (smm) at start date | Occupancy Industrial 18 $337 MOB 10 140 52% 90% Totals 28 $477 12% 73% mm) Highly successful lease-up executi
Slide 20: 2015 Select Industrial Development Starts
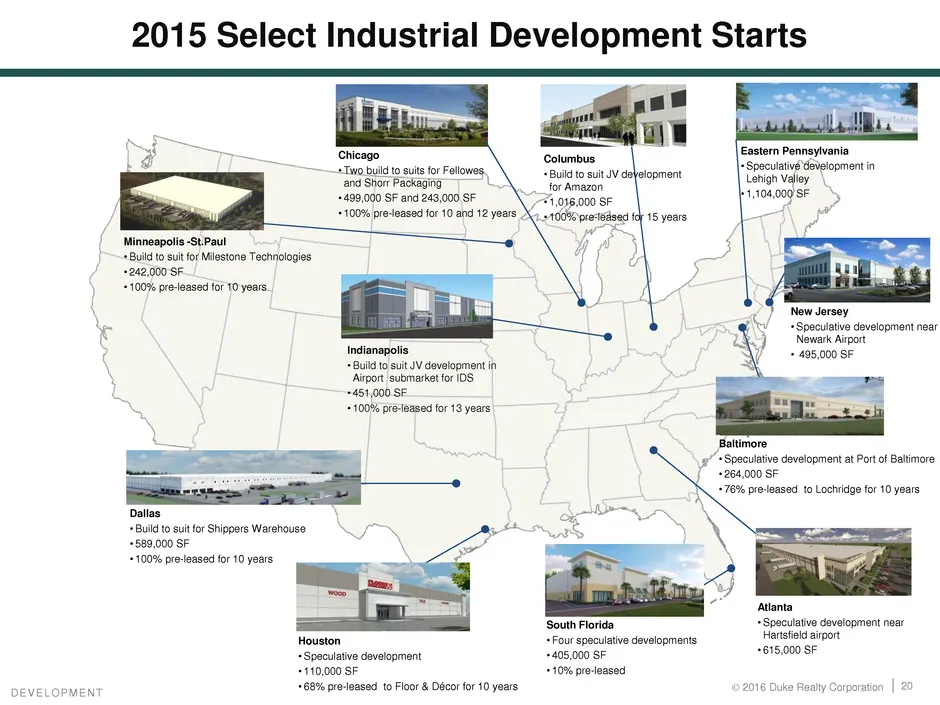
2015 Select Industrial Development Starts Chicago -+Two build to sults for Fellowes, ‘and Shorr Pack L stern Pennsyivani + 499,000 SF and 243,000 SF jpre-leased for 10 and 12 years Minneapolis ~ tudo seat of arene Technologies + 282,000 SF + 100% pre-leased for 10 years “Sect evelopment nar } atk Ai
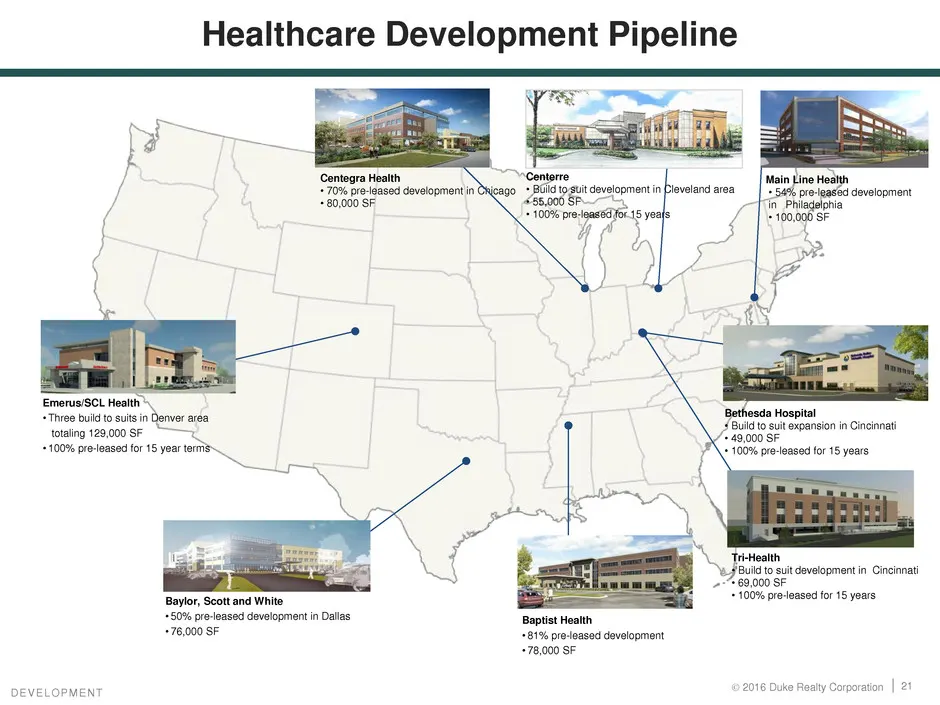
Slide 21: Healthcare Development Pipeline
Healthcare Development Pipeline Centegra Health + 80,000 SF ee Philagelphia : i + 100,000 SF i 8 Hospital eae Toul expansion in Grcnnat 100% pre eesed for 1 years + 100% proeased for 15 years Baylor, Scott and. pooner Baptist +78,000 SF ps a development DEVELOPMEN

Slide 22: Capital Recycling / Self-Funding
CAPITAL RECYCLING / SELF-FUNDING
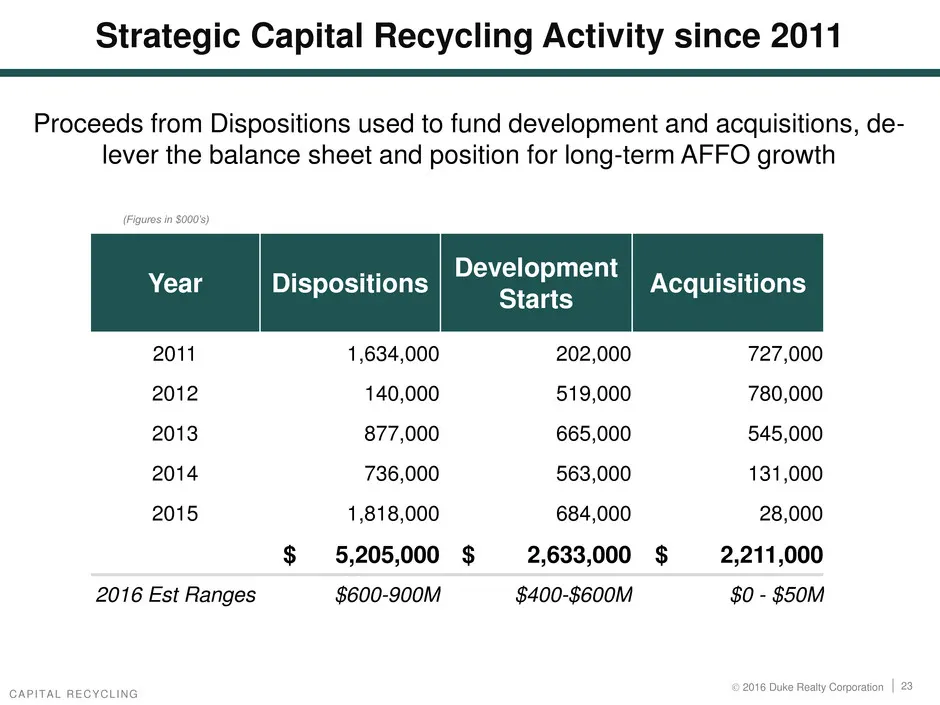
Slide 23: Strategic Capital Recycling Activity since 2011
Strategic Capital Recycling Activity since 2011 Proceeds from Dispositions used to fund development and acquisitions, de- lever the balance sheet and position for long-term AFFO growth Development Year Dispositions Starts Acquisitions 2011 1,634,000 202,000 727,000 2012 140,000 519,000 780,000 2013

Slide 24: Operating Strategy
OPERATING STRATEGY
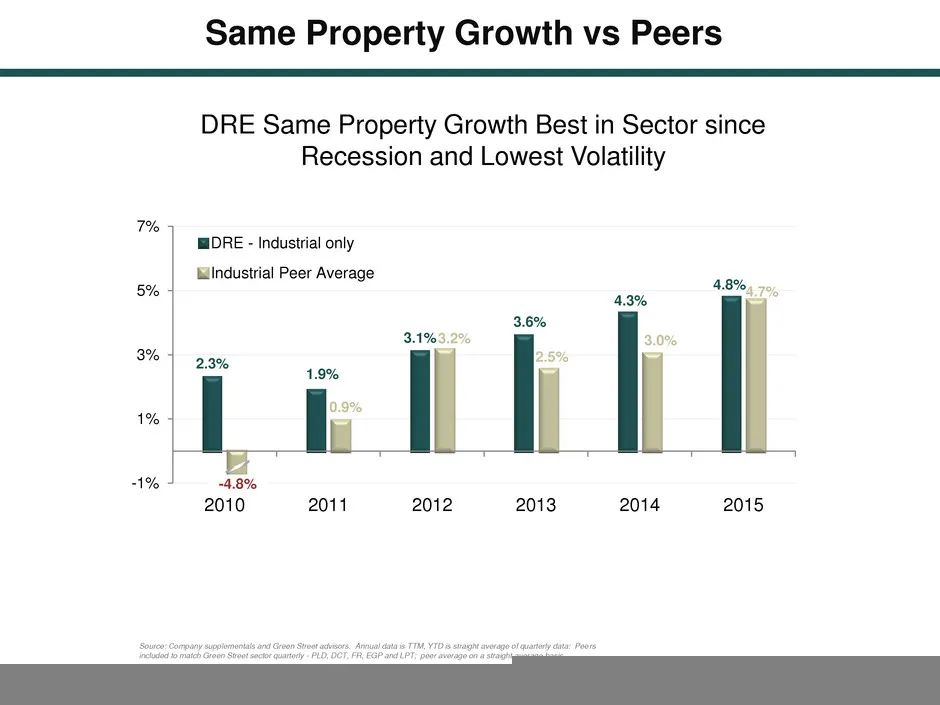
Slide 25: Same Property Growth vs Peers
Same Property Growth vs Peers 7% 5% 3% 1% 1% DRE Same Property Growth Best in Sector since Recession and Lowest Volatility HIDRE - Industrial only luindustrial Peer Average 2010 2011 2012 2013 2014 2015
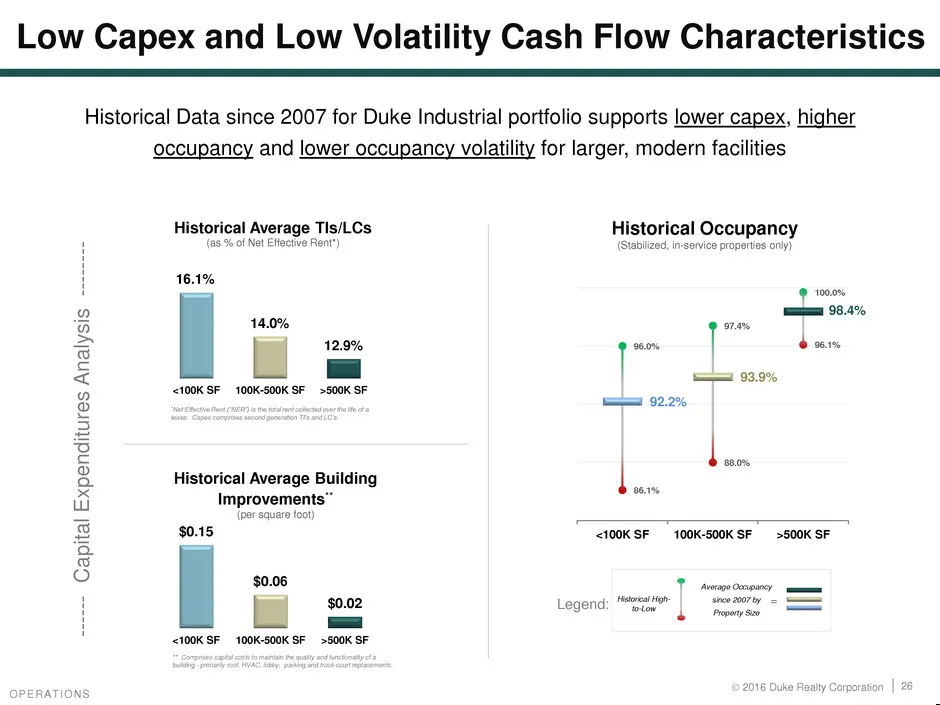
Slide 26: Low Capex and Low Volatility Cash Flow Characteristics
Low Capex and Low Volatility Cash Flow Characteristics Historical Data since 2007 for Duke Industrial portfolio supports lower capex, higher occupancy and lower occupancy volatility for larger, modern facilities Histo ical Average Tis/LCs Historical Occupancy ' of Net Etfecive Rent”) (Stabilized, in
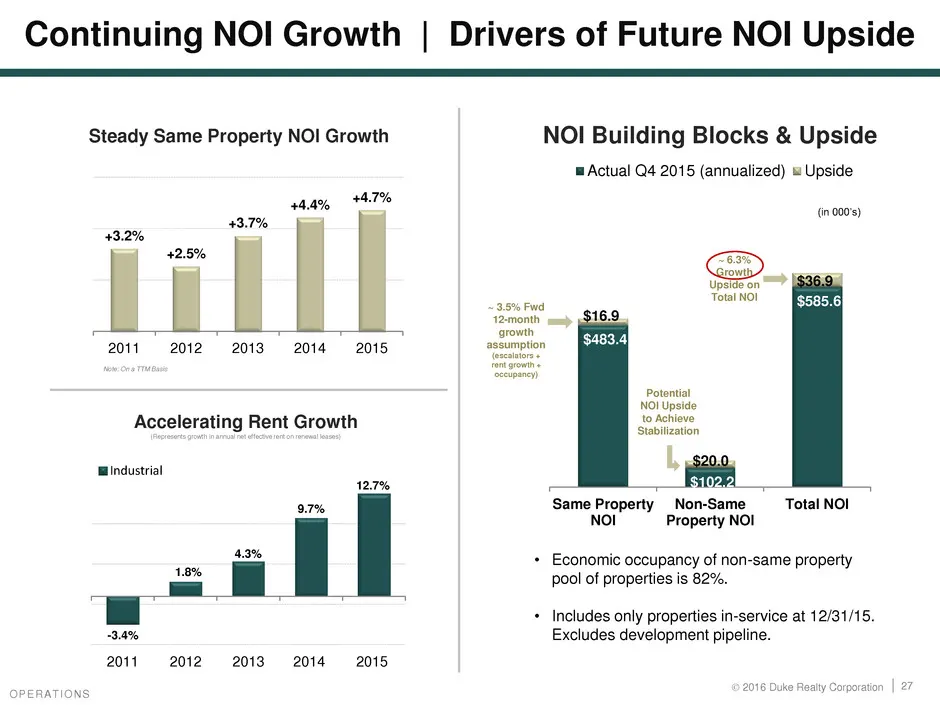
Slide 27: Continuing NOI Growth | Drivers of Future NOI Upside
Continuing NOI Growth | Drivers of Future NOI Upside Steady Same Property NOI Growth NOI Building Blocks & Upside w Actual Q4 2015 (annualized) & Upside 140% 447% (0008) Upside on bad etal No! growth 2011 2012-2013 20142018 = Accelerating Rent Growth industrial 0.7% Same Property Non-Seme, Total NOI
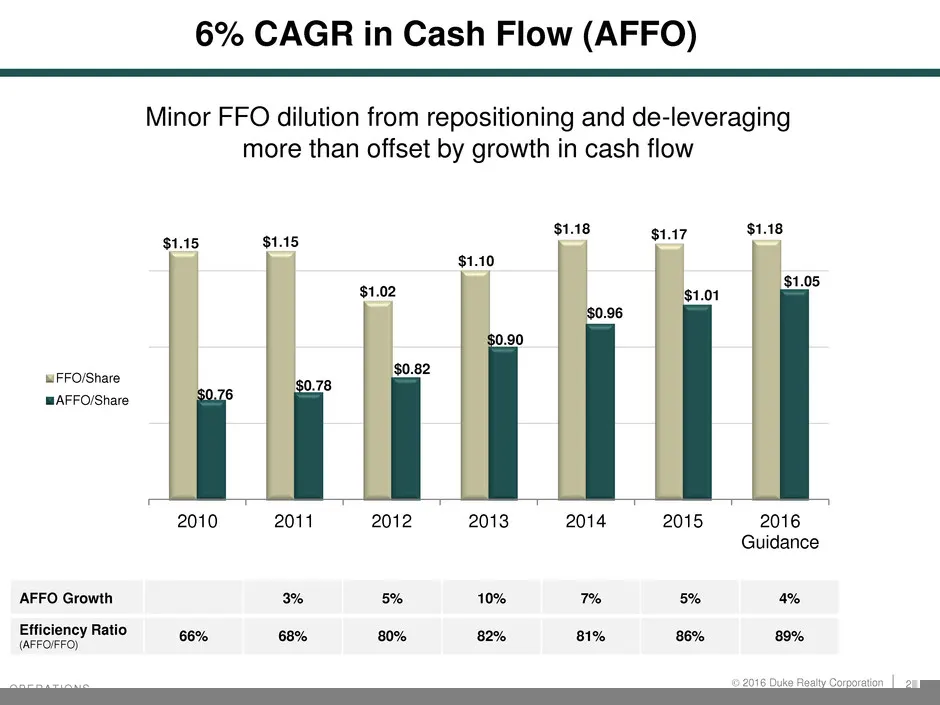
Slide 28: 6% CAGR in Cash Flow (AFFO)
6% CAGR in Cash Flow (AFFO) Minor FFO dilution from repositioning and de-leveraging more than offset by growth in cash flow $1.17 wFFO/Share WAFFO/Share 2010 2011 2012 2013 2014 2015, 2016 Guidance AFFO Growth 3% 5% 10% 1% 5% 4% Efficiency Ratio aEsarcond 66% 68% 80% 82% 81% 86% 89%
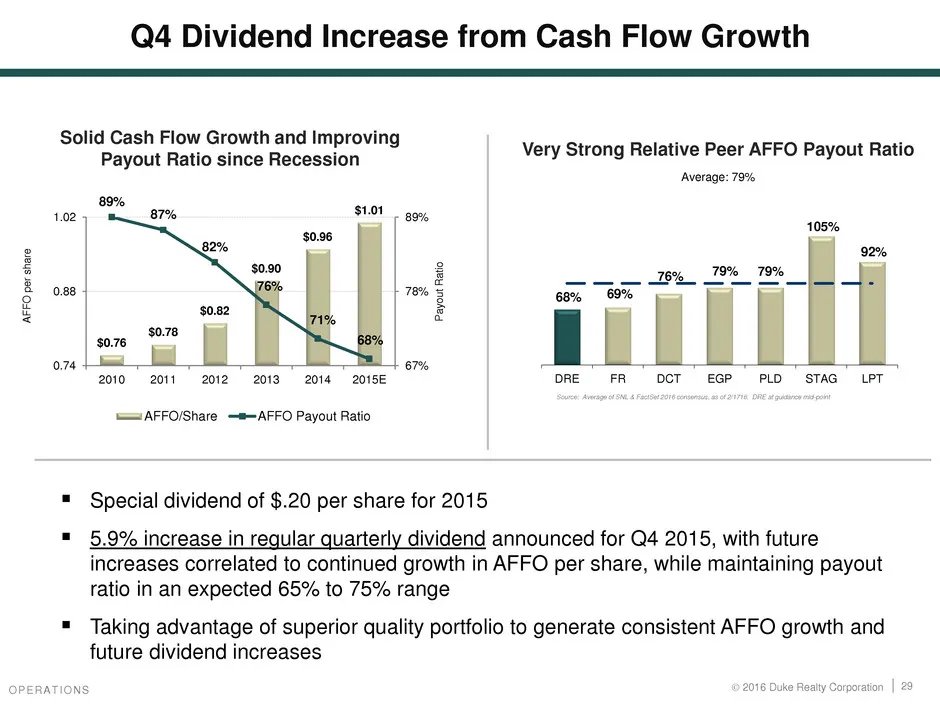
Slide 29: Q4 Dividend Increase from Cash Flow Growth
Q4 Dividend Increase from Cash Flow Growth Solid Cash Flow Growth and Improving Payout Ratio since Recession Very Strong Relative Peer AFFO Payout Ratio ‘Average: 79% 68% 69% ‘AFFO per share | | | < [mb : my mls Fl | a 2010 20112012 2013.2014-2015E =SAFFO/Share —@-AFFO Payout Ratio Special dividend

Slide 30: Capital Strategy
CAPITAL STRATEGY
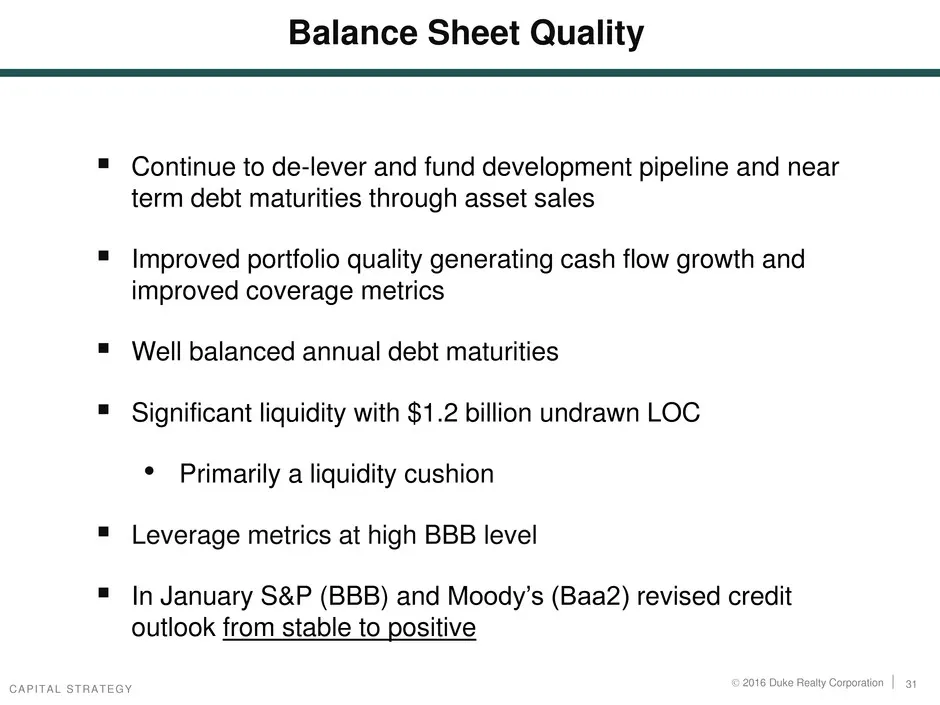
Slide 31: Balance Sheet Quality
Balance Sheet Quality Continue to de-lever and fund development pipeline and near term debt maturities through asset sales Improved portfolio quality generating cash flow growth and improved coverage metrics Well balanced annual debt maturities Significant liquidity with $1.2 billion undrawn LOC ¢ P
Slide 32: Key Capital Metrics
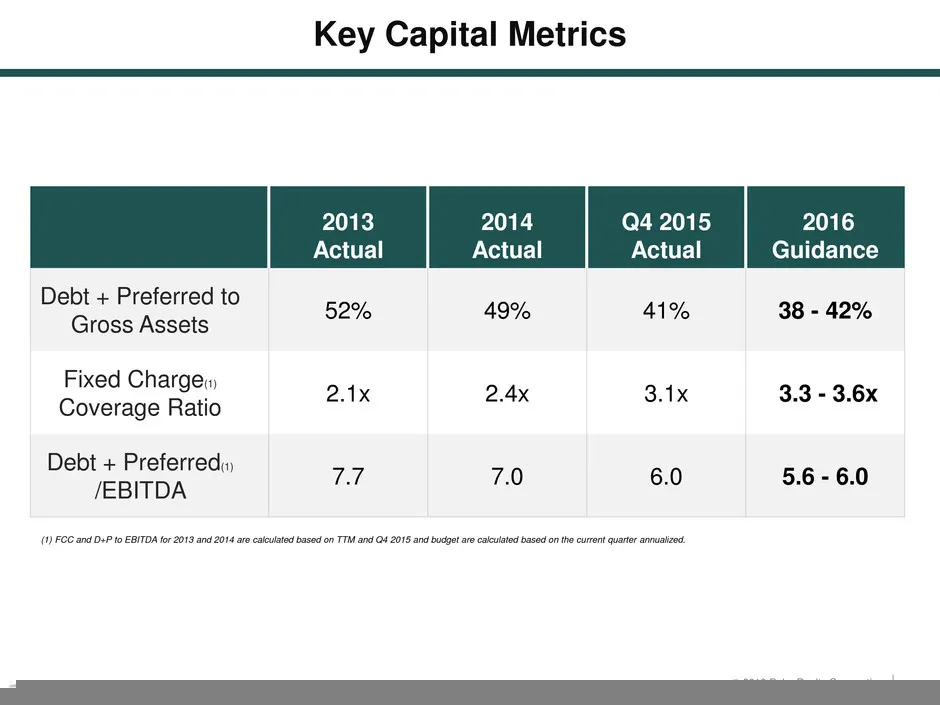
Key Capital Metrics 2013 2014 Q4 201 2016 Actual Actual Actual Guidance Debt + Preferred to Gross Assets Bie 49% 41% 38 - 42% Rixed Charge 24x 2.4x 3.1x 3.3 - 3.6x Coverage Ratio Debt + Preferred.) /EBITDA 77 7.0 6.0 5.6 - 6.0
Slide 33: Balanced Debt Maturities
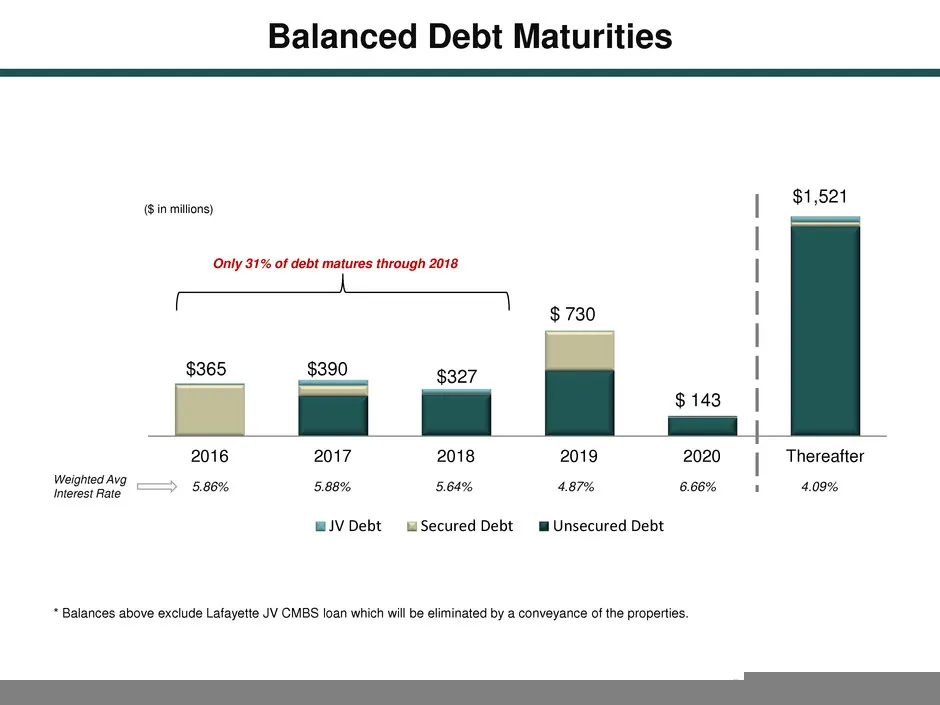
Balanced Debt Matu (Sin millions) Only 31% of debt matures through 2018 2016 2017 2018 2019 2020 | Thereafter Weighted A bieestnee, 8.80% 5.88% 5.64% 4.87% 666% 4 4.09% wJVDebt Secured Debt m™ Unsecured Debt * Bal JV CMBS li the properties.
Slide 34: Conservative Relative Debt Structure with Upside
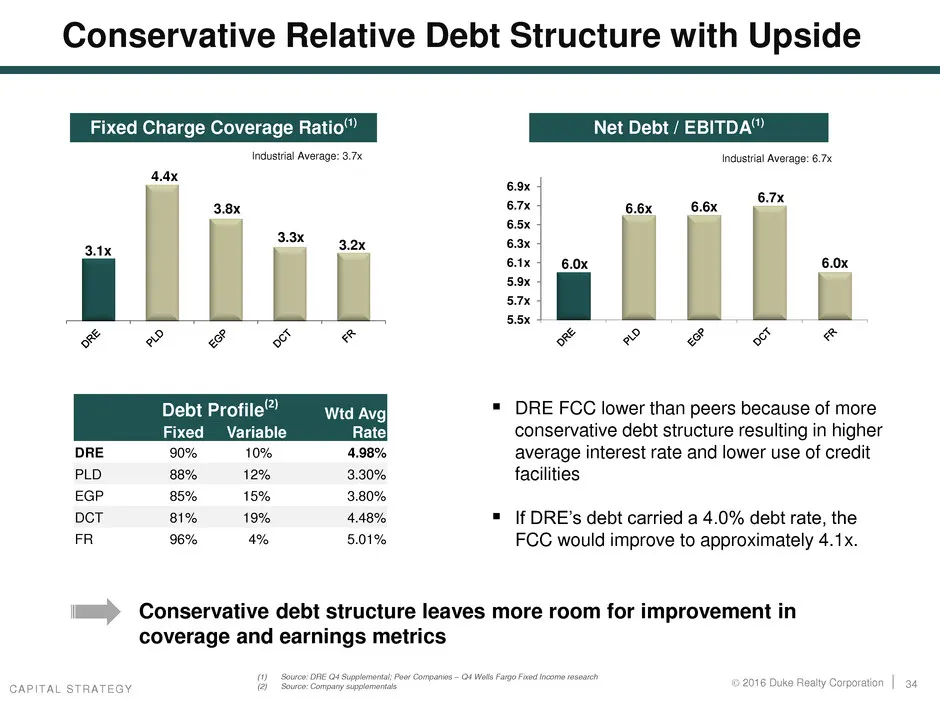
Conservative Relative Debt Structure with Upside Fixed Charge Coverage Ratio” Net Debt / EBITDA” Industrial Average: 3.7« Industial Average: 6.7 ax 6.7x 6.0x é ¢ € * Ts ~ [ys Debt Profile” Wtd Avg = DRE FCC lower than peers because of more ‘ixed Variable Rate} conservative debt structure resulting i

Slide 35: Why Duke Realty
WHY DUKE REALT
Slide 36: Initial Guidance - as of January 27th, 2016
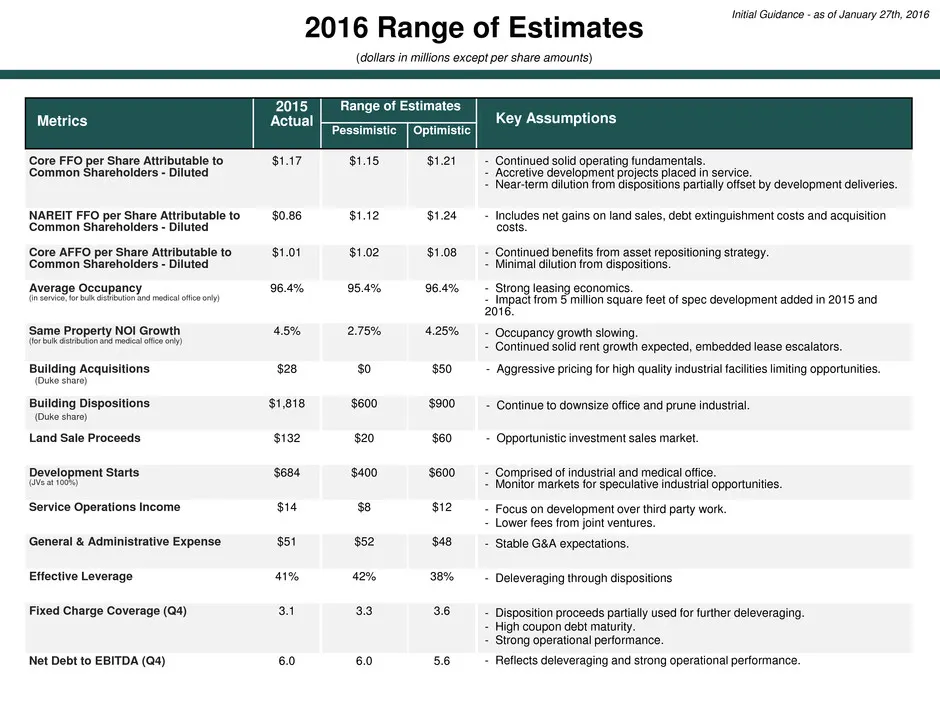
Initial Guidance - as of January 27th, 2016 2016 Range of Estimates (dollars in millions except per share amounts) Range of Estimates Key Assumptions Pessimistic ] Optimistic Core FFO per Share Attributable to $1.47 $1.15 $1.21 Continued solid operating fundamental ‘Common Shareholders - Diluted = A
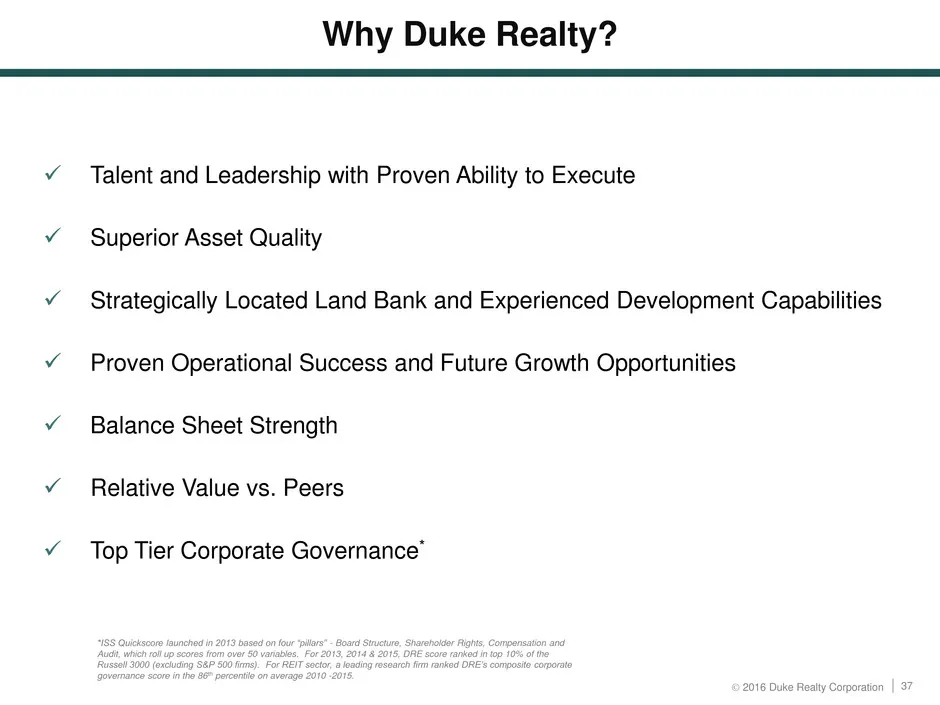
Slide 37: Why Duke Realty?
Why Duke Realty? Talent and Leadership with Proven Ability to Execute Superior Asset Quality Strategically Located Land Bank and Experienced Development Capabilities Proven Operational Success and Future Growth Opportunities Balance Sheet Strength Relative Value vs. Peers Top Tier Corporate Governan
Slide 38: Forward-Looking Statement
Forward-Looking Statement This slide presentation contain: u i tate its” within the meaning of the Securities Act of 1933 and the Securl jes Exchange Act of 1934 as amended by the Priva Securitas Litigation Reform Act of 1995. These 1 regarding (1) strategie Initiatives with respect to our ‘assets,
Source: SEC EDGAR · 8-K filed Feb 24, 2016
More decks from Duke Realty Corporation
 Merger or Acquisition (June 2022)14 slides · Jun 13, 2022
 Investor Presentation (June 2021)58 slides · Jun 7, 2021
 Investor Presentation (May 2021)44 slides · May 10, 2021
 Investor Presentation (February 2021)58 slides · Feb 22, 2021
 NAREIT REITworld Virtual Investor Conference 202056 slides · Nov 16, 2020
 B of A Securities 2020 Global Real Estate Conference56 slides · Sep 15, 2020