Vertex Energy — Investor Presentation (March 2023)
35 slides from Vertex Energy's investor presentation, Mar 22, 2023
Slide 1: Overview Presentation Vertex Energy March 2023
OVERVIEW PRESENTATION Vertex Energy March 2023
Slide 2: Disclaimer: Forward-Looking Statements
Disclaimer Forward - Looking Statements Certain of the matters discussed in this presentation which are not statements of historical fact constitute forward - looking statements within the meaning of the securities laws, including the Private Securities Litigation Reform Act of 1995 , that involve a
Slide 3: Disclaimer: Date of Information, Industry Information, Projections
Disclaimer Date of Information in Presentation All information in this presentation is as of March 6 , 2023 (unless otherwise stated) . The Company undertakes no duty to update any forward - looking statement to conform the statement to actual results or changes in the Company’s expectations . Indus
Slide 4: Disclaimer: Non-GAAP Financial Measures
Disclaimer Non - GAAP Financial Measures In addition to our results calculated under generally accepted accounting principles in the United States (“GAAP”), in this presentation we also present EBITDA, Adjusted EBITDA, adjusted gross margin, adjusted gross margin per throughput barrel and fuel gross
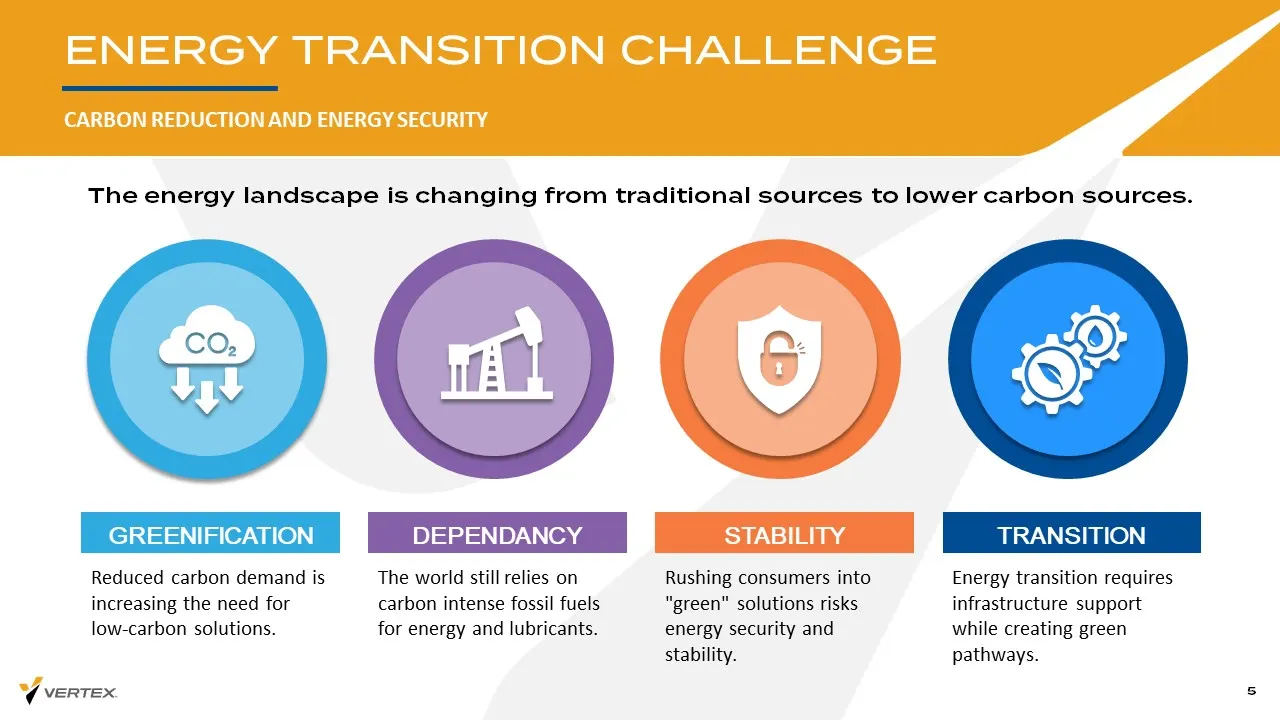
Slide 5: Energy Transition Challenge: Carbon Reduction and Energy Security
ENERGY TRANSITION CHALLENGE CARBON REDUCTION AND ENERGY SECURITY 5 The energy landscape is changing from traditional sources to lower carbon sources. Reduced carbon demand is increasing the need for low - carbon solutions. GREENIFICATION Rushing consumers into "green" solutions risks energy security
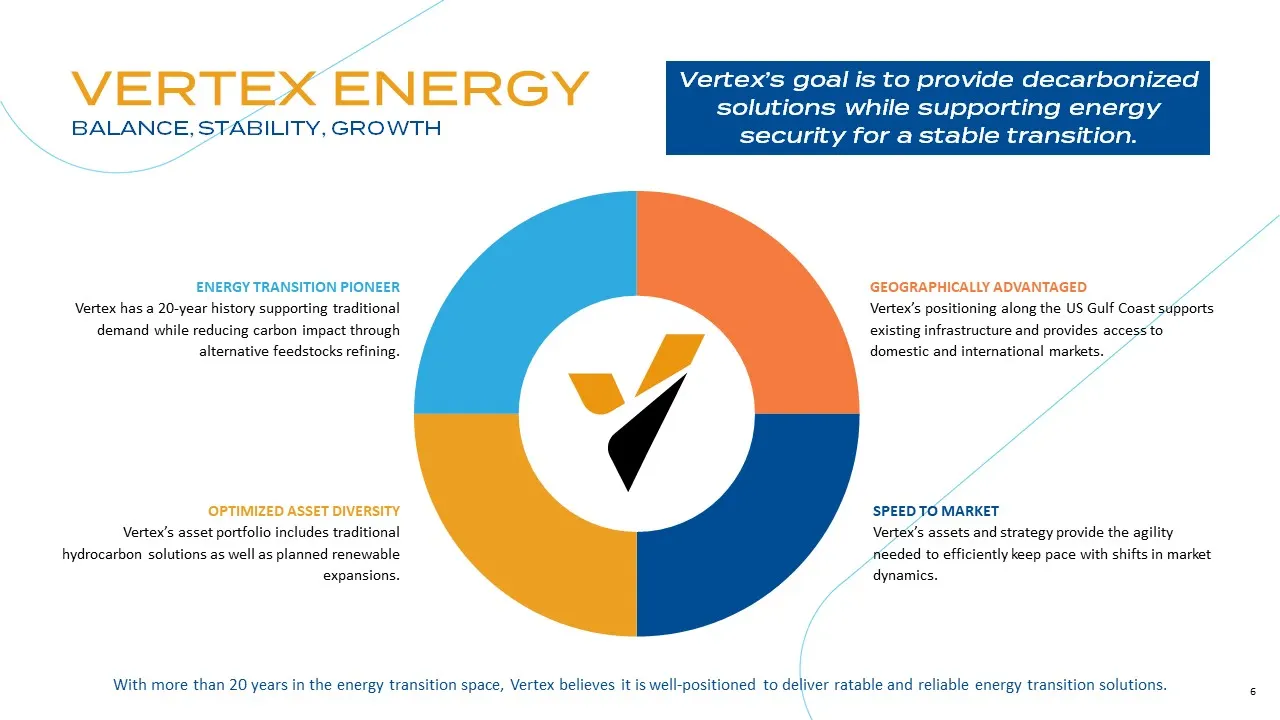
Slide 6: Energy Transition Pioneer
ENERGY TRANSITION PIONEER Vertex has a 20 - year history supporting traditional demand while reducing carbon impact through alternative feedstocks refining. OPTIMIZED ASSET DIVERSITY Vertex’s asset portfolio includes traditional hydrocarbon solutions as well as planned renewable expansions. SPEED TO
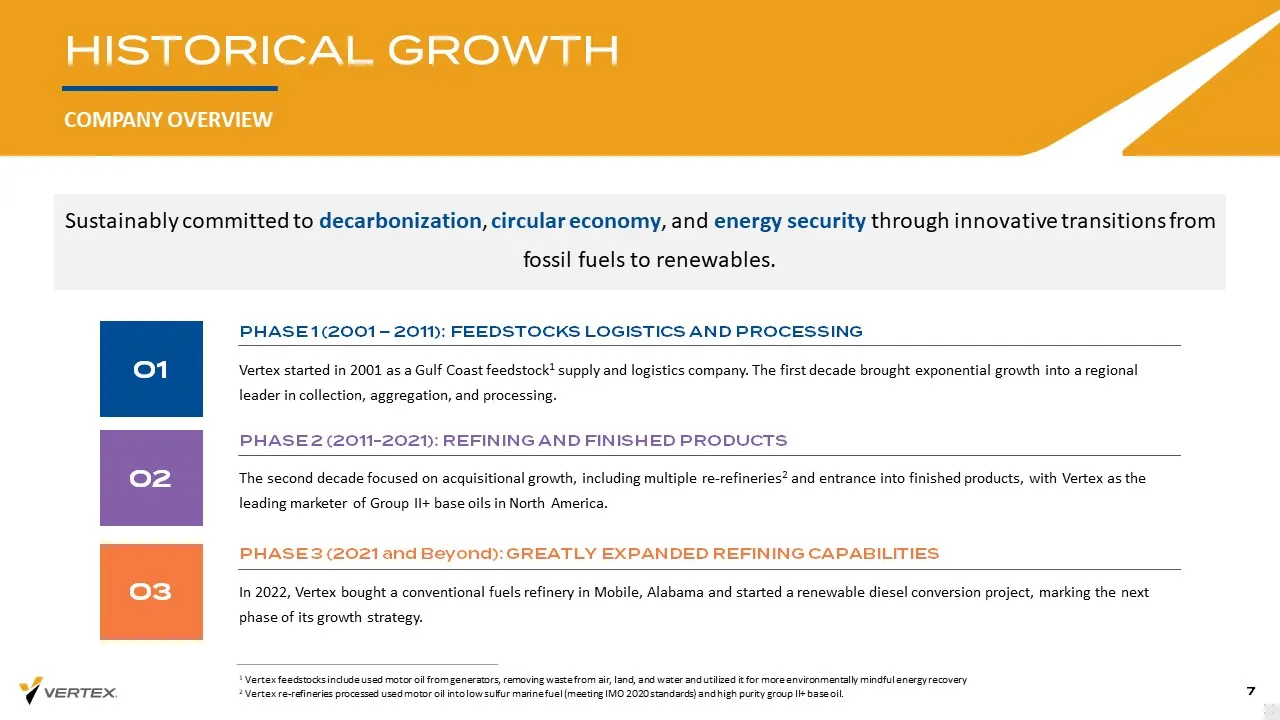
Slide 7: Historical Growth Company Overview
HISTORICAL GROWTH COMPANY OVERVIEW 7 Sustainably committed to decarbonization , circular economy , and energy security through innovative transitions from fossil fuels to renewables. 01 Vertex started in 2001 as a Gulf Coast feedstock 1 supply and logistics company. The first decade brought exponent
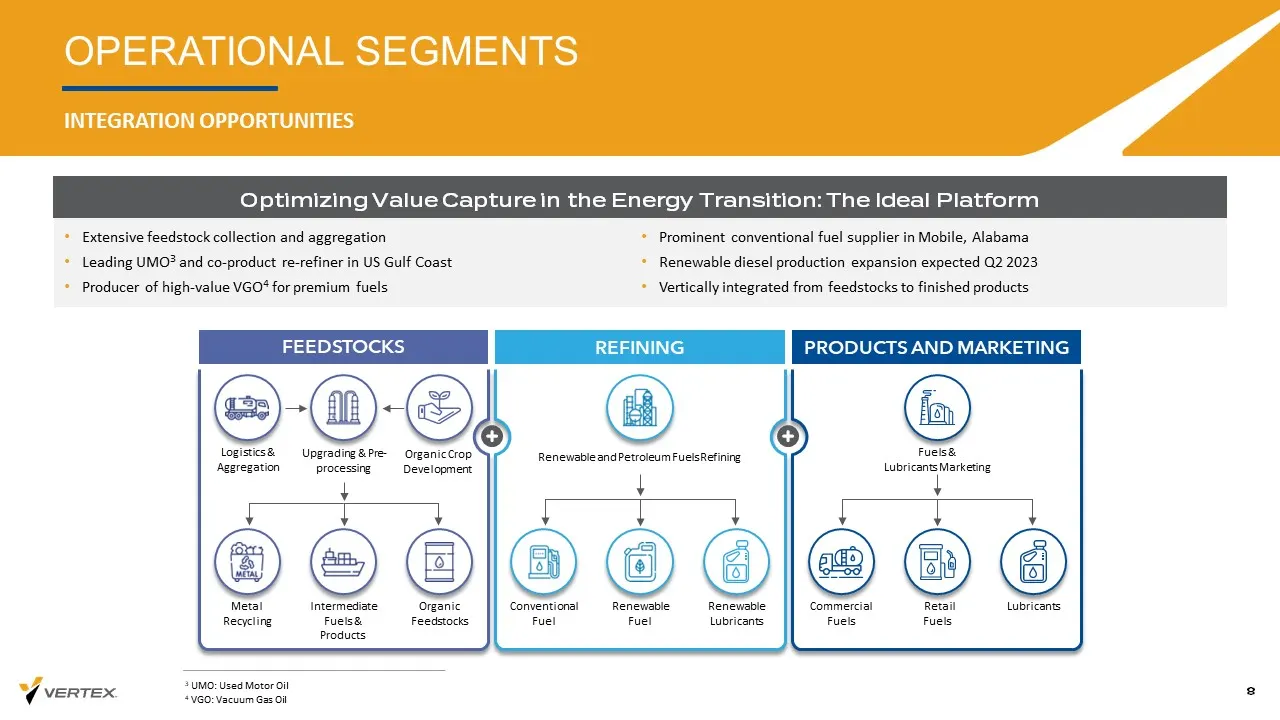
Slide 8: Operational Segments Integration Opportunities
OPERATIONAL SEGMENTS INTEGRATION OPPORTUNITIES 8 Logistics & Aggregation Metal Recycling Organic Feedstocks Intermediate Fuels & Products Upgrading & Pre - processing Conventional Fuel Renewable Lubricants Renewable Fuel Renewable and Petroleum Fuels Refining Commercial Fuels Lubricants Retail Fuels
Slide 9: Asset Overview
9 Asset Overview
Slide 10: Asset Footprint
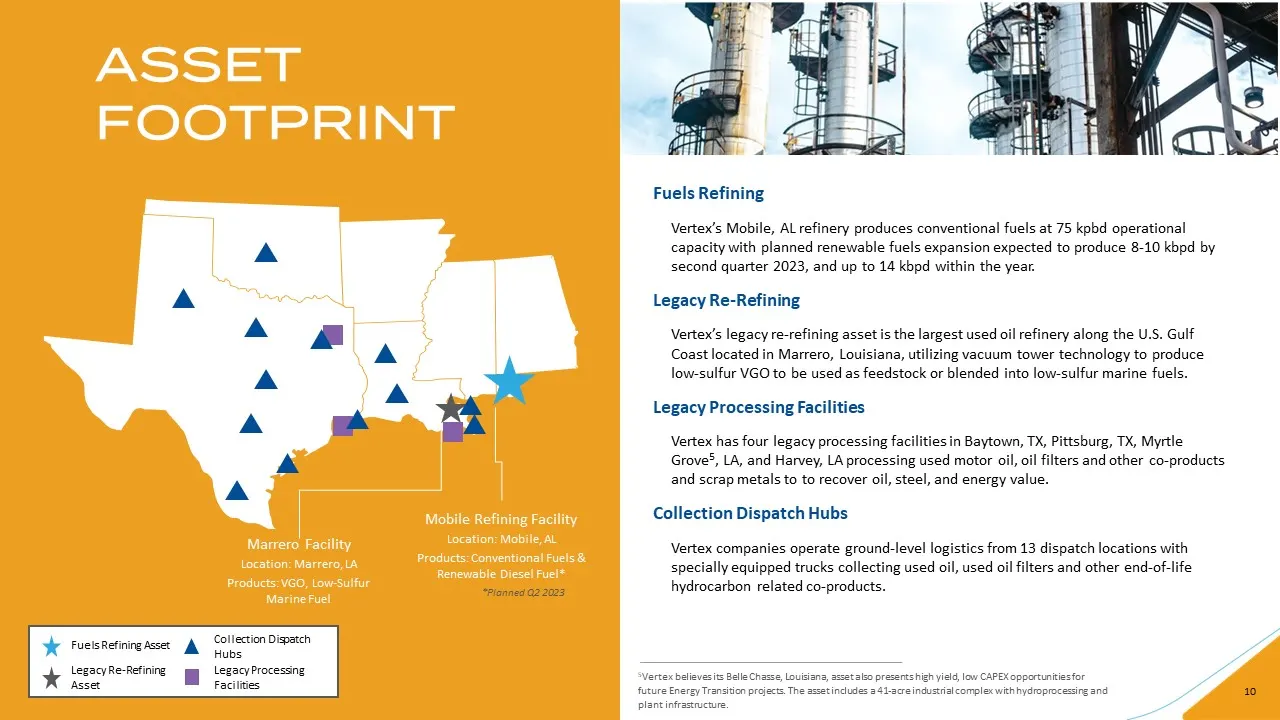
10 ASSET FOOTPRINT Marrero Facility Location: Marrero, LA Products: VGO, Low - Sulfur Marine Fuel Mobile Refining Facility Location: Mobile, AL Products: Conventional Fuels & Renewable Diesel Fuel* Fuels Refining • Vertex’s Mobile, AL refinery produces conventional fuels at 75 kpbd operational capac
Slide 11: Mobile Refinery Operating Profile
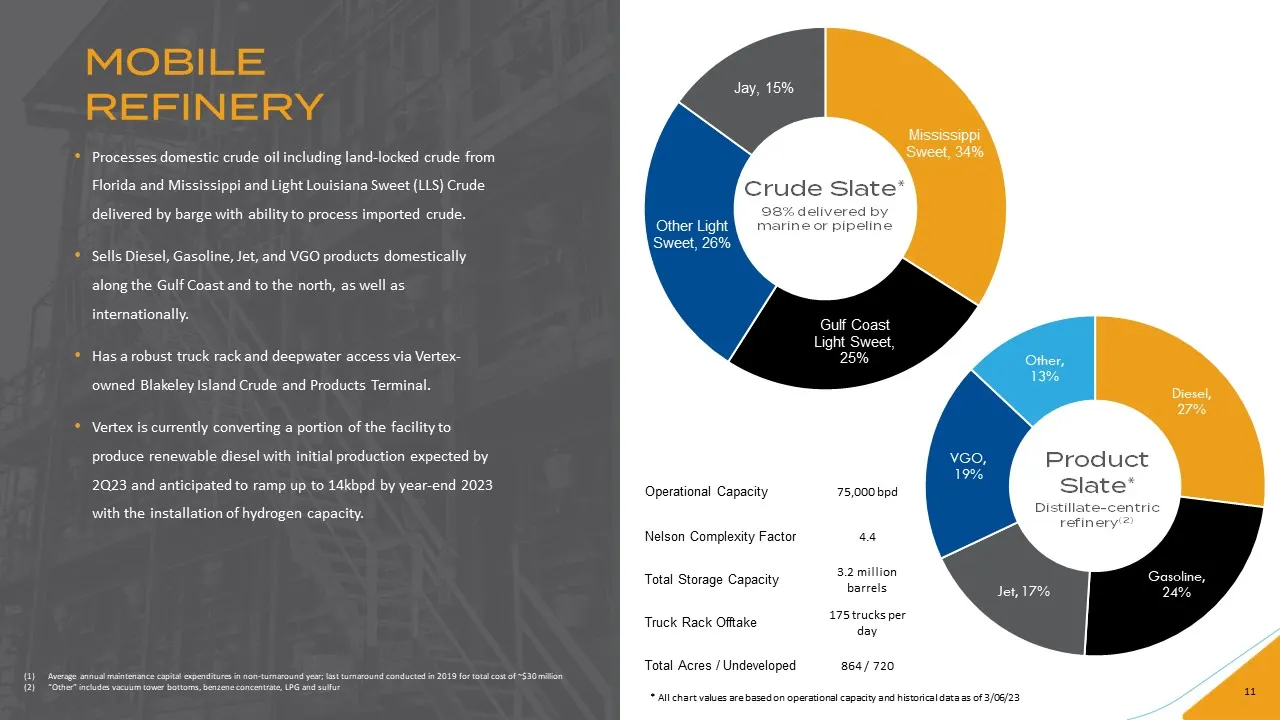
11 75,000 bpd Operational Capacity 4.4 Nelson Complexity Factor 3.2 million barrels Total Storage Capacity 175 trucks per day Truck Rack Offtake 864 / 720 Total Acres / Undeveloped Mississippi Sweet , 34% Gulf Coast Light Sweet , 25% Other Light Sweet , 26% Jay , 15% Crude Slate * 98% delivered by m
Slide 12: Renewable Diesel Project
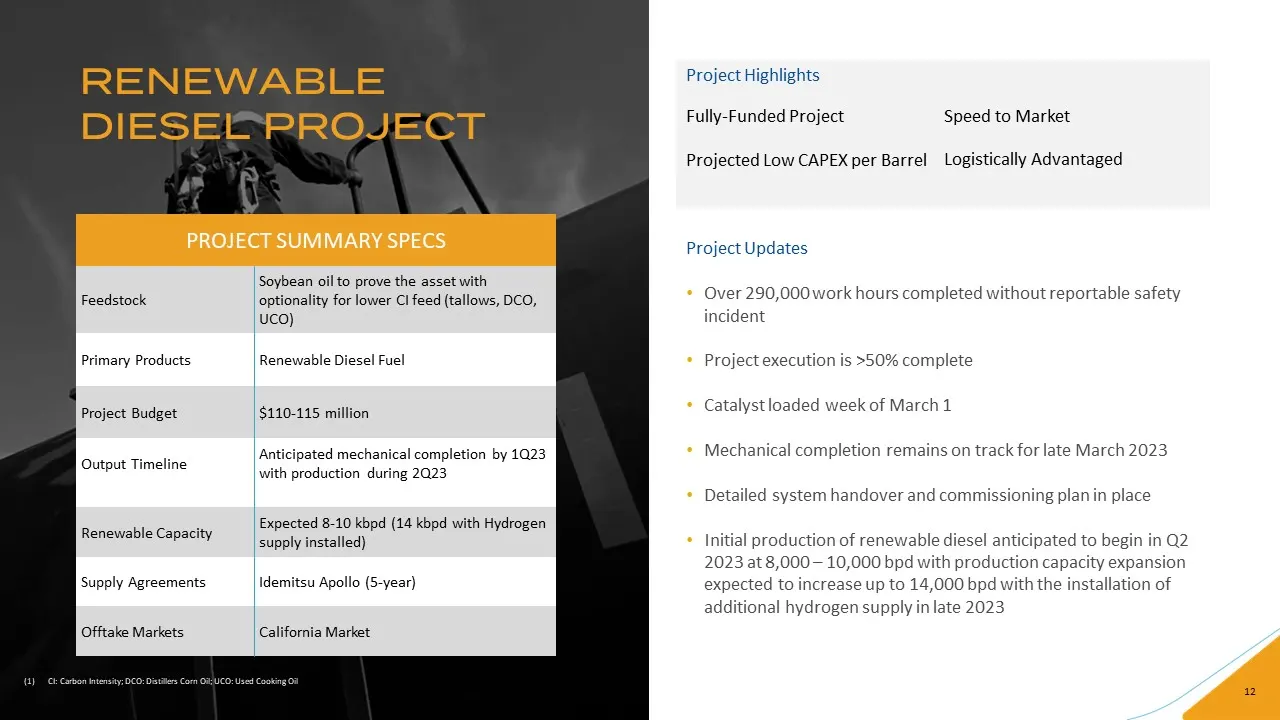
12 RENEWABLE DIESEL PROJECT Soybean oil to prove the asset with optionality for lower CI feed (tallows, DCO, UCO) Feedstock Renewable Diesel Fuel Primary Products $110 - 115 million Project Budget Anticipated mechanical completion by 1Q23 with production during 2Q23 Output Timeline Expected 8 - 10 k
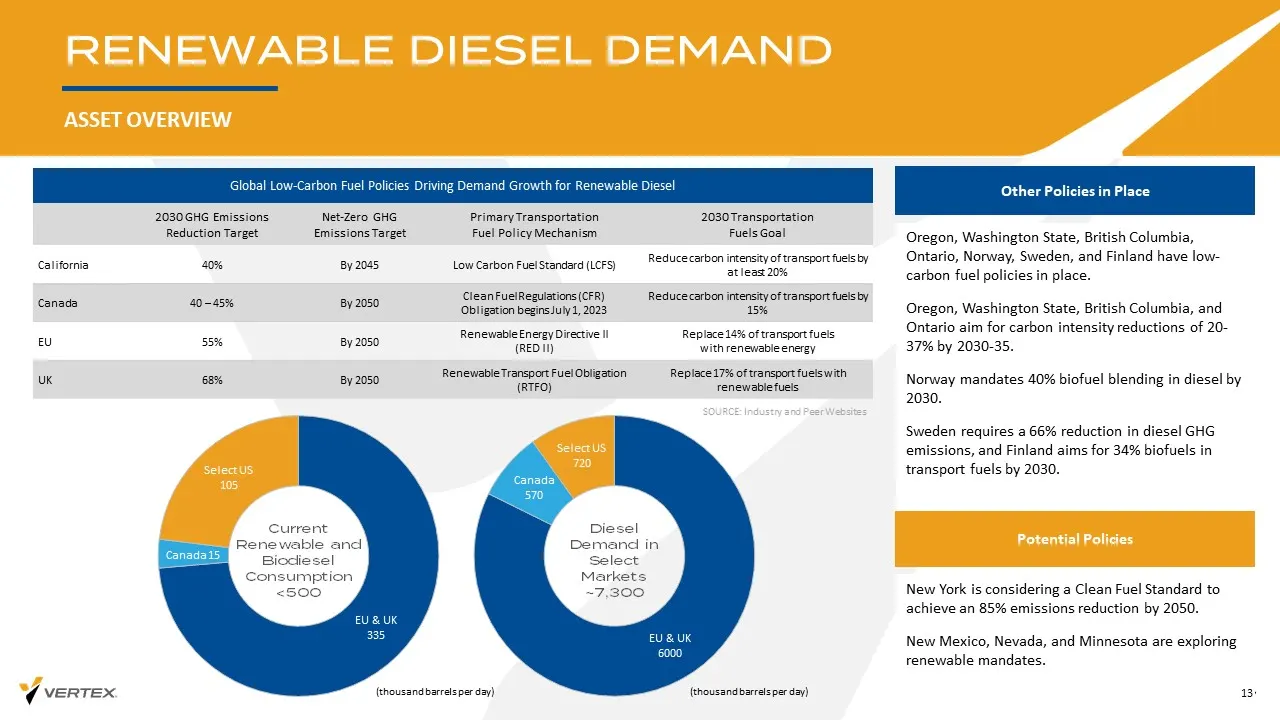
Slide 13: Renewable Diesel Demand Asset Overview
RENEWABLE DIESEL DEMAND ASSET OVERVIEW 13 Other Policies in Place Oregon, Washington State, British Columbia, Ontario, Norway, Sweden, and Finland have low - carbon fuel policies in place. Oregon, Washington State, British Columbia, and Ontario aim for carbon intensity reductions of 20 - 37% by 2030
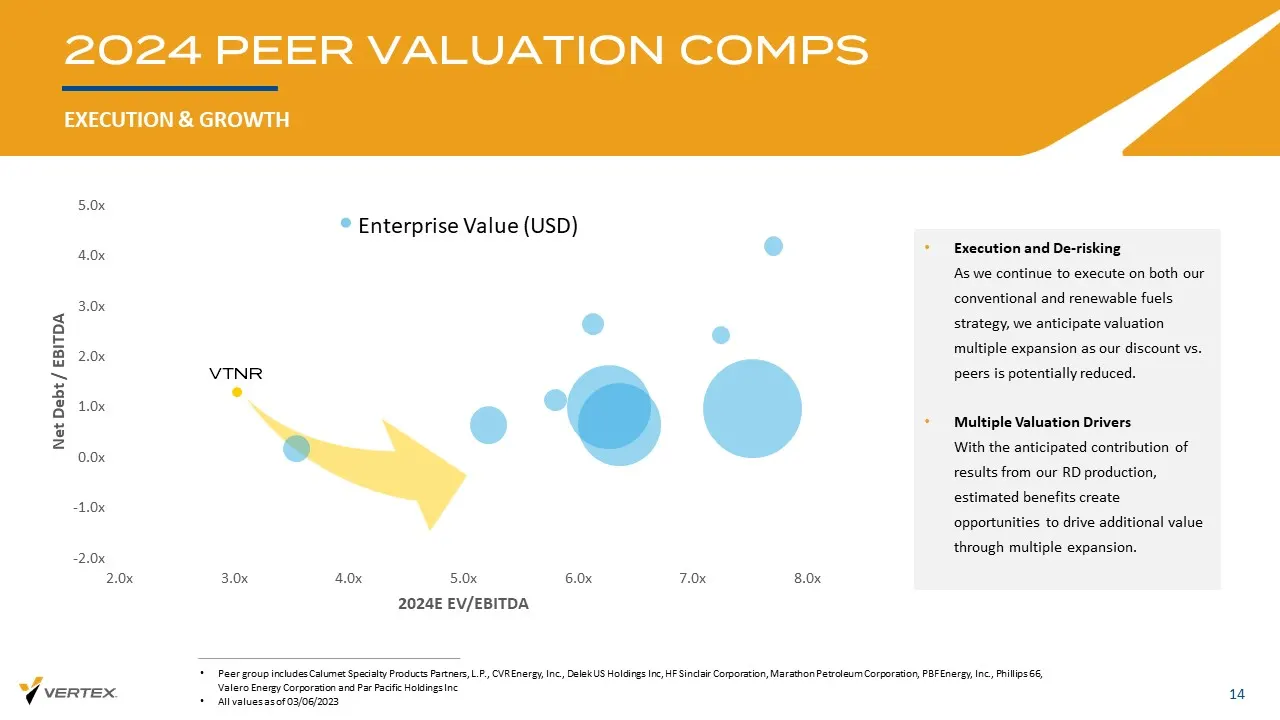
Slide 14: 2024 Peer Valuation Comps Execution & Growth
2024 PEER VALUATION COMPS 14 EXECUTION & GROWTH • Peer group includes Calumet Specialty Products Partners, L.P., CVR Energy, Inc., Delek US Holdings Inc, HF Sinclair Corporati on, Marathon Petroleum Corporation, PBF Energy, Inc., Phillips 66, Valero Energy Corporation and Par Pacific Holdings Inc •
Slide 15: Strategic Objectives & Corporate Vision
15 Strategic Objectives & Corporate Vision
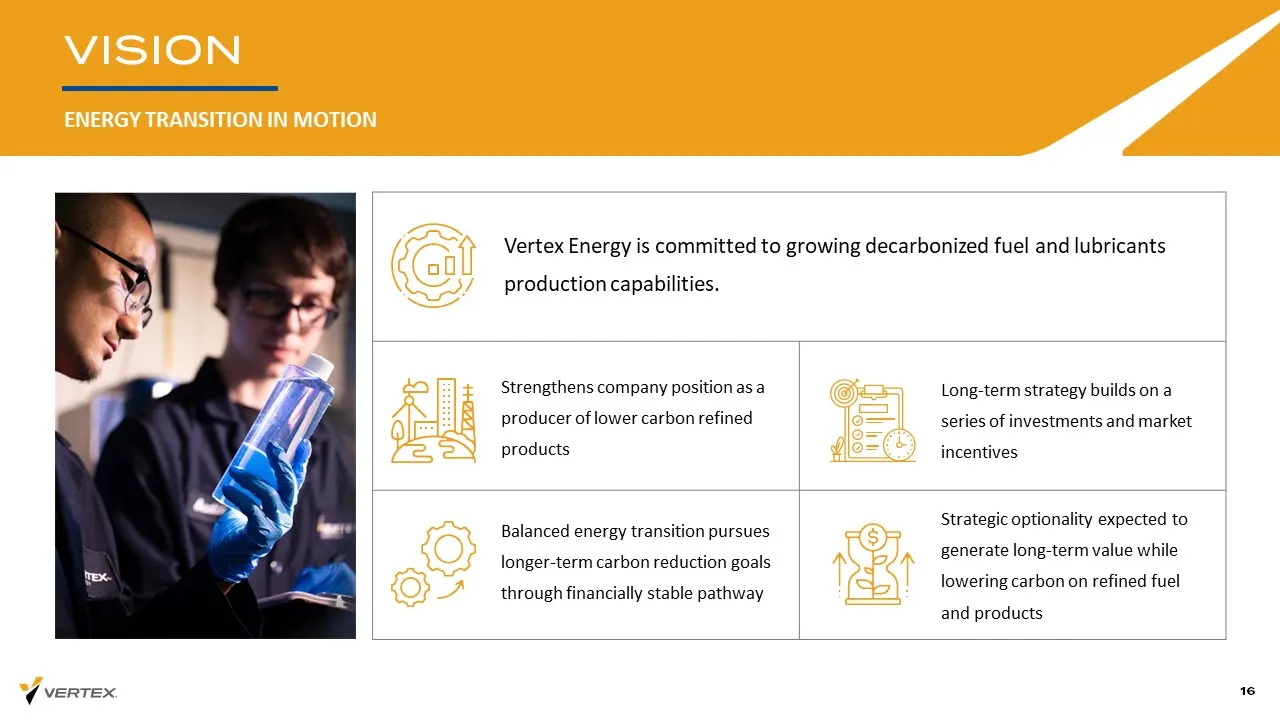
Slide 16: Vision: Energy Transition in Motion
VISION ENERGY TRANSITION IN MOTION 16 Strengthens company position as a producer of lower carbon refined products Balanced energy transition pursues longer - term carbon reduction goals through financially stable pathway Vertex Energy is committed to growing decarbonized fuel and lubricants producti
Slide 17: Our Strategic Focus Multi-Year Plan
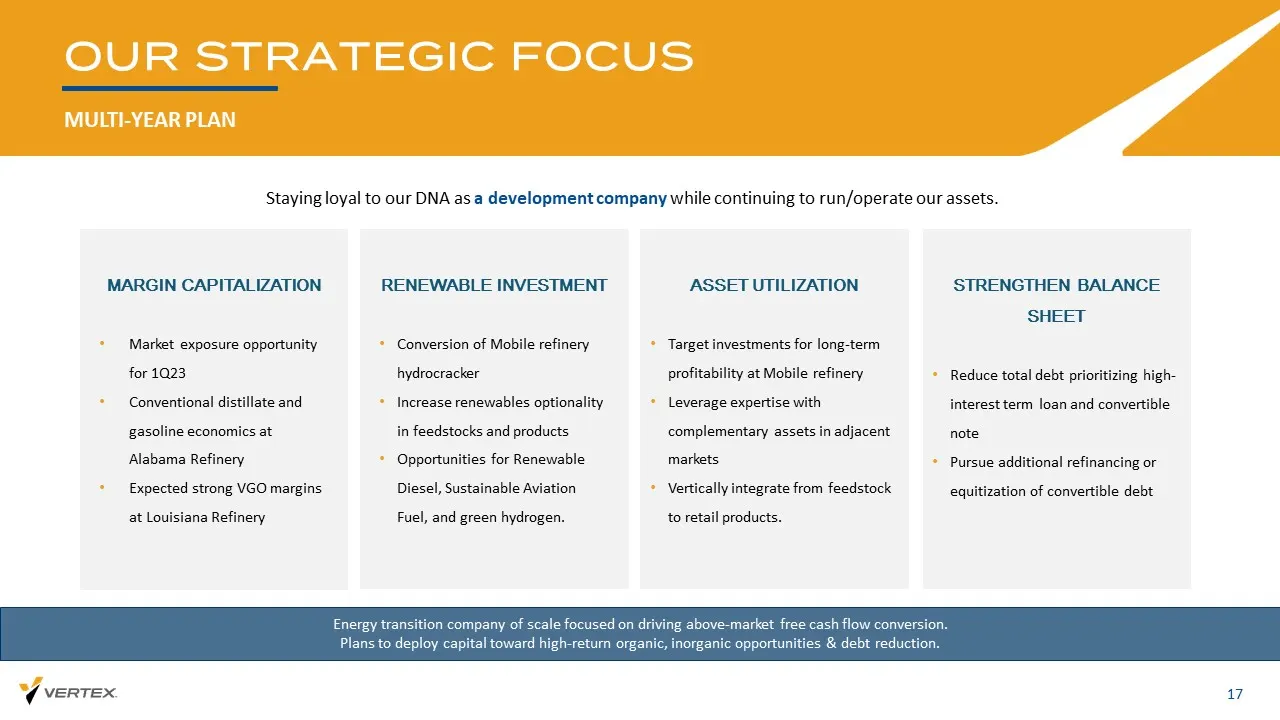
OUR STRATEGIC FOCUS MULTI - YEAR PLAN 17 ASSET UTILIZATION • Target investments for long - term profitability at Mobile refinery • Leverage expertise with complementary assets in adjacent markets • Vertically integrate from feedstock to retail products. MARGIN CAPITALIZATION • Market exposure opport
Slide 18: Financial Overview
18 Financial Overview
Slide 19: Company Performance Summary Fourth Quarter 2022
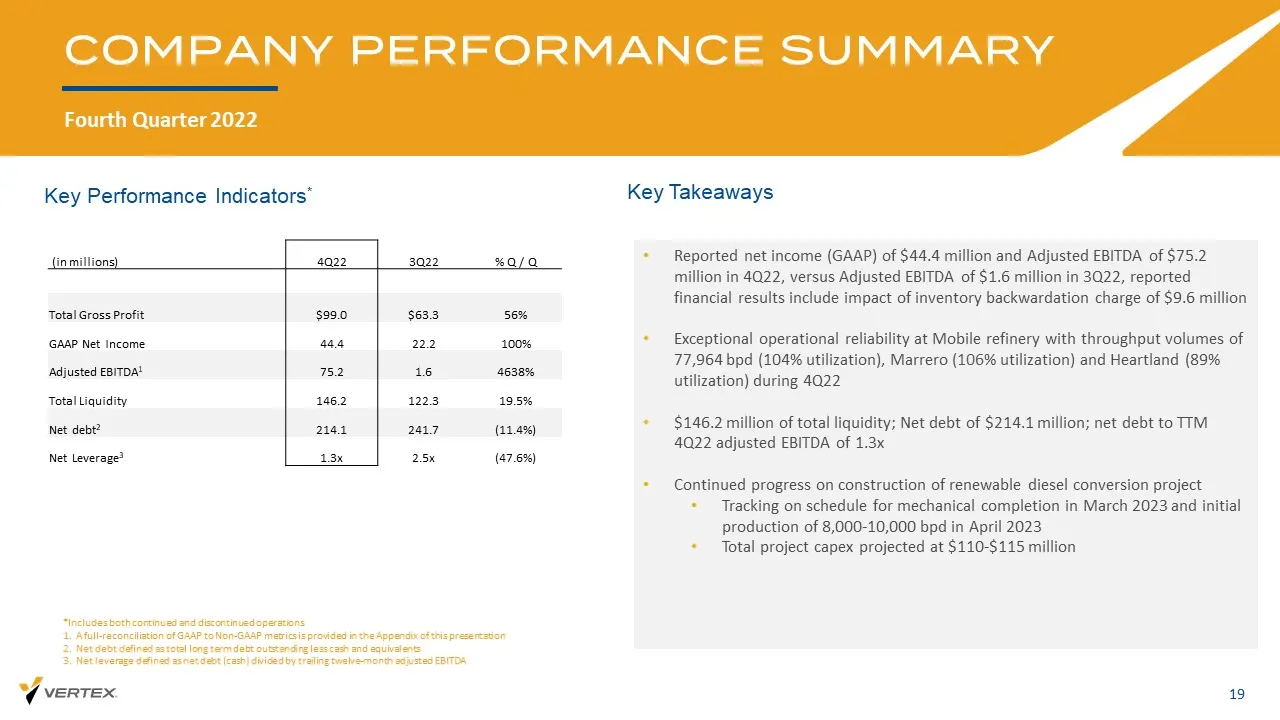
COMPANY PERFORMANCE SUMMARY Fourth Quarter 2022 19 *Includes both continued and discontinued operations 1. A full - reconciliation of GAAP to Non - GAAP metrics is provided in the Appendix of this presentation 2. Net debt defined as total long term debt outstanding less cash and equivalents 3. Net l
Slide 20: Mobile Refinery Performance Fourth Quarter 2022
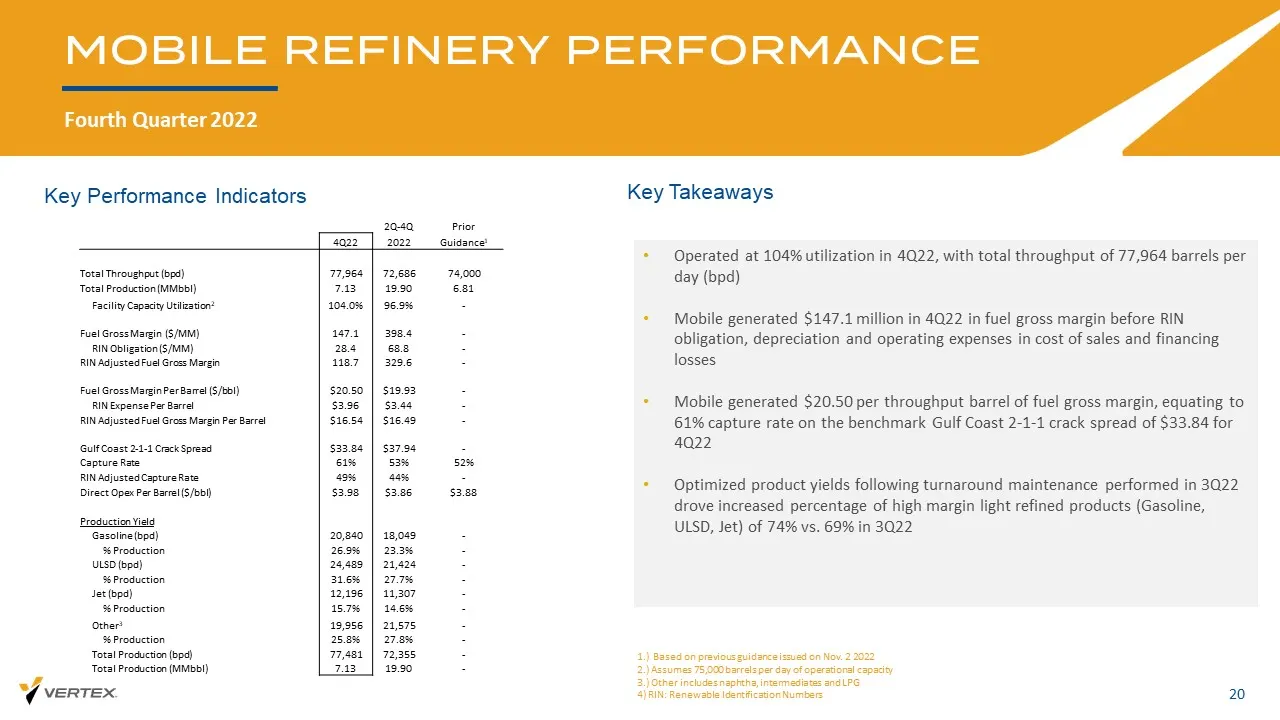
MOBILE REFINERY PERFORMANCE Fourth Quarter 2022 20 • Operated at 104% utilization in 4Q22, with total throughput of 77,964 barrels per day (bpd) • Mobile generated $147.1 million in 4Q22 in fuel gross margin before RIN obligation, depreciation and operating expenses in cost of sales and financing lo
Slide 21: Company Performance Summary Full Year 2022
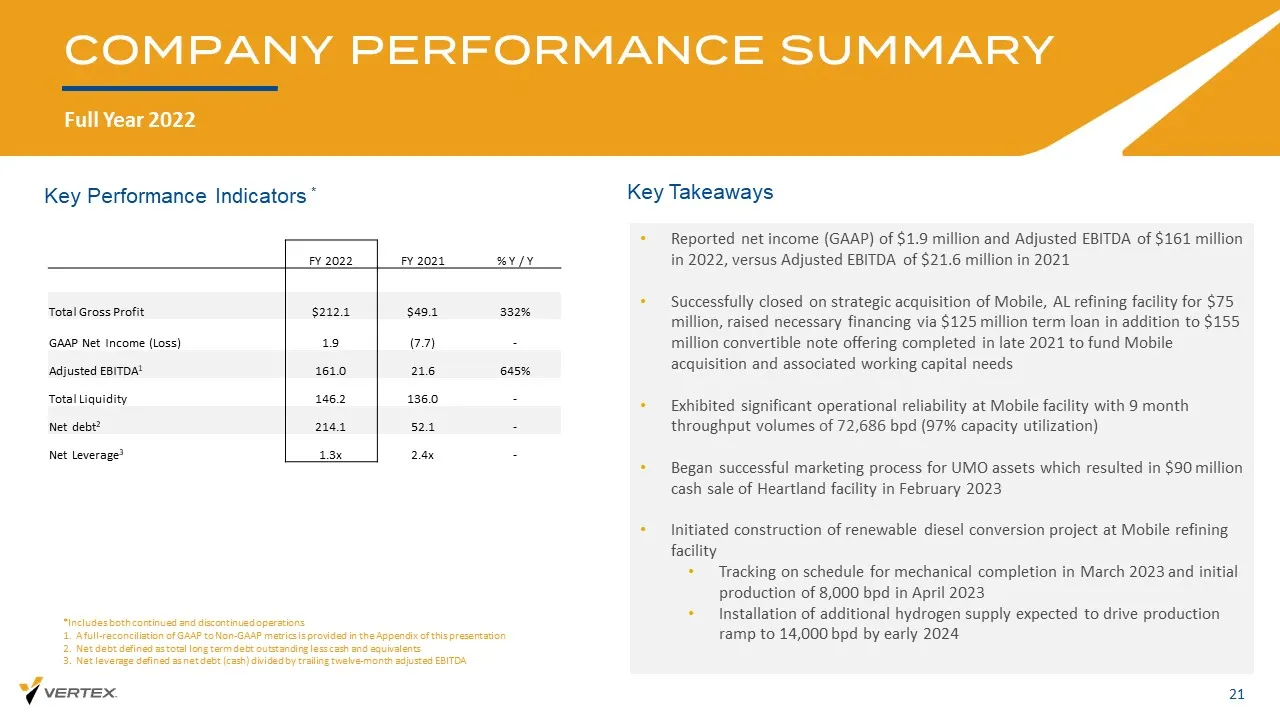
COMPANY PERFORMANCE SUMMARY Full Year 2022 21 *Includes both continued and discontinued operations 1. A full - reconciliation of GAAP to Non - GAAP metrics is provided in the Appendix of this presentation 2. Net debt defined as total long term debt outstanding less cash and equivalents 3. Net levera
Slide 22: Key Investment Considerations
22 Key Investment Considerations
Slide 23: Key Investment Considerations
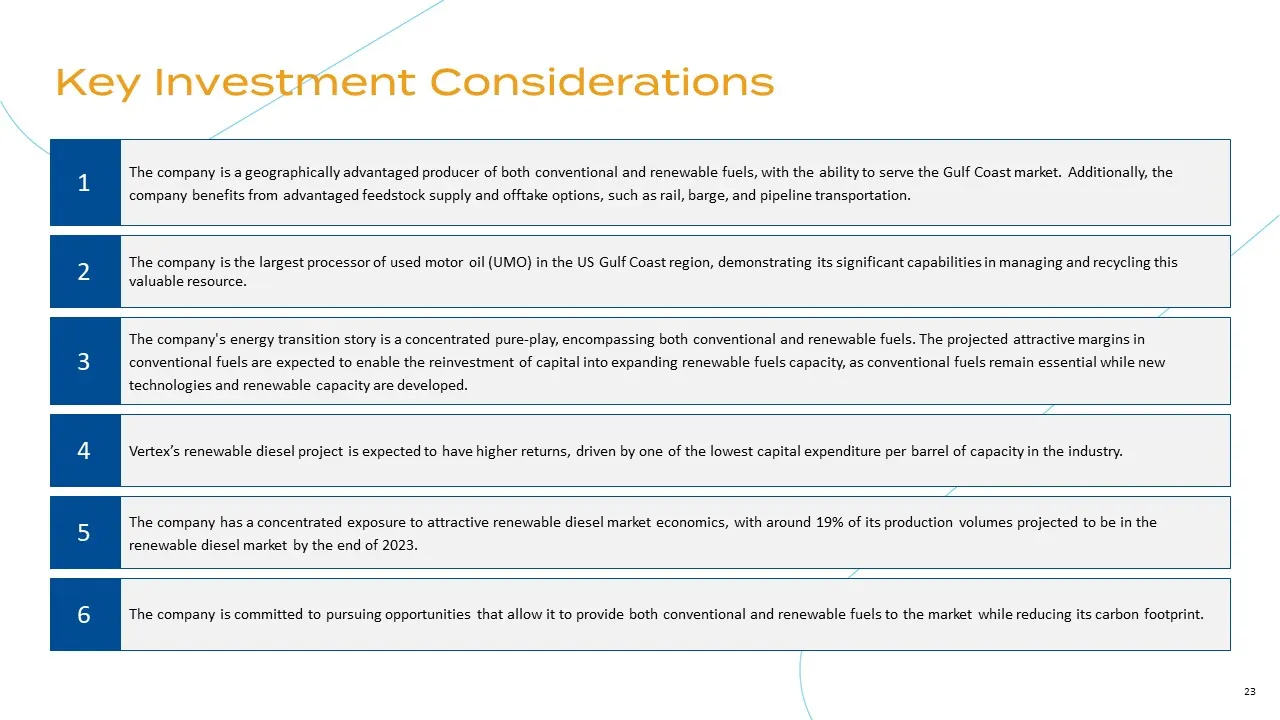
23 Key Investment Considerations The company's energy transition story is a concentrated pure - play, encompassing both conventional and renewable fuels. The proje cted attractive margins in conventional fuels are expected to enable the reinvestment of capital into expanding renewable fuels capacity
Slide 24: Appendix
24 Appendix
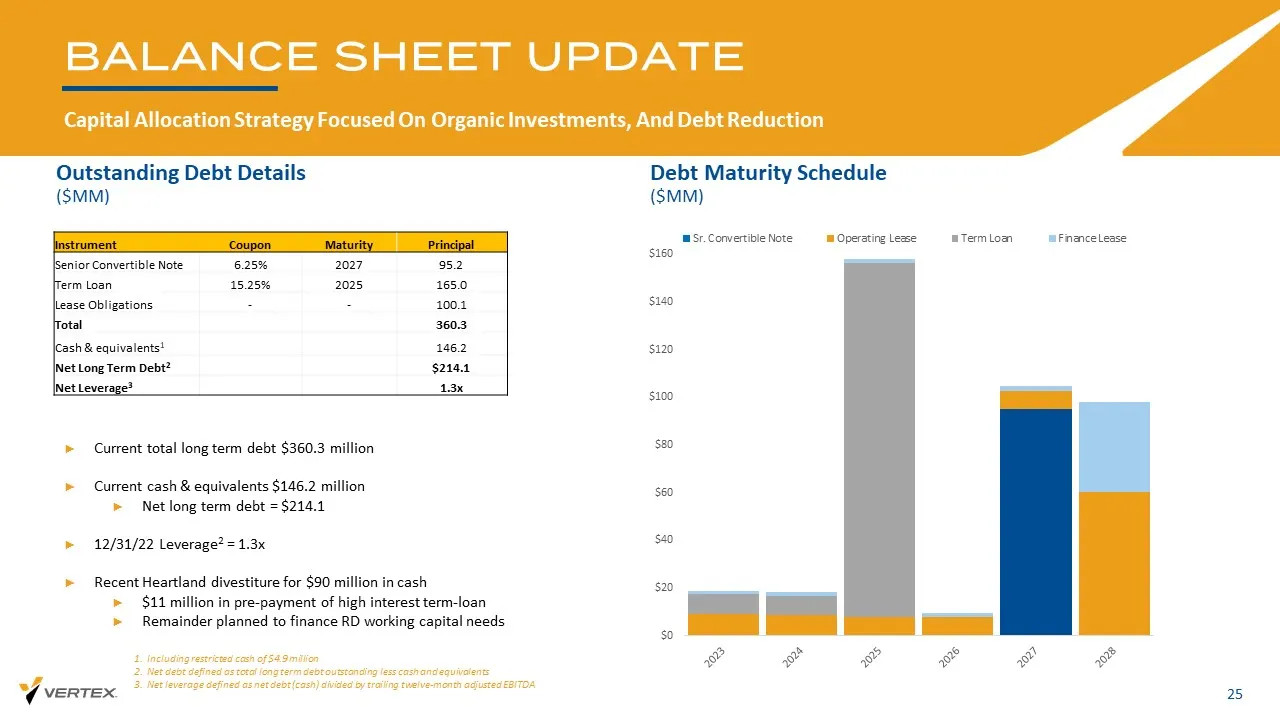
Slide 25: Balance Sheet Update
BALANCE SHEET UPDATE Capital Allocation Strategy Focused On Organic Investments, And Debt Reduction 25 Outstanding Debt Details ($MM) Debt Maturity Schedule ($MM) ► Current total long term debt $360.3 million ► Current cash & equivalents $146.2 million ► Net long term debt = $214.1 ► 12/31/22 Levera
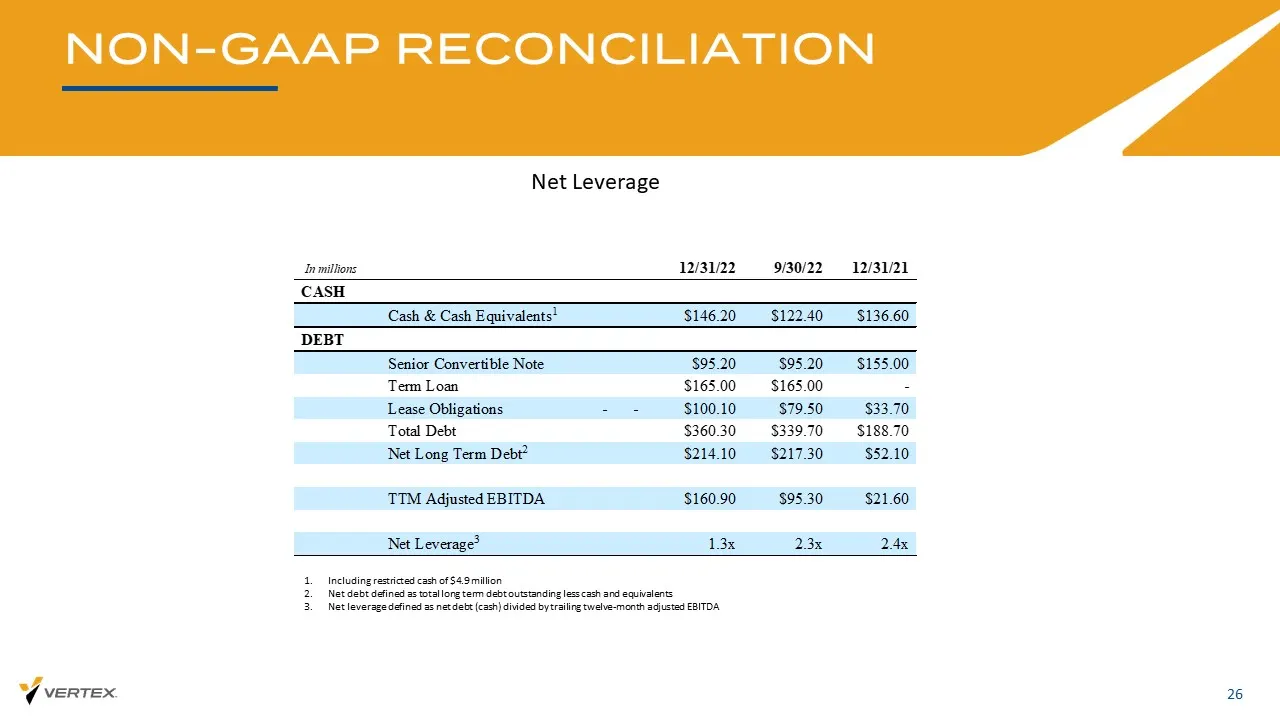
Slide 26: Non-GAAP Reconciliation: Net Leverage
NON - GAAP RECONCILIATION 26 Net Leverage 1. Including restricted cash of $4.9 million 2. Net debt defined as total long term debt outstanding less cash and equivalents 3. Net leverage defined as net debt (cash) divided by trailing twelve - month adjusted EBITDA In millions 12/31/22 9/30/22 12/31/21
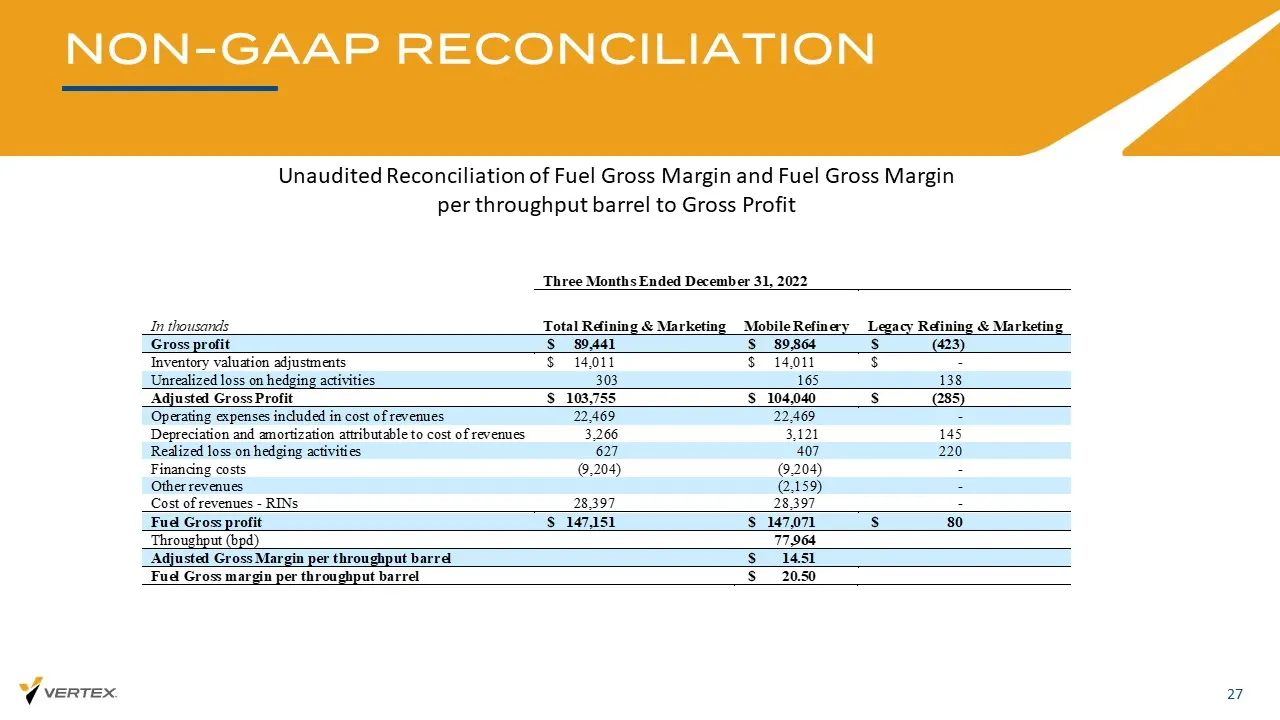
Slide 27: Non-GAAP Reconciliation: Fuel Gross Margin, Three Months 2022
NON - GAAP RECONCILIATION 27 Unaudited Reconciliation of Fuel Gross Margin and Fuel Gross Margin per throughput barrel to Gross Profit Three Months Ended December 31, 2022 In thousands Total Refining & Marketing Mobile Refinery Legacy Refining & Marketing Gross profit $ 89,441 $ 89,864 $ (423) Inven
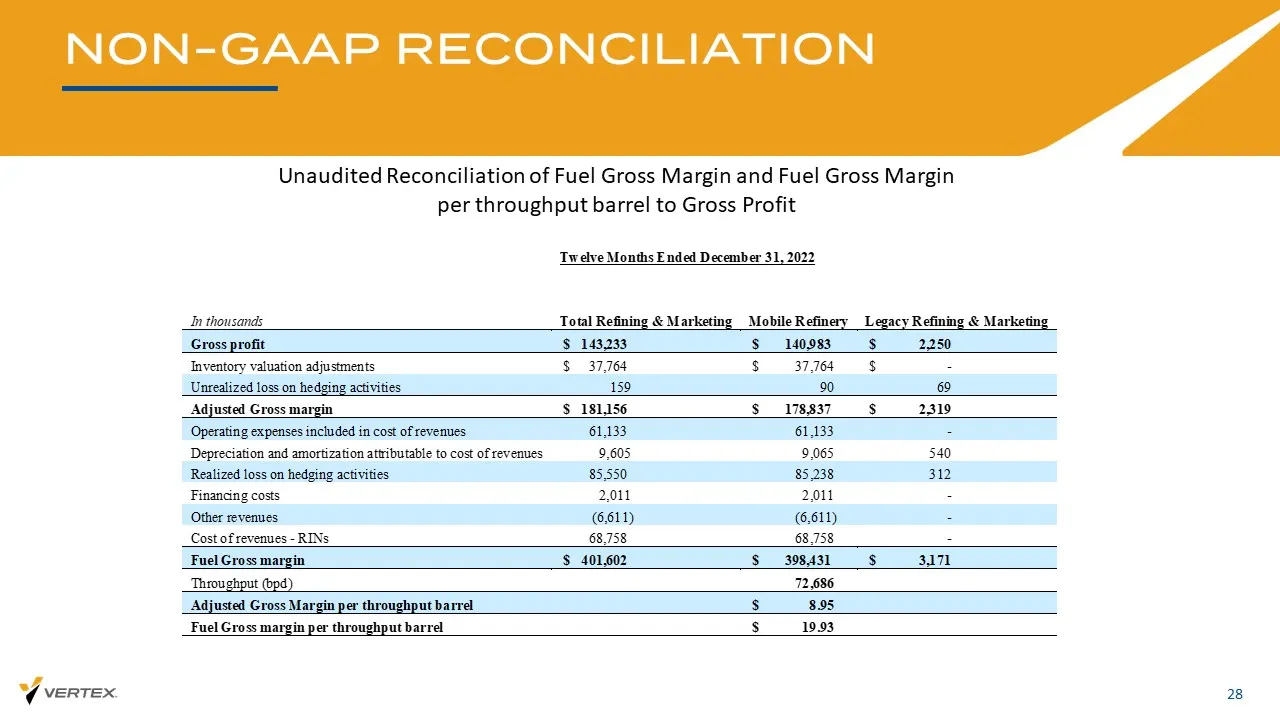
Slide 28: Non-GAAP Reconciliation: Fuel Gross Margin, Twelve Months 2022
NON - GAAP RECONCILIATION 28 Unaudited Reconciliation of Fuel Gross Margin and Fuel Gross Margin per throughput barrel to Gross Profit Twelve Months Ended December 31, 2022 In thousands Total Refining & Marketing Mobile Refinery Legacy Refining & Marketing Gross profit $ 143,233 $ 140,983 $ 2,250 In
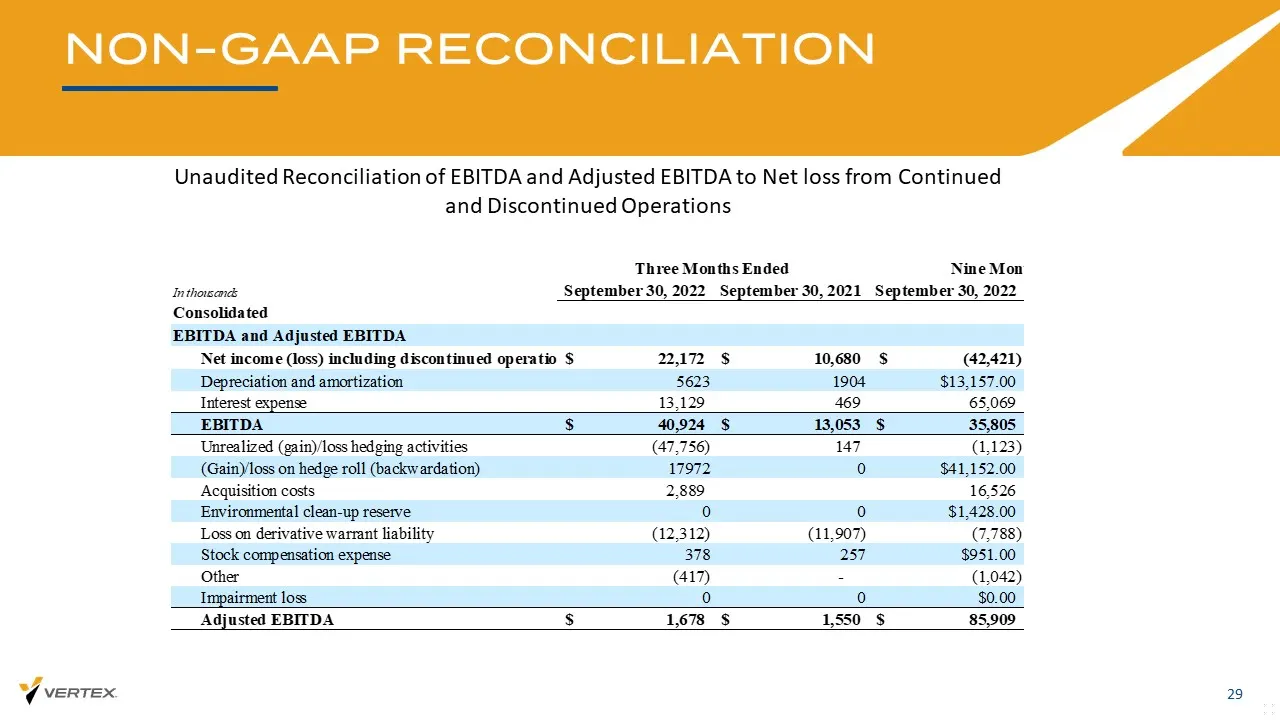
Slide 29: Non-GAAP Reconciliation: EBITDA and Adjusted EBITDA
NON - GAAP RECONCILIATION 29 Unaudited Reconciliation of EBITDA and Adjusted EBITDA to Net loss from Continued and Discontinued Operations In thousands September 30, 2022 September 30, 2021 September 30, 2022 Consolidated EBITDA and Adjusted EBITDA Net income (loss) including discontinued operations
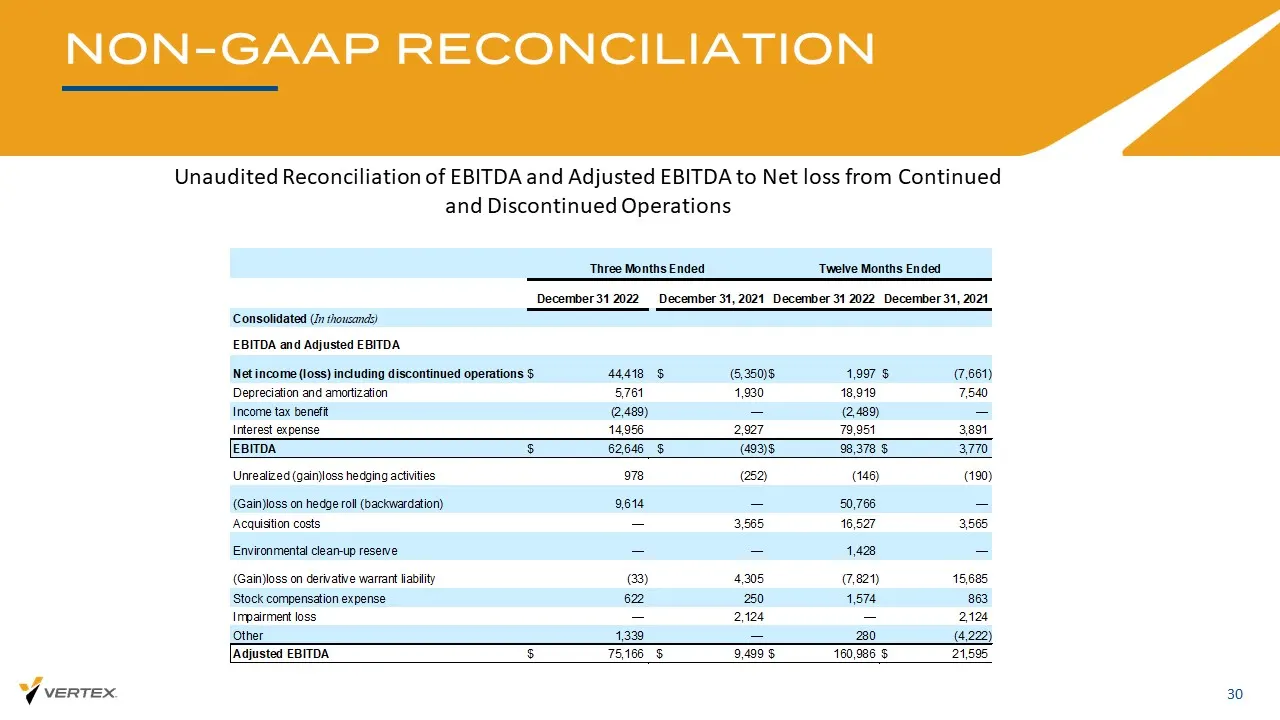
Slide 30: Non-GAAP Reconciliation: EBITDA and Adjusted EBITDA
NON - GAAP RECONCILIATION 30 Unaudited Reconciliation of EBITDA and Adjusted EBITDA to Net loss from Continued and Discontinued Operations Three Months Ended Twelve Months Ended December 31 2022 December 31, 2021 December 31 2022 December 31, 2021 Consolidated (In thousands) EBITDA and Adjusted EBIT
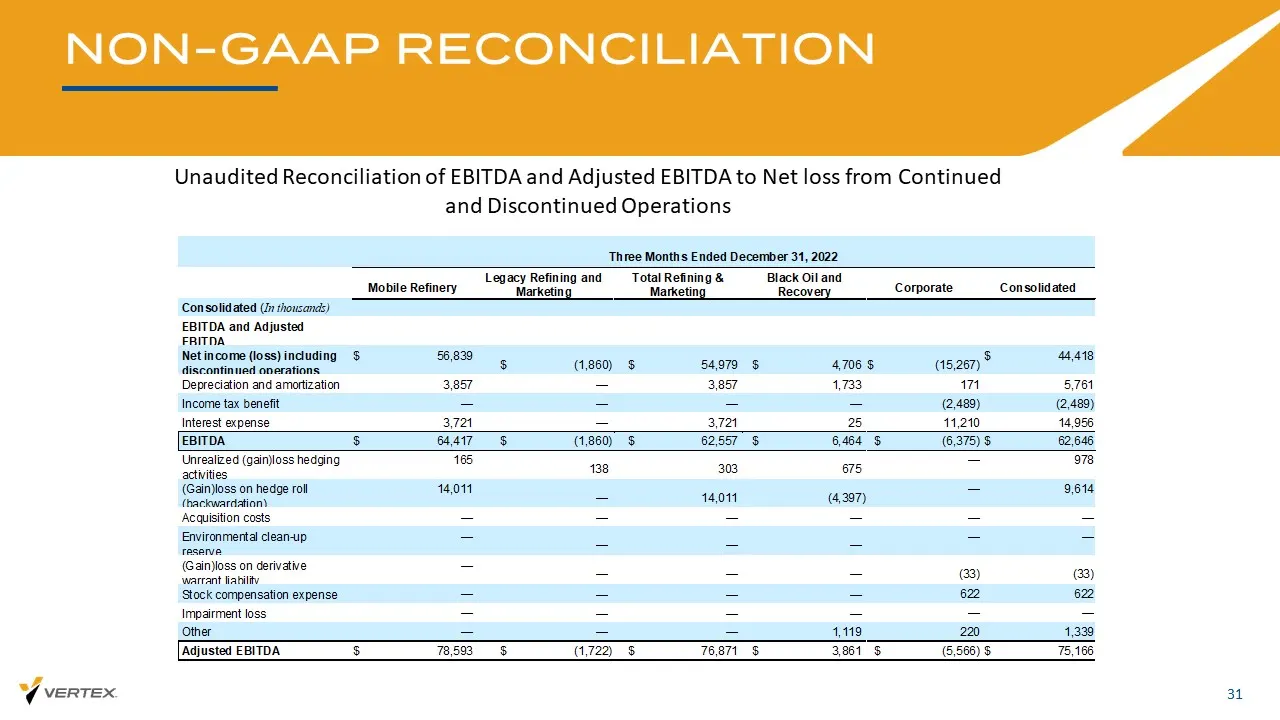
Slide 31: Non-GAAP Reconciliation: EBITDA, Three Months Ended Dec 31, 2022
NON - GAAP RECONCILIATION 31 Unaudited Reconciliation of EBITDA and Adjusted EBITDA to Net loss from Continued and Discontinued Operations Three Months Ended December 31, 2022 Mobile Refinery Legacy Refining and Marketing Total Refining & Marketing Black Oil and Recovery Corporate Consolidated Conso
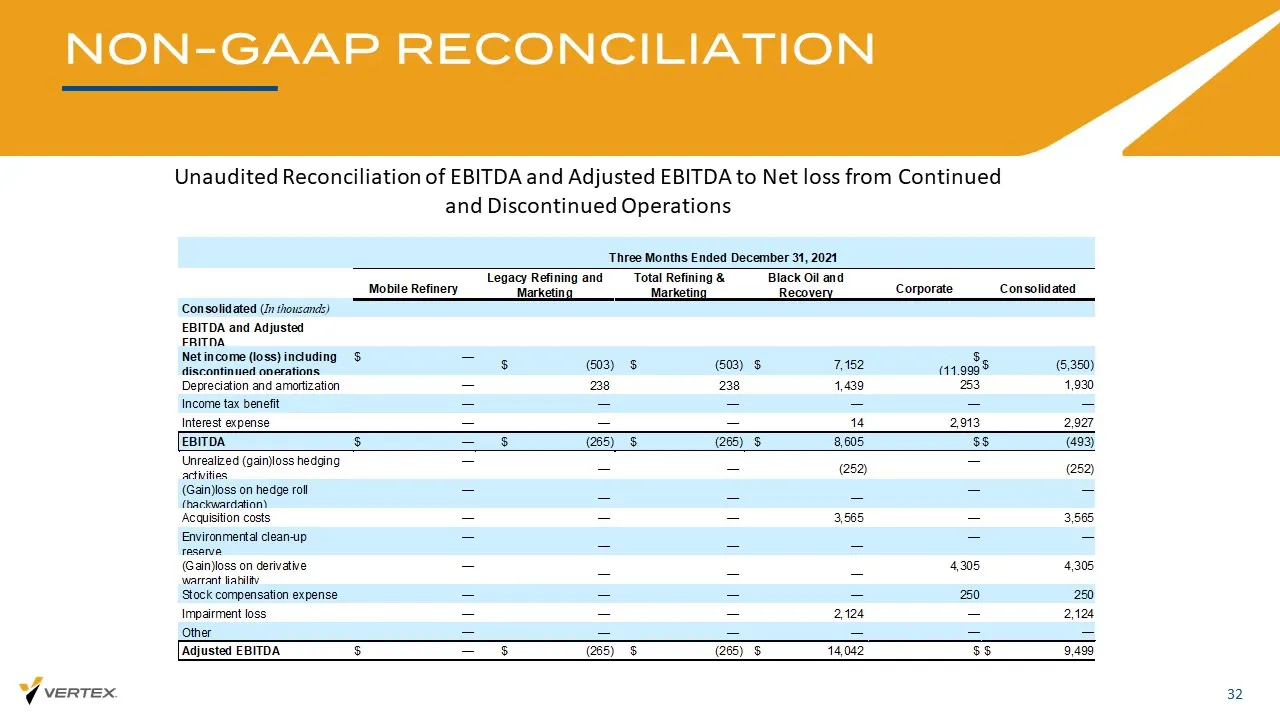
Slide 32: Non-GAAP Reconciliation: EBITDA, Three Months Ended Dec 31, 2021
NON - GAAP RECONCILIATION 32 Unaudited Reconciliation of EBITDA and Adjusted EBITDA to Net loss from Continued and Discontinued Operations Three Months Ended December 31, 2021 Mobile Refinery Legacy Refining and Marketing Total Refining & Marketing Black Oil and Recovery Corporate Consolidated Conso
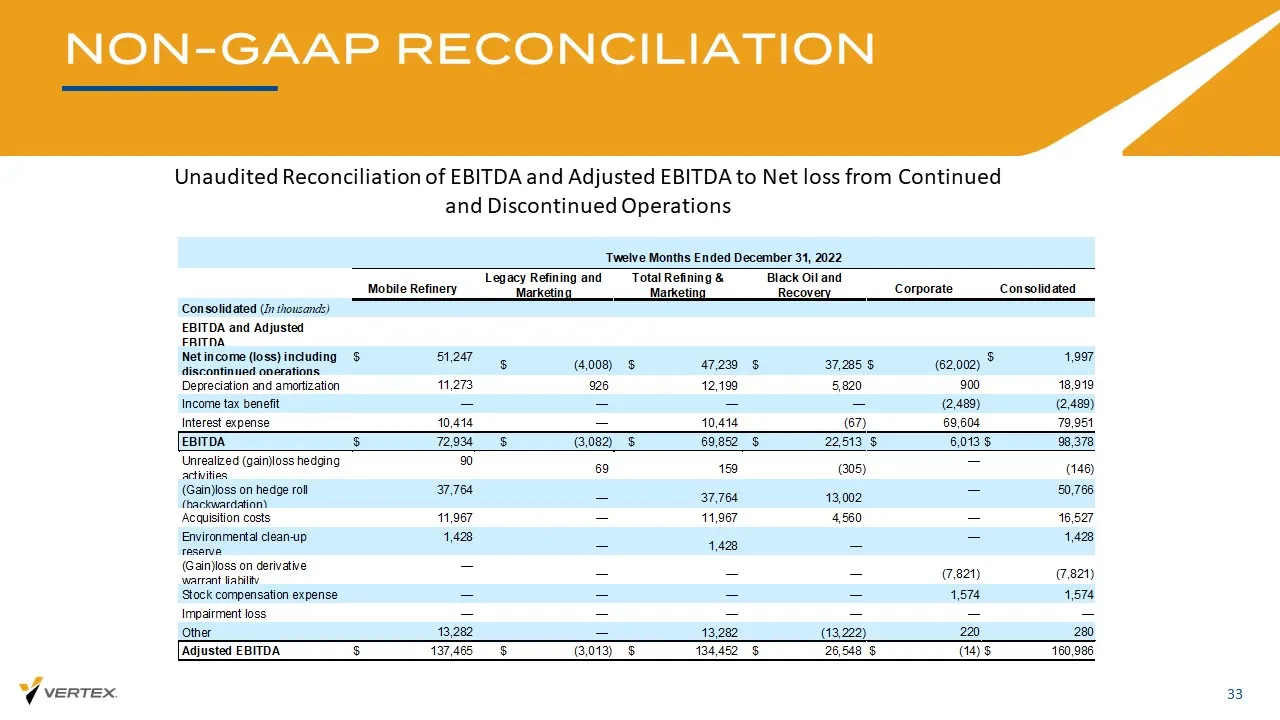
Slide 33: Non-GAAP Reconciliation: EBITDA, Twelve Months Ended Dec 31, 2022
NON - GAAP RECONCILIATION 33 Unaudited Reconciliation of EBITDA and Adjusted EBITDA to Net loss from Continued and Discontinued Operations Twelve Months Ended December 31, 2022 Mobile Refinery Legacy Refining and Marketing Total Refining & Marketing Black Oil and Recovery Corporate Consolidated Cons
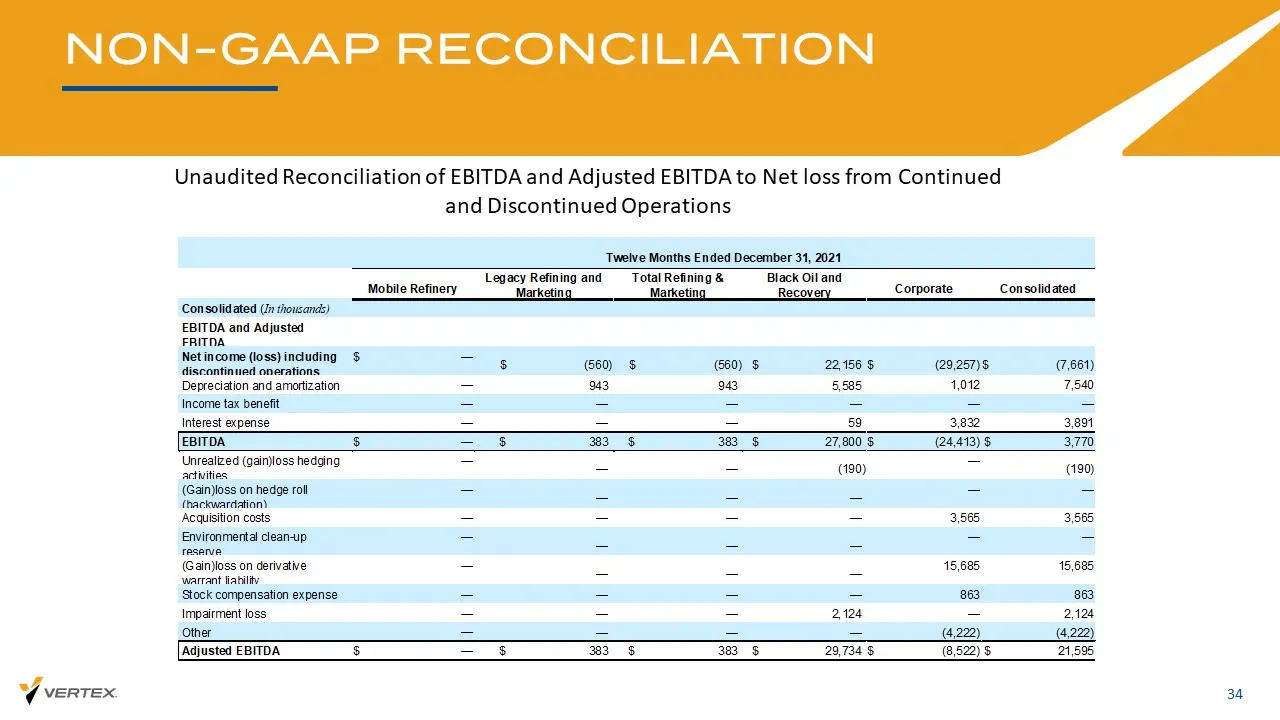
Slide 34: Non-GAAP Reconciliation: EBITDA, Twelve Months Ended Dec 31, 2021
NON - GAAP RECONCILIATION 34 Unaudited Reconciliation of EBITDA and Adjusted EBITDA to Net loss from Continued and Discontinued Operations Twelve Months Ended December 31, 2021 Mobile Refinery Legacy Refining and Marketing Total Refining & Marketing Black Oil and Recovery Corporate Consolidated Cons
Slide 35: Thank You
THANK YOU Questions? Comments? Let’s hear them!
Source: SEC EDGAR · 8-K filed Mar 22, 2023
More decks from Vertex Energy Inc
 Q2 2024 Earnings Presentation21 slides · Aug 8, 2024
 Q1 2024 Earnings Presentation20 slides · May 9, 2024
 Q4 2023 Earnings Presentation29 slides · Feb 28, 2024
 Q3 2023 Earnings Presentation27 slides · Nov 7, 2023
 Q2 2023 Earnings Presentation26 slides · Aug 9, 2023
 Q1 2023 Earnings Presentation26 slides · May 9, 2023