Allegheny Energy — EEI Financial Conference 2003
37 slides from Allegheny Energy's conference presentation, Oct 24, 2003
Slide 1: EEI Financial Conference
EEI Financial Conference October 26 - 29, 2003
Slide 2: Forward-Looking Statements
Forward-Looking Statements Certain statements contained herein constitute forward-looking statements with respect to Allegheny Energy, Inc. and its subsidiaries within the meanings of Section 27A of the Securities Act of 1933 and Section 21E of the Securities Exchange Act of 1934. Although Allegheny
Slide 3: Agenda
Agenda Early Progress Business Foundation Financial Update Conclusions 3
Slide 4: Progressing on a number of critical short-term issues
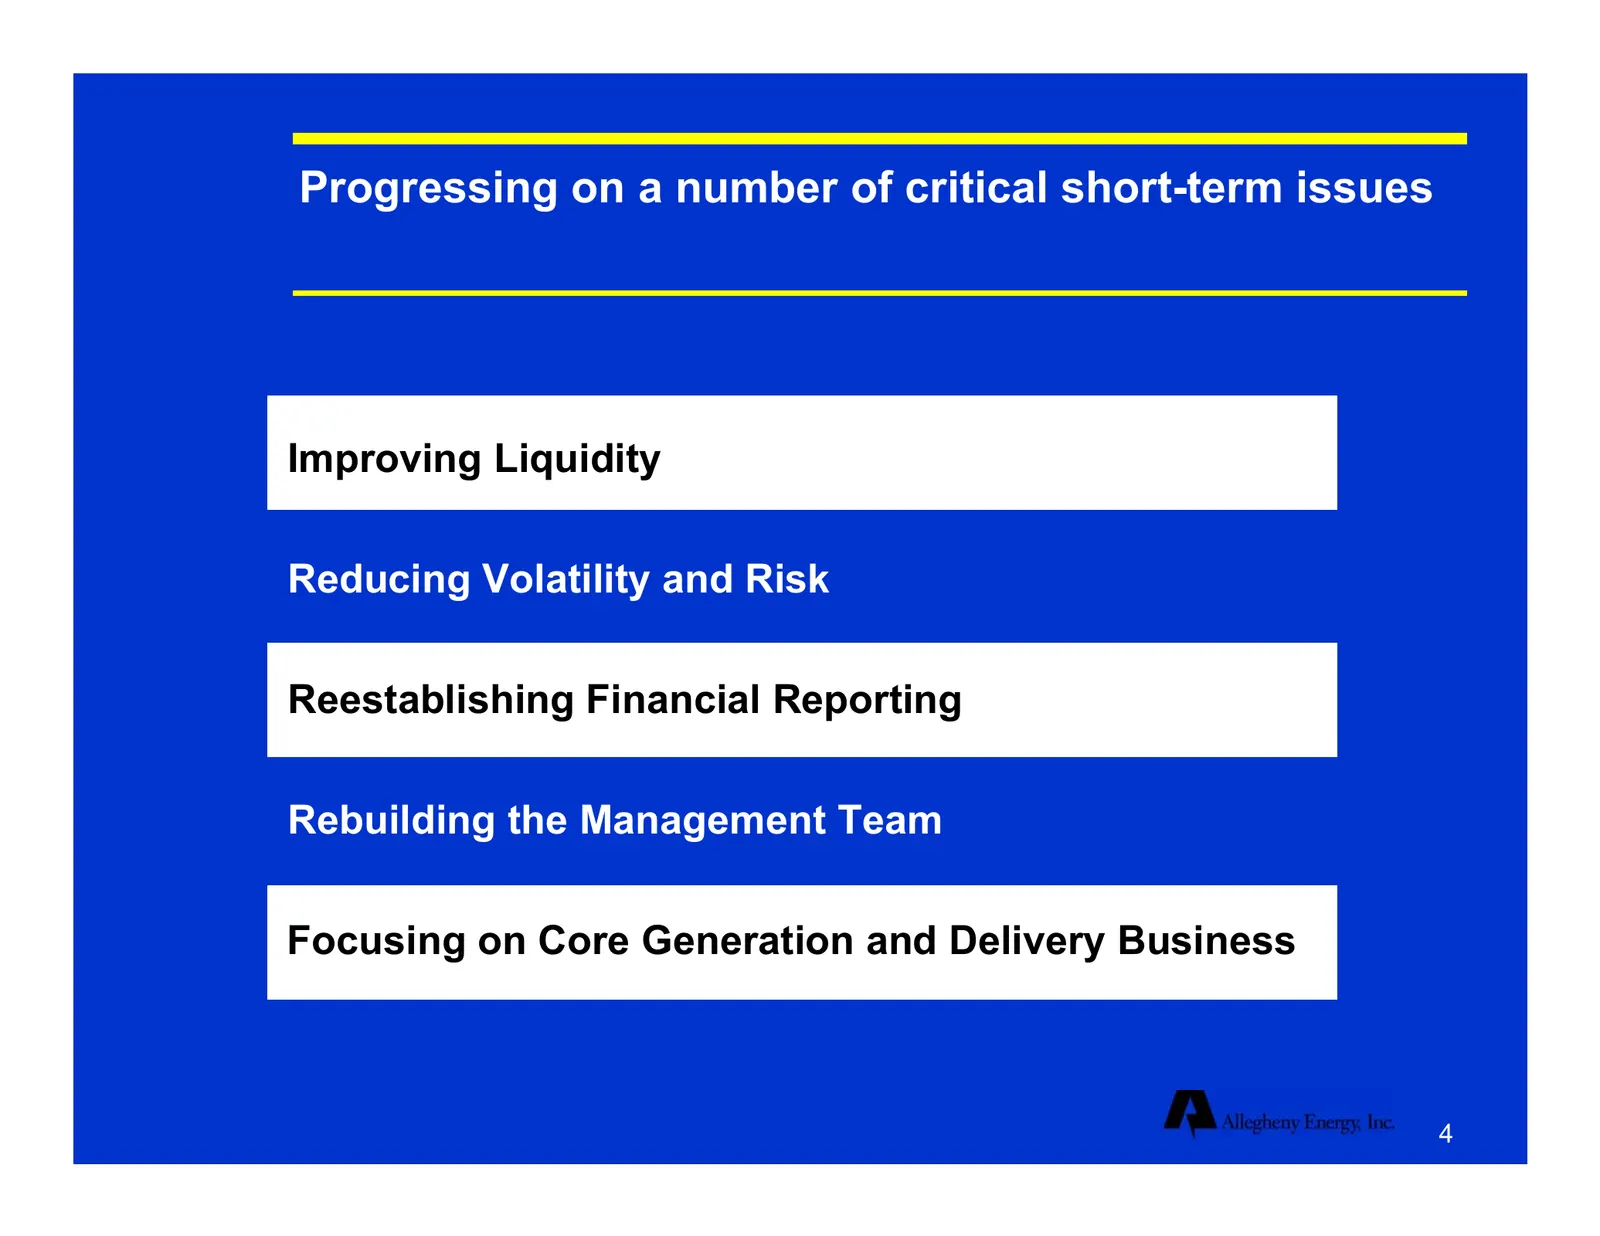
Progressing on a number of critical short-term issues Improving Liquidity Reducing Volatility and Risk Reestablishing Financial Reporting Rebuilding the Management Team Focusing on Core Generation and Delivery Business 4
Slide 5: Improving liquidity
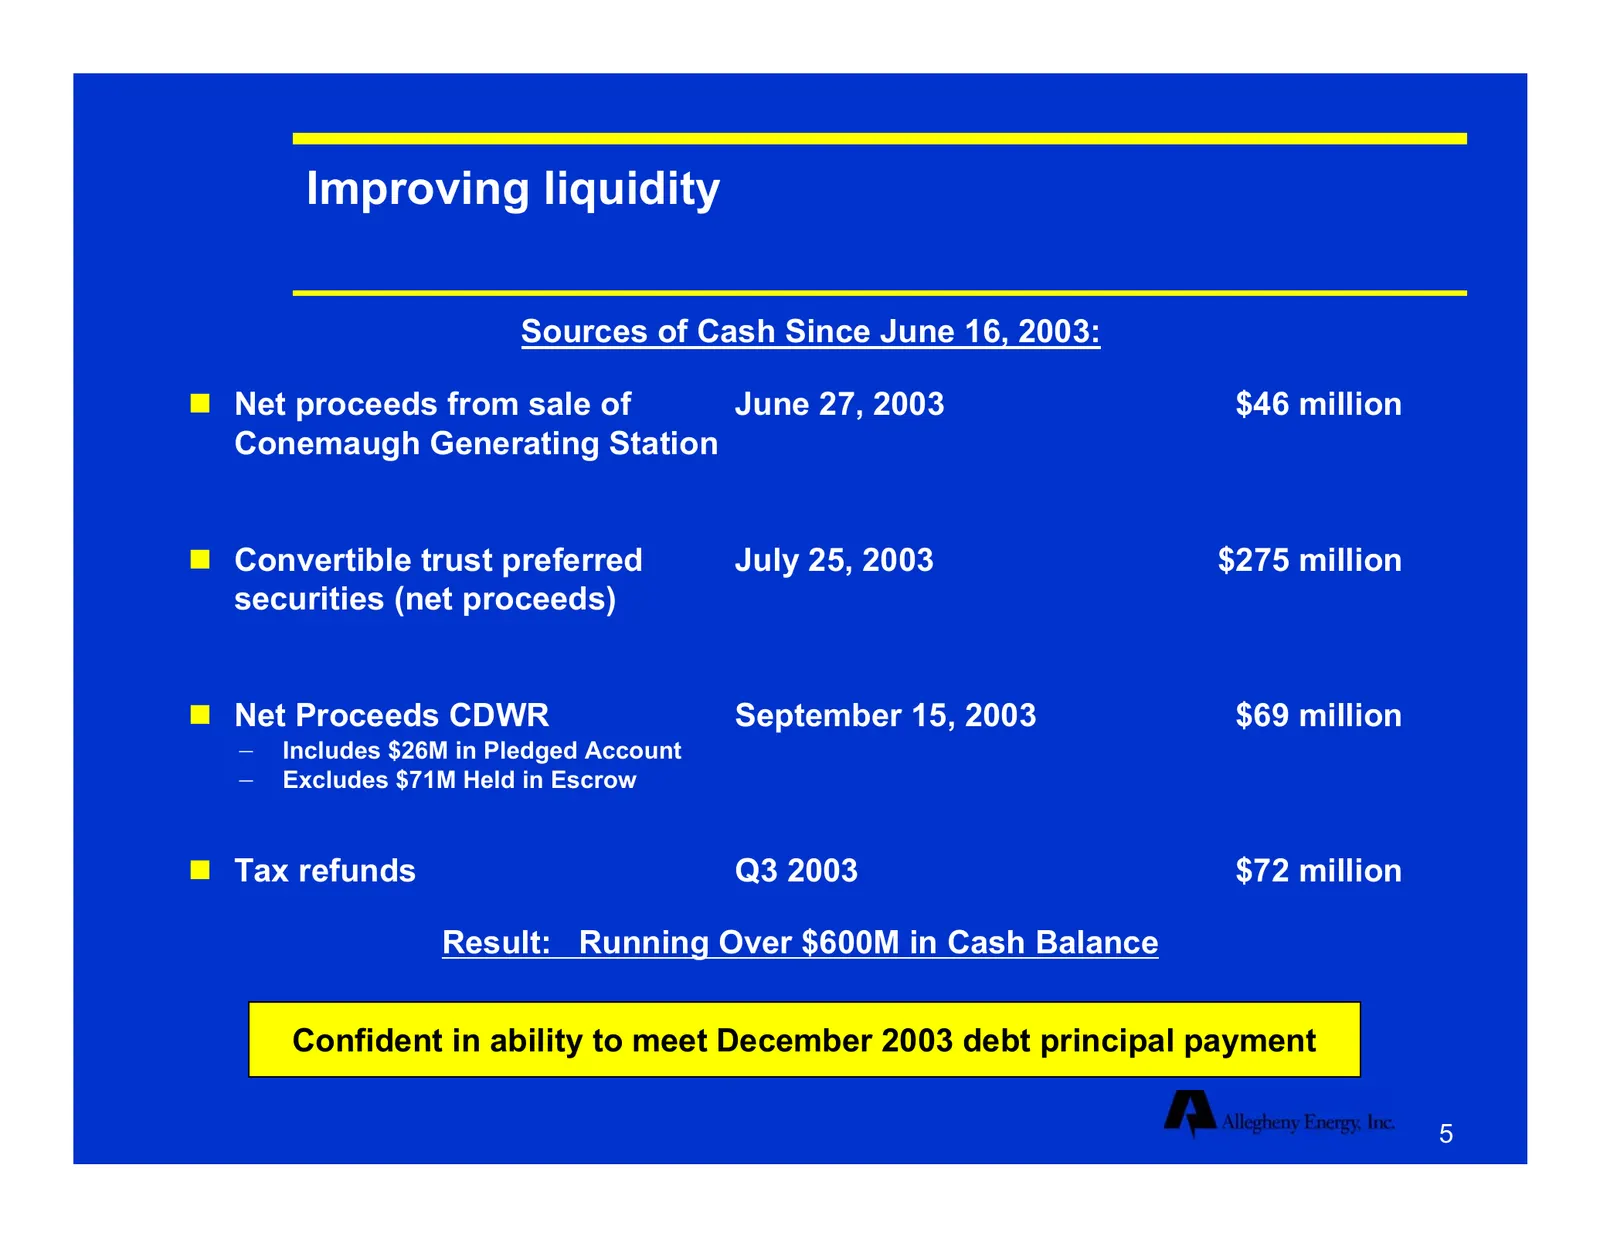
Improving liquidity Sources of Cash Since June 16, 2003: Net proceeds from sale of June 27, 2003 $46 million Conemaugh Generating Station Convertible trust preferred July 25, 2003 $275 million securities (net proceeds) Net Proceeds CDWR September 15, 2003 $69 million − Includes $26M in Pledged
Slide 6: Reducing volatility and risk
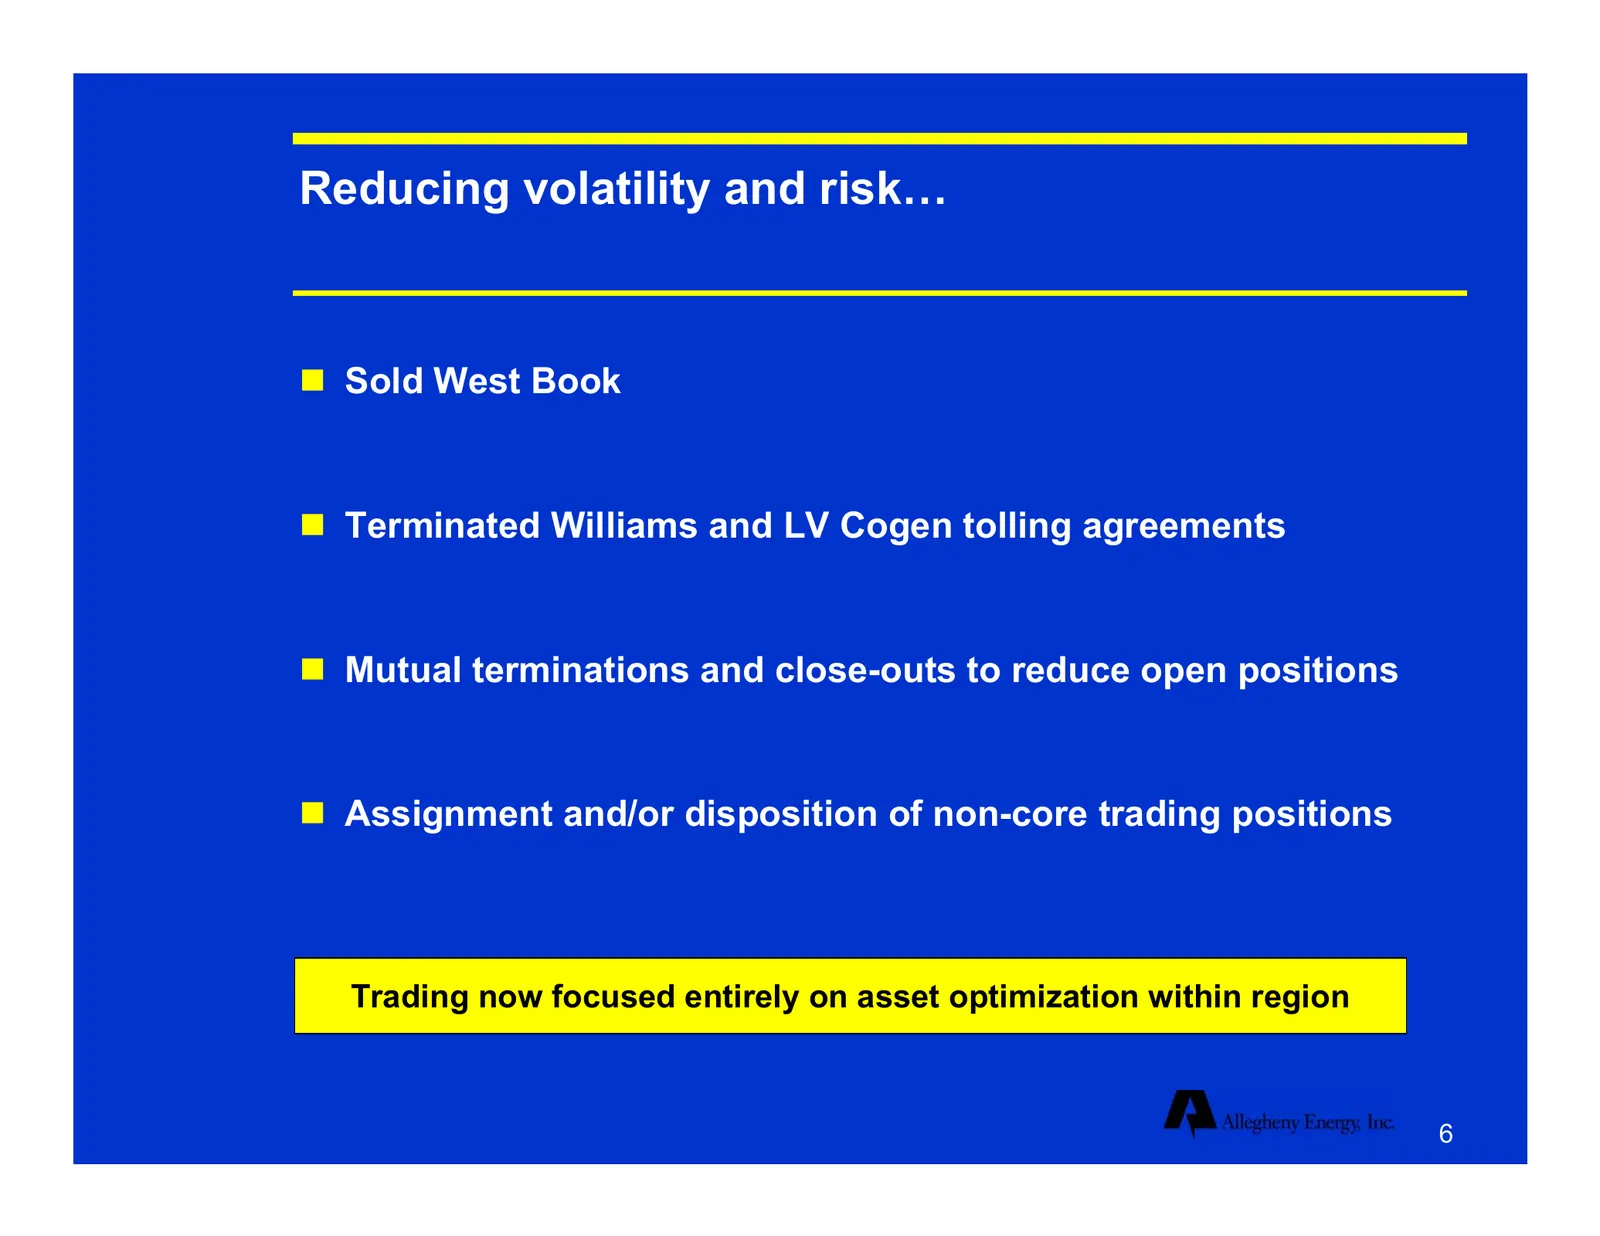
Reducing volatility and risk… Sold West Book Terminated Williams and LV Cogen tolling agreements Mutual terminations and close-outs to reduce open positions Assignment and/or disposition of non-core trading positions Trading now focused entirely on asset optimization within region 6
Slide 7: …With significant results
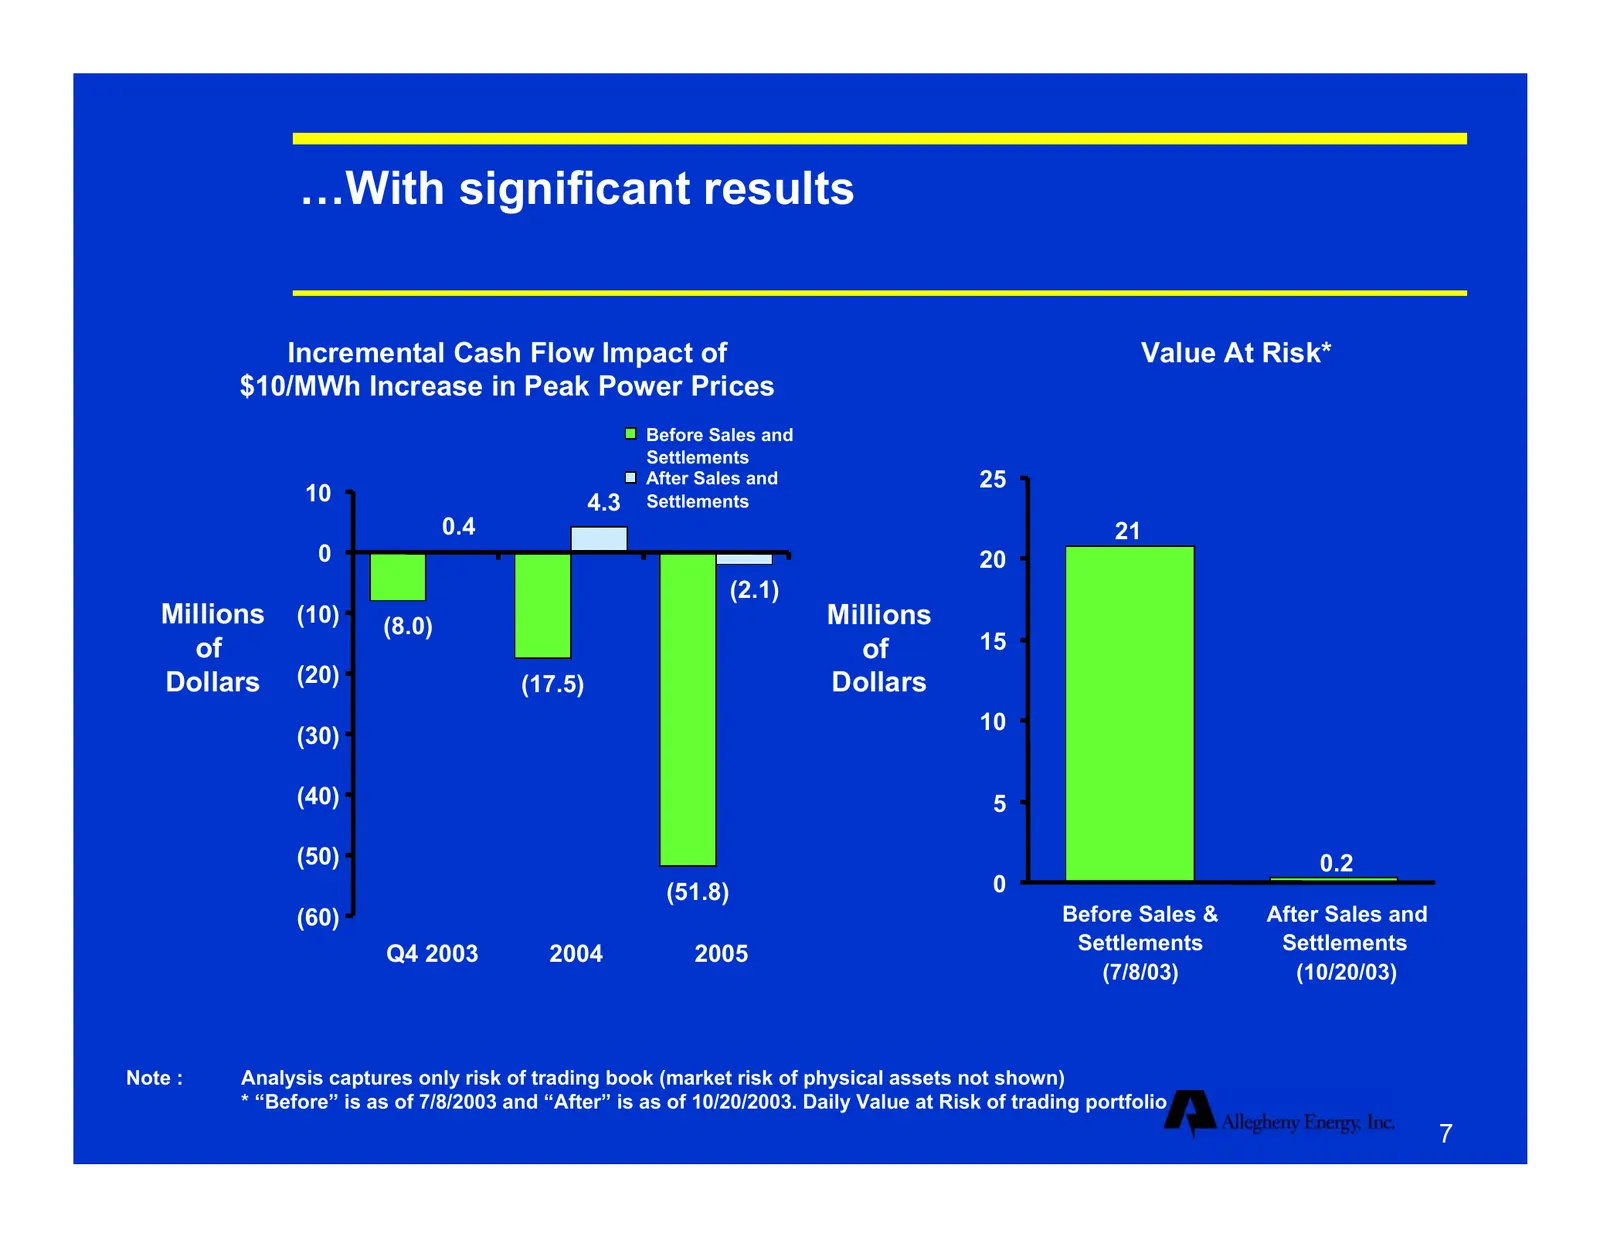
…With significant results Incremental Cash Flow Impact of Value At Risk* $10/MWh Increase in Peak Power Prices Before Sales and Settlements After Sales and 25 10 4.3 Settlements 0.4 21 0 20 (2.1) Millions (10) (8.0) Millions of of 15 Dollars (20) (17.5) Dollars 10 (30) (40) 5 (50) 0.2 (51.8) 0 (60)
Slide 8: Financial reporting is getting back on track
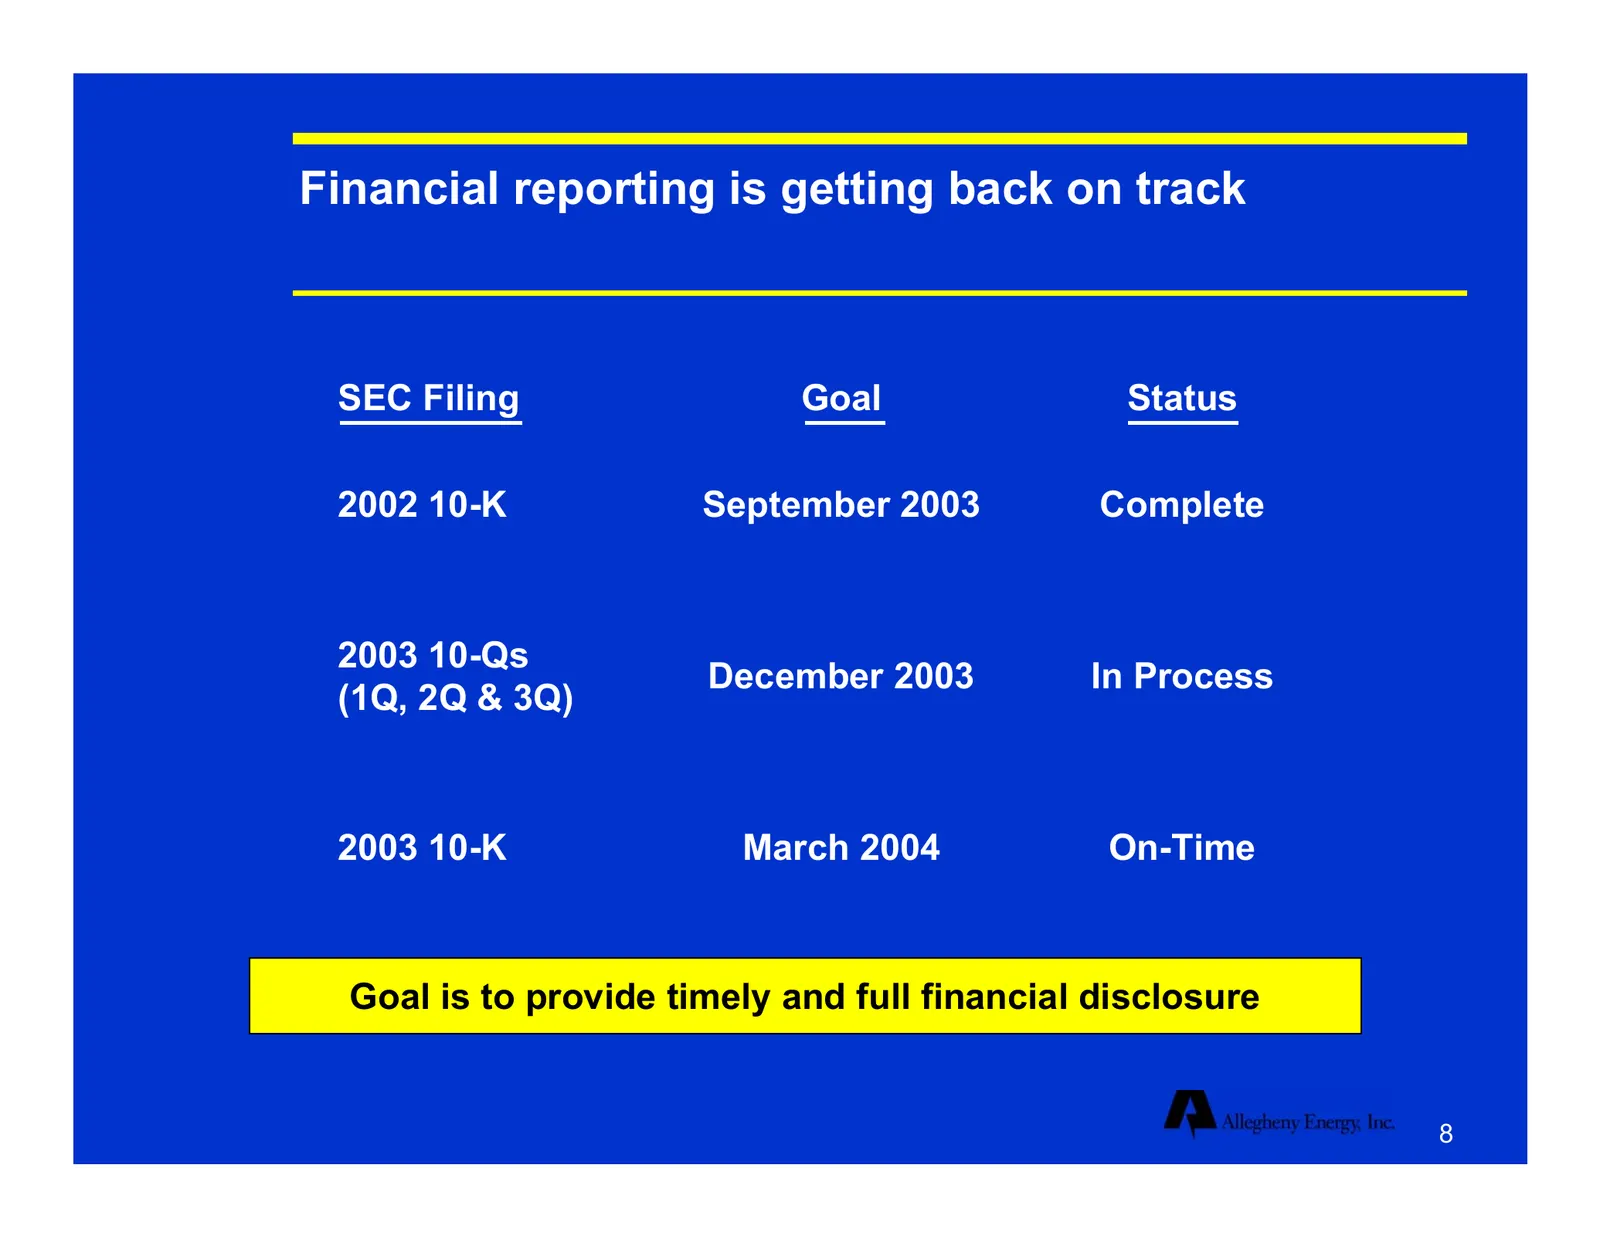
Financial reporting is getting back on track SEC Filing Goal Status 2002 10-K September 2003 Complete 2003 10-Qs December 2003 In Process (1Q, 2Q & 3Q) 2003 10-K March 2004 On-Time Goal is to provide timely and full financial disclosure 8
Slide 9: A talented senior management team has been put in place
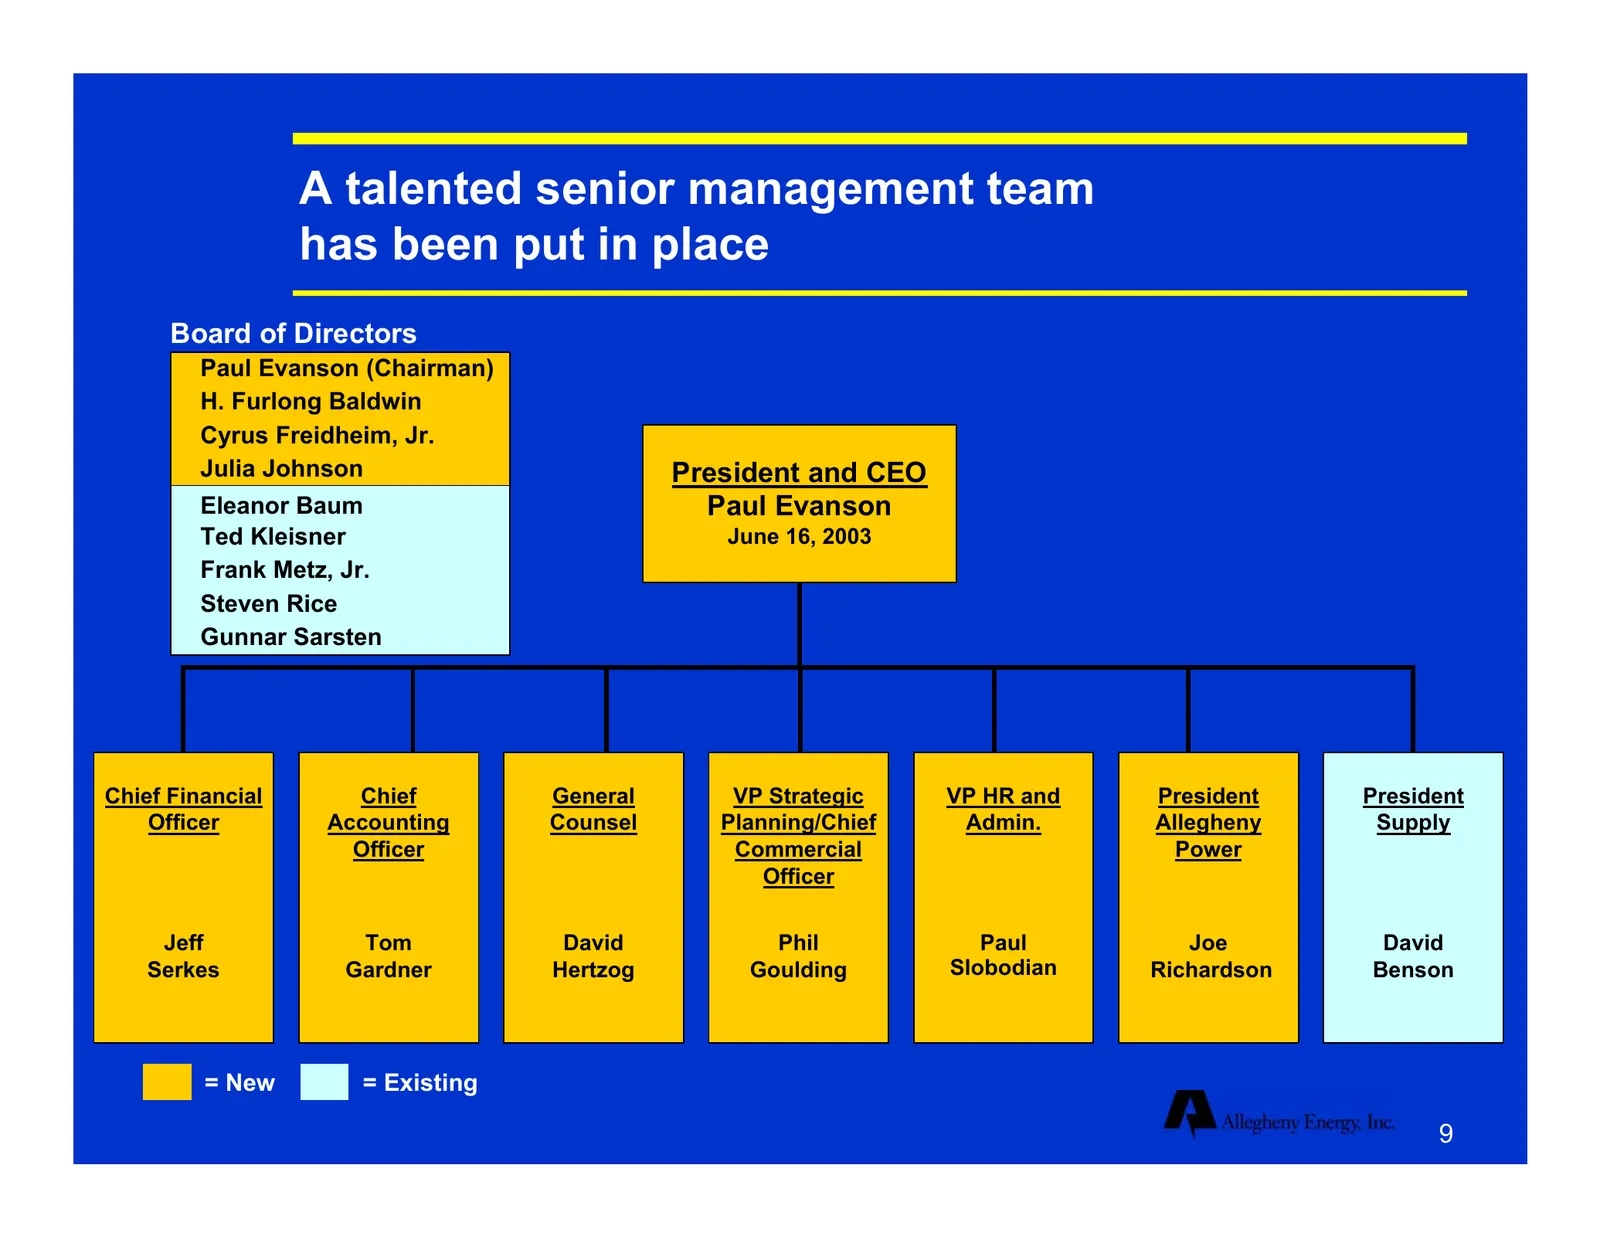
A talented senior management team has been put in place Board of Directors Paul Evanson (Chairman) H. Furlong Baldwin Cyrus Freidheim, Jr. Julia Johnson President and CEO Eleanor Baum Paul Evanson Ted Kleisner June 16, 2003 Frank Metz, Jr. Steven Rice Gunnar Sarsten Chief Financial Chief General VP
Slide 10: Focusing on core generation and delivery business
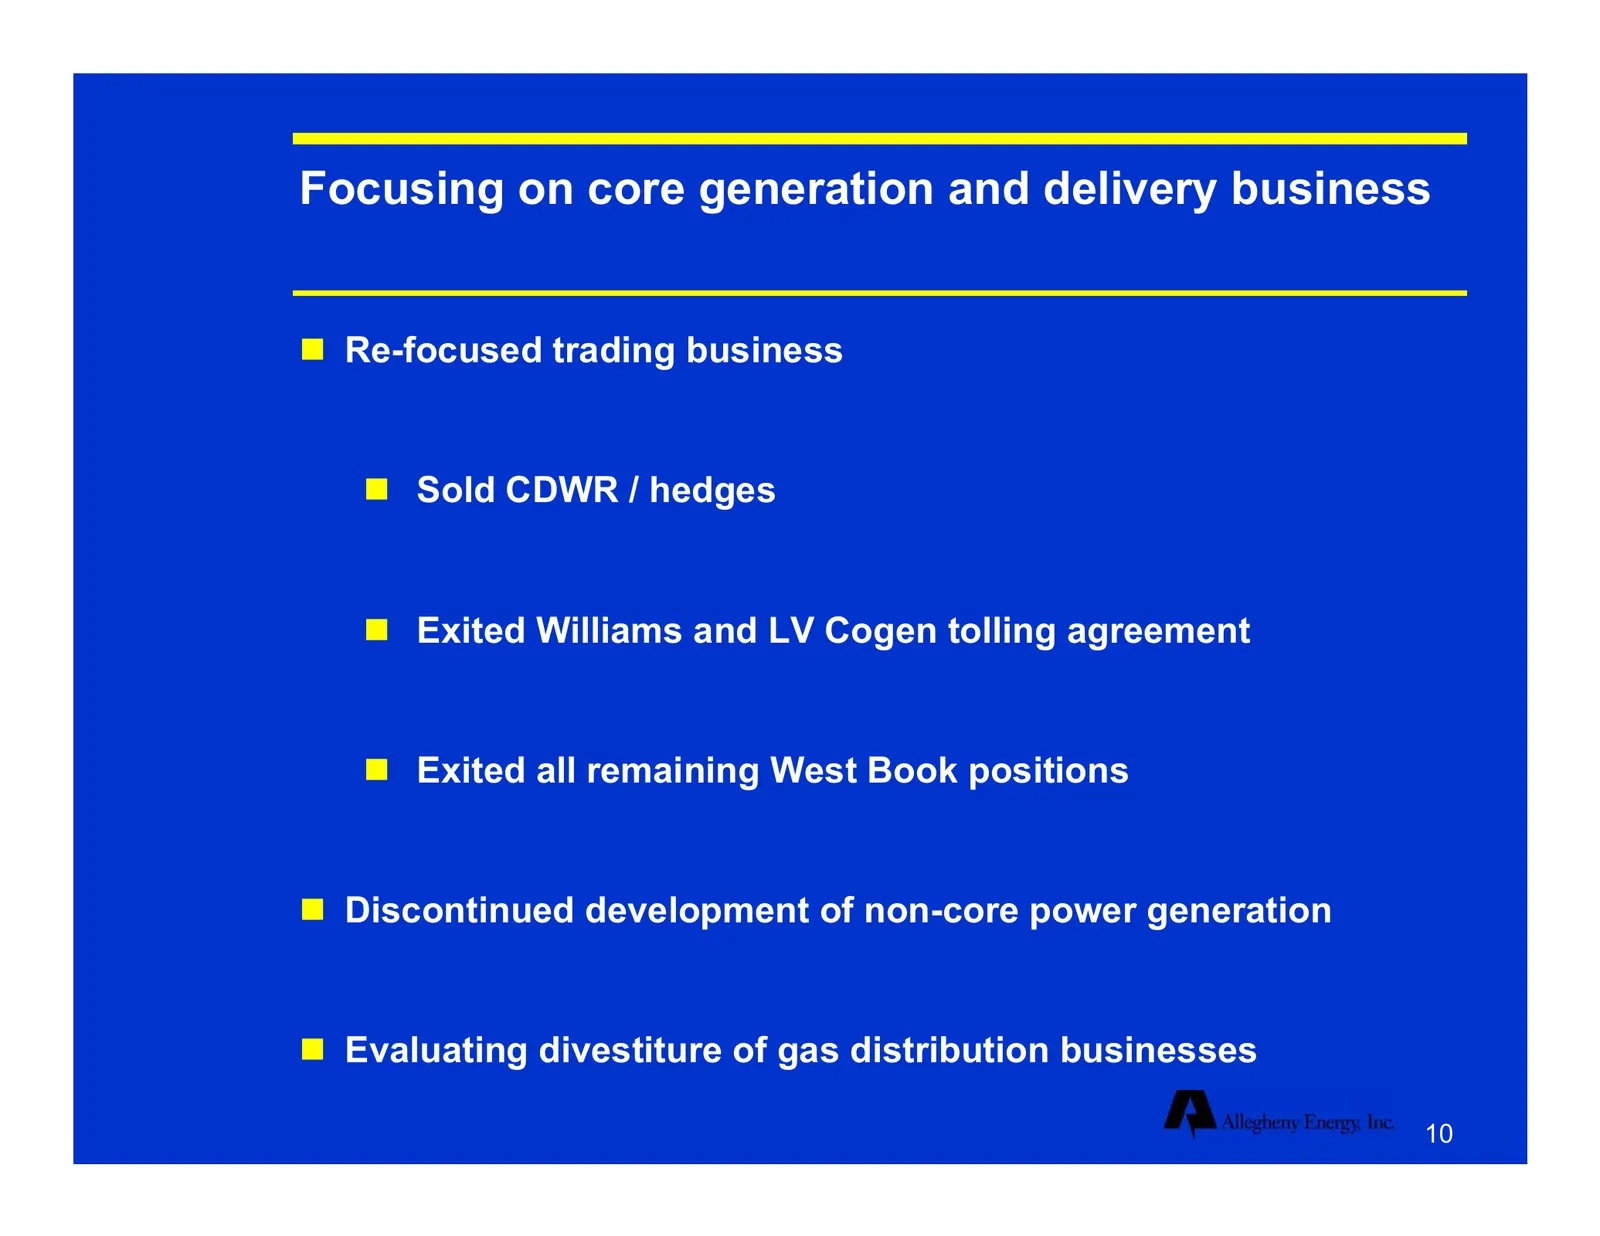
Focusing on core generation and delivery business Re-focused trading business Sold CDWR / hedges Exited Williams and LV Cogen tolling agreement Exited all remaining West Book positions Discontinued development of non-core power generation Evaluating divestiture of gas distribution busine
Slide 11: A lot of accomplishments...
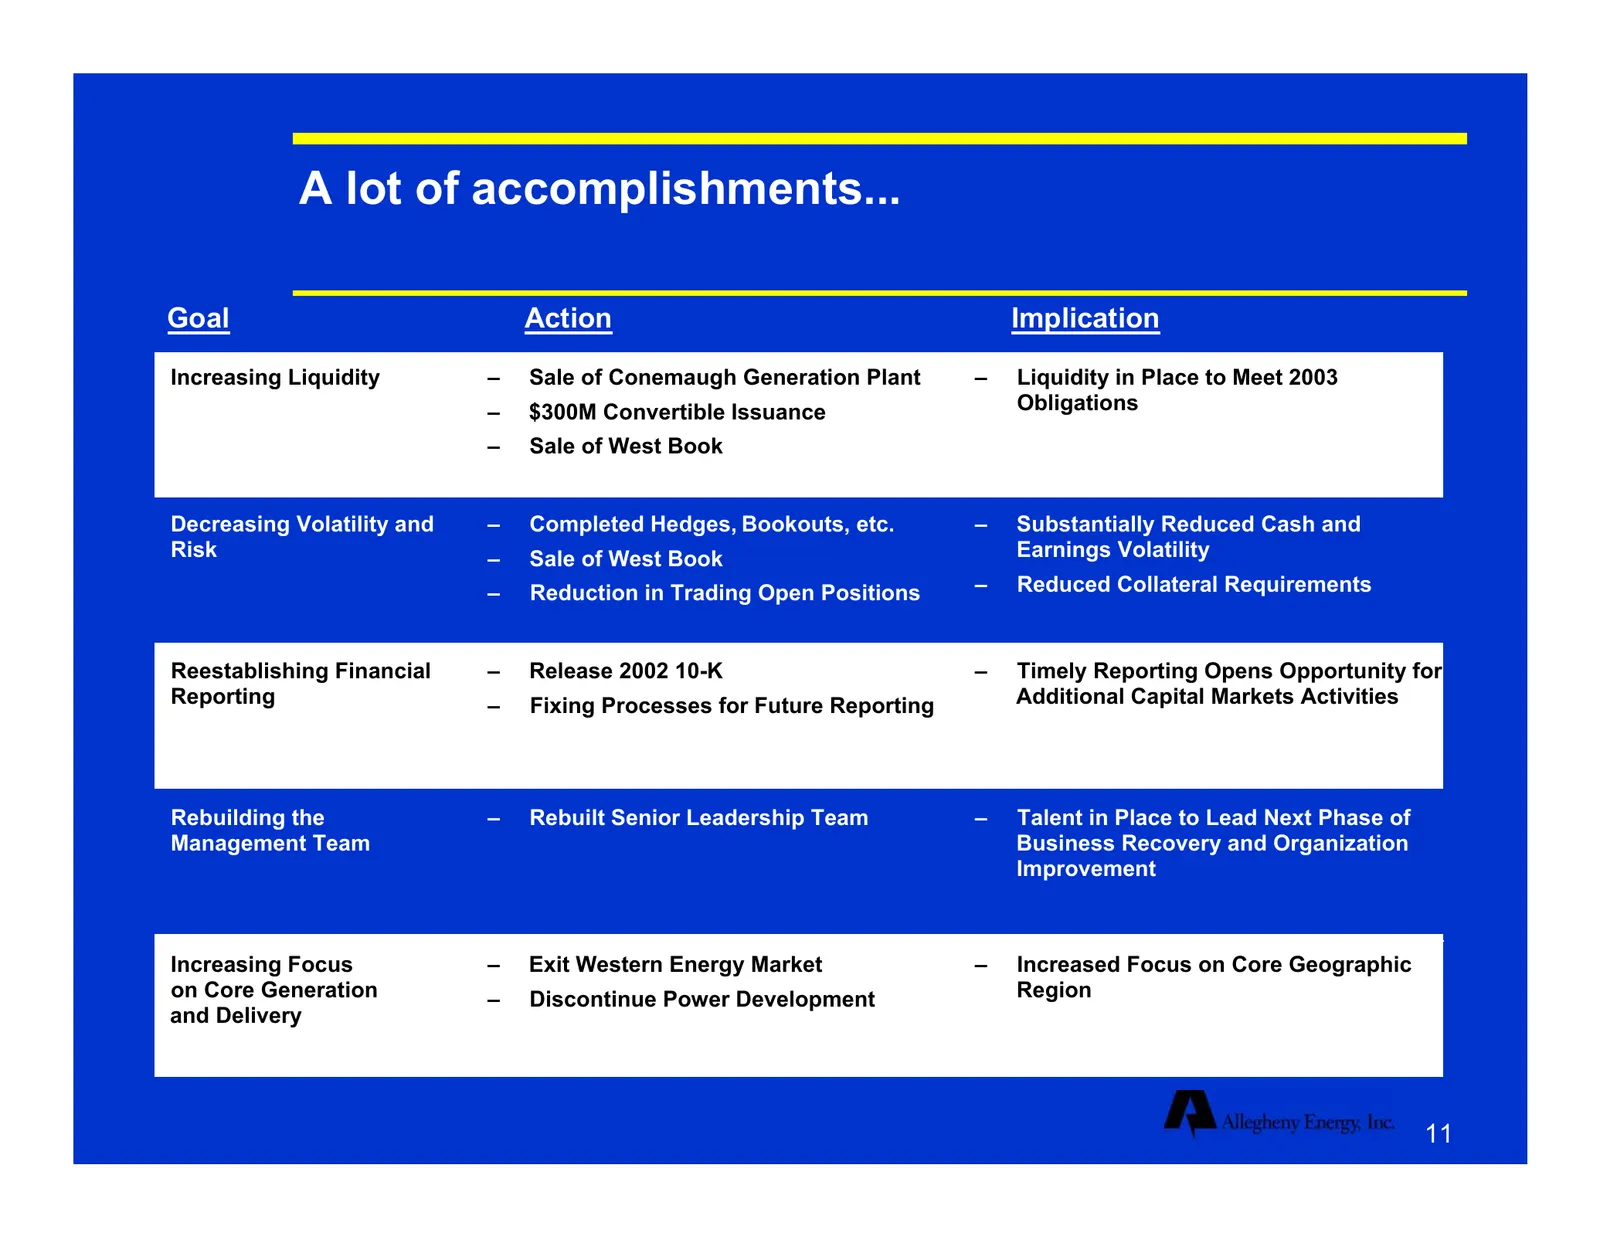
A lot of accomplishments... Goal Action Implication Increasing Liquidity – Sale of Conemaugh Generation Plant – Liquidity in Place to Meet 2003 – $300M Convertible Issuance Obligations – Sale of West Book Decreasing Volatility and – Completed Hedges, Bookouts, etc. – Substantially Reduced Cash and R
Slide 12: …Many challenges ahead
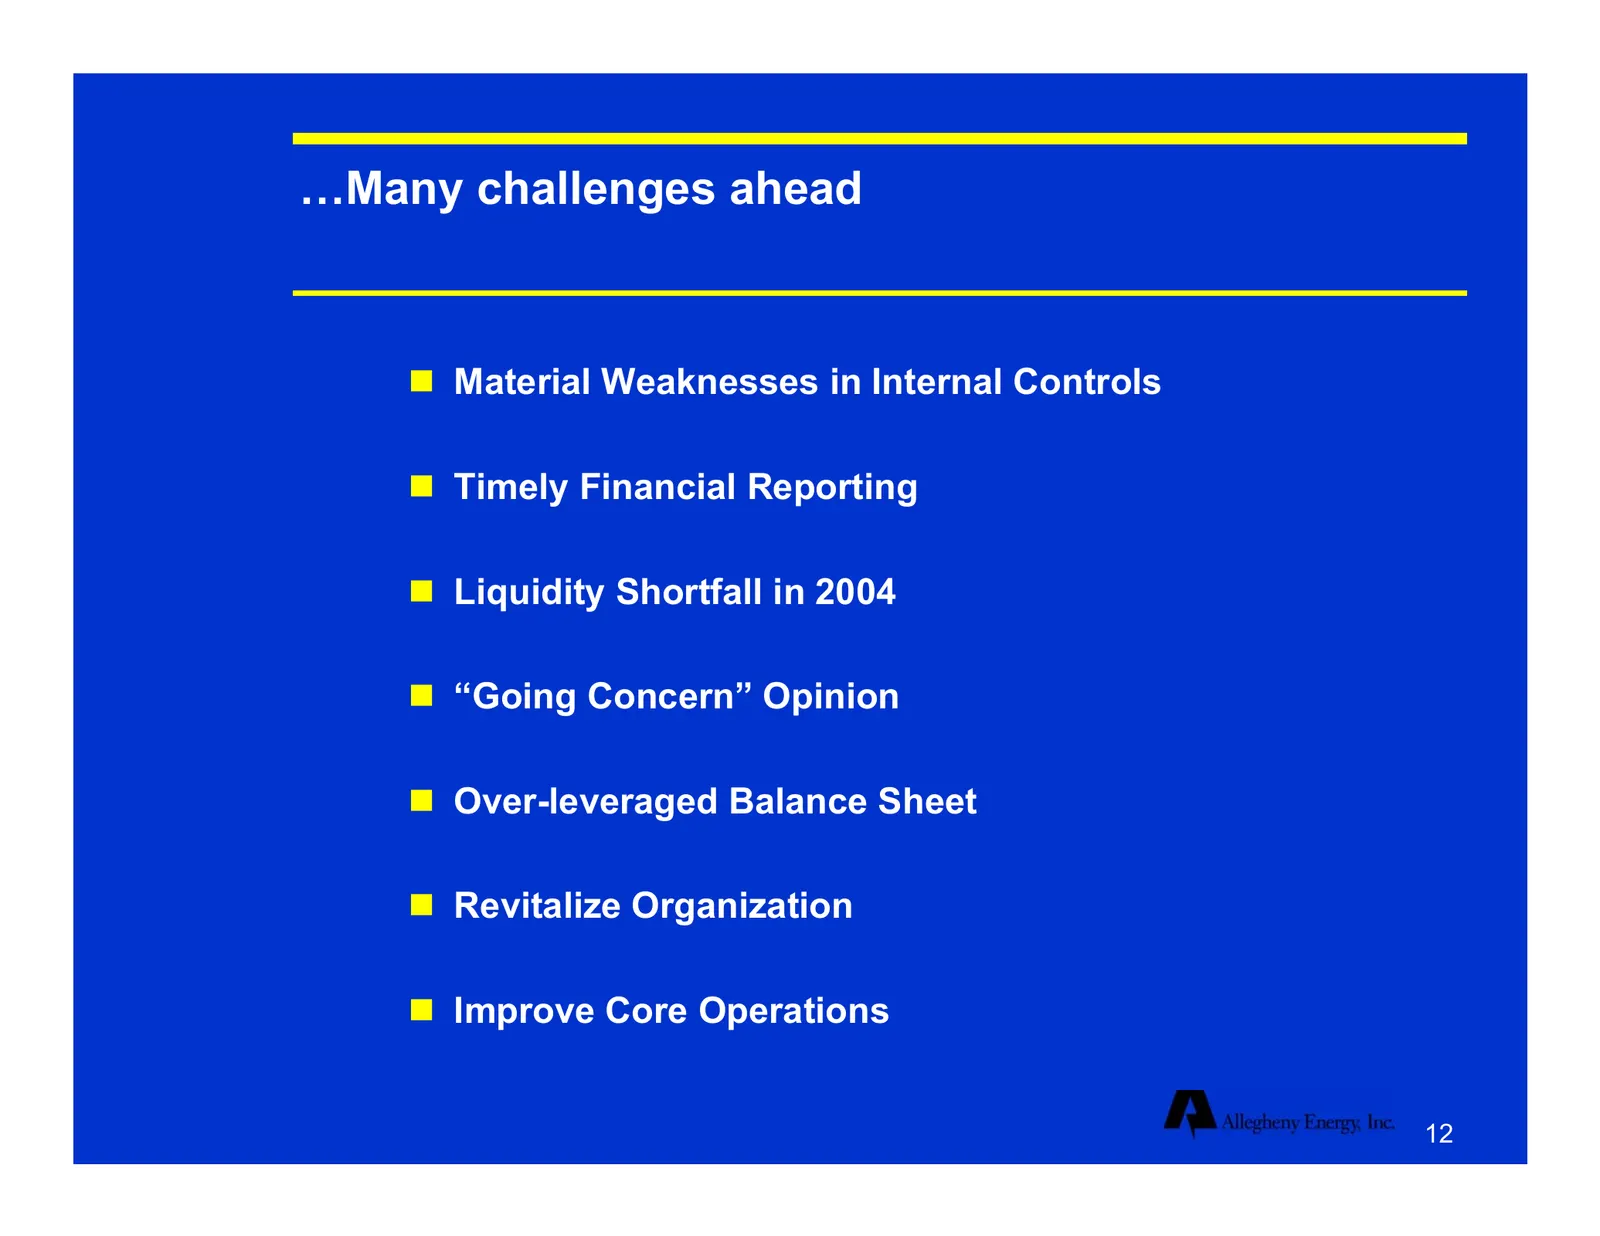
…Many challenges ahead Material Weaknesses in Internal Controls Timely Financial Reporting Liquidity Shortfall in 2004 “Going Concern” Opinion Over-leveraged Balance Sheet Revitalize Organization Improve Core Operations 12
Slide 13: Agenda
Agenda Early Progress Business Foundation Financial Update Conclusions 13
Slide 14: Core generation and delivery business
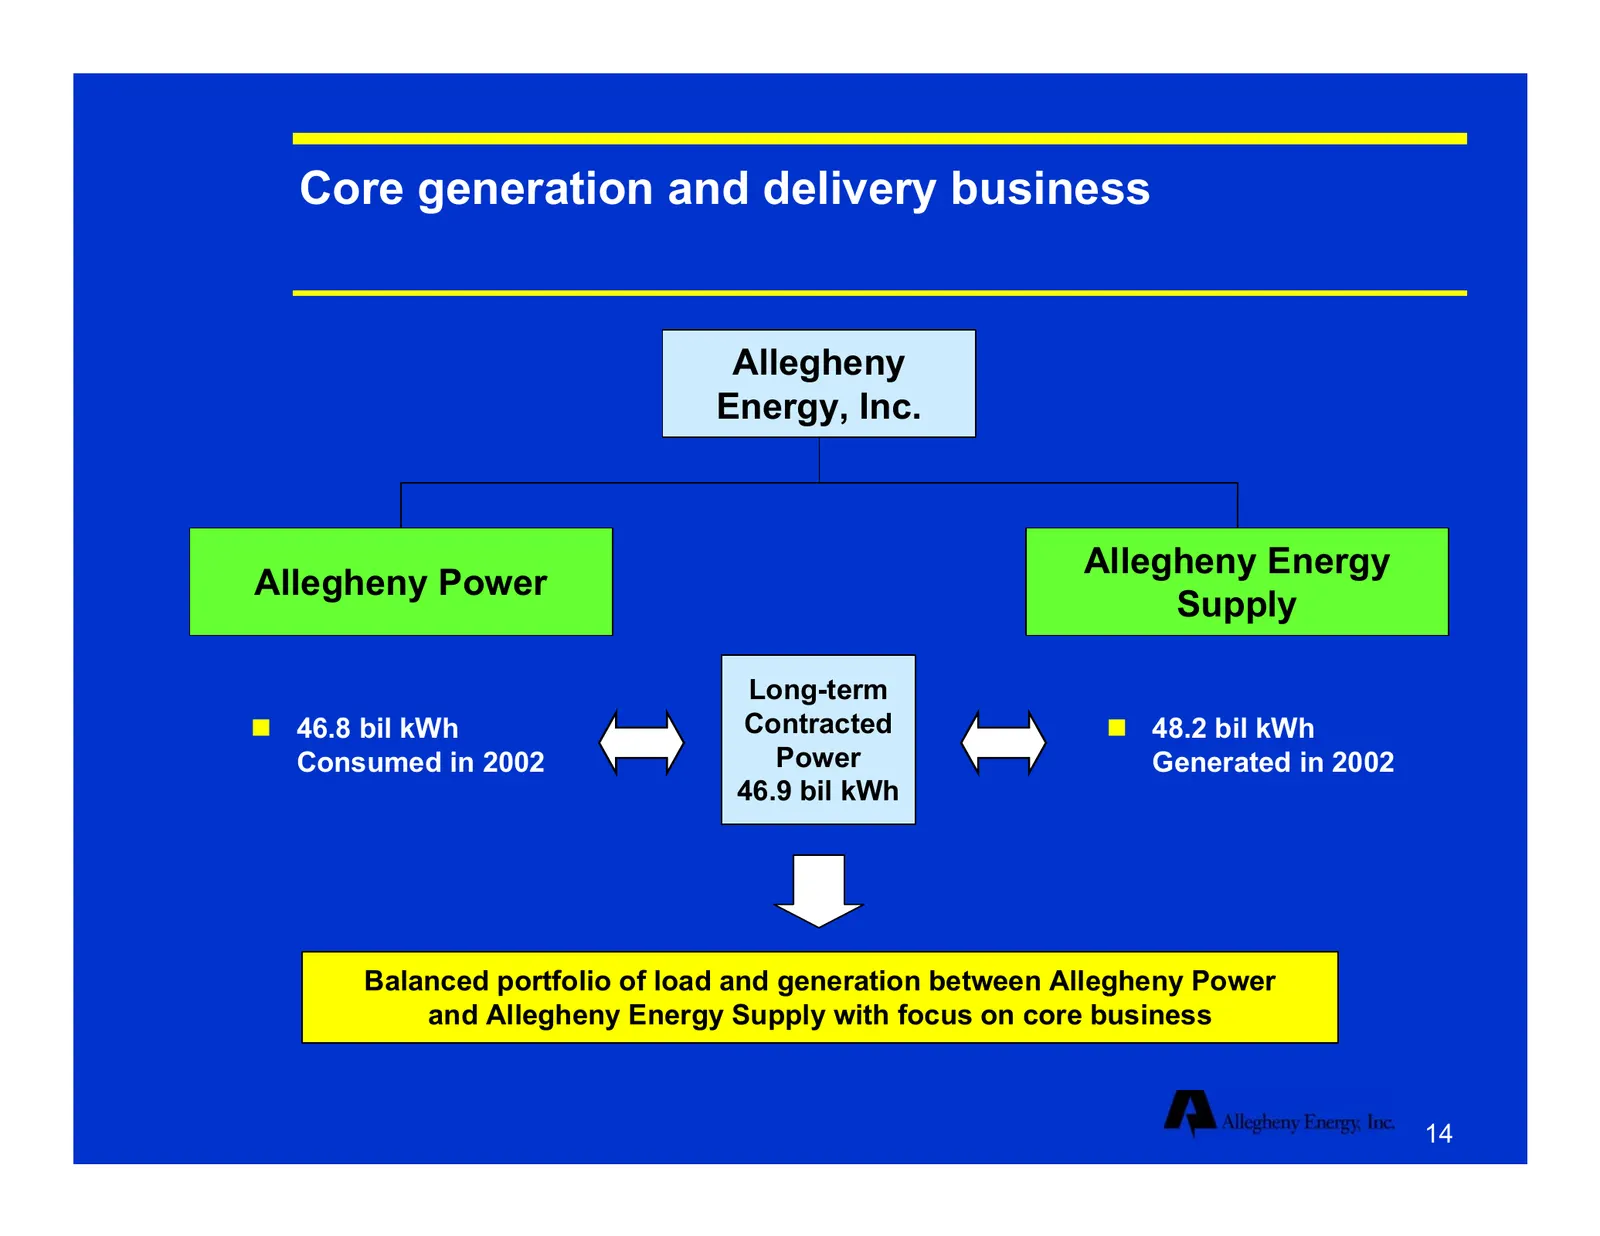
Core generation and delivery business Allegheny Energy, Inc. Allegheny Energy Allegheny Power Supply Long-term 46.8 bil kWh Contracted 48.2 bil kWh Consumed in 2002 Power Generated in 2002 46.9 bil kWh Balanced portfolio of load and generation between Allegheny Power and Allegheny Energy Supply
Slide 15: The regulated utility operates in the Mid Atlantic region
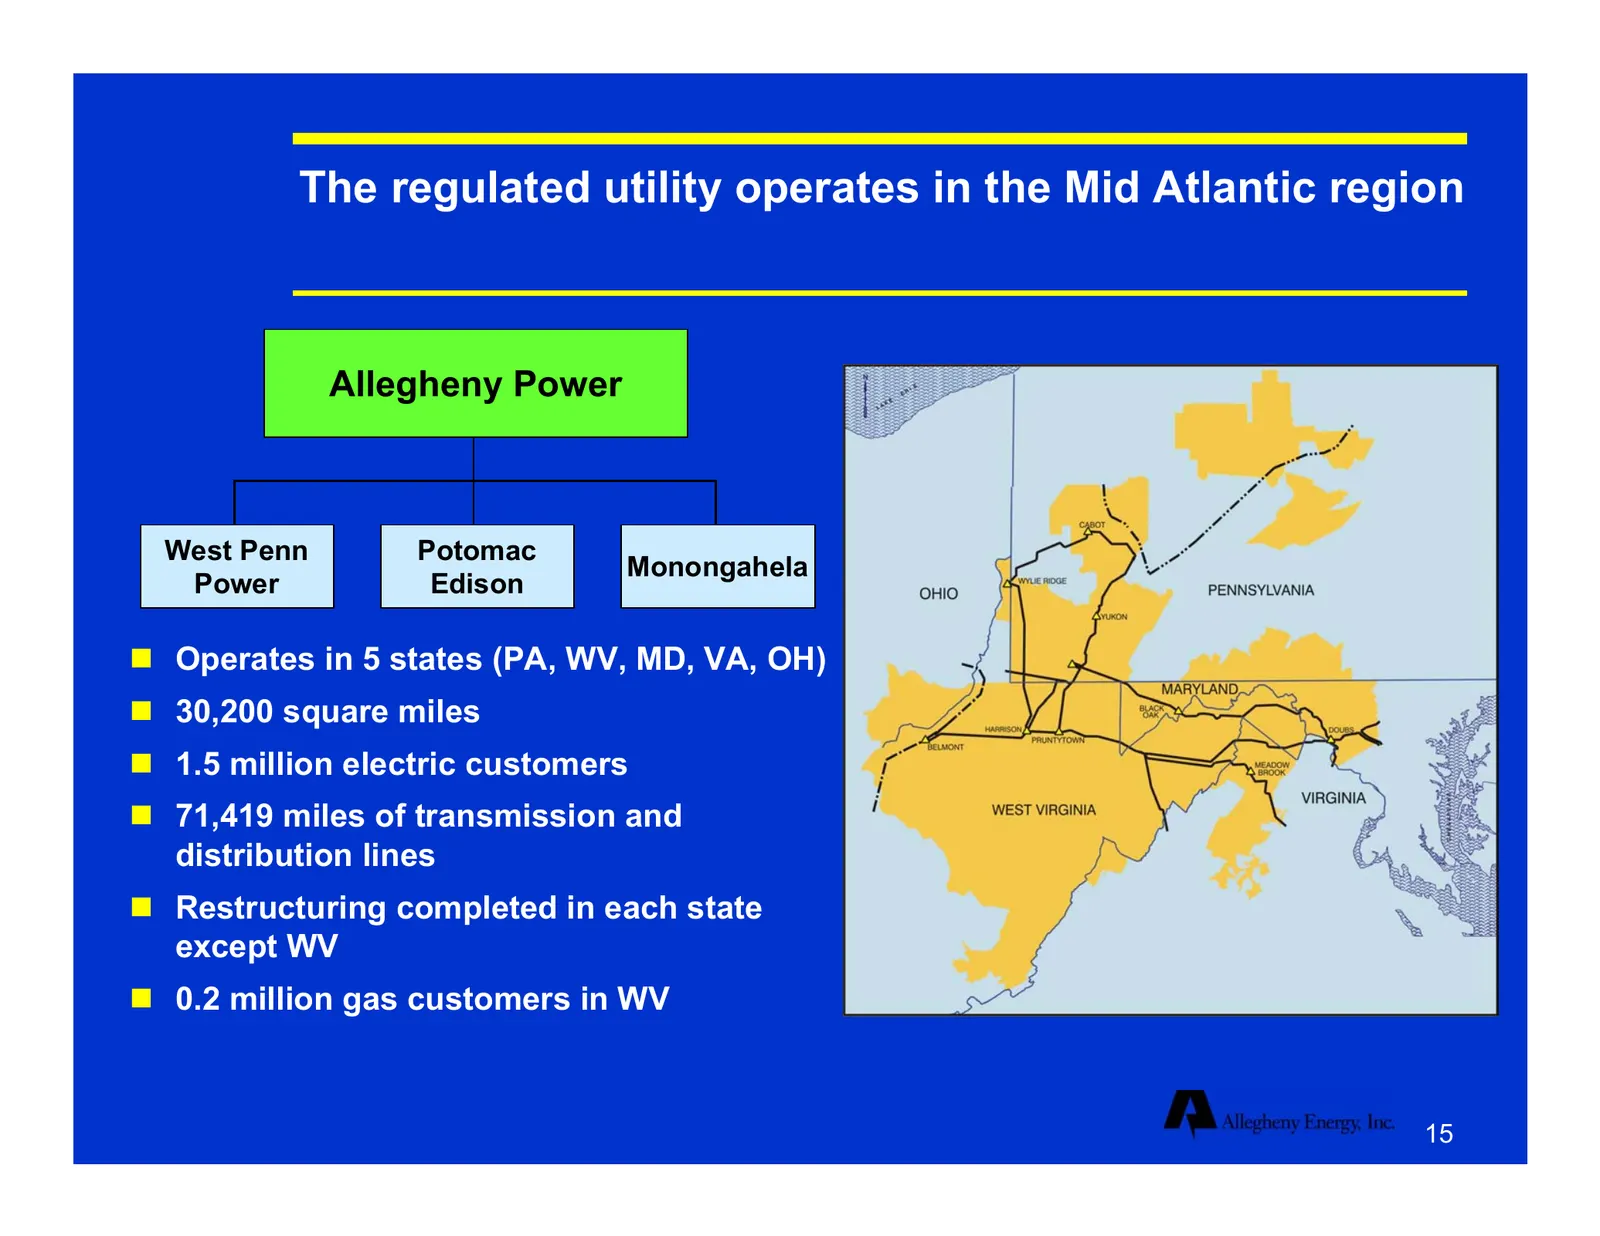
The regulated utility operates in the Mid Atlantic region Allegheny Power West Penn Potomac Monongahela Power Edison Operates in 5 states (PA, WV, MD, VA, OH) 30,200 square miles 1.5 million electric customers 71,419 miles of transmission and distribution lines Restructuring completed in e
Slide 16: Balanced customer mix with steady growth prospects
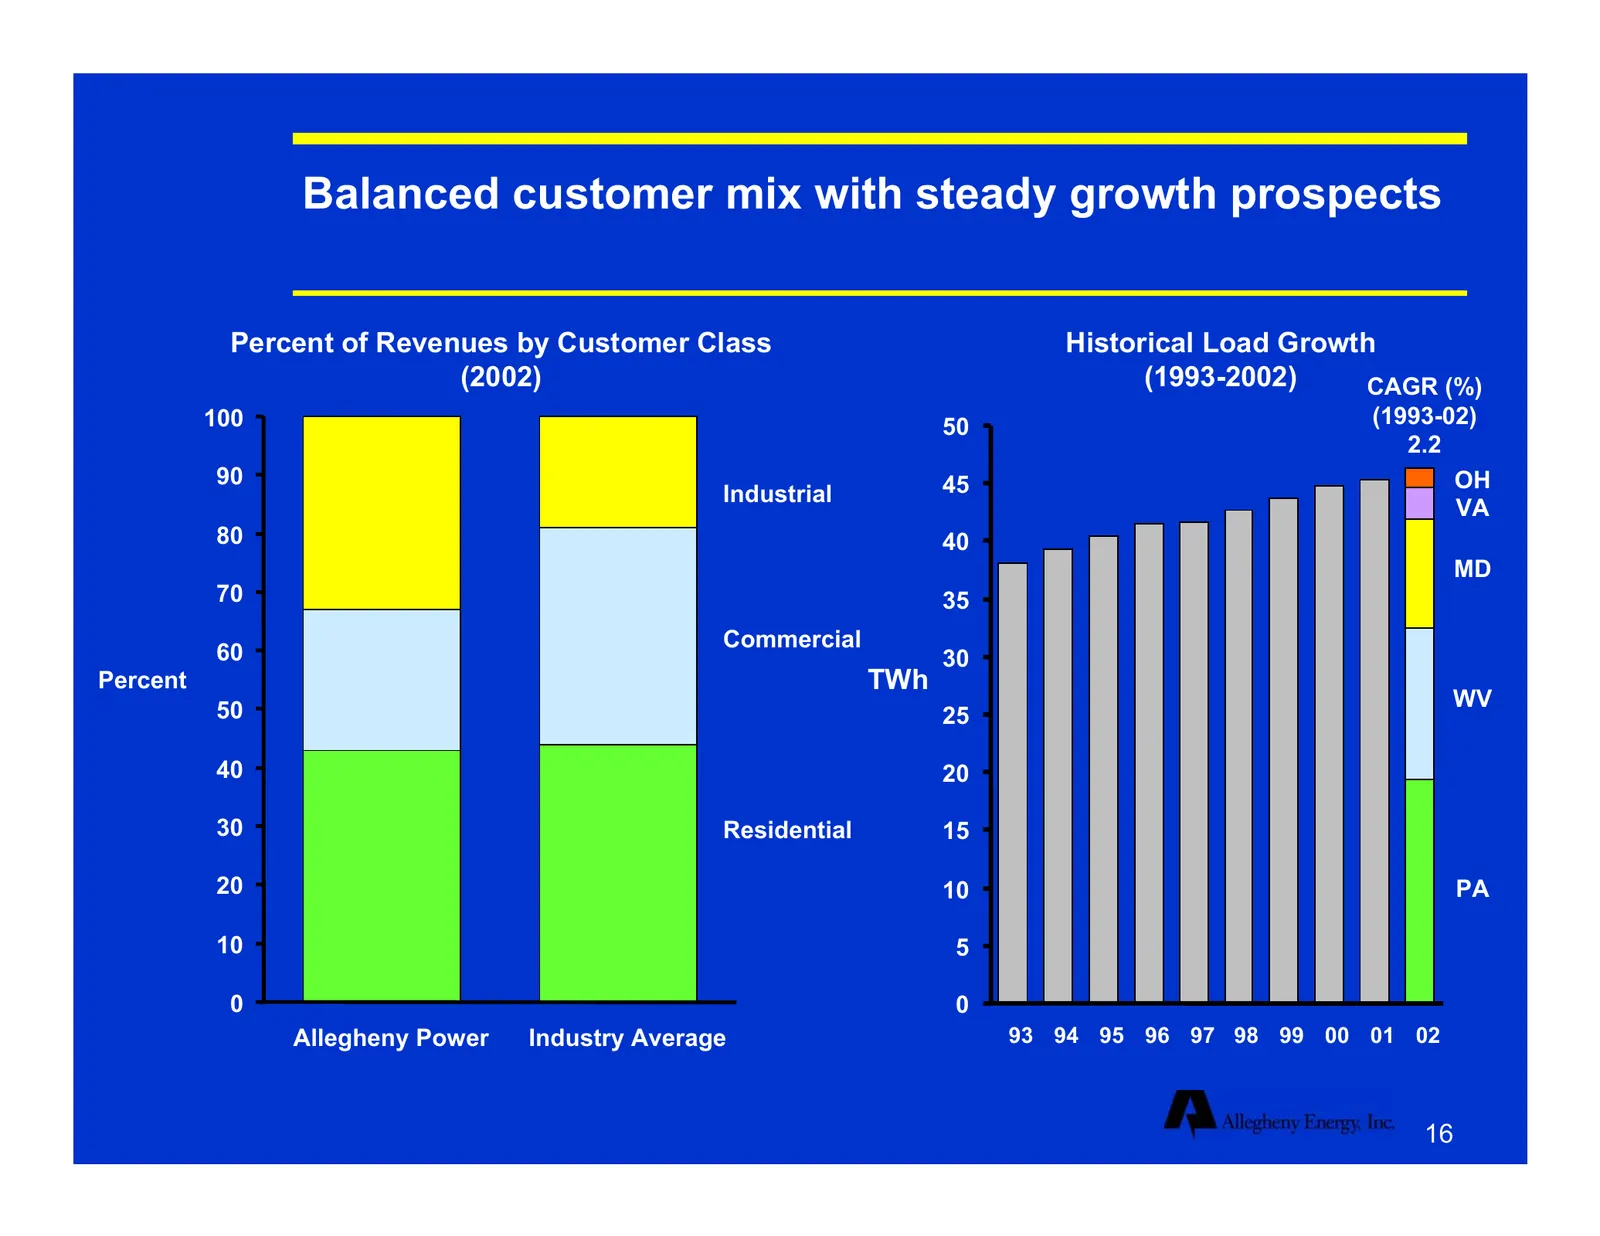
Balanced customer mix with steady growth prospects Percent of Revenues by Customer Class Historical Load Growth (2002) (1993-2002) CAGR (%) 100 50 (1993-02) 2.2 90 45 OH Industrial VA 80 40 MD 70 35 Commercial 60 30 Percent TWh 50 WV 25 40 20 30 Residential 15 20 10 PA 10 5 0 0 Allegheny Power Indus
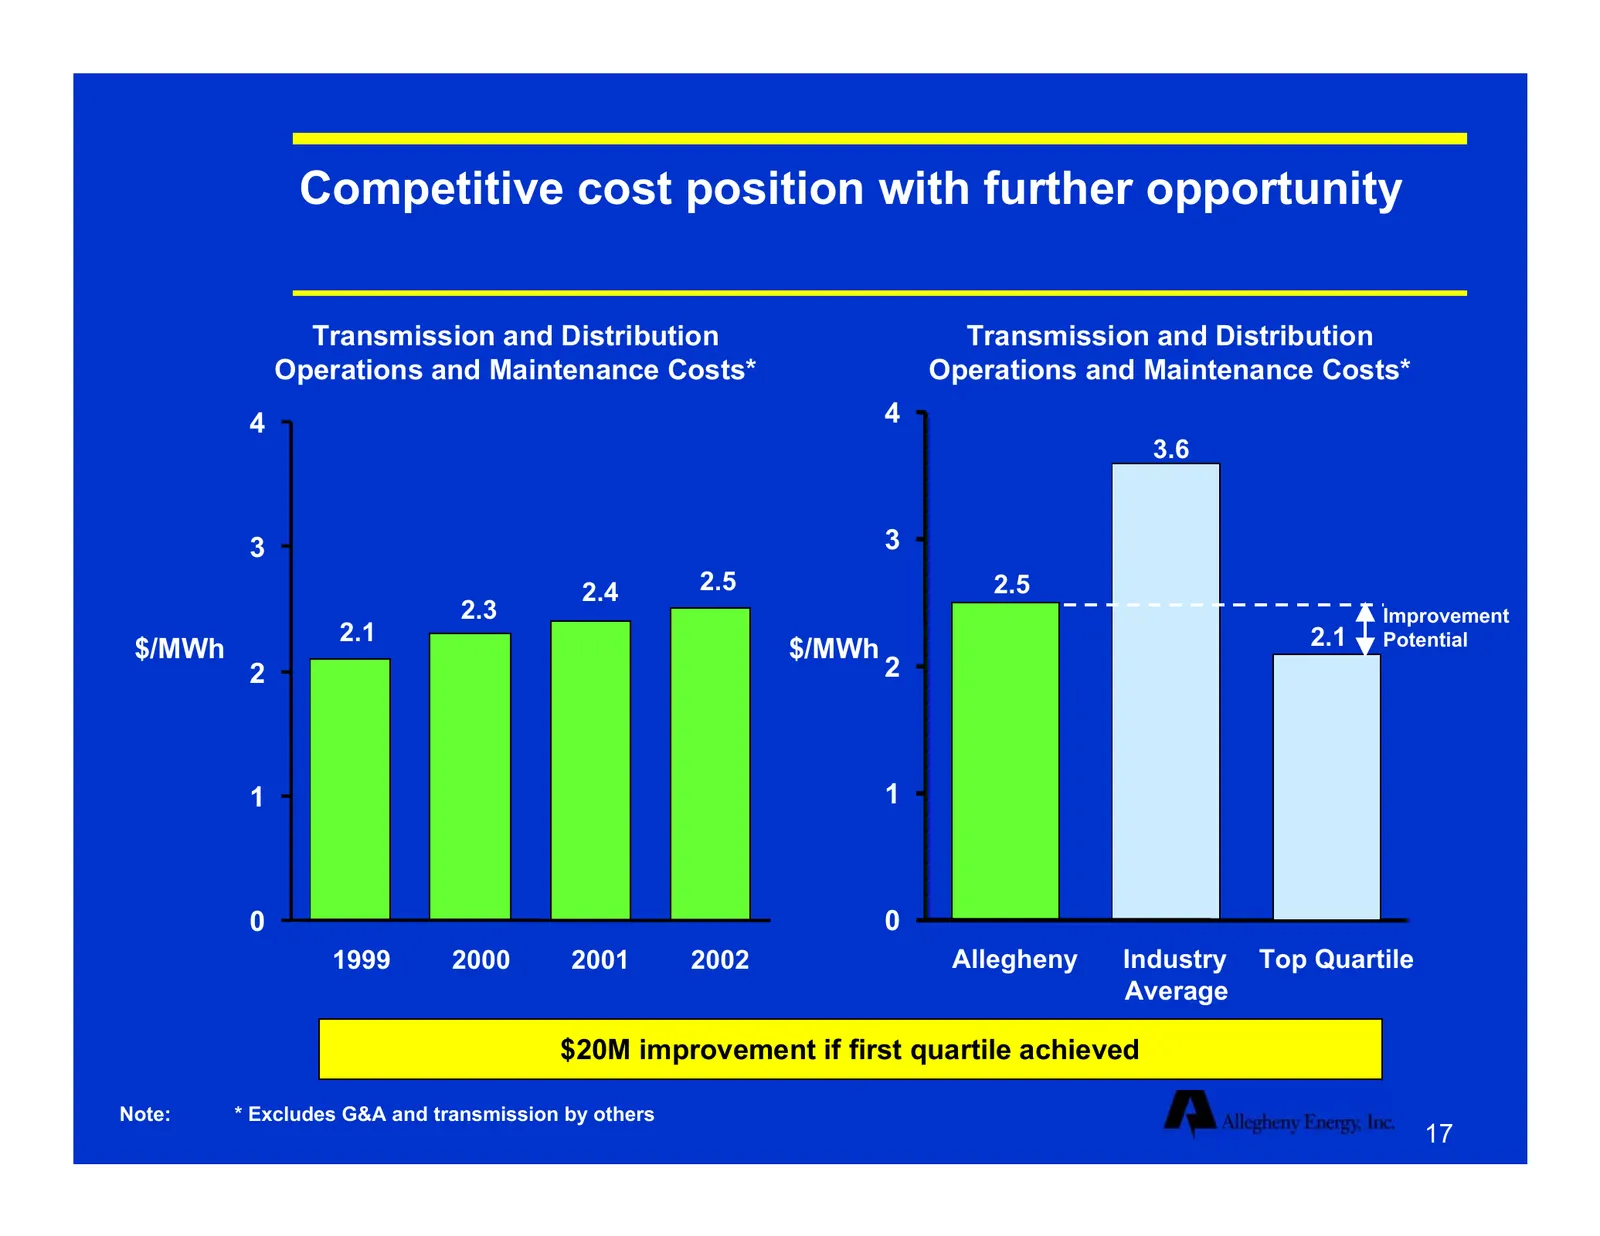
Slide 17: Competitive cost position with further opportunity
Competitive cost position with further opportunity Transmission and Distribution Transmission and Distribution Operations and Maintenance Costs* Operations and Maintenance Costs* 4 4 3.6 3 3 2.4 2.5 2.5 2.3 Improvement 2.1 2.1 Potential $/MWh $/MWh 2 2 1 1 0 0 1999 2000 2001 2002 Allegheny Industry
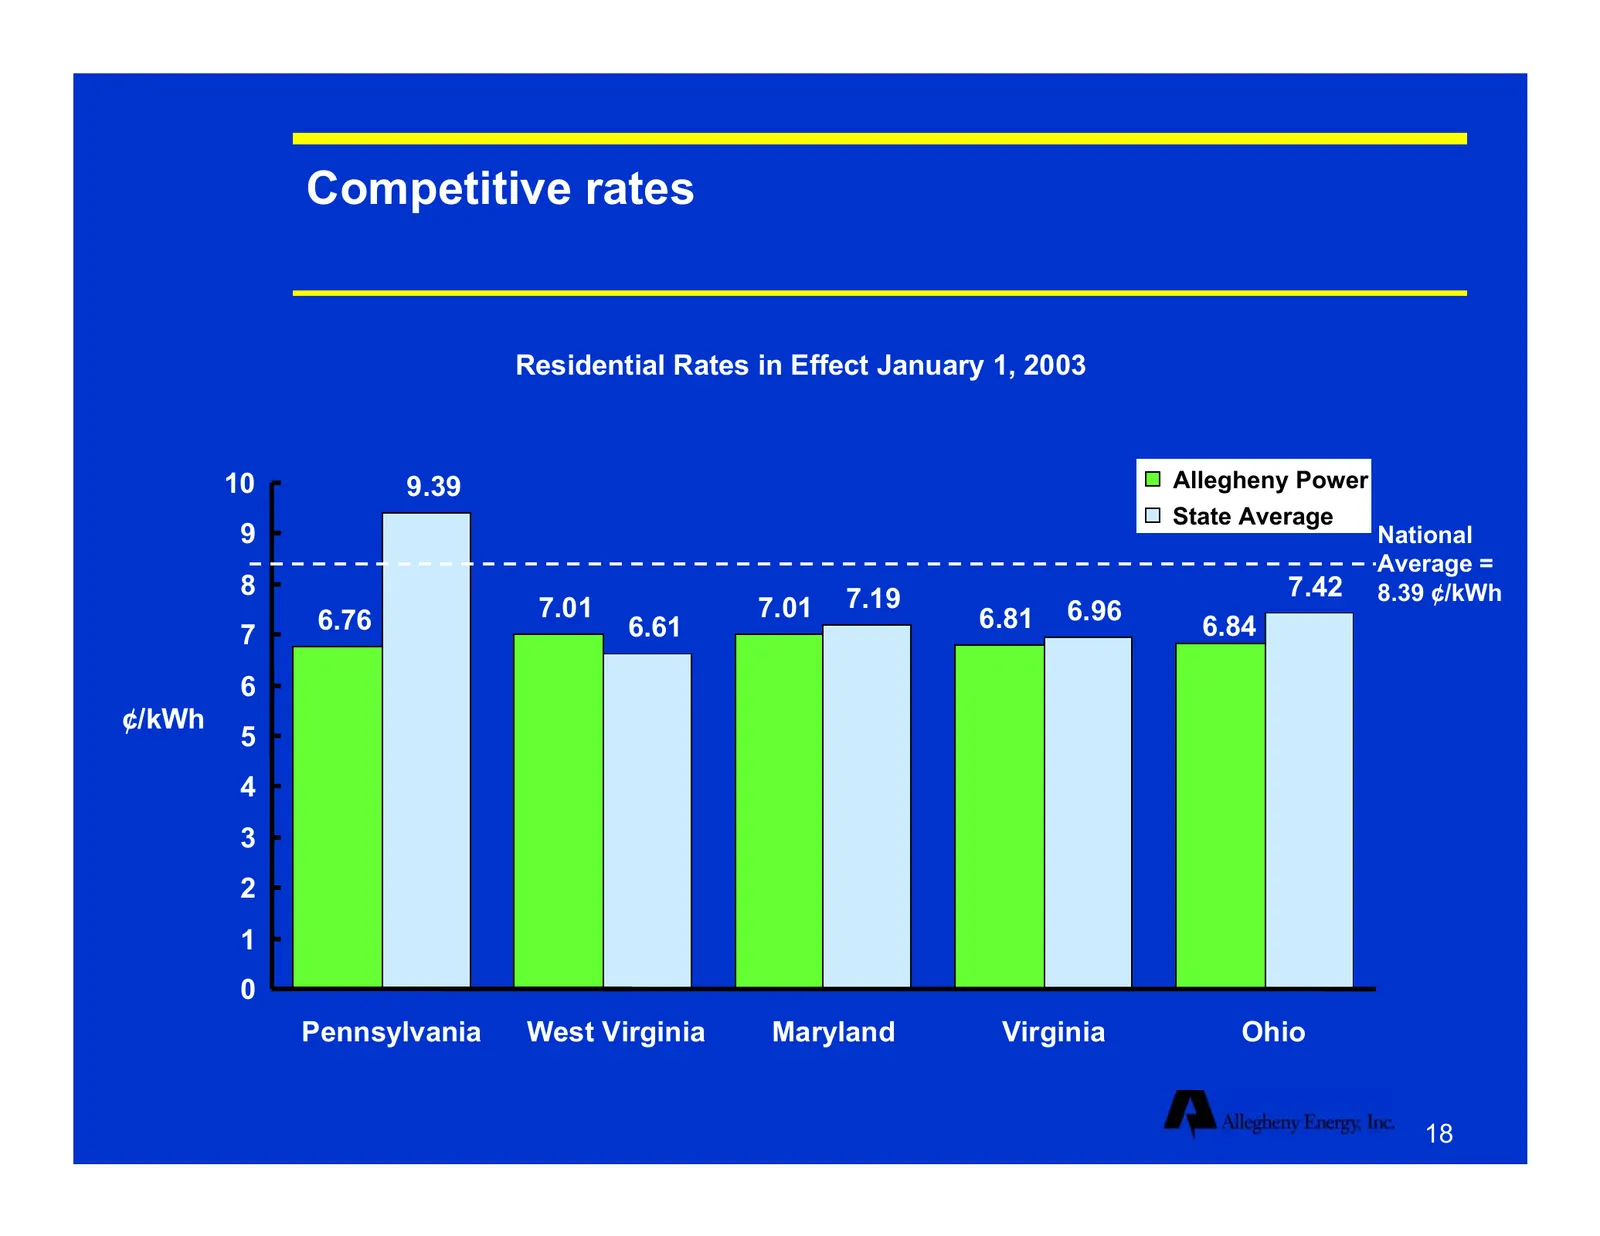
Slide 18: Competitive rates
Competitive rates Residential Rates in Effect January 1, 2003 10 9.39 Allegheny Power State Average 9 National Average = 8 7.19 7.42 8.39 ¢/kWh 6.76 7.01 7.01 6.81 6.96 7 6.61 6.84 6 ¢/kWh 5 4 3 2 1 0 Pennsylvania West Virginia Maryland Virginia Ohio 18
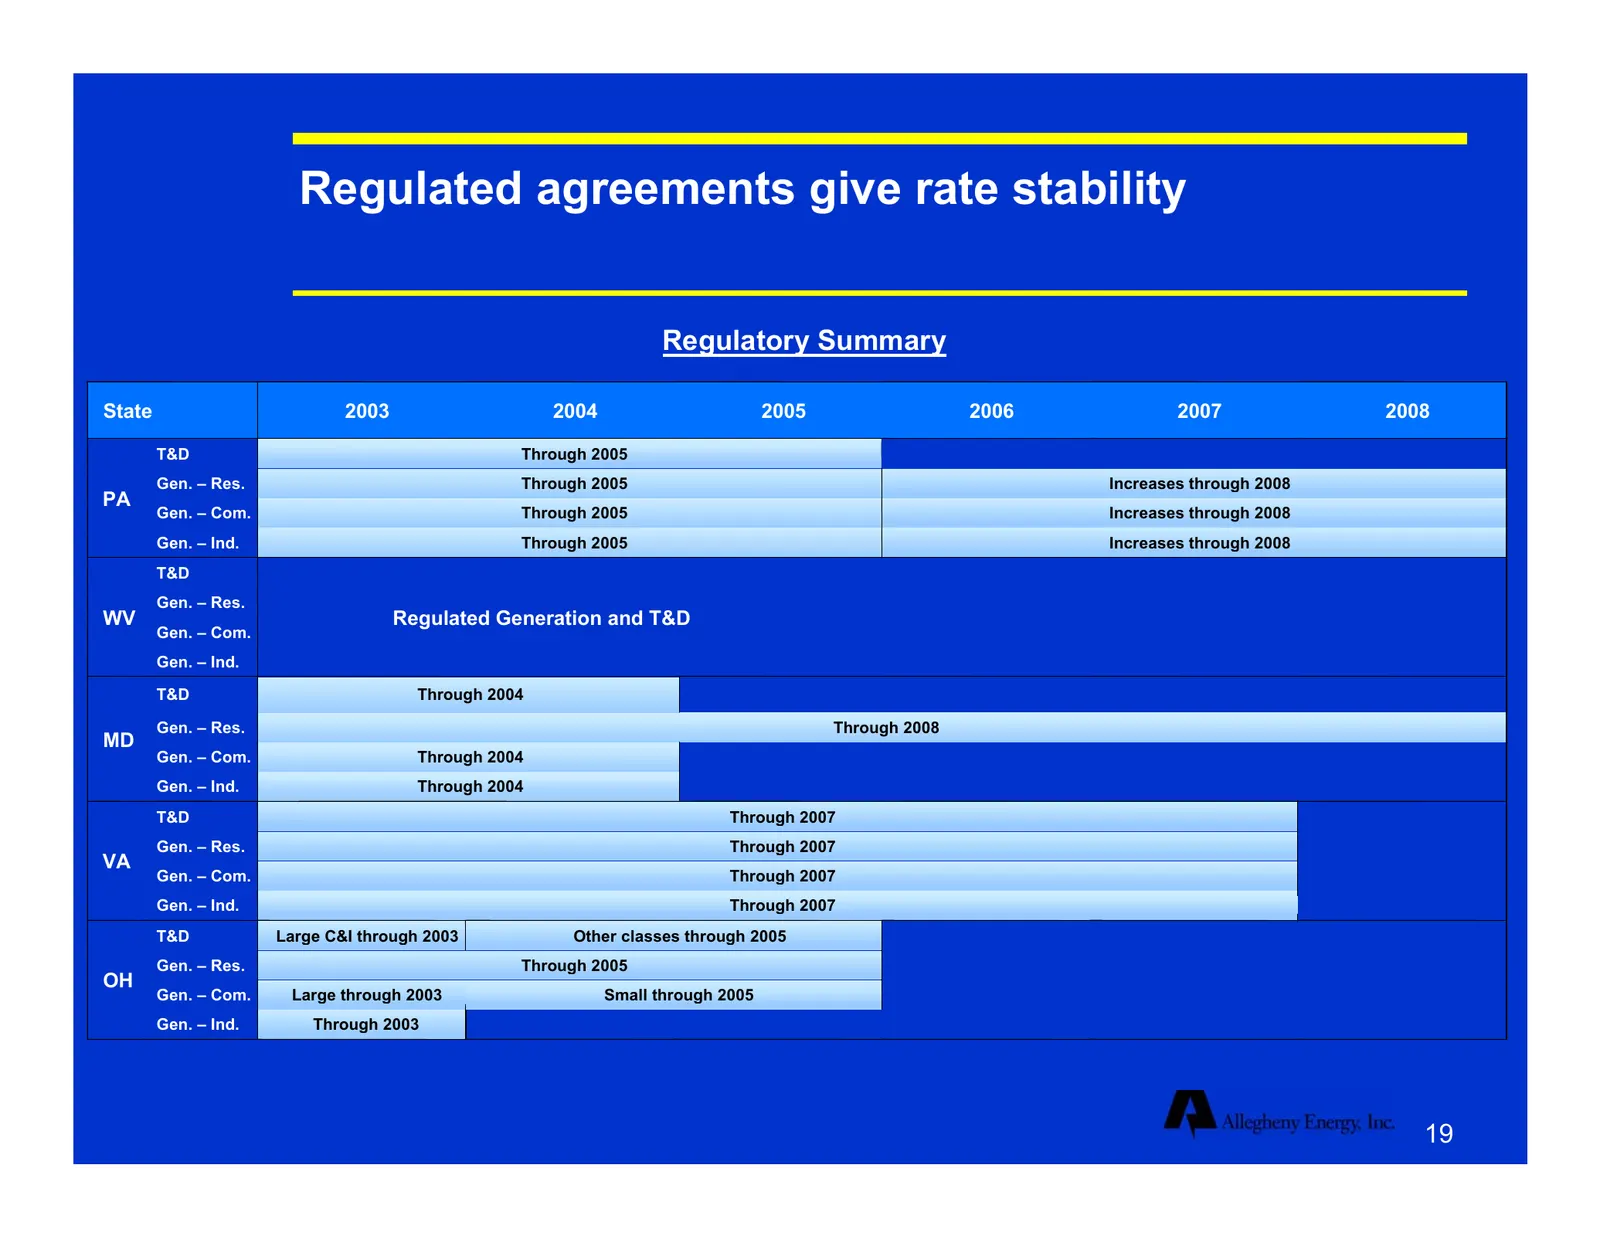
Slide 19: Regulated agreements give rate stability
Regulated agreements give rate stability Regulatory Summary State 2003 2004 2005 2006 2007 2008 T&D Through 2005 Gen. – Res. Through 2005 Increases through 2008 PA Gen. – Com. Through 2005 Increases through 2008 Gen. – Ind. Through 2005 Increases through 2008 T&D Gen. – Res. WV Regulated Generation
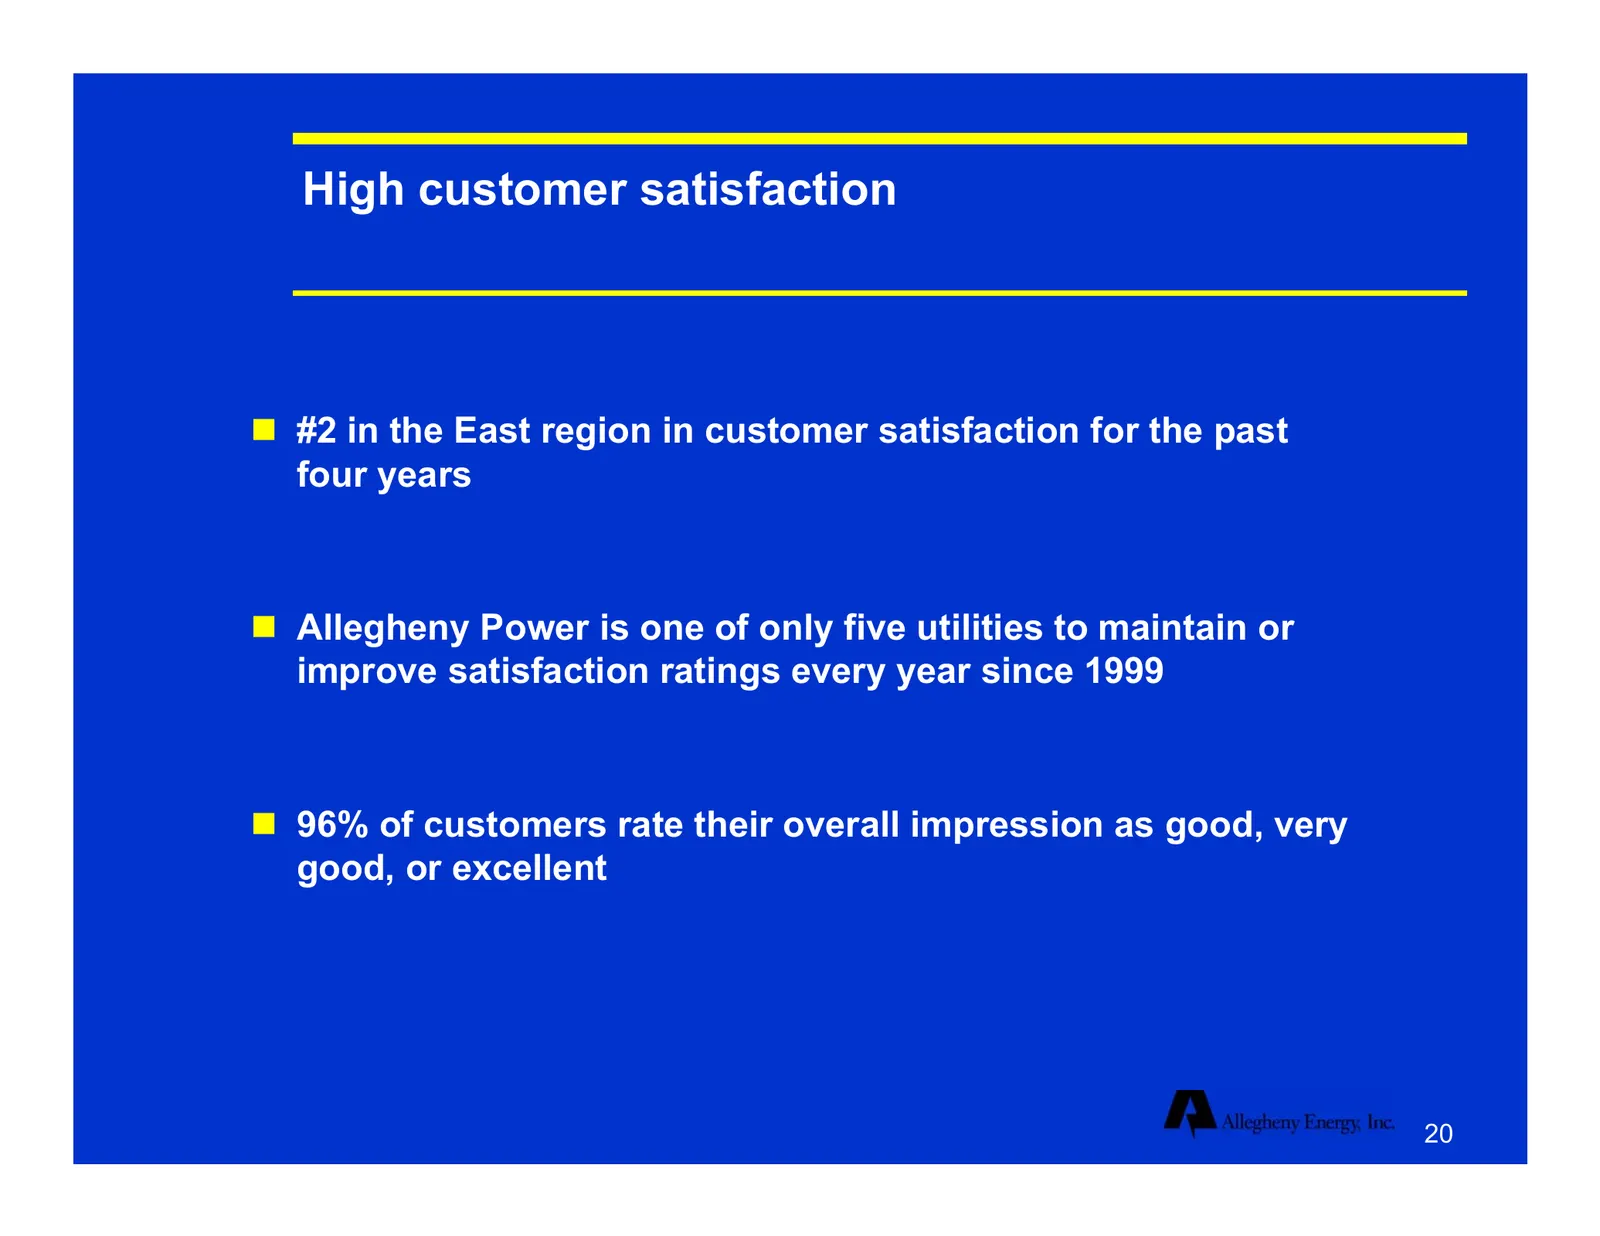
Slide 20: High customer satisfaction
High customer satisfaction #2 in the East region in customer satisfaction for the past four years Allegheny Power is one of only five utilities to maintain or improve satisfaction ratings every year since 1999 96% of customers rate their overall impression as good, very good, or excellent 20
Slide 21: Allegheny Power Summary
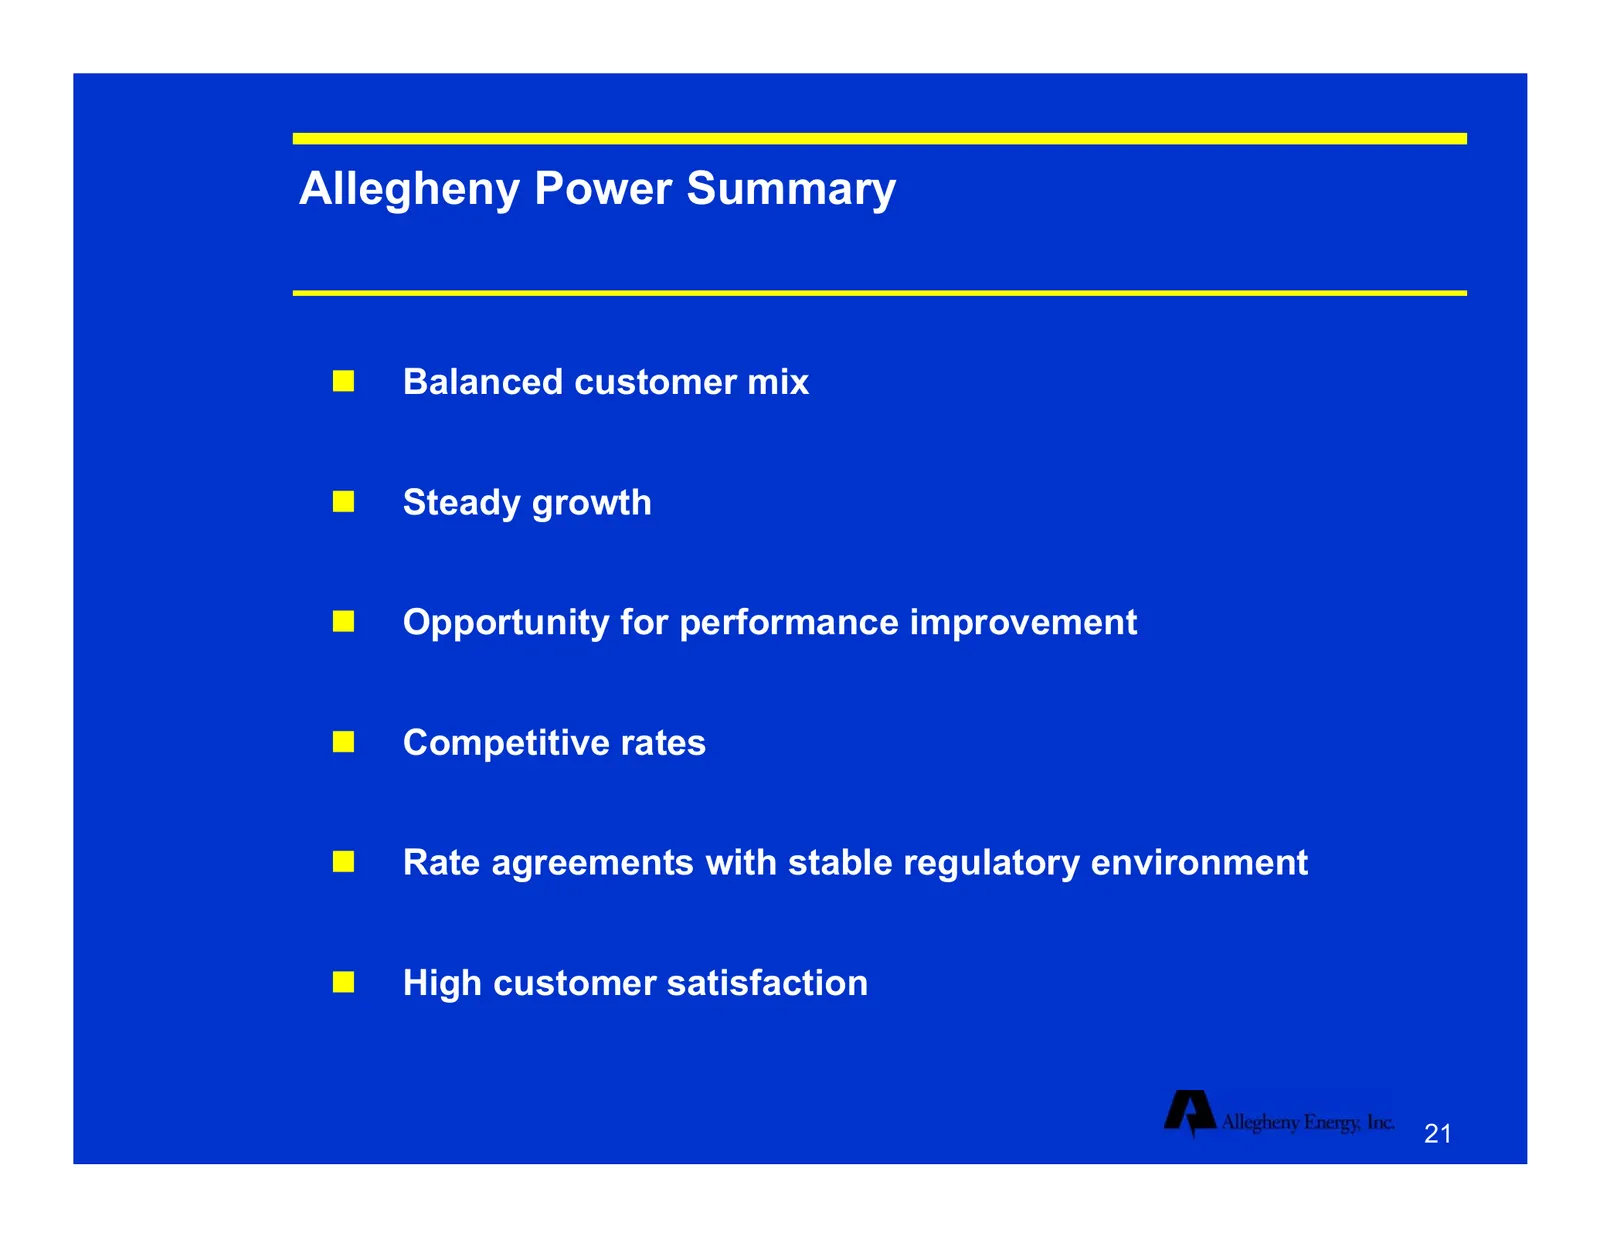
Allegheny Power Summary Balanced customer mix Steady growth Opportunity for performance improvement Competitive rates Rate agreements with stable regulatory environment High customer satisfaction 21
Slide 22: Core generation and delivery business
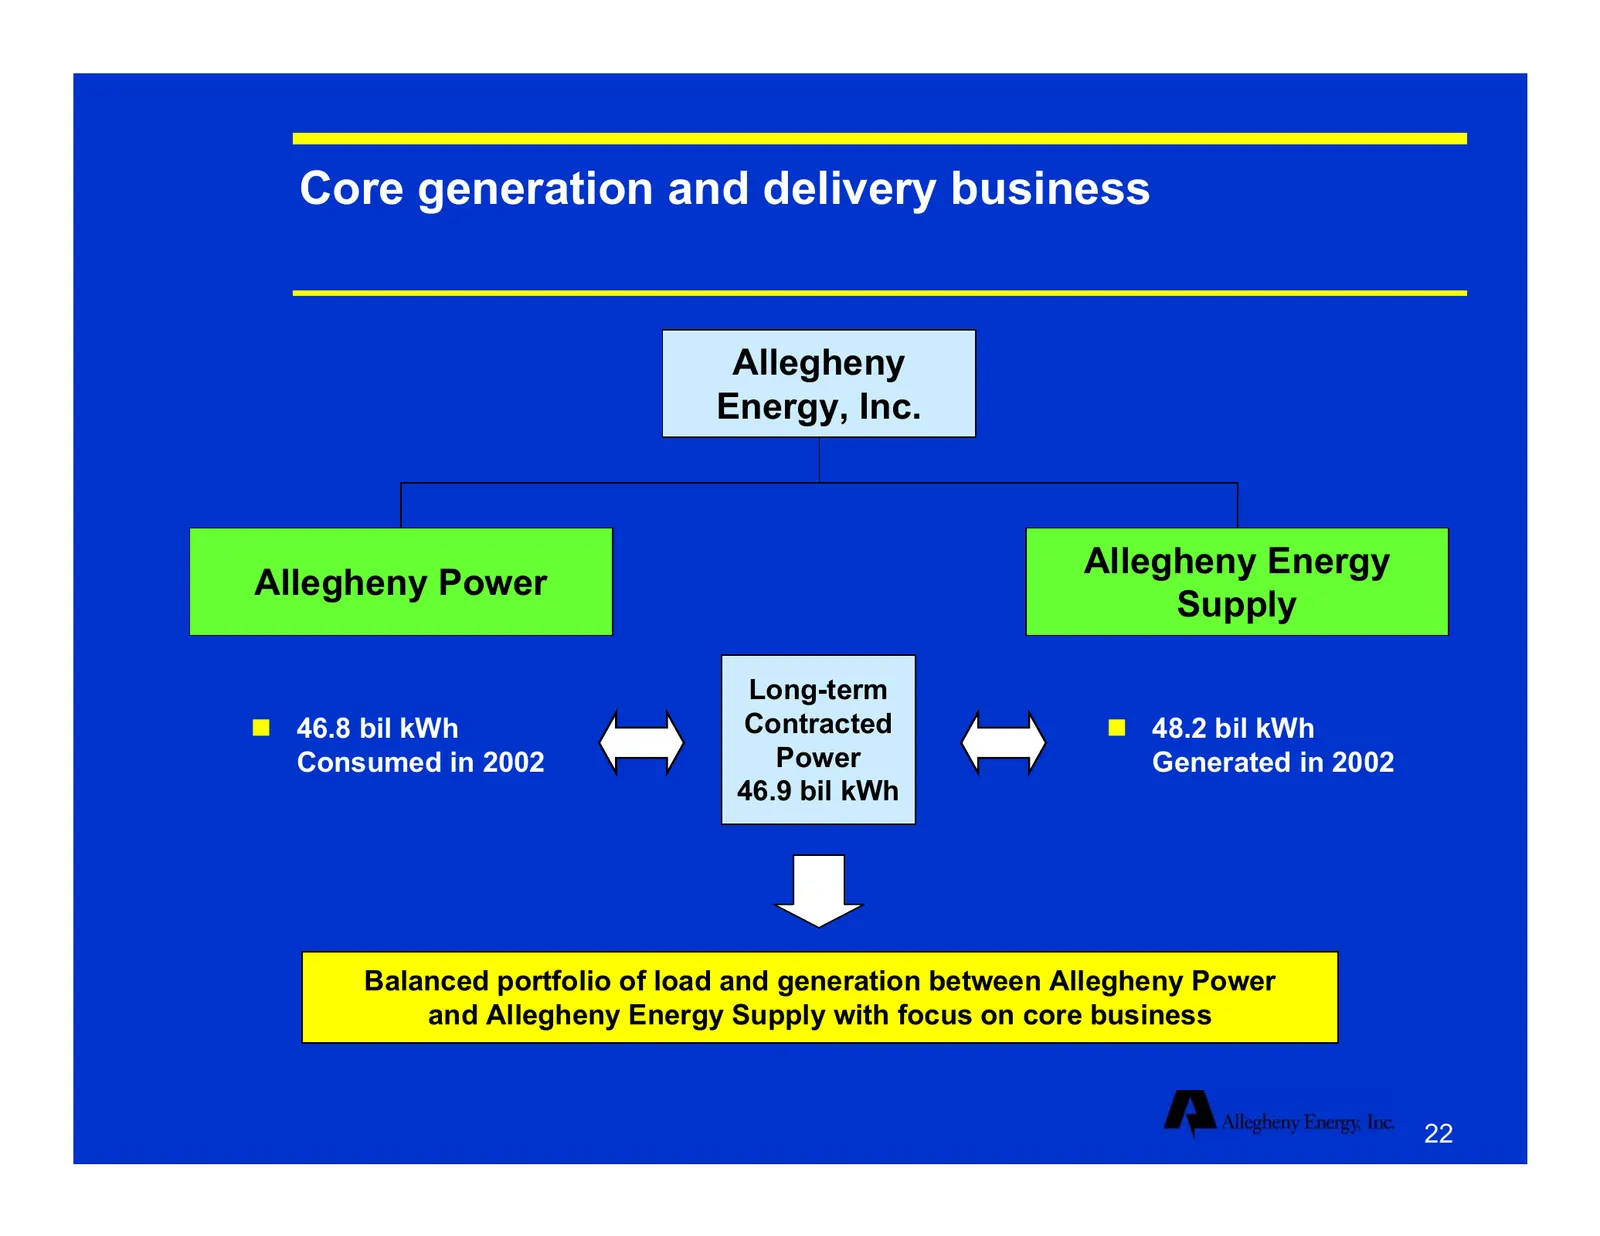
Core generation and delivery business Allegheny Energy, Inc. Allegheny Energy Allegheny Power Supply Long-term 46.8 bil kWh Contracted 48.2 bil kWh Consumed in 2002 Power Generated in 2002 46.9 bil kWh Balanced portfolio of load and generation between Allegheny Power and Allegheny Energy Supply
Slide 23: Allegheny Energy Supply's fleet is primarily composed of base-load coal generation
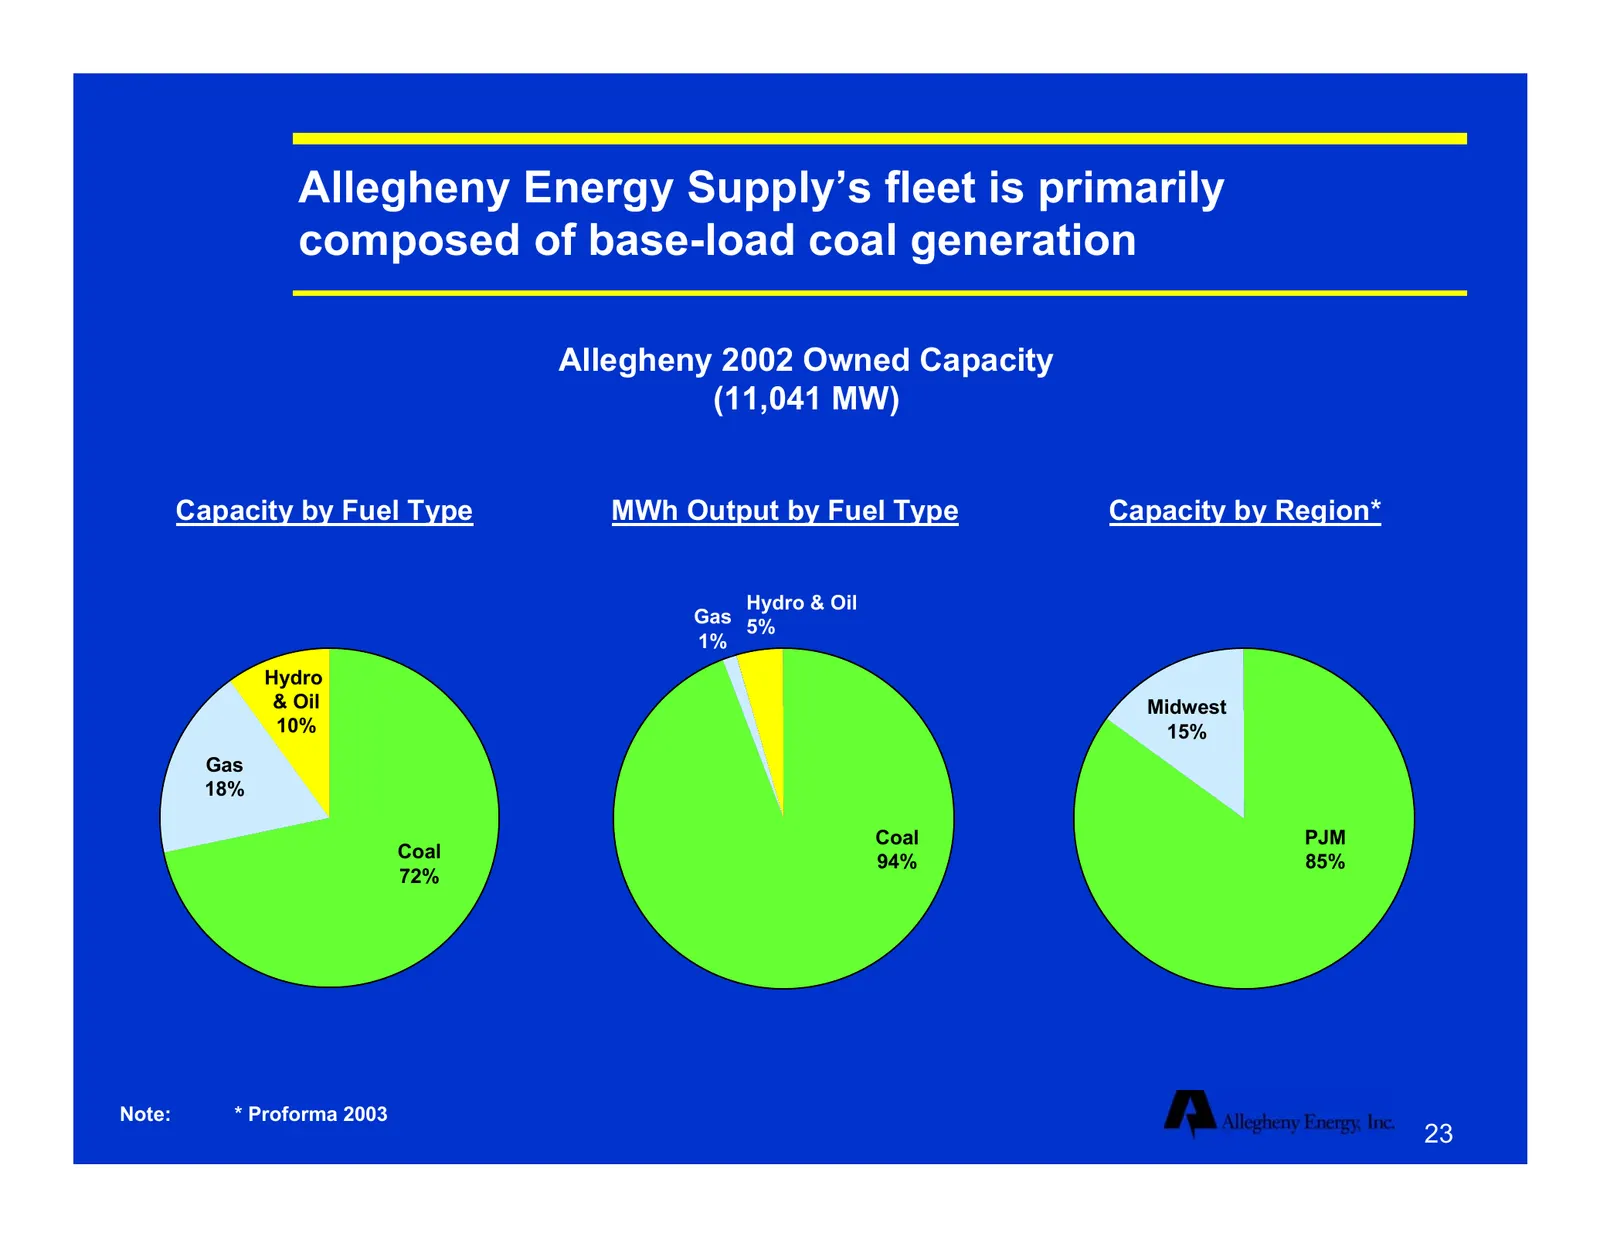
Allegheny Energy Supply’s fleet is primarily composed of base-load coal generation Allegheny 2002 Owned Capacity (11,041 MW) Capacity by Fuel Type MWh Output by Fuel Type Capacity by Region* Hydro & Oil Gas 5% 1% Hydro & Oil Midwest 10% 15% Gas 18% Coal PJM Coal 94% 85% 72% Note: * Proforma 2003 23
Slide 24: Asset base is cost advantaged in the PJM region
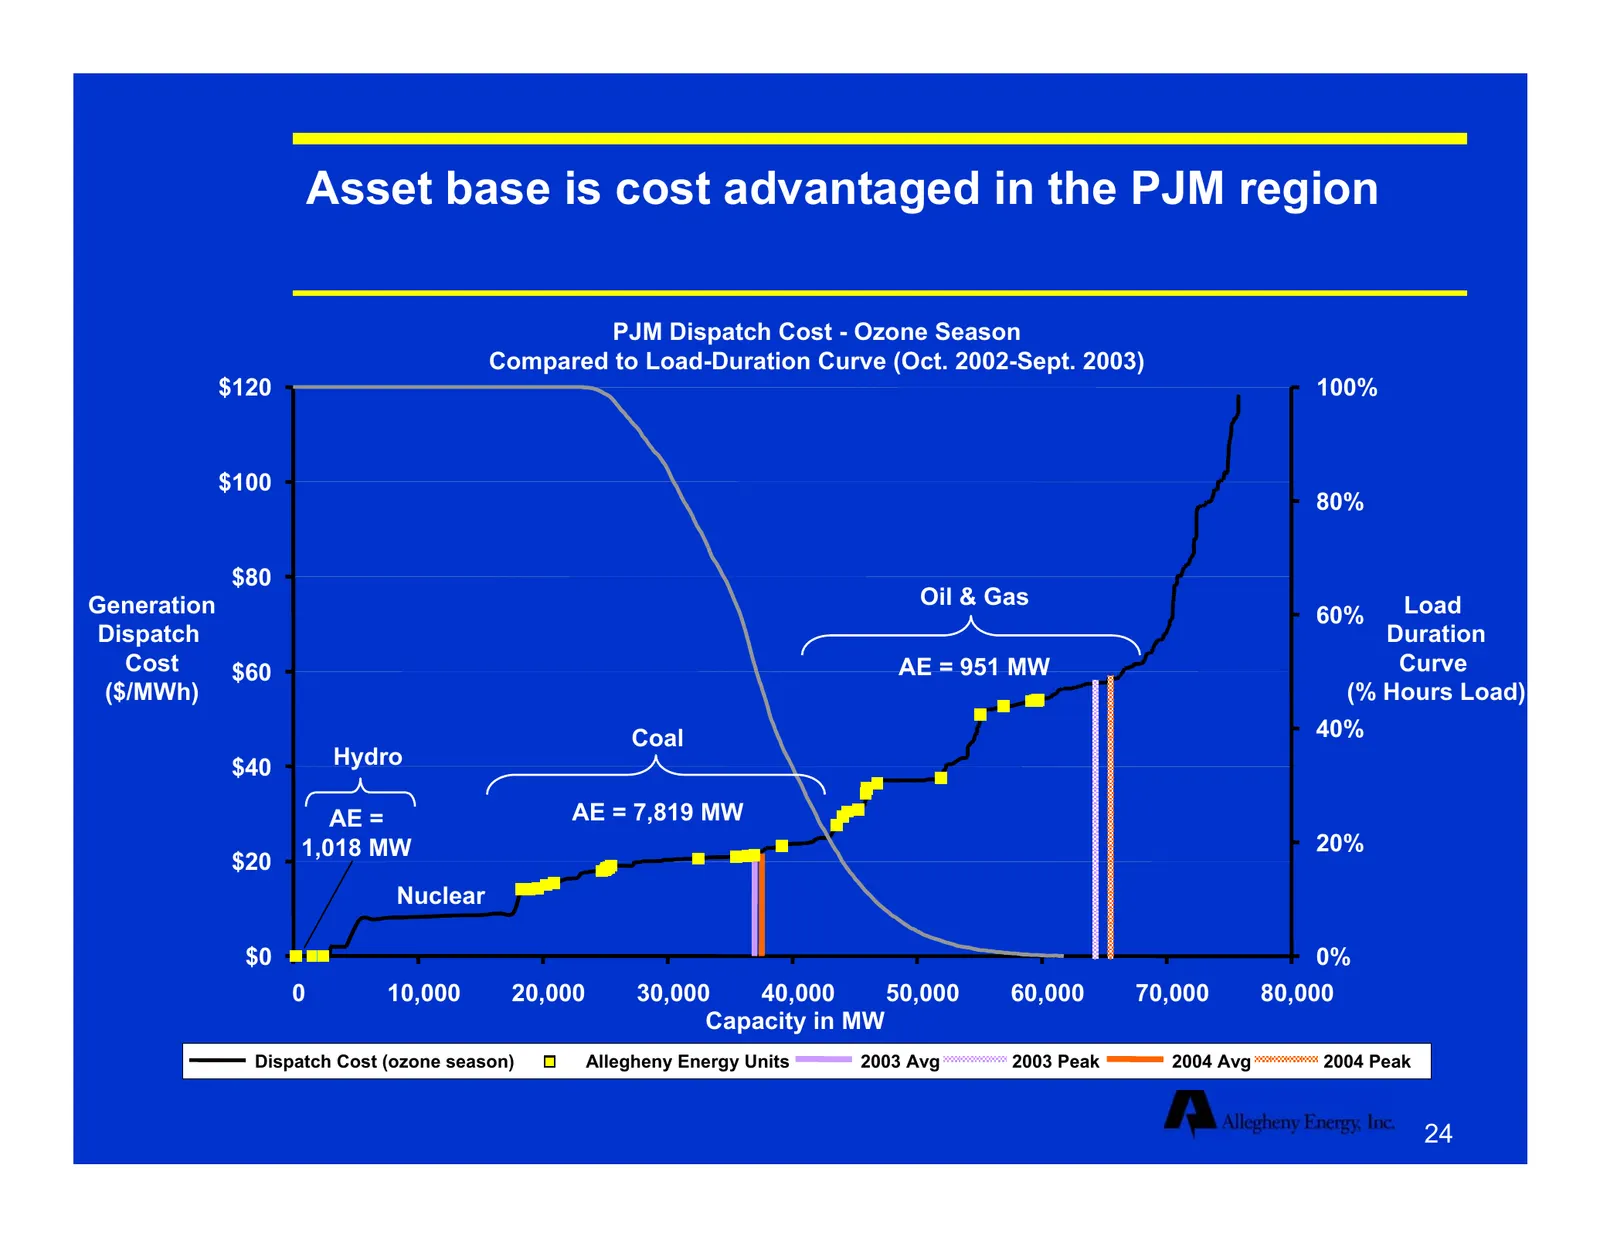
Asset base is cost advantaged in the PJM region PJM Dispatch Cost - Ozone Season Compared to Load-Duration Curve (Oct. 2002-Sept. 2003) $120 100% $100 80% $80 Generation Oil & Gas Load 60% Dispatch Duration Cost $60 AE = 951 MW Curve ($/MWh) (% Hours Load) Coal 40% $40 Hydro AE = AE = 7,819 MW 1,018
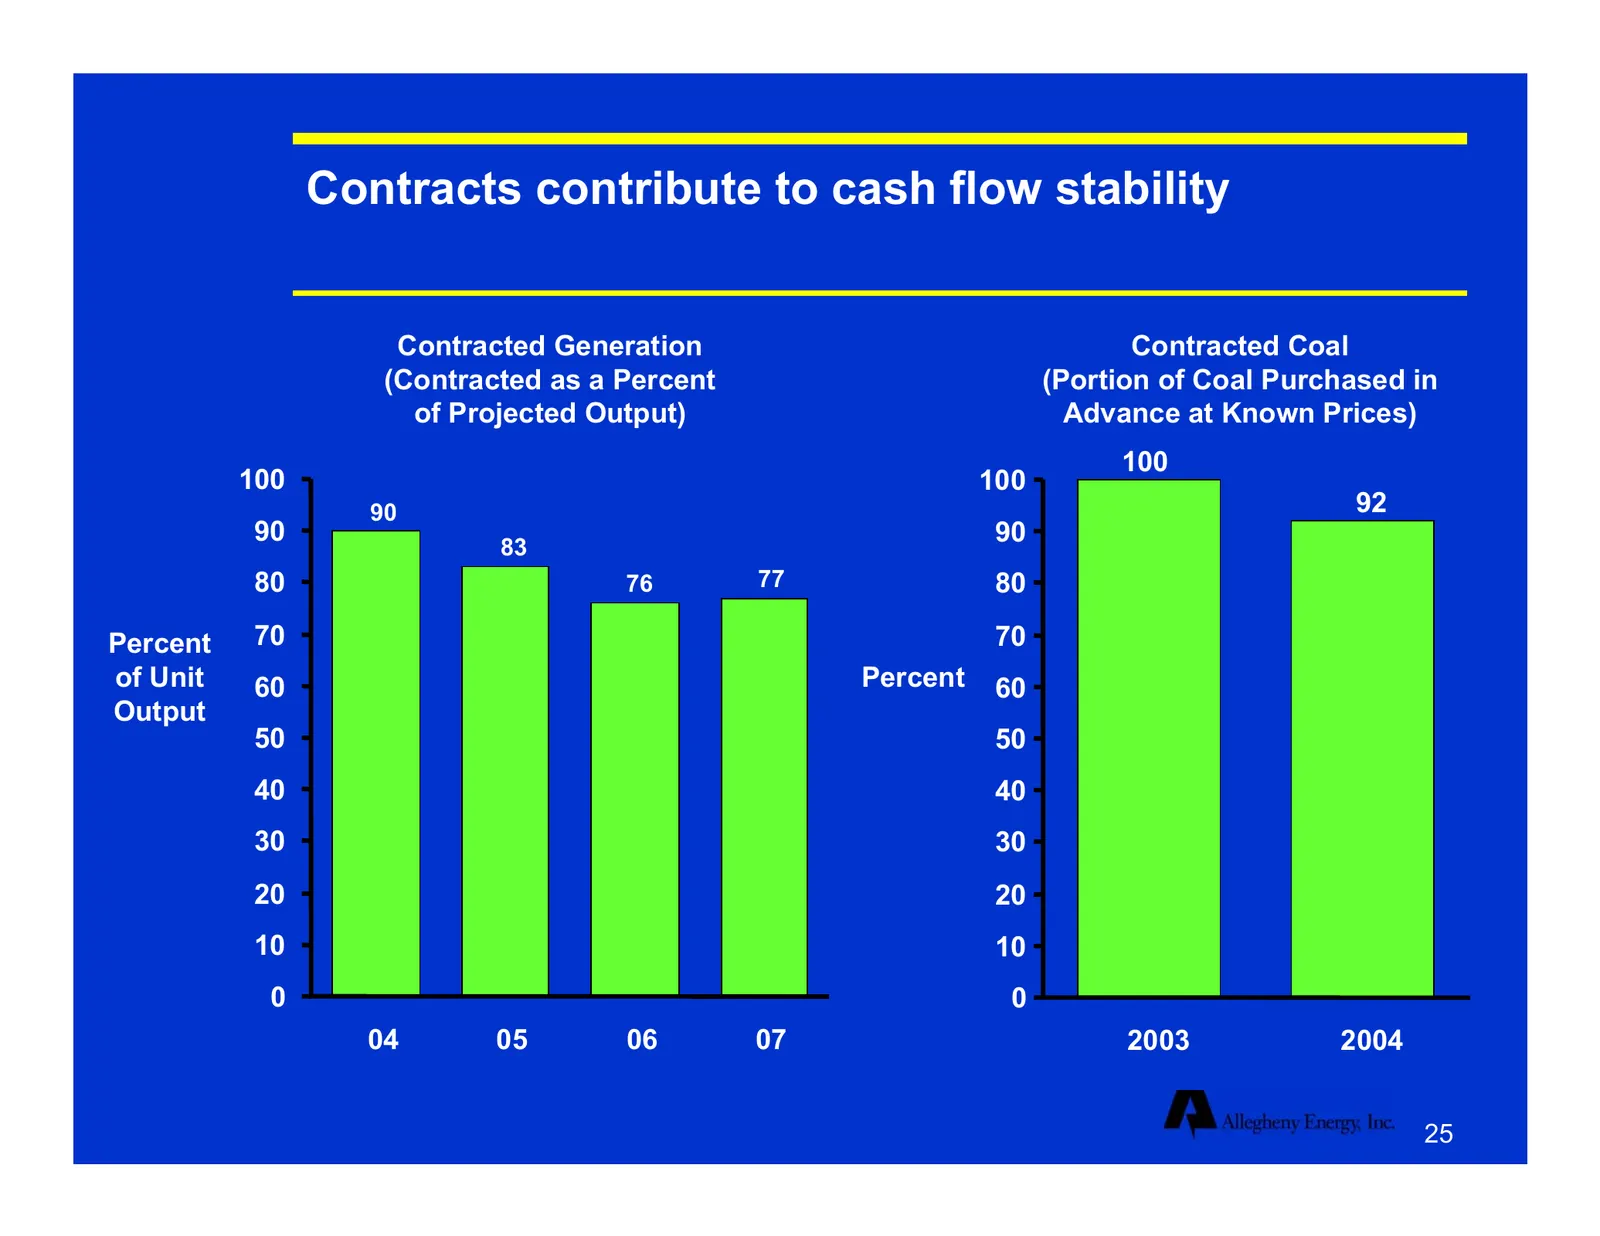
Slide 25: Contracts contribute to cash flow stability
Contracts contribute to cash flow stability Contracted Generation Contracted Coal (Contracted as a Percent (Portion of Coal Purchased in of Projected Output) Advance at Known Prices) 100 100 100 90 92 90 90 83 80 76 77 80 Percent 70 70 of Unit 60 Percent 60 Output 50 50 40 40 30 30 20 20 10 10 0 0 0
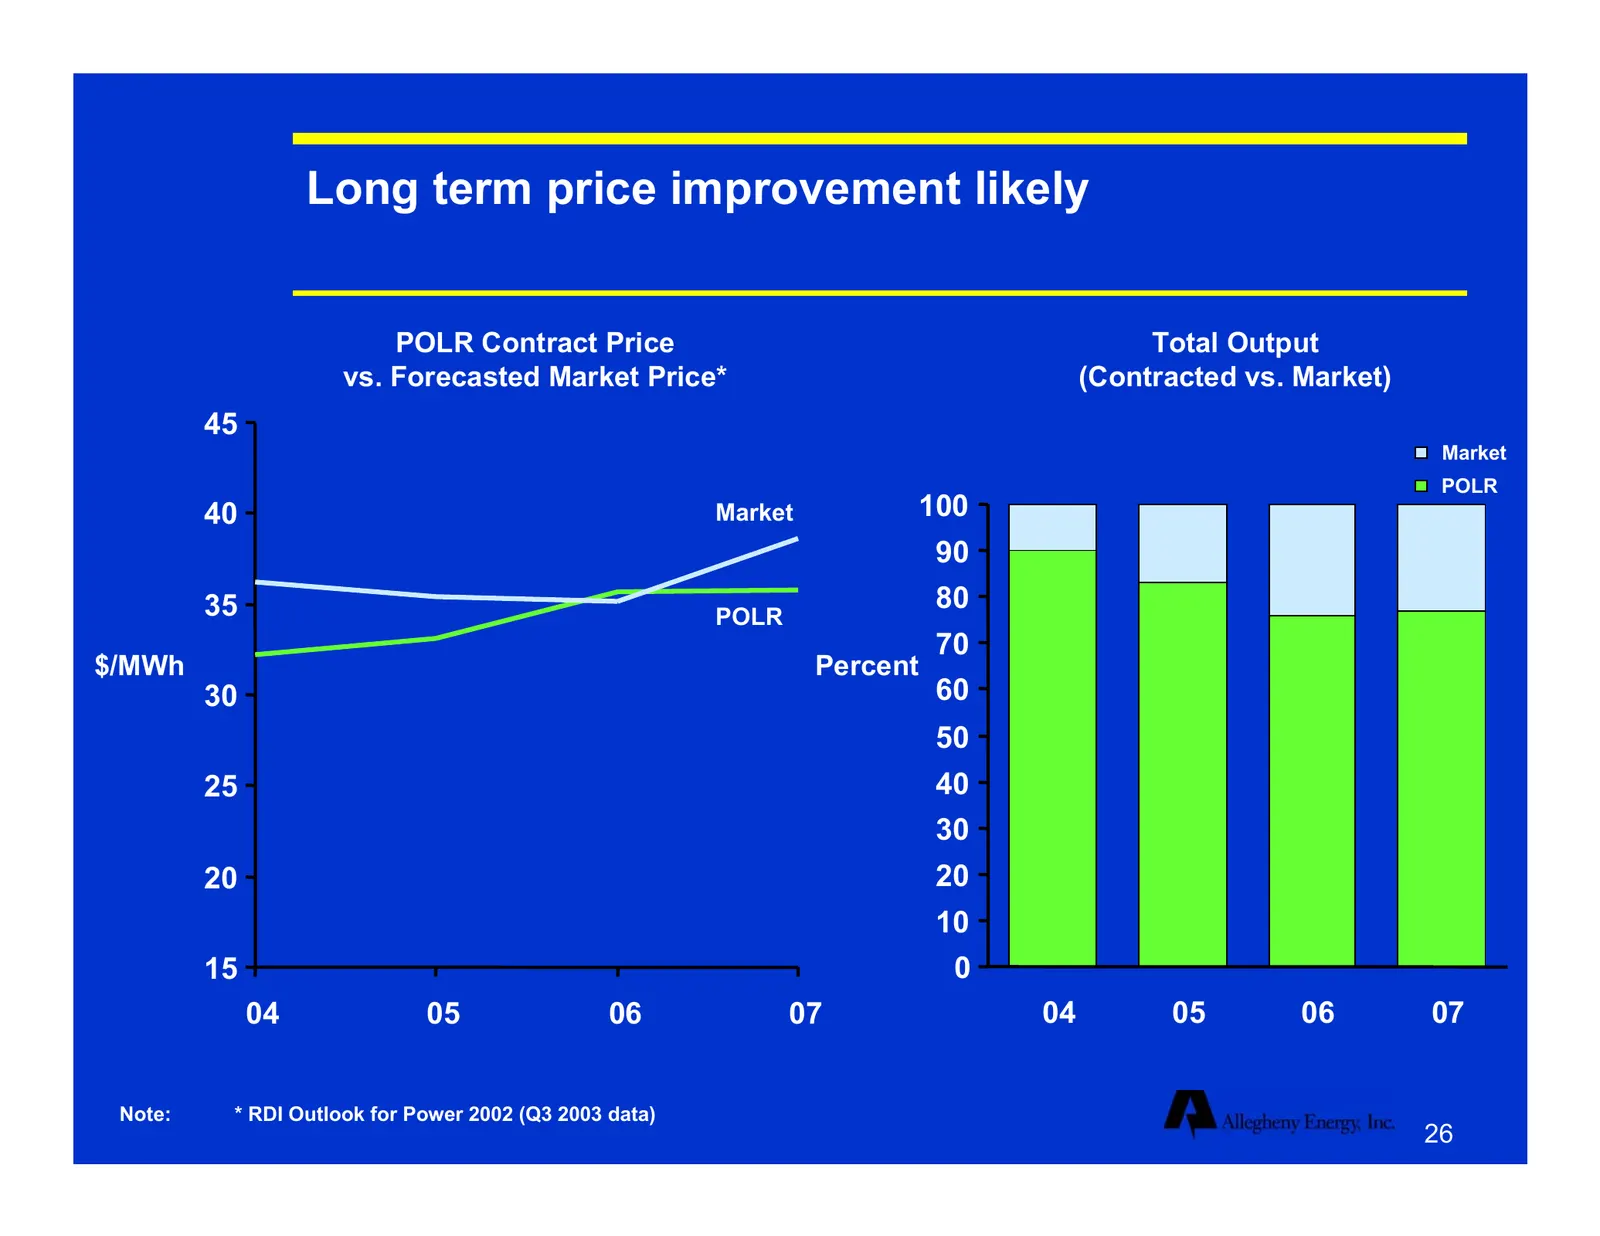
Slide 26: Long term price improvement likely
Long term price improvement likely POLR Contract Price Total Output vs. Forecasted Market Price* (Contracted vs. Market) 45 Market POLR 40 Market 100 90 35 80 POLR 70 $/MWh Percent 30 60 50 25 40 30 20 20 10 15 0 04 05 06 07 04 05 06 07 Note: * RDI Outlook for Power 2002 (Q3 2003 data) 26
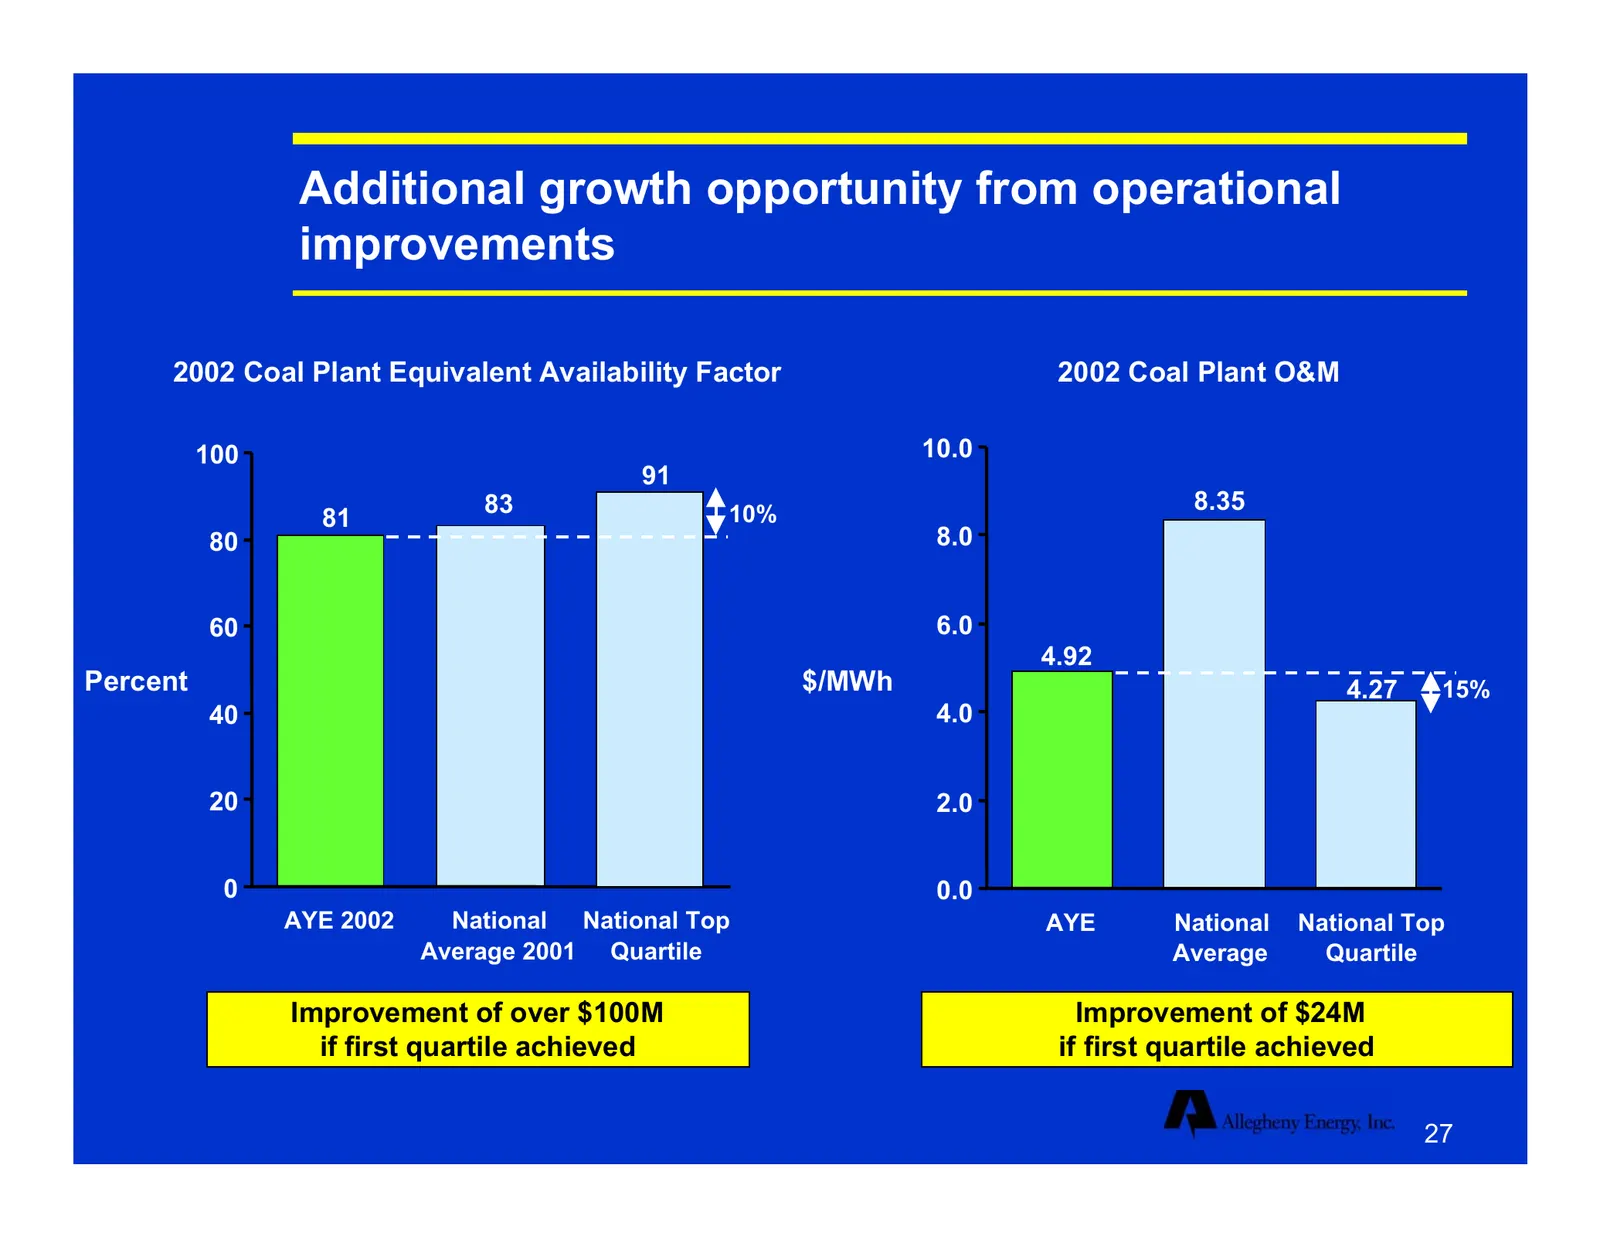
Slide 27: Additional growth opportunity from operational improvements
Additional growth opportunity from operational improvements 2002 Coal Plant Equivalent Availability Factor 2002 Coal Plant O&M 100 10.0 91 83 10% 8.35 81 80 8.0 60 6.0 4.92 Percent $/MWh 4.27 15% 40 4.0 20 2.0 0 0.0 AYE 2002 National National Top AYE National National Top Average 2001 Quartile Avera
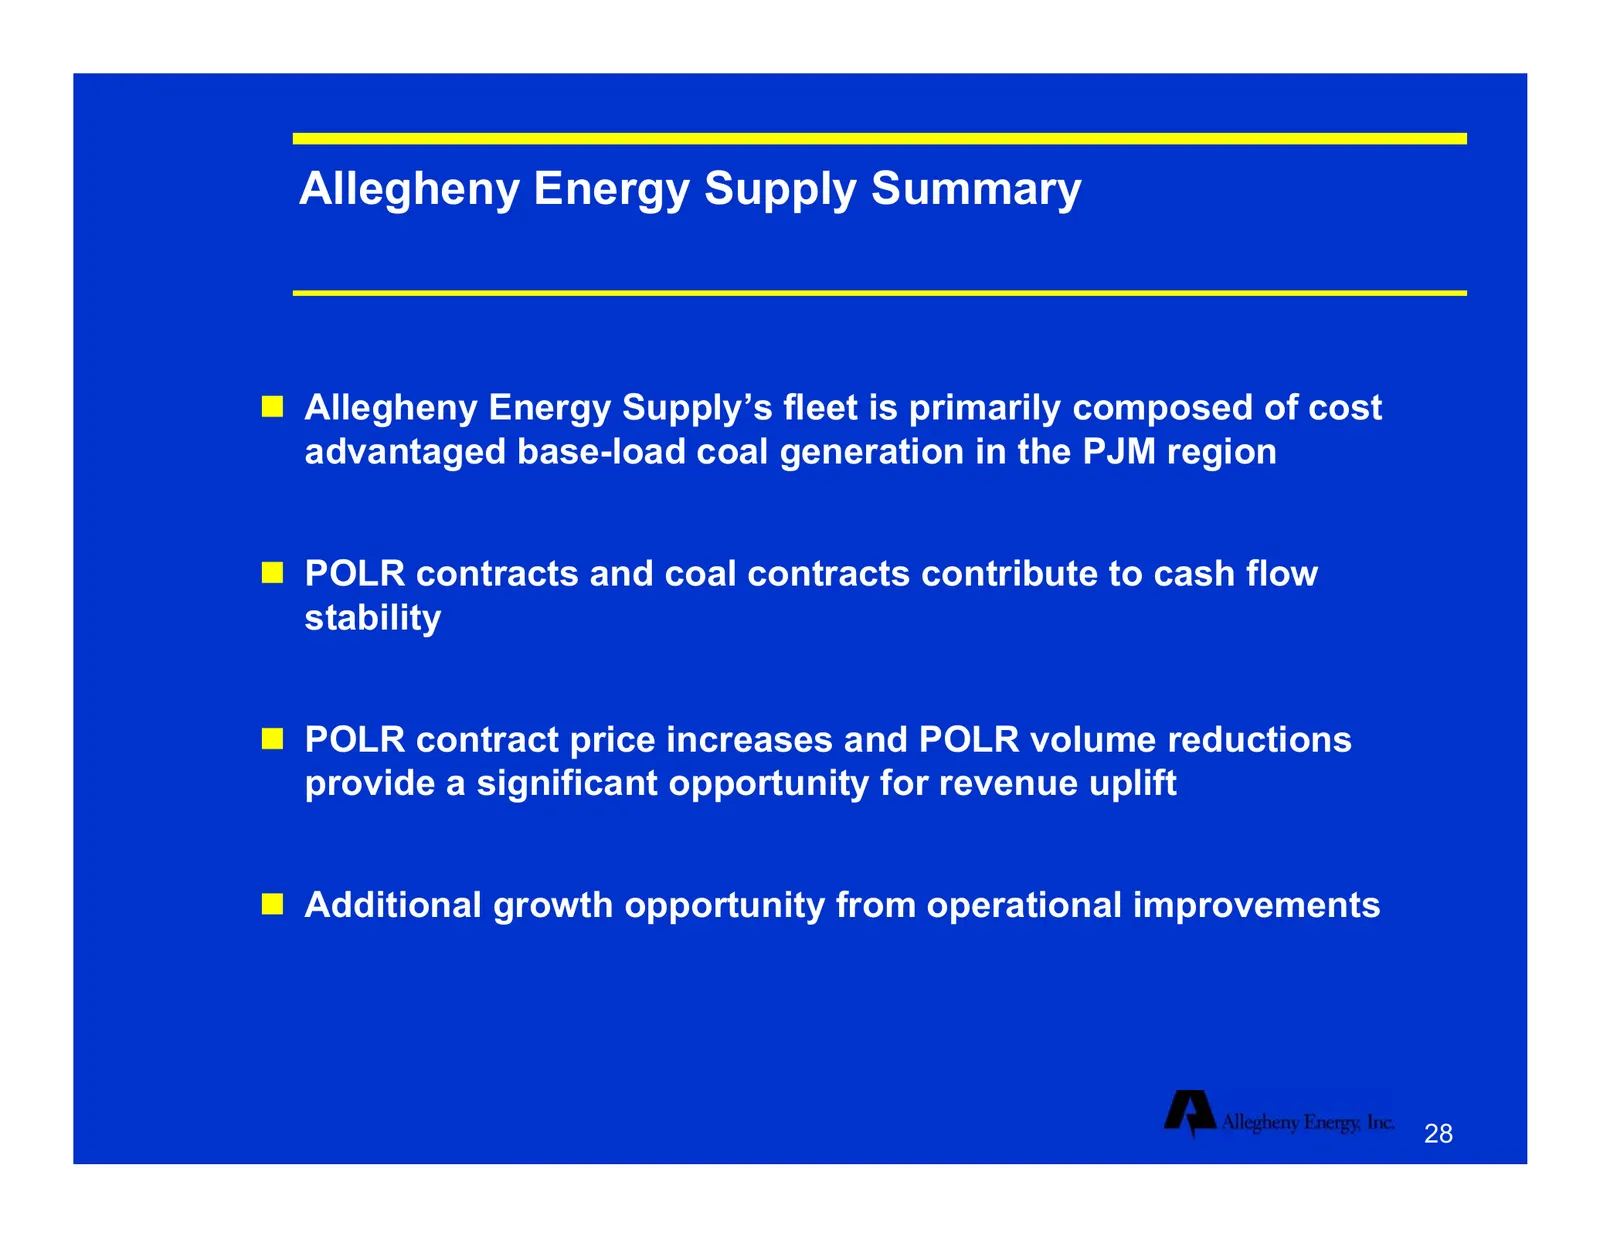
Slide 28: Allegheny Energy Supply Summary
Allegheny Energy Supply Summary Allegheny Energy Supply’s fleet is primarily composed of cost advantaged base-load coal generation in the PJM region POLR contracts and coal contracts contribute to cash flow stability POLR contract price increases and POLR volume reductions provide a significan
Slide 29: Agenda
Agenda Early Progress Business Foundation Financial Update Conclusions 29
Slide 30: 2002 was a tough year financially…
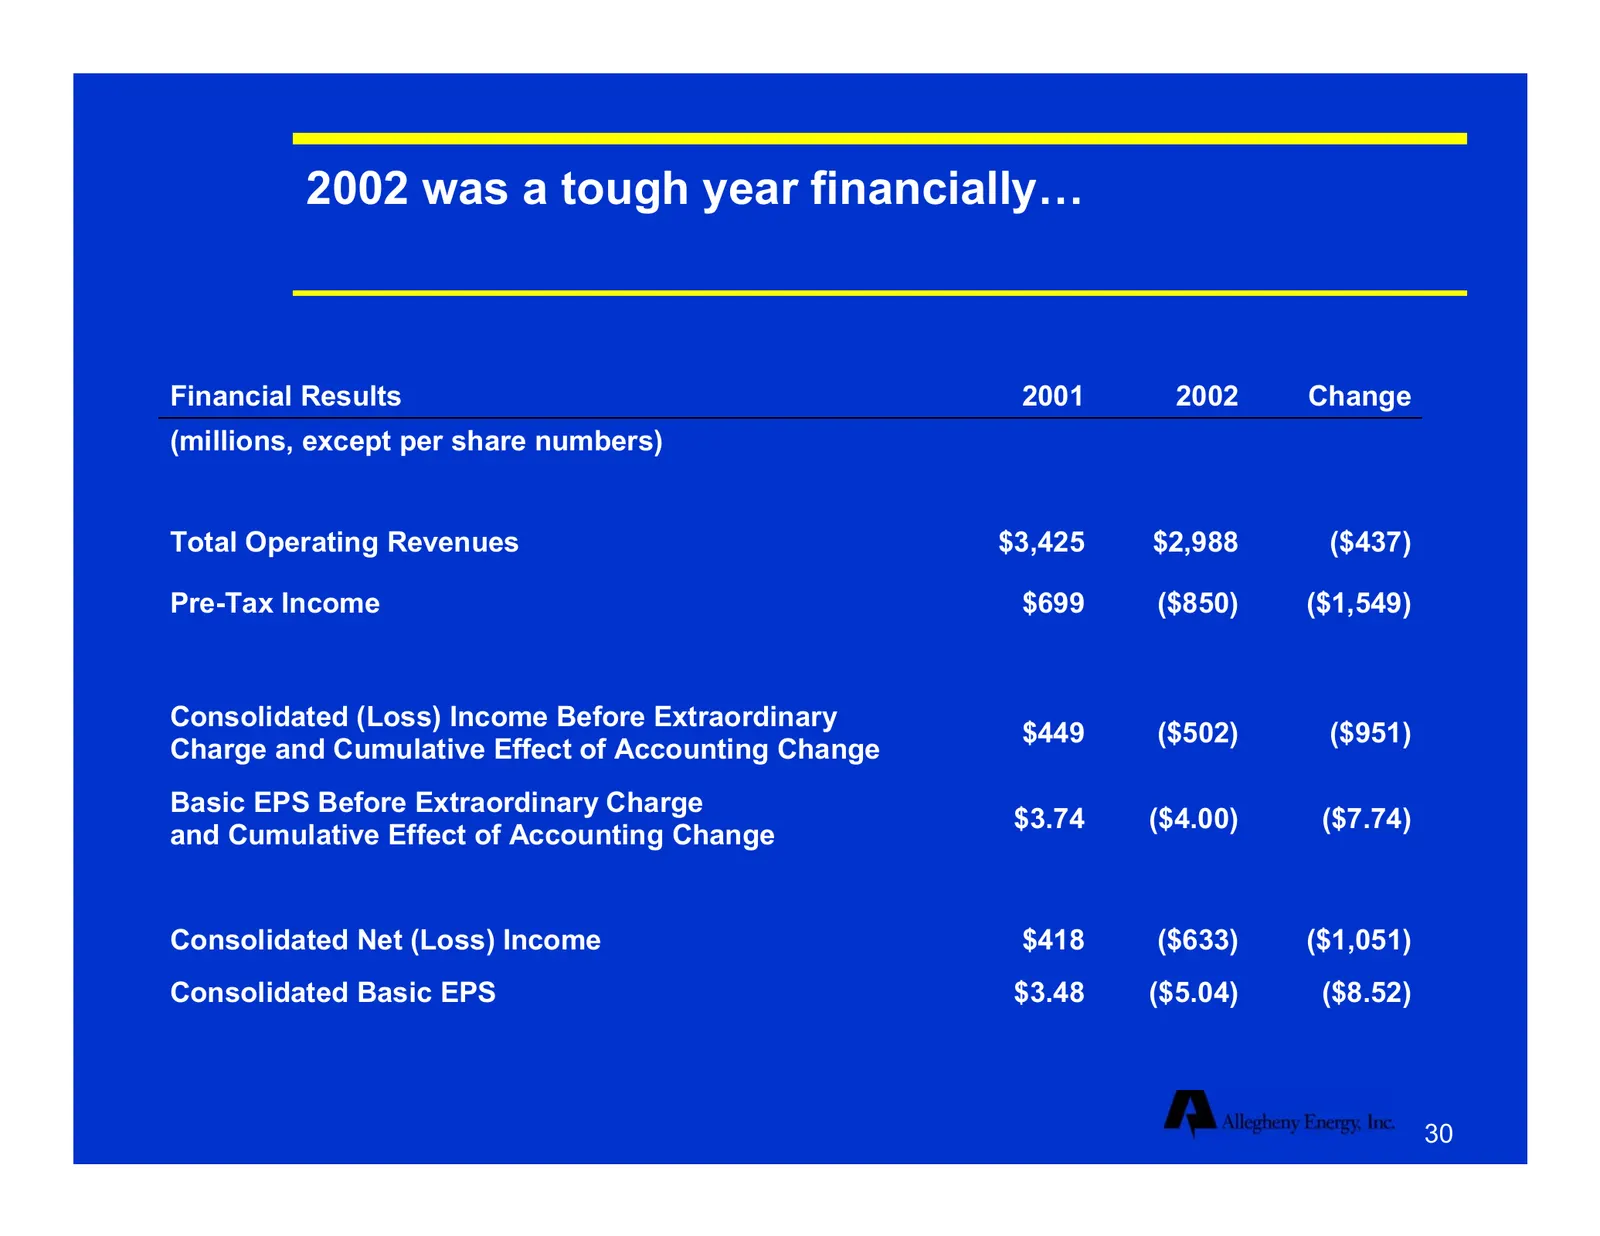
2002 was a tough year financially… Financial Results 2001 2002 Change (millions, except per share numbers) Total Operating Revenues $3,425 $2,988 ($437) Pre-Tax Income $699 ($850) ($1,549) Consolidated (Loss) Income Before Extraordinary $449 ($502) ($951) Charge and Cumulative Effect of Accounting C
Slide 31: Credit rating, internal controls and financial reporting suffered
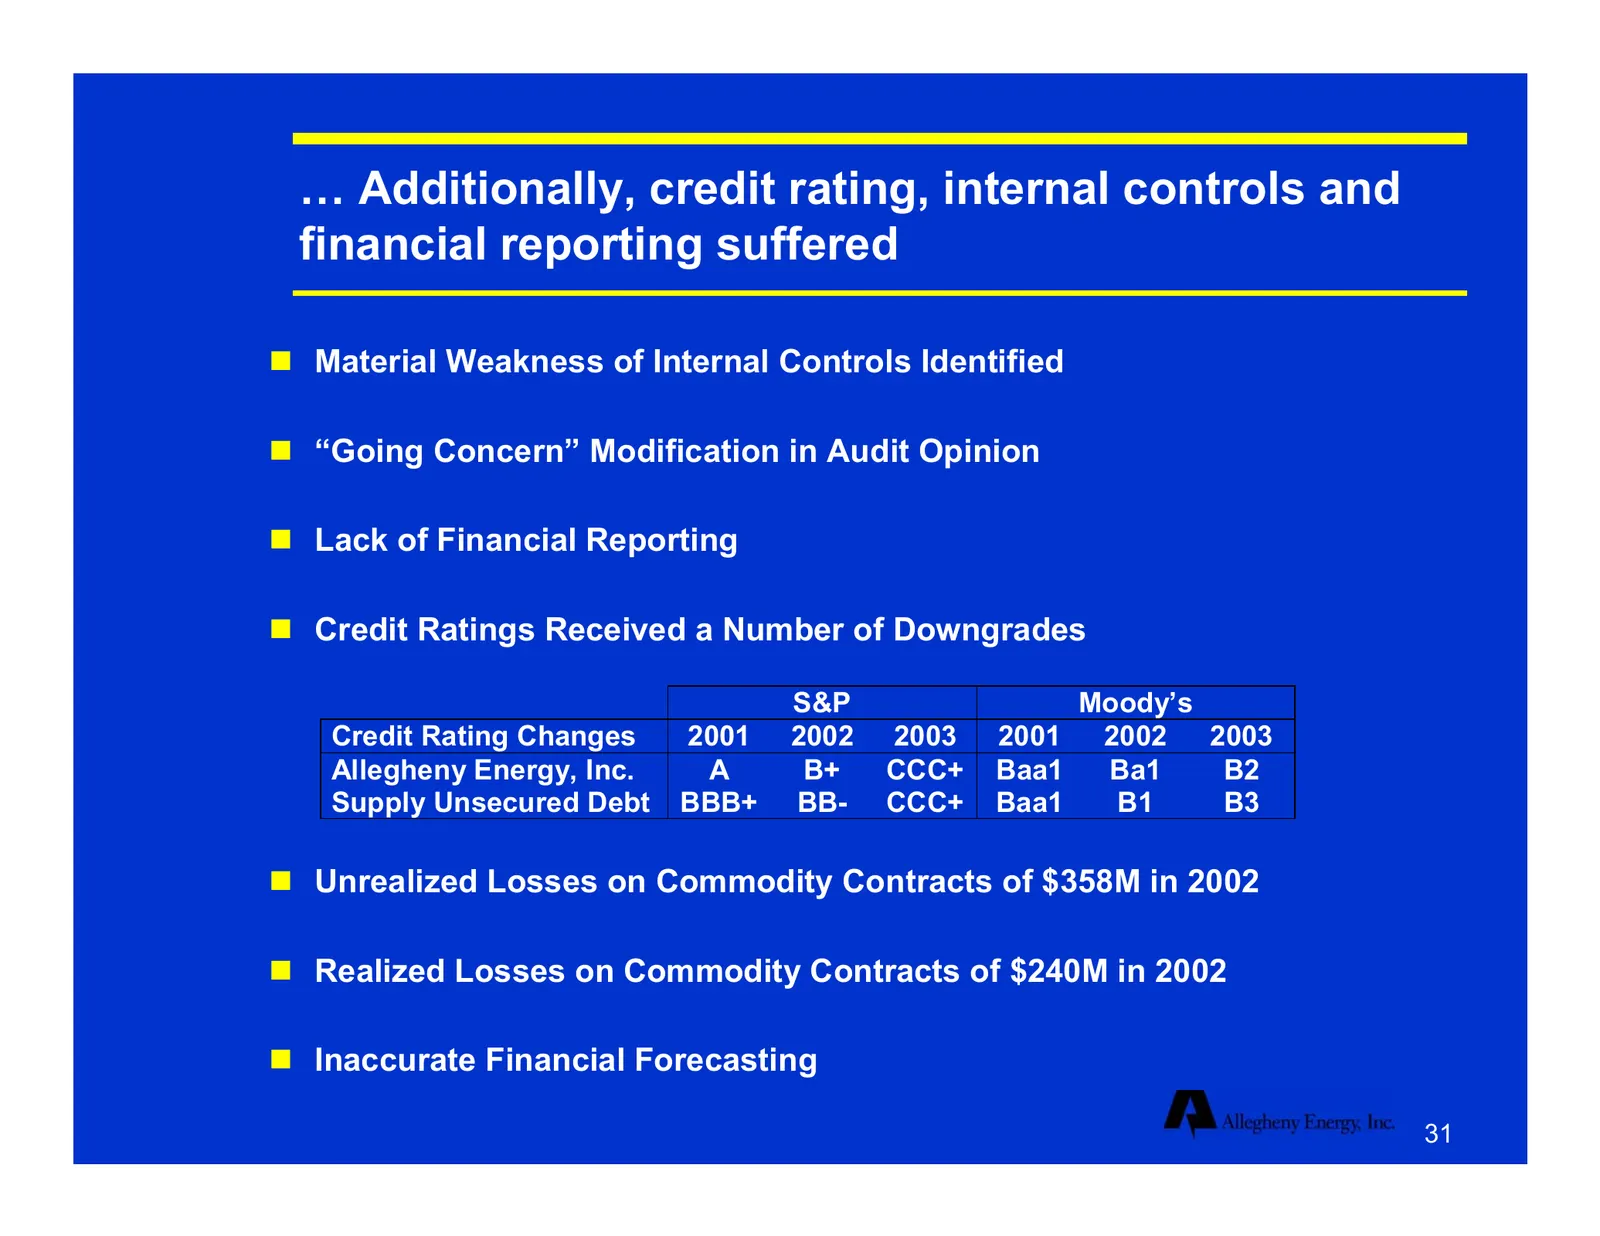
… Additionally, credit rating, internal controls and financial reporting suffered Material Weakness of Internal Controls Identified “Going Concern” Modification in Audit Opinion Lack of Financial Reporting Credit Ratings Received a Number of Downgrades S&P Moody’s Credit Rating Changes 2001
Slide 32: Management is actively addressing the issues
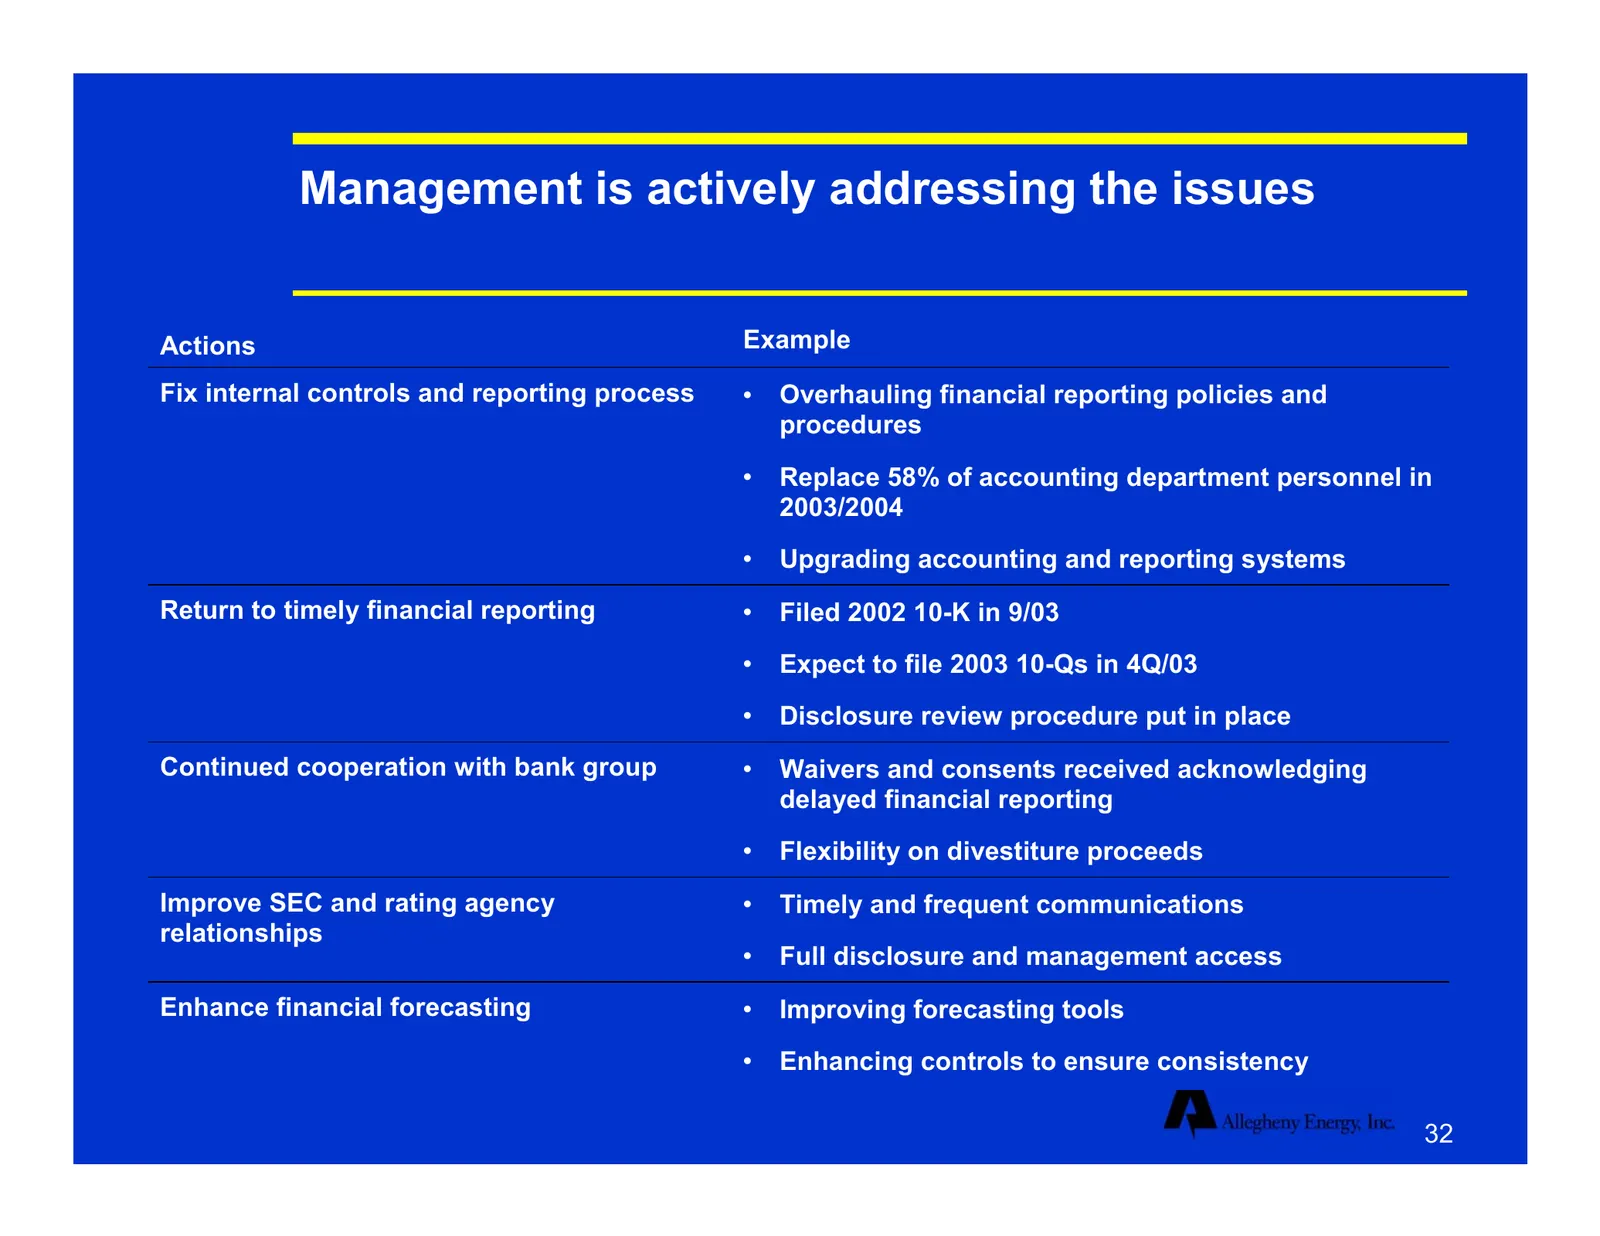
Management is actively addressing the issues Actions Example Fix internal controls and reporting process • Overhauling financial reporting policies and procedures • Replace 58% of accounting department personnel in 2003/2004 • Upgrading accounting and reporting systems Return to timely financial rep
Slide 33: Early progress has improved liquidity… but significant debt matures in 2004 and 2005
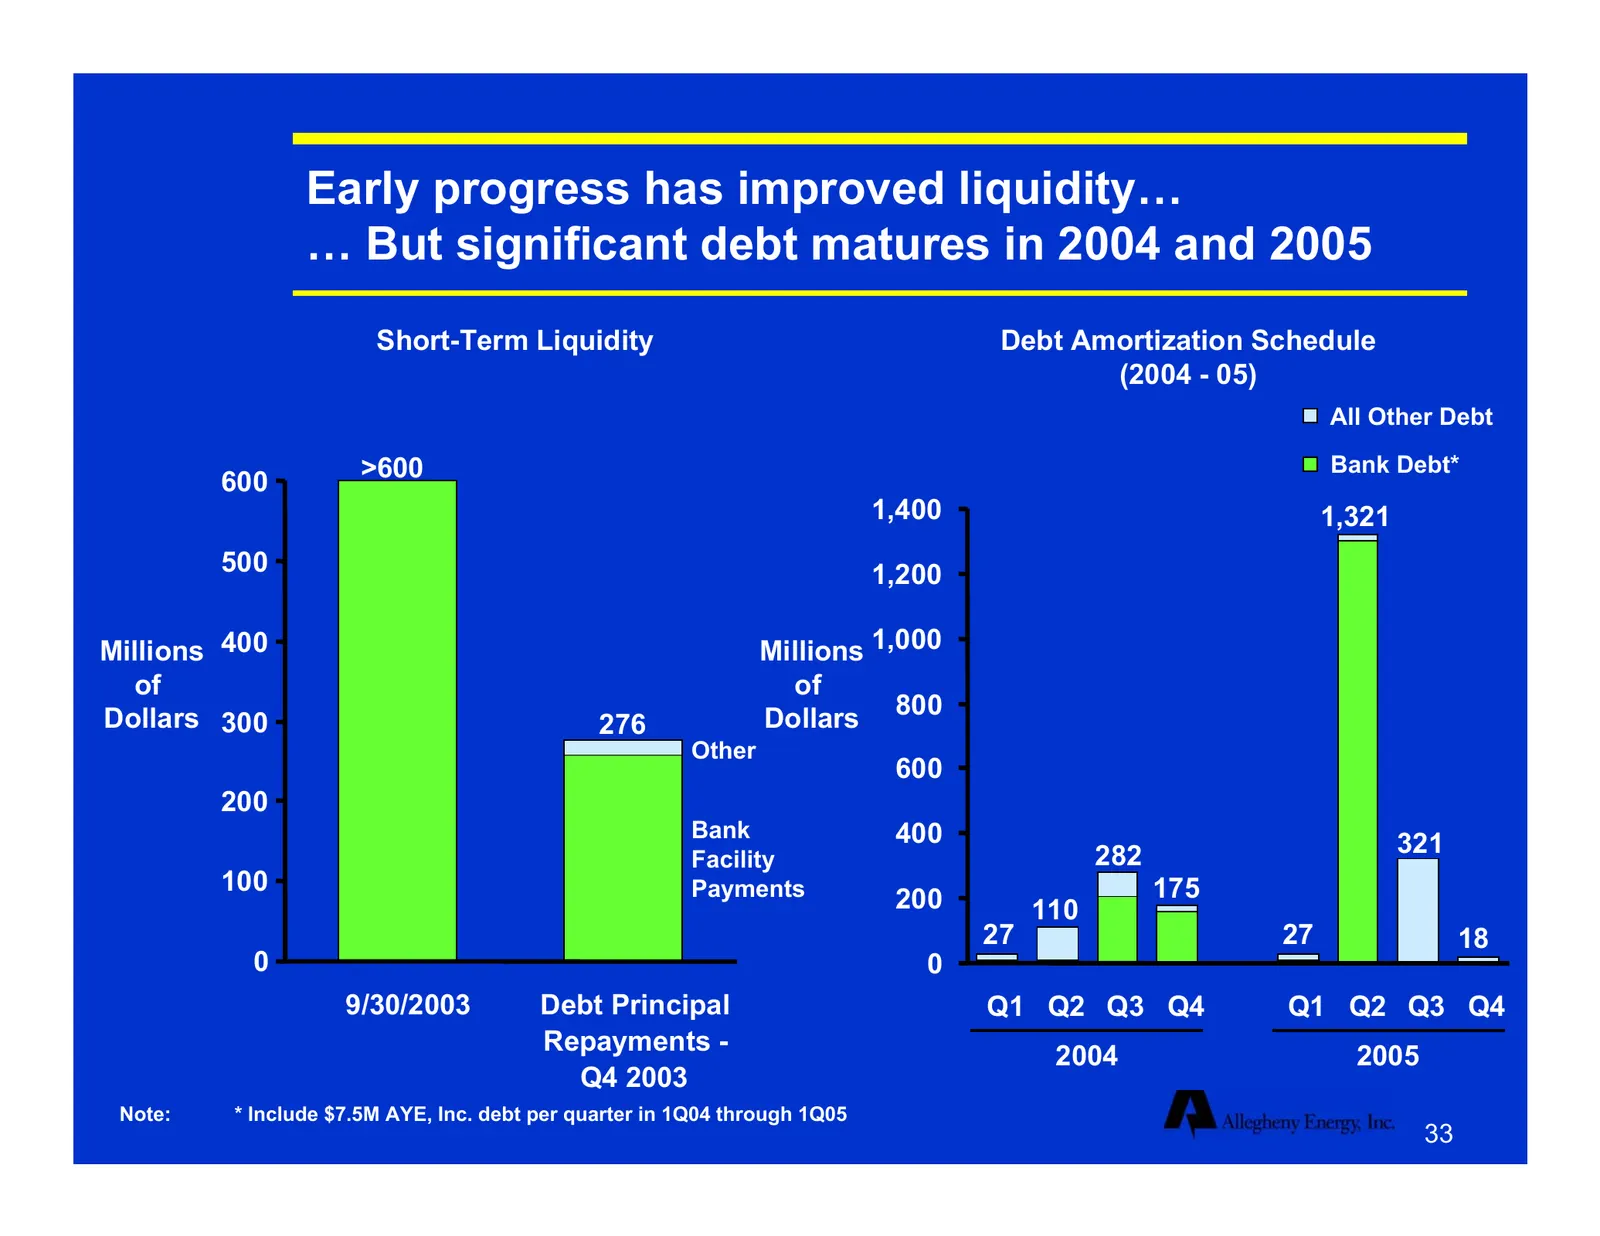
Early progress has improved liquidity… … But significant debt matures in 2004 and 2005 Short-Term Liquidity Debt Amortization Schedule (2004 - 05) All Other Debt >600 Bank Debt* 600 1,400 1,321 500 1,200 Millions 400 Millions 1,000 of of Dollars 300 276 Dollars 800 Other 600 200 Bank 400 282 321 Fac
Slide 34: Short-term financial plan in place to address maturities, leverage and operating cash
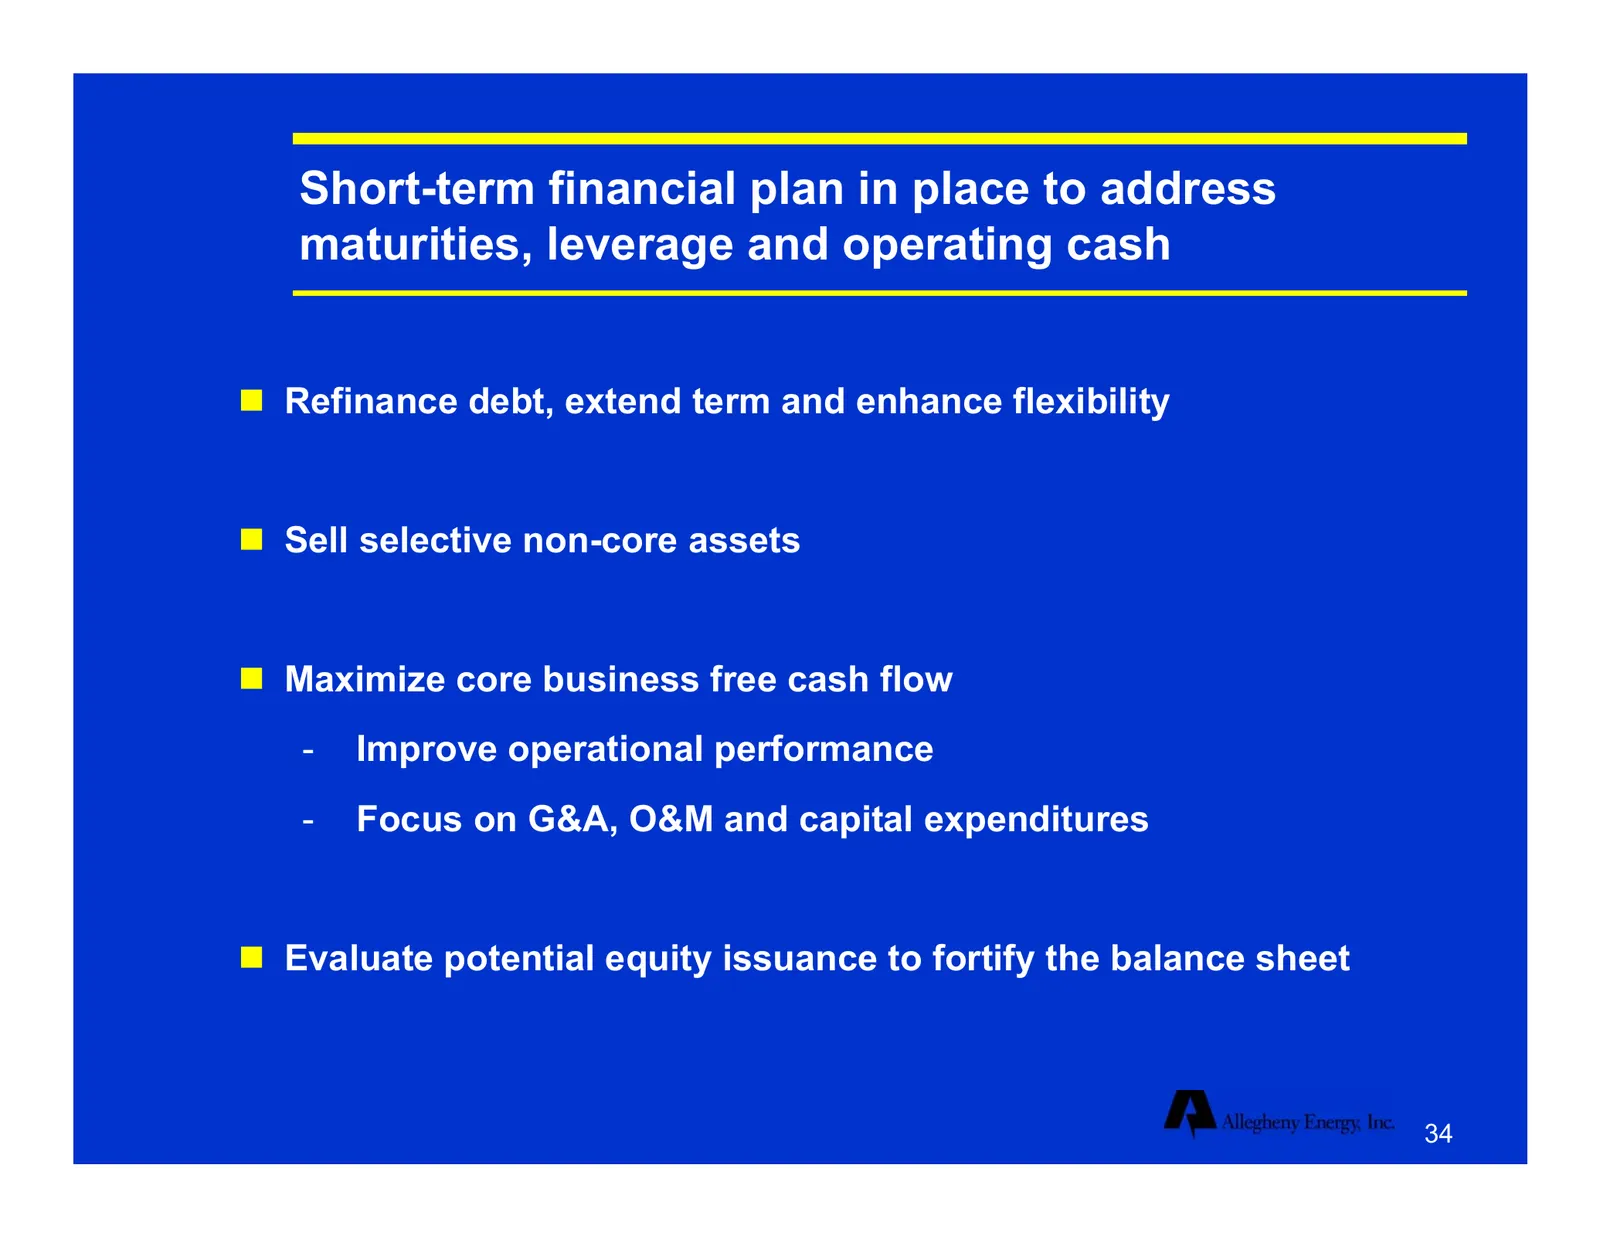
Short-term financial plan in place to address maturities, leverage and operating cash Refinance debt, extend term and enhance flexibility Sell selective non-core assets Maximize core business free cash flow - Improve operational performance - Focus on G&A, O&M and capital expenditures Evalua
Slide 35: Long-term financial objectives and goals established
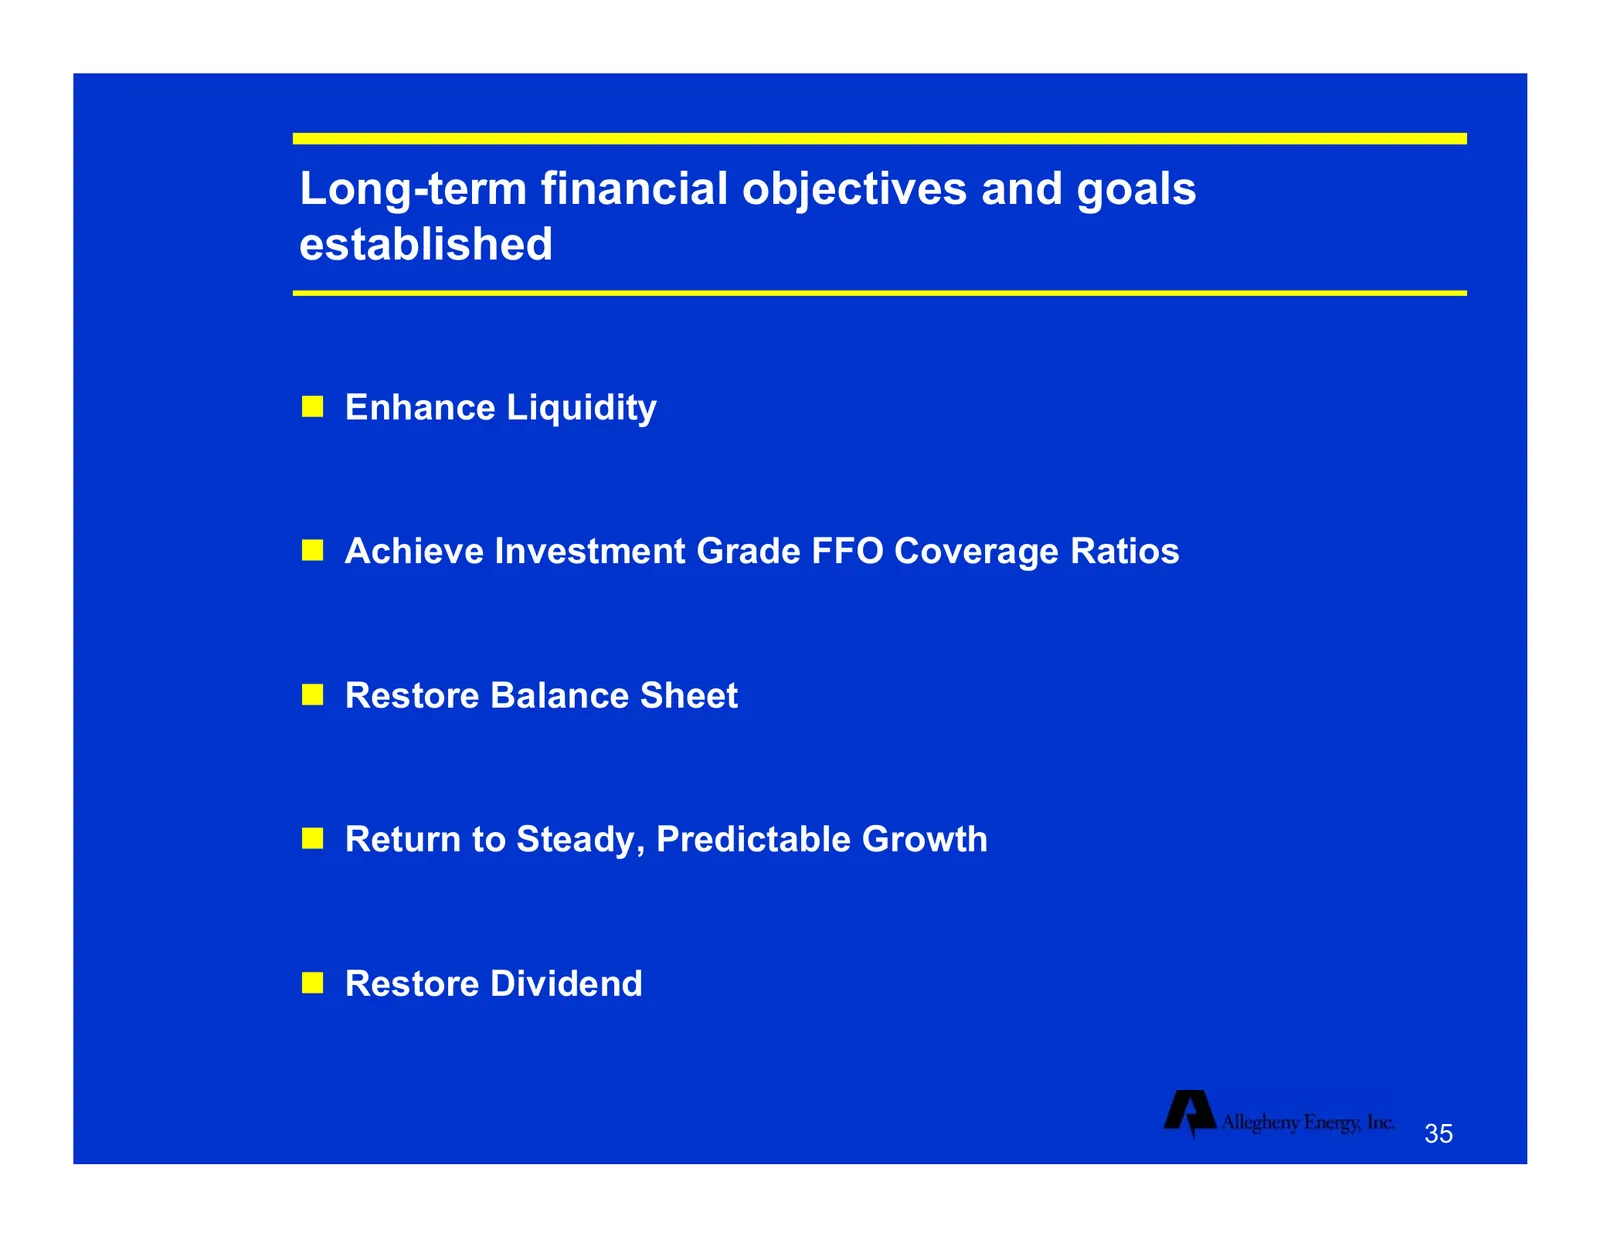
Long-term financial objectives and goals established Enhance Liquidity Achieve Investment Grade FFO Coverage Ratios Restore Balance Sheet Return to Steady, Predictable Growth Restore Dividend 35
Slide 36: Agenda
Agenda Early Progress Business Foundation Financial Update Conclusions 36
Slide 37: Investment Highlights
Investment Highlights Stable, proven utility with good customer mix and steady growth prospects Low-cost coal generation fleet that is well matched to regional load A majority of generation output under long-term contracts Improving liquidity, financial reporting and controls Talented, ded
Source: SEC EDGAR · 8-K filed Oct 24, 2003
More decks from Allegheny Energy Inc
 EEI Financial Conference 201045 slides · Nov 1, 2010
 Barclays Capital CEO Energy-Power Conference 20105 slides · Sep 15, 2010
 Merger or Acquisition (September 2010)19 slides · Sep 14, 2010
 Merger or Acquisition (August 2010)20 slides · Aug 13, 2010
 Merger or Acquisition (August 2010)7 slides · Aug 4, 2010
 Citigroup Conference June 7-8, 201056 slides · Jun 7, 2010