Superior Well Services — BMO Capital Markets 4th Annual Appalachian E&P Forum (January 2008)
34 slides from Superior Well Services's conference presentation, Jan 7, 2008
Slide 1: BMO Capital Markets 4th Annual Appalachian E&P Forum
BMO Capital Markets 4th Annual Appalachian E&P Forum
Slide 2: Forward-Looking Statements
Forward-Looking Statements This presentation includes "forward-looking statements" within the meaning of Section 27A of the Securities Act of 1933, as amended, and Section 21E of the Securities Act of 1934, as amended. All statements, other than statements of historical facts, included in this prese
Slide 3: Management Representatives
Daniel Arnold Vice President of Sales and Marketing Management Representatives Thomas Stoelk Chief Financial Officer
Slide 4: Superior Overview
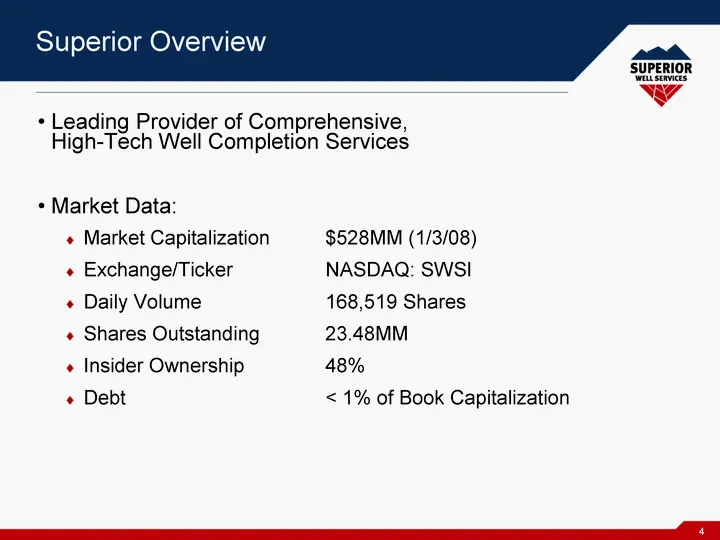
Superior Overview Leading Provider of Comprehensive, High-Tech Well Completion Services Market Data: Market Capitalization $528MM (1/3/08) Exchange/Ticker NASDAQ: SWSI Daily Volume 168,519 Shares Shares Outstanding 23.48MM Insider Ownership 48% Debt < 1% of Book Capitalization
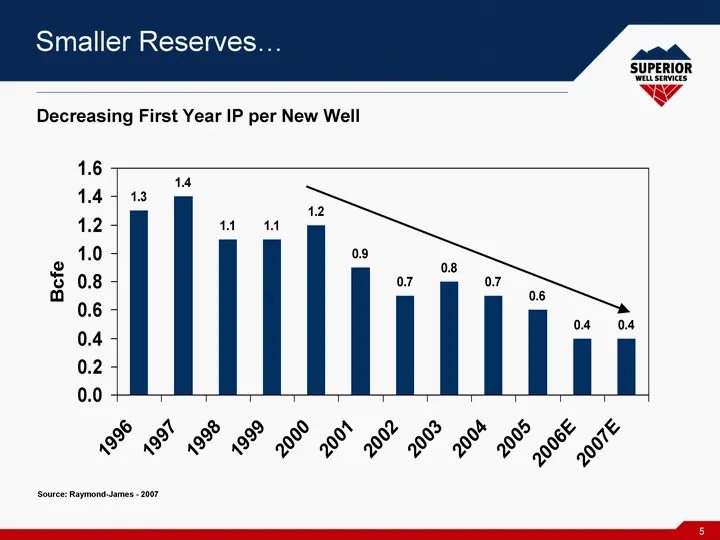
Slide 5: Smaller Reserves...
Smaller Reserves... 1996 1997 1998 1999 2000 2001 2002 2003 2004 2005 2006E 2007E 1.3 1.4 1.1 1.1 1.2 0.9 0.7 0.8 0.7 0.6 0.4 0.4 West 30.6 38.6 34.6 31.6 North 45.9 46.9 45 43.9 Decreasing First Year IP per New Well Source: Raymond-James - 2007
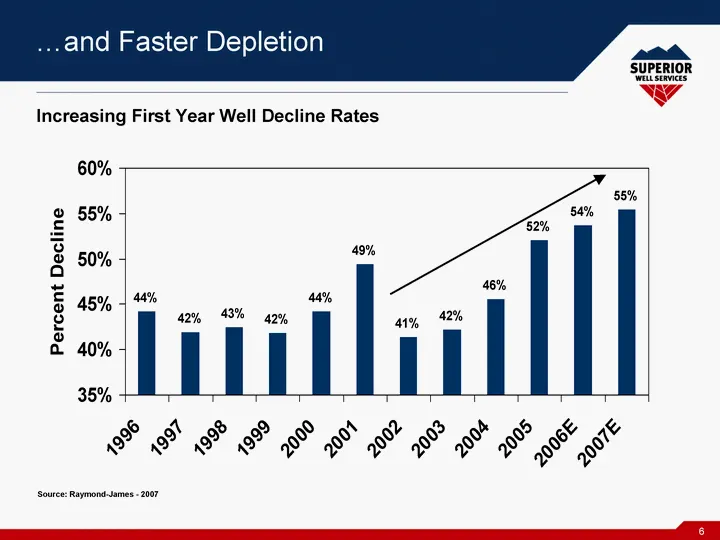
Slide 6: ....and Faster Depletion
....and Faster Depletion 1996 1997 1998 1999 2000 2001 2002 2003 2004 2005 2006E 2007E 0.442 0.419 0.425 0.418 0.442 0.494 0.414 0.422 0.456 0.521 0.537 0.554 Increasing First Year Well Decline Rates Source: Raymond-James - 2007
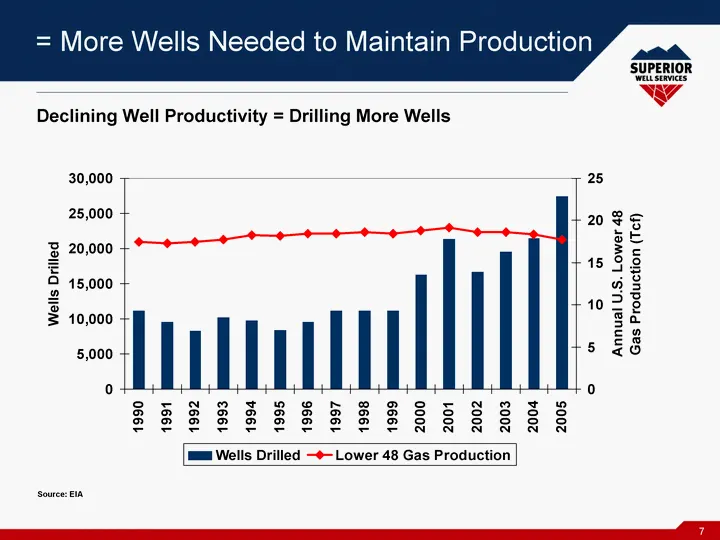
Slide 7: More Wells Needed to Maintain Production
= More Wells Needed to Maintain Production 1990 1991 1992 1993 1994 1995 1996 1997 1998 1999 2000 2001 2002 2003 2004 2005 Wells Drilled 11126 9611 8305 10174 9739 8454 9539 11186 11127 11121 16242 21403 16728 19522 21529 27397 Lower 48 Gas Production 17.43 17.29 17.43 17.7 18.3 18.16 18.41 18.48 18
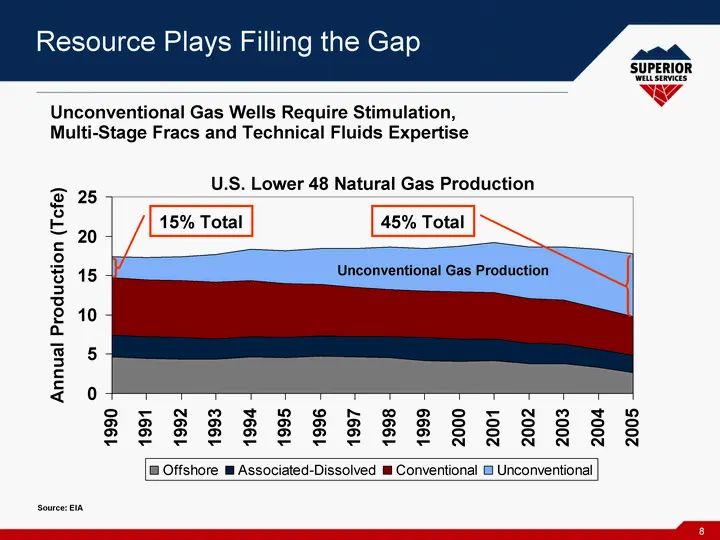
Slide 8: Resource Plays Filling the Gap
Resource Plays Filling the Gap 1990 1991 1992 1993 1994 1995 1996 1997 1998 1999 2000 2001 2002 2003 2004 2005 Offshore 4.69 4.46 4.35 4.42 4.67 4.56 4.75 4.63 4.52 4.19 4.11 4.18 3.83 3.81 3.35 2.69 Associated-Dissolved 2.69 2.72 2.74 2.55 2.57 2.57 2.54 2.58 2.73 2.92 2.83 2.77 2.57 2.43 2.28 2.15
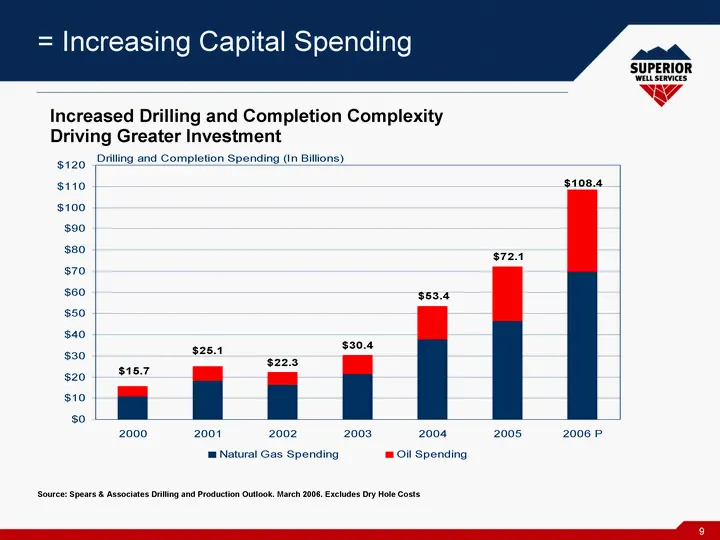
Slide 9: Increasing Capital Spending
Source: Spears & Associates Drilling and Production Outlook. March 2006. Excludes Dry Hole Costs = Increasing Capital Spending Increased Drilling and Completion Complexity Driving Greater Investment
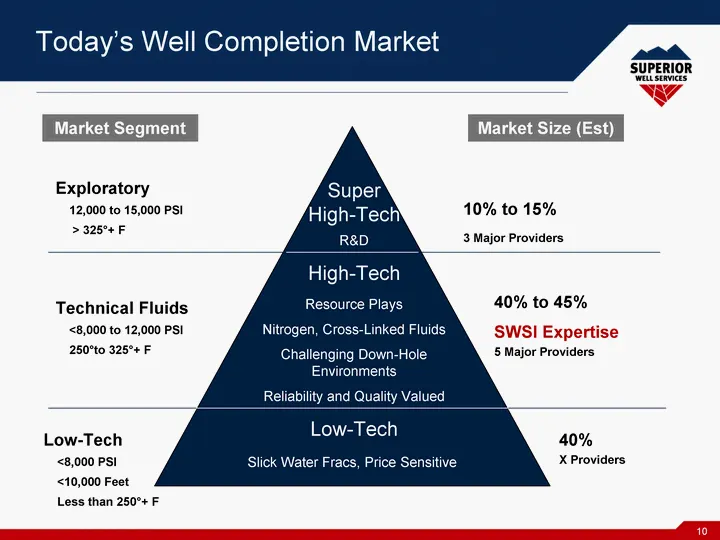
Slide 10: Today's Well Completion Market
Today's Well Completion Market Super High-Tech High-Tech Low-Tech Exploratory 12,000 to 15,000 PSI > 325°+ F 40% to 45% SWSI Expertise 40% Slick Water Fracs, Price Sensitive 10% to 15% Resource Plays Nitrogen, Cross-Linked Fluids Challenging Down-Hole Environments Reliability and Quality Valued R&D
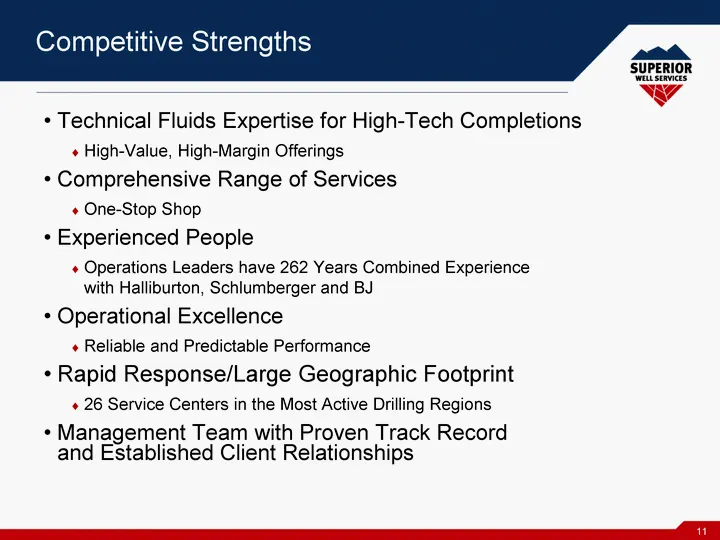
Slide 11: Competitive Strengths
Competitive Strengths Technical Fluids Expertise for High-Tech Completions High-Value, High-Margin Offerings Comprehensive Range of Services One-Stop Shop Experienced People Operations Leaders have 262 Years Combined Experience with Halliburton, Schlumberger and BJ Operational Excellence Reliable an
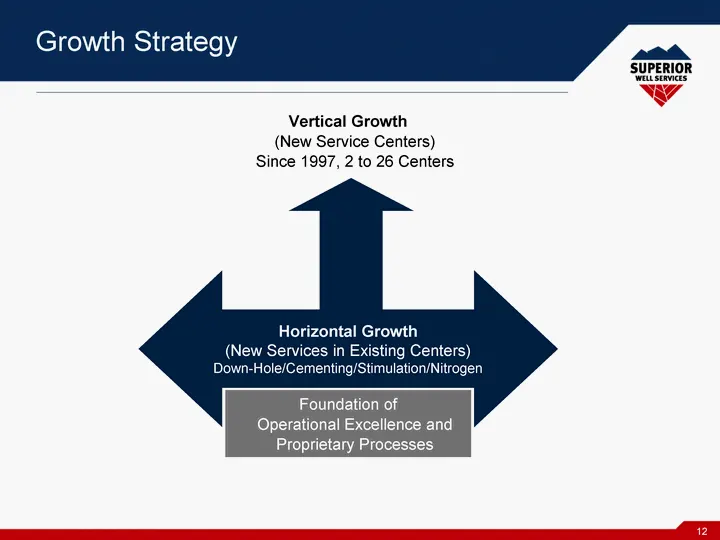
Slide 12: Growth Strategy
Growth Strategy Horizontal Growth (New Services in Existing Centers) Down-Hole/Cementing/Stimulation/Nitrogen Foundation of Operational Excellence and Proprietary Processes Vertical Growth (New Service Centers) Since 1997, 2 to 26 Centers
Slide 13: Growing Revenue
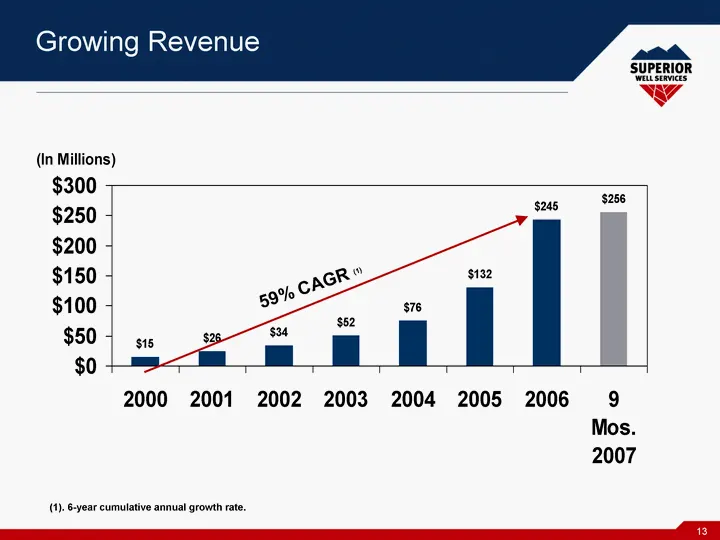
Growing Revenue 2000 2001 2002 2003 2004 2005 2006 9 Mos. 2007 15.1 25.5 34.2 51.5 76 131.7 244.6 255.8 59% CAGR (1) (1). 6-year cumulative annual growth rate.
Slide 14: Growing EBITDA
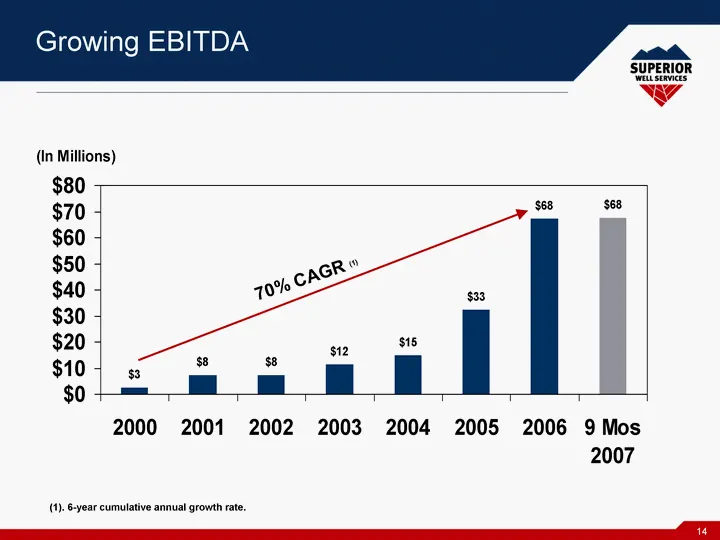
Growing EBITDA 2000 2001 2002 2003 2004 2005 2006 9 Mos 2007 2.8 7.6 7.8 11.8 15.2 32.6 67.6 68.1 70% CAGR (1) (1). 6-year cumulative annual growth rate.
Slide 15: Operations Overview
Operations Overview
Slide 16: Service Centers in States
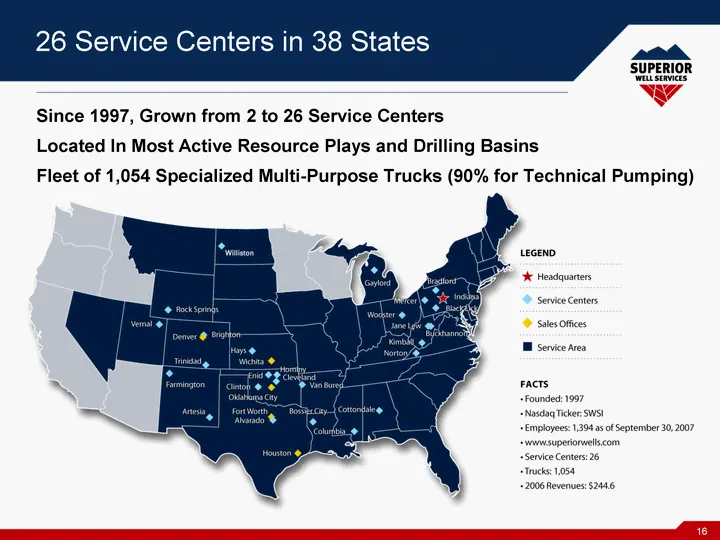
26 Service Centers in 38 States Since 1997, Grown from 2 to 26 Service Centers Located In Most Active Resource Plays and Drilling Basins Fleet of 1,054 Specialized Multi-Purpose Trucks (90% for Technical Pumping)
Slide 17: Revenue by Service Line - 2006
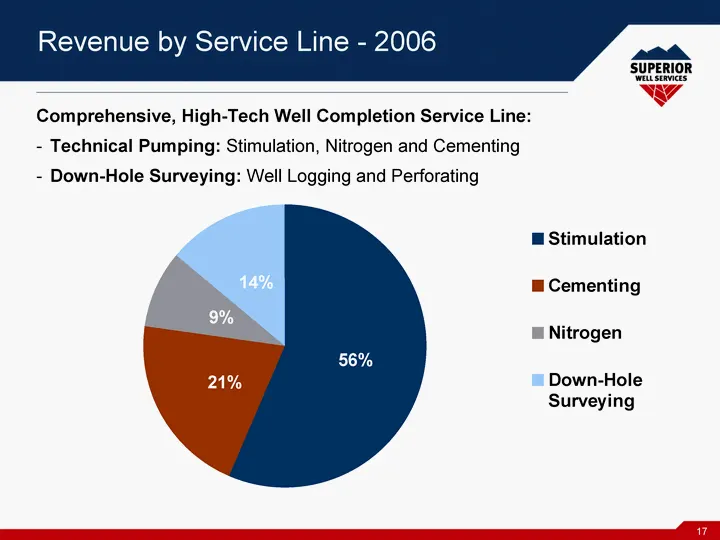
Revenue by Service Line - 2006 Stimulation Cementing Nitrogen Down-Hole Surveying East 0.564 0.209 0.087 0.14 Comprehensive, High-Tech Well Completion Service Line: Technical Pumping: Stimulation, Nitrogen and Cementing Down-Hole Surveying: Well Logging and Perforating
Slide 18: Cementing - Technical Pumping
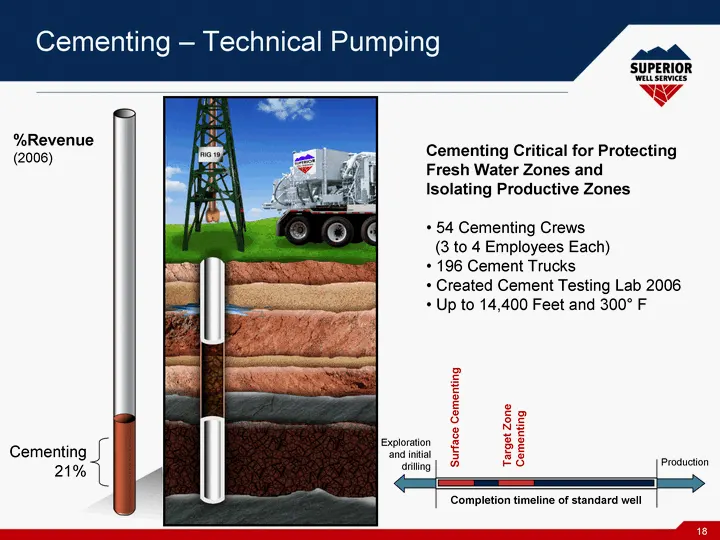
Cementing - Technical Pumping Cementing Critical for Protecting Fresh Water Zones and Isolating Productive Zones 54 Cementing Crews (3 to 4 Employees Each) 196 Cement Trucks Created Cement Testing Lab 2006 Up to 14,400 Feet and 300° F Exploration and initial drilling Production Completion timeline o
Slide 19: Logging - Down-Hole Surveying
Logging - Down-Hole Surveying Logging
Slide 20: Logging - Down-Hole Surveying
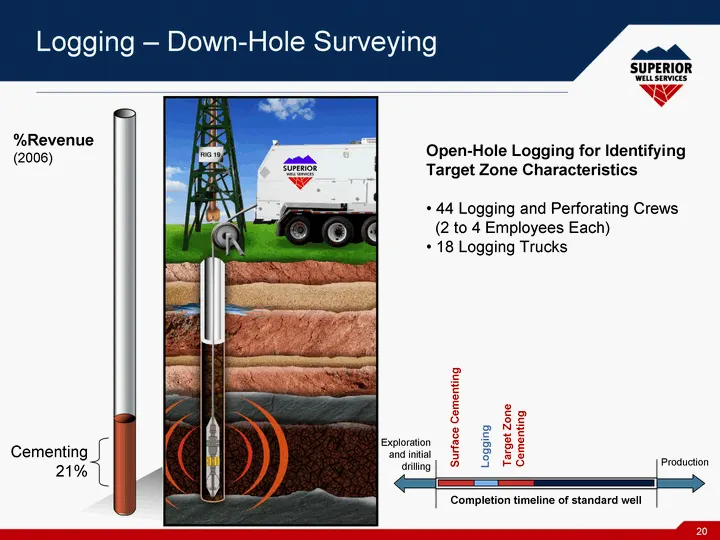
Logging - Down-Hole Surveying Open-Hole Logging for Identifying Target Zone Characteristics 44 Logging and Perforating Crews (2 to 4 Employees Each) 18 Logging Trucks Exploration and initial drilling Production Completion timeline of standard well Surface Cementing Target Zone Cementing Logging %Rev
Slide 21: Perforating - Down-Hole Surveying
Perforating - Down-Hole Surveying Perforating
Slide 22: Perforating - Down-Hole Surveying
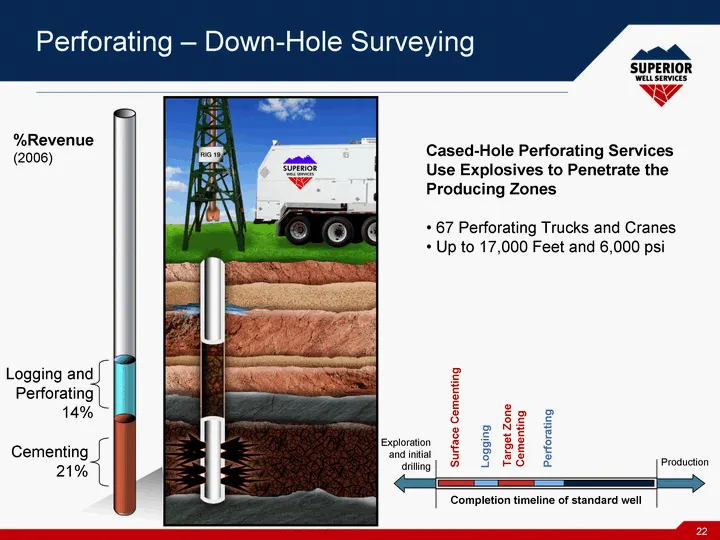
Perforating - Down-Hole Surveying Cased-Hole Perforating Services Use Explosives to Penetrate the Producing Zones 67 Perforating Trucks and Cranes Up to 17,000 Feet and 6,000 psi Exploration and initial drilling Production Completion timeline of standard well Surface Cementing Target Zone Cementing
Slide 23: Nitrogen - Technical Pumping
Nitrogen - Technical Pumping Nitrogen
Slide 24: Nitrogen - Technical Pumping
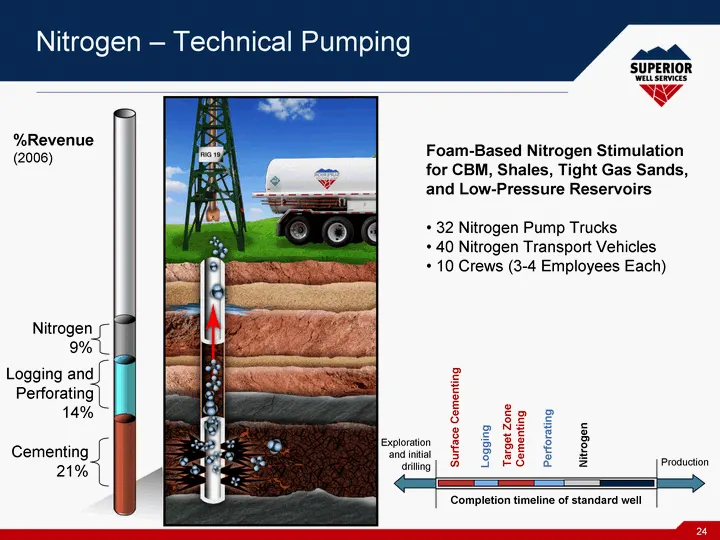
Nitrogen - Technical Pumping Foam-Based Nitrogen Stimulation for CBM, Shales, Tight Gas Sands, and Low-Pressure Reservoirs 32 Nitrogen Pump Trucks 40 Nitrogen Transport Vehicles 10 Crews (3-4 Employees Each) Exploration and initial drilling Production Completion timeline of standard well Surface Cem
Slide 25: Stimulation - Technical Pumping
Stimulation - Technical Pumping Stimulation
Slide 26: Stimulation - Technical Pumping
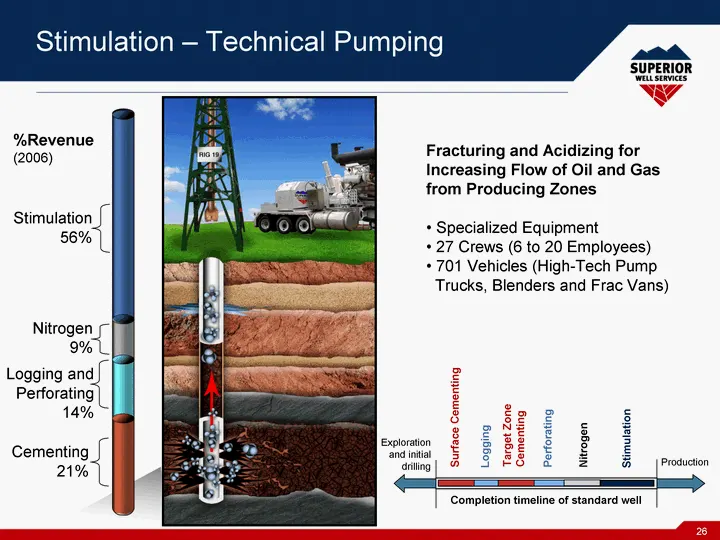
Stimulation Stimulation - Technical Pumping Fracturing and Acidizing for Increasing Flow of Oil and Gas from Producing Zones Specialized Equipment 27 Crews (6 to 20 Employees) 701 Vehicles (High-Tech Pump Trucks, Blenders and Frac Vans) Exploration and initial drilling Production Completion timeline
Slide 27: Financial Overview
Financial Overview
Slide 28: Strong Balance Sheet
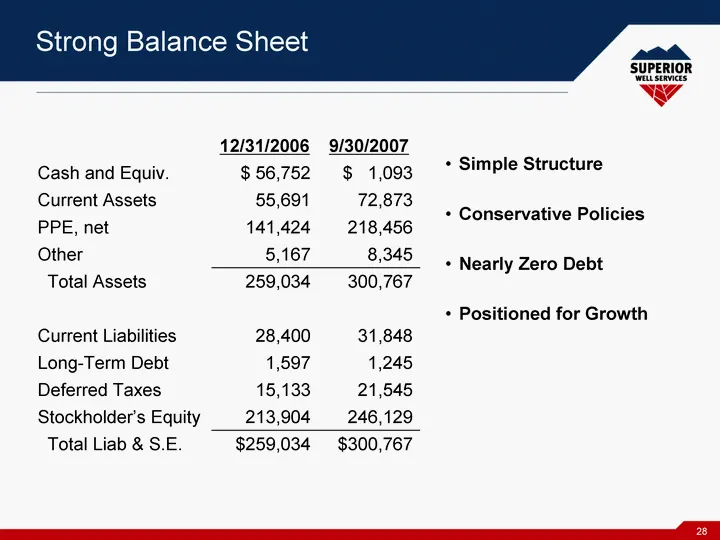
Strong Balance Sheet 12/31/2006 9/30/2007 Cash and Equiv. $ 56,752 $ 1,093 Current Assets 55,691 72,873 PPE, net 141,424 218,456 Other 5,167 8,345 Total Assets 259,034 300,767 Current Liabilities 28,400 31,848 Long-Term Debt 1,597 1,245 Deferred Taxes 15,133 21,545 Stockholder's Equity 213,904 246,1
Slide 29: Increasing Operating Margins
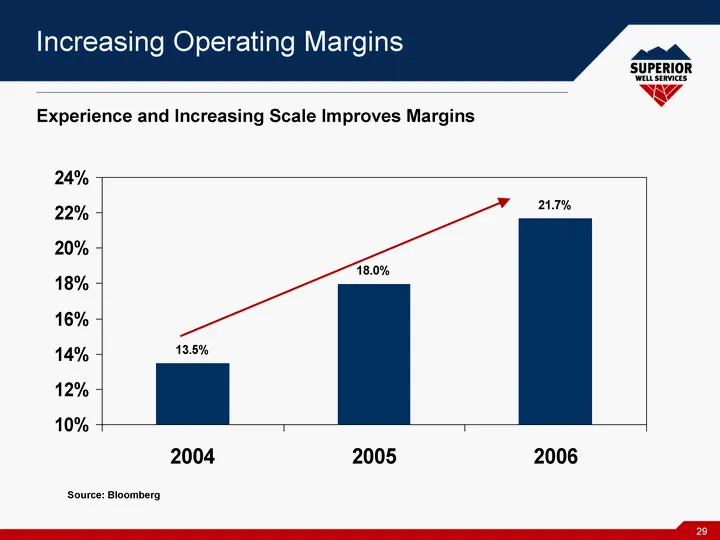
Increasing Operating Margins 2004 2005 2006 0.1349 0.1797 0.2168 Source: Bloomberg Experience and Increasing Scale Improves Margins
Slide 30: Net Income Growth
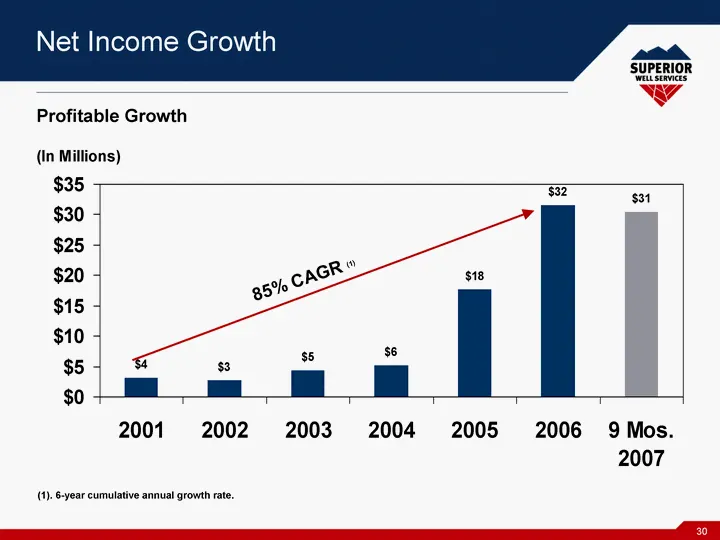
Net Income Growth 2001 2002 2003 2004 2005 2006 9 Mos. 2007 3.5 3.1 4.7 5.5 18 31.9 30.8 85% CAGR (1) Profitable Growth (1). 6-year cumulative annual growth rate.
Slide 31: Capital Expenditure Growth
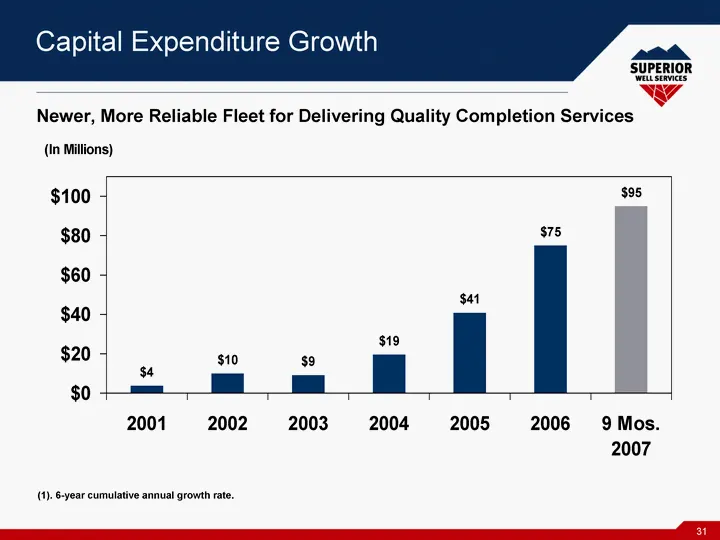
Capital Expenditure Growth 2001 2002 2003 2004 2005 2006 9 Mos. 2007 3.8 9.8 9.2 19.4 40.8 75.1 95.2 Newer, More Reliable Fleet for Delivering Quality Completion Services (1). 6-year cumulative annual growth rate.
Slide 32: How We Measure Up - Growth
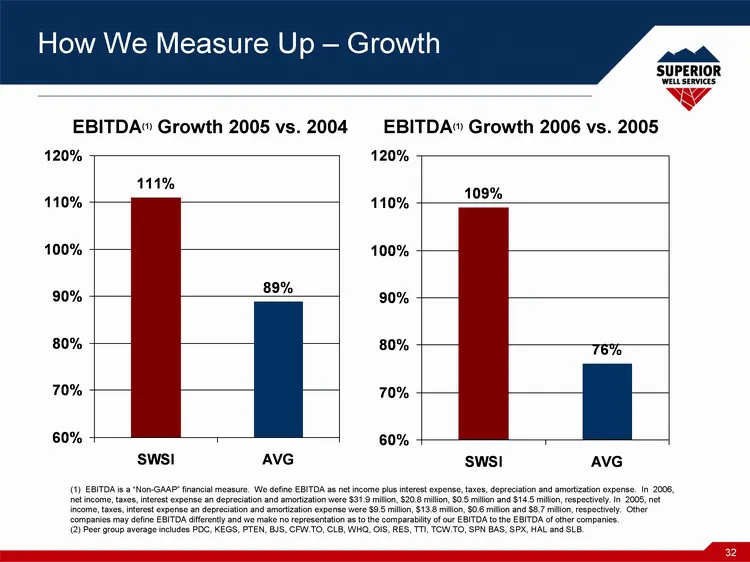
How We Measure Up - Growth SWSI AVG 1.11 0.89 SWSI AVG 1.09 0.76 EBITDA(1) Growth 2005 vs. 2004 EBITDA(1) Growth 2006 vs. 2005 (1) EBITDA is a "Non-GAAP" financial measure. For a definition of how we define EBITDA please see our "Selected Financial Information" slide Other companies may define EBITD
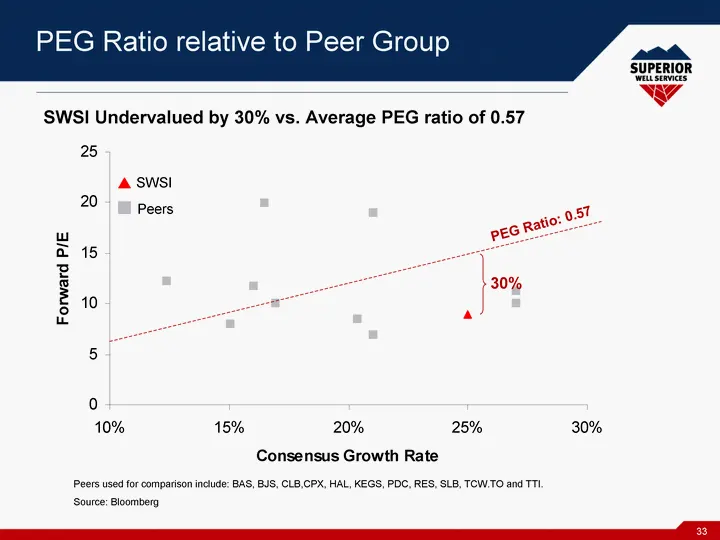
Slide 33: PEG Ratio relative to Peer Group
PEG Ratio relative to Peer Group PEG Ratio: 0.57 30% Peers used for comparison include: BAS, BJS, CLB,CPX, HAL, KEGS, PDC, RES, SLB, TCW.TO and TTI. Source: Bloomberg SWSI Undervalued by 30% vs. Average PEG ratio of 0.57 SWSI Peers
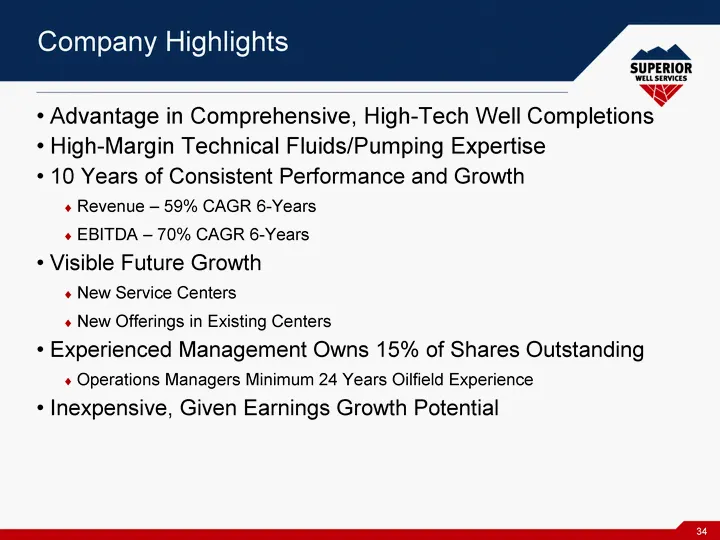
Slide 34: Company Highlights
Company Highlights Advantage in Comprehensive, High-Tech Well Completions High-Margin Technical Fluids/Pumping Expertise 10 Years of Consistent Performance and Growth Revenue - 59% CAGR 6-Years EBITDA - 70% CAGR 6-Years Visible Future Growth New Service Centers New Offerings in Existing Centers Expe
Source: SEC EDGAR · 8-K filed Jan 7, 2008
More decks from Superior Well Services INC
 Investor Presentation (June 2010)28 slides · Jun 7, 2010
 Pritchard Capital Conference 201044 slides · May 19, 2010
 Investor Presentation (May 2010)28 slides · May 13, 2010
 Investor Presentation (March 2010)28 slides · Mar 16, 2010
 Pritchard Capital Partners Energize 201031 slides · Jan 5, 2010
 Pritchard Capital Partners Boston Appalachia Forum 200931 slides · Nov 13, 2009