GreenSky — Investor Day (January 2021)
66 slides from GreenSky's investor day presentation, Jan 12, 2021
Slide 1: Virtual Investor Day January 12, 2021
Virtual Investor Day January 12, 2021
Slide 2: Agenda
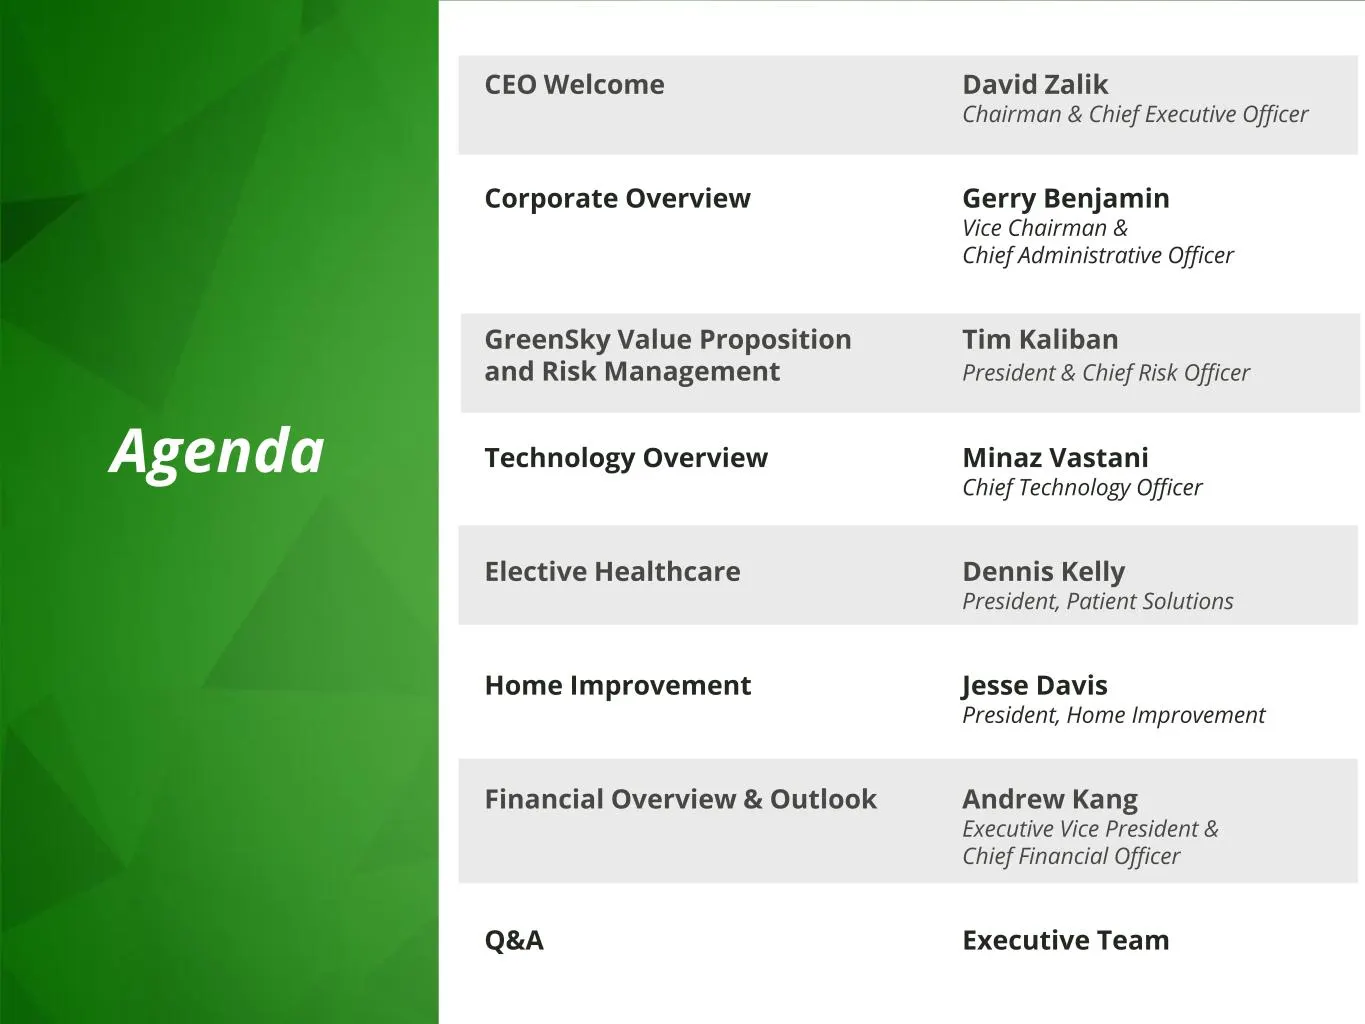
Agenda CEO Welcome David Zalik Chairman & Chief Executive Officer Corporate Overview Gerry Benjamin Vice Chairman & Chief Administrative Officer GreenSky Value Proposition Tim Kaliban and Risk Management President & Chief Risk Officer Technology Overview Minaz Vastani Chief Technology Officer Electi
Slide 3: Forward-Looking Statements and Non-GAAP Financial Measures
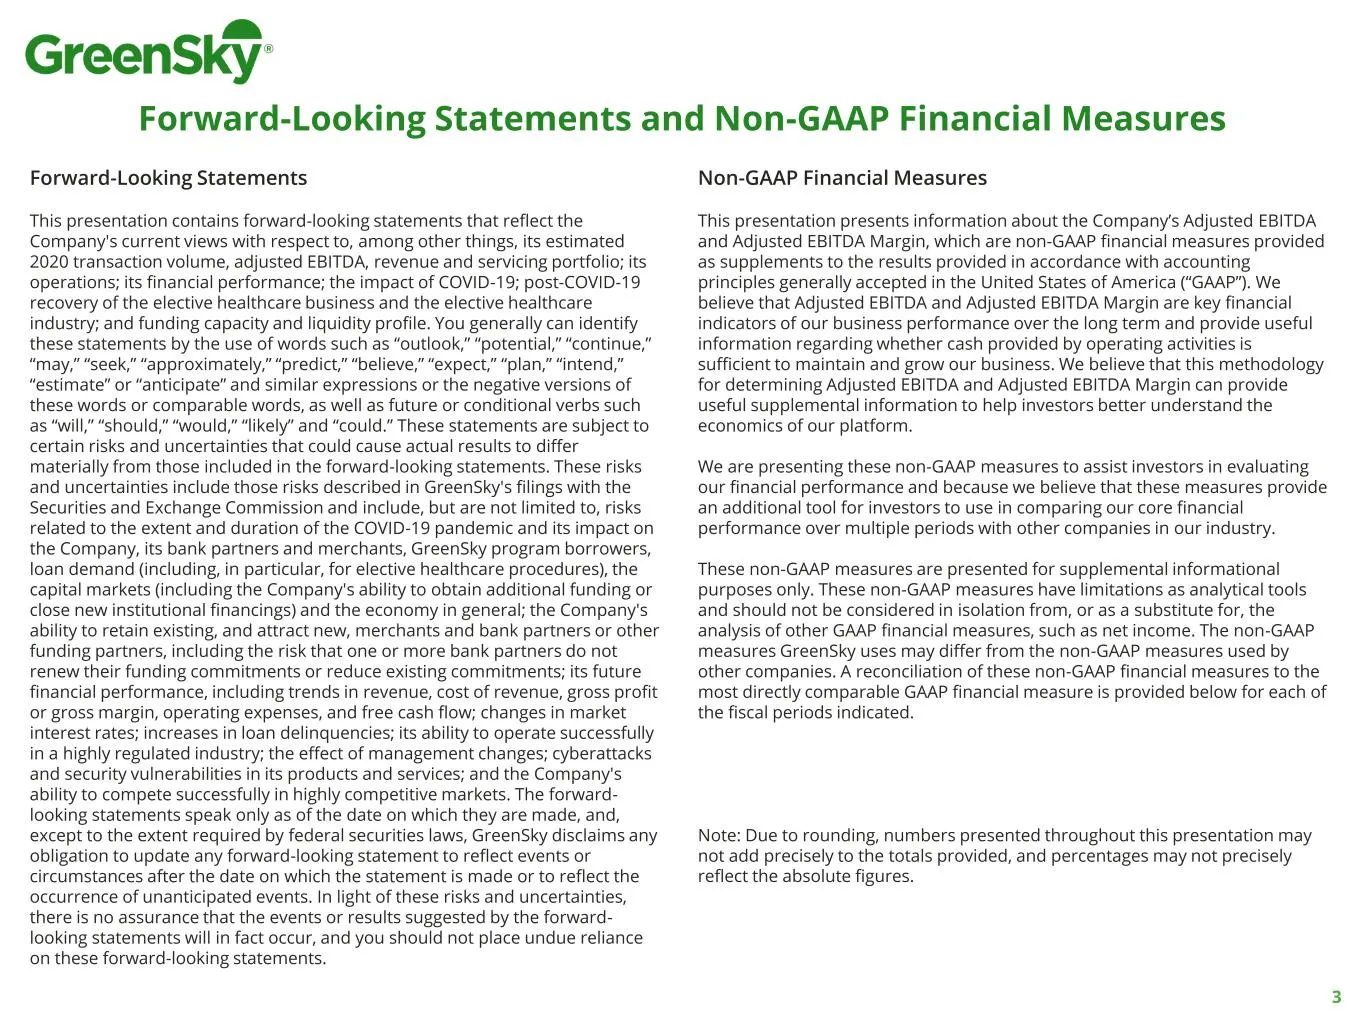
Forward-Looking Statements and Non-GAAP Financial Measures Forward-Looking Statements This presentation contains forward-looking statements that reflect the Company's current views with respect to, among other things, its estimated 2020 transaction volume, adjusted EBITDA, revenue and servicing port
Slide 4: CEO Welcome
David Zalik Chairman & Chief Executive Officer CEO Welcome
Slide 5: Our Company
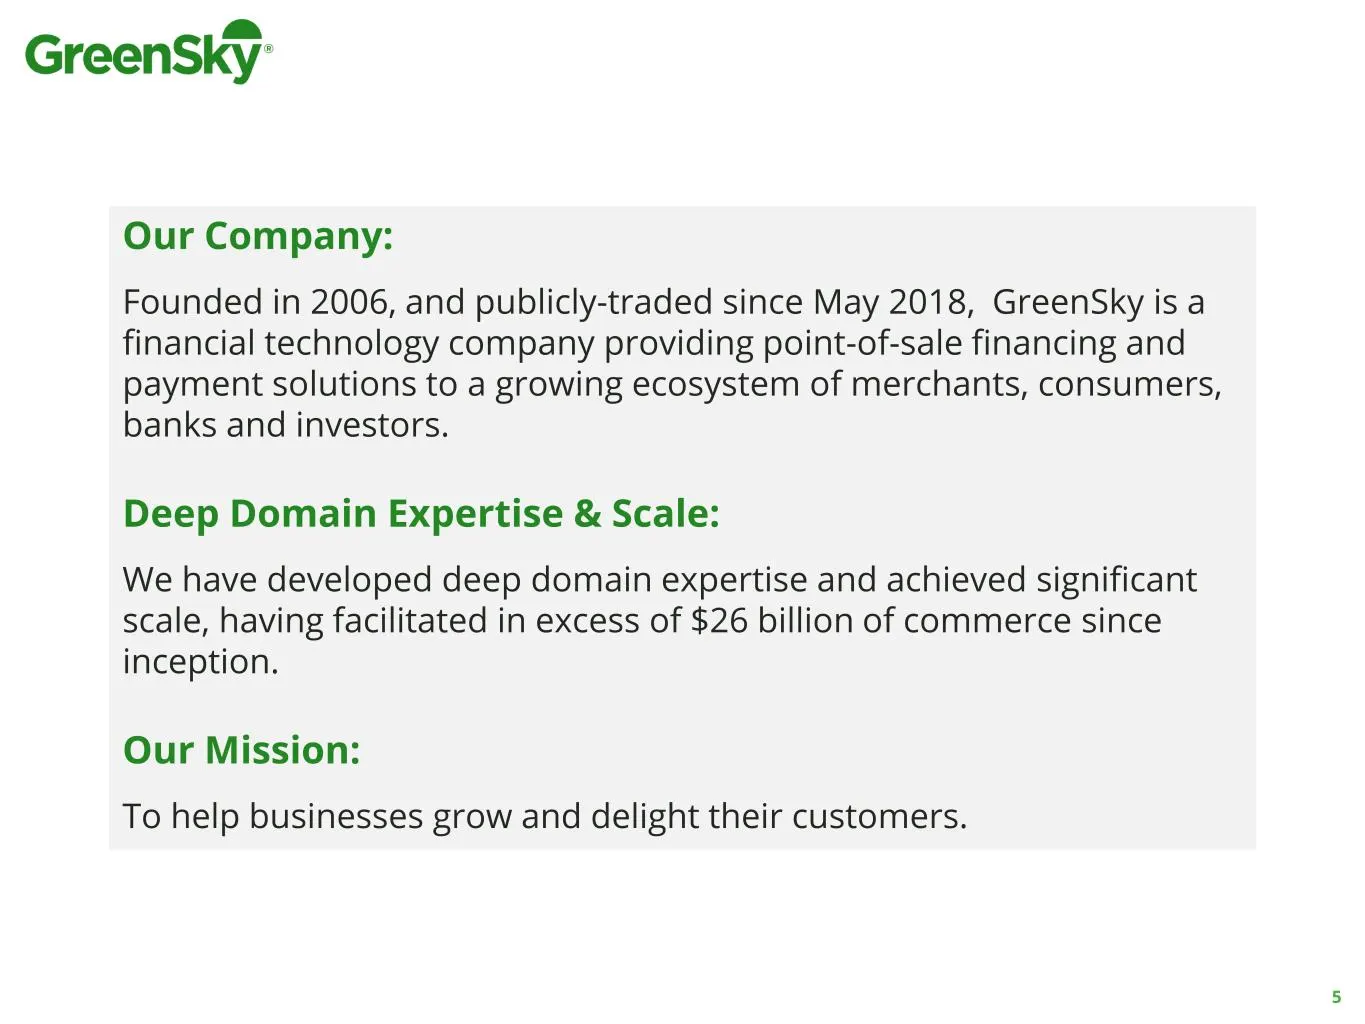
Our Company: Founded in 2006, and publicly-traded since May 2018, GreenSky is a financial technology company providing point-of-sale financing and payment solutions to a growing ecosystem of merchants, consumers, banks and investors. Deep Domain Expertise & Scale: We have developed deep domain exper
Slide 6: GreenSky's Ecosystem
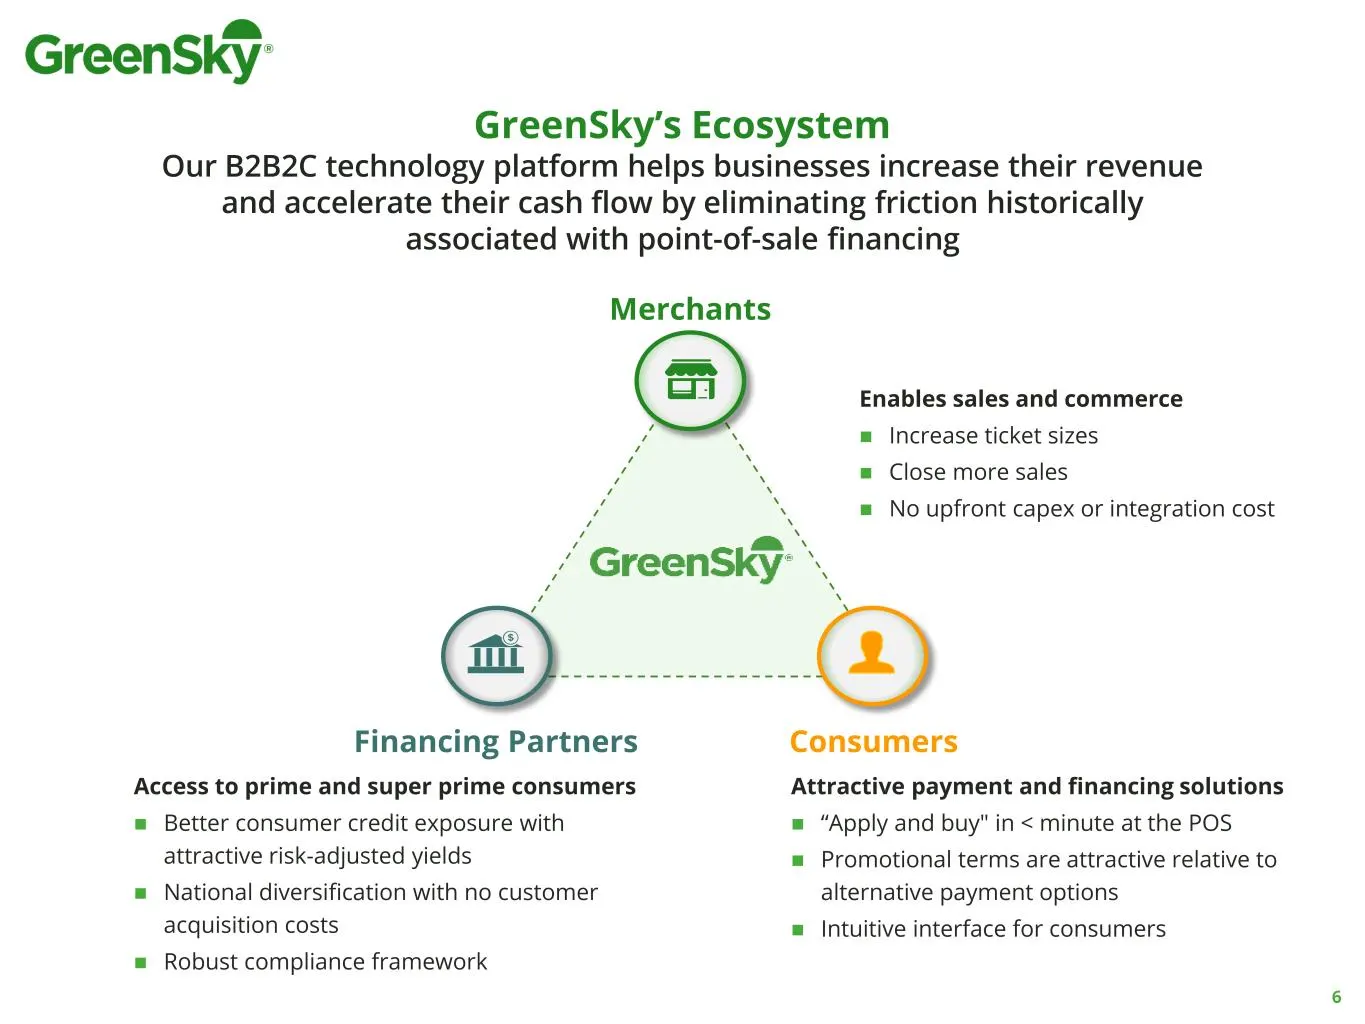
Financing Partners Merchants Consumers GreenSky’s Ecosystem Our B2B2C technology platform helps businesses increase their revenue and accelerate their cash flow by eliminating friction historically associated with point-of-sale financing Enables sales and commerce ◼ Increase ticket sizes ◼ Close mor
Slide 7: Key Differentiators and Strong Competitive Position
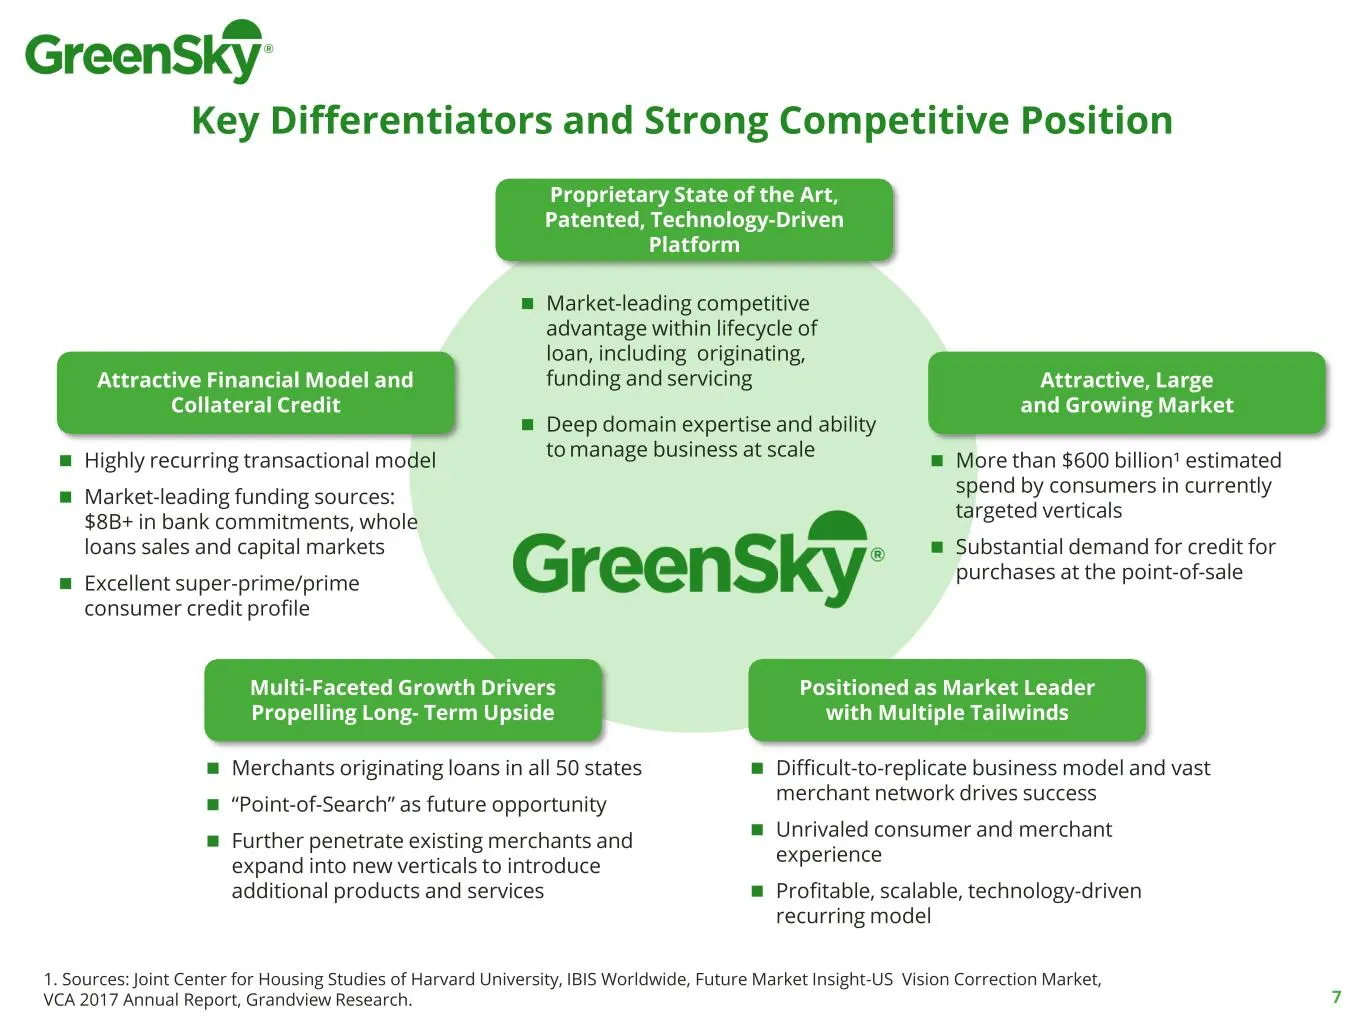
◼ Market-leading competitive advantage within lifecycle of loan, including originating, funding and servicing ◼ Deep domain expertise and ability to manage business at scale Proprietary State of the Art, Patented, Technology-Driven Platform 1. Sources: Joint Center for Housing Studies of Harvard Uni
Slide 8: Key Growth Strategies
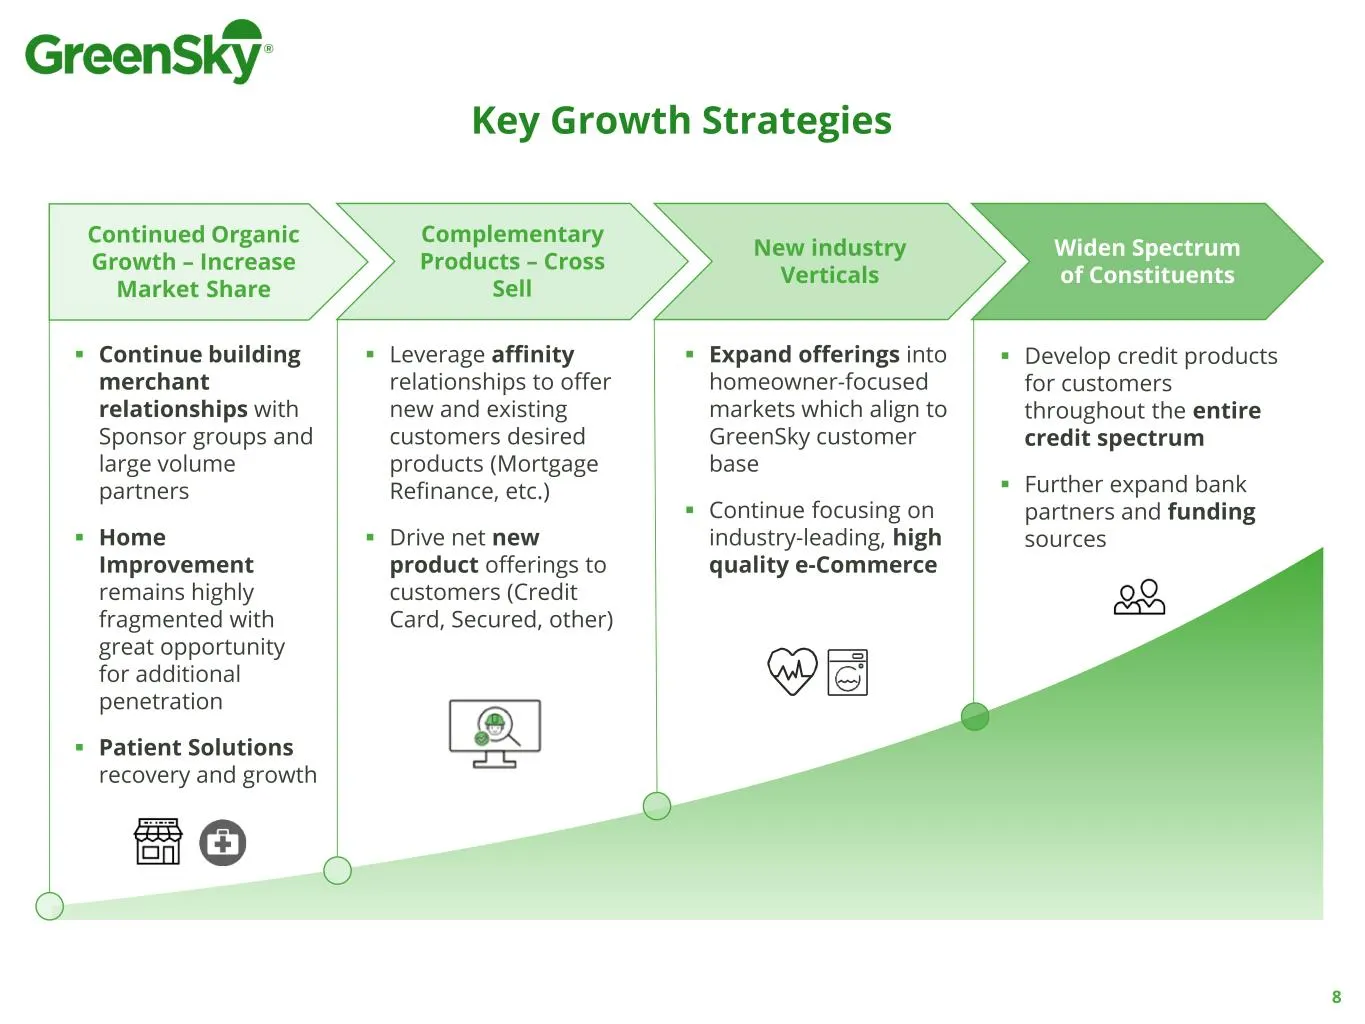
Key Growth Strategies ▪ Continue building merchant relationships with Sponsor groups and large volume partners ▪ Home Improvement remains highly fragmented with great opportunity for additional penetration ▪ Patient Solutions recovery and growth ▪ Expand offerings into homeowner-focused markets whic
Slide 9: 10 x 9 x 30 Strategic Plan
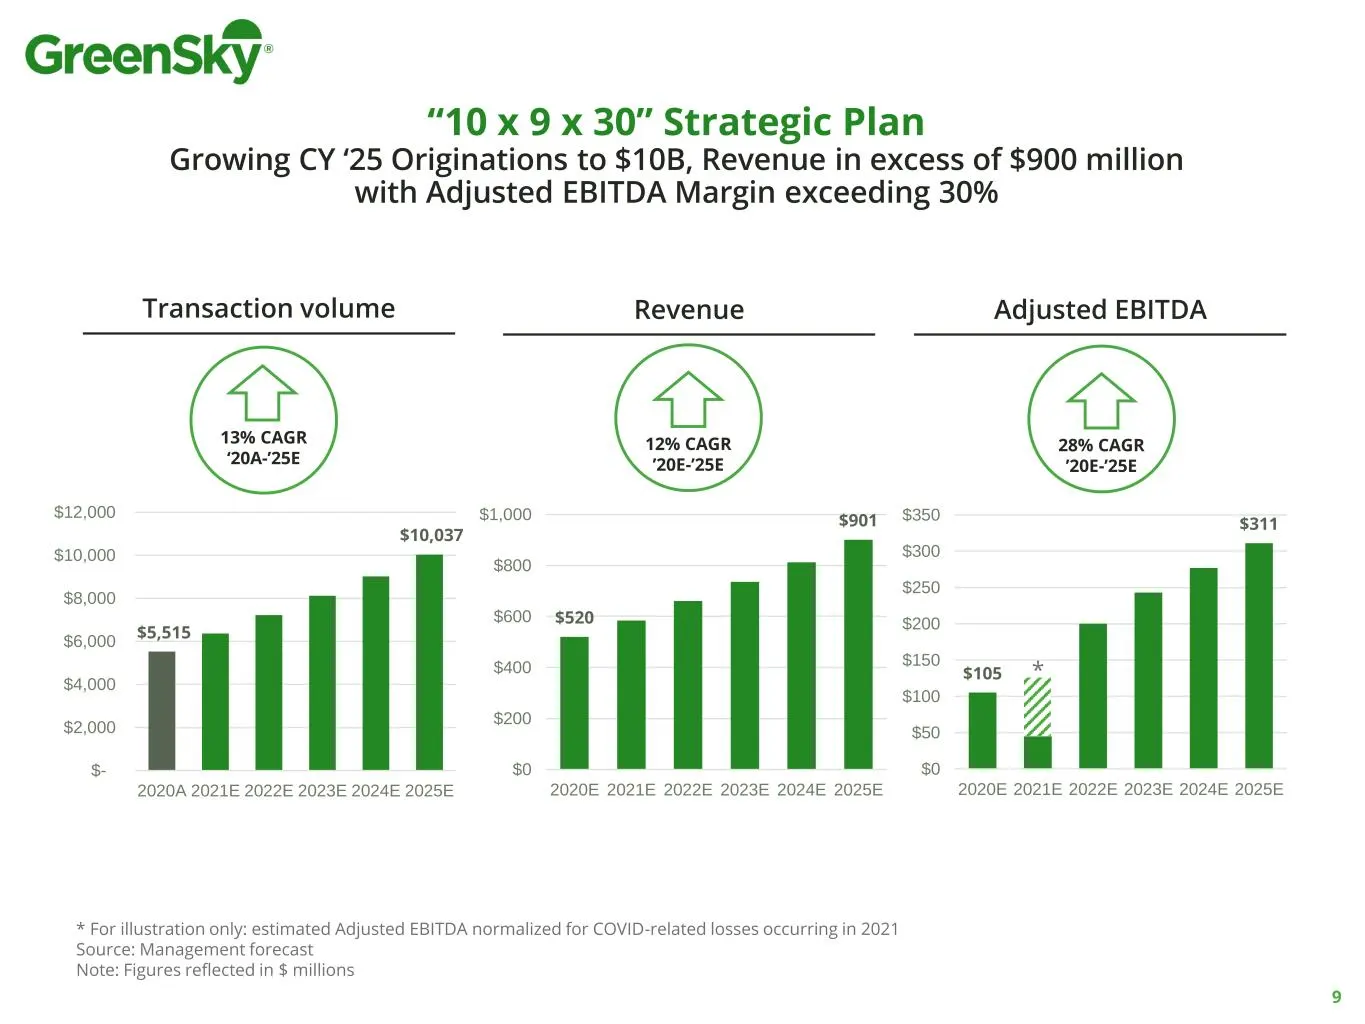
9 Transaction volume Revenue Adjusted EBITDA 13% CAGR ‘20A-’25E 28% CAGR ’20E-’25E 12% CAGR ’20E-’25E $5,515 $10,037 $- $2,000 $4,000 $6,000 $8,000 $10,000 $12,000 2020A 2021E 2022E 2023E 2024E 2025E $520 $901 $0 $200 $400 $600 $800 $1,000 2020E 2021E 2022E 2023E 2024E 2025E $105 $311 $0 $50 $100 $1
Slide 10: Corporate Overview
Gerry Benjamin Vice Chairman & Chief Administrative Officer Corporate Overview
Slide 11: GreenSky Snapshot
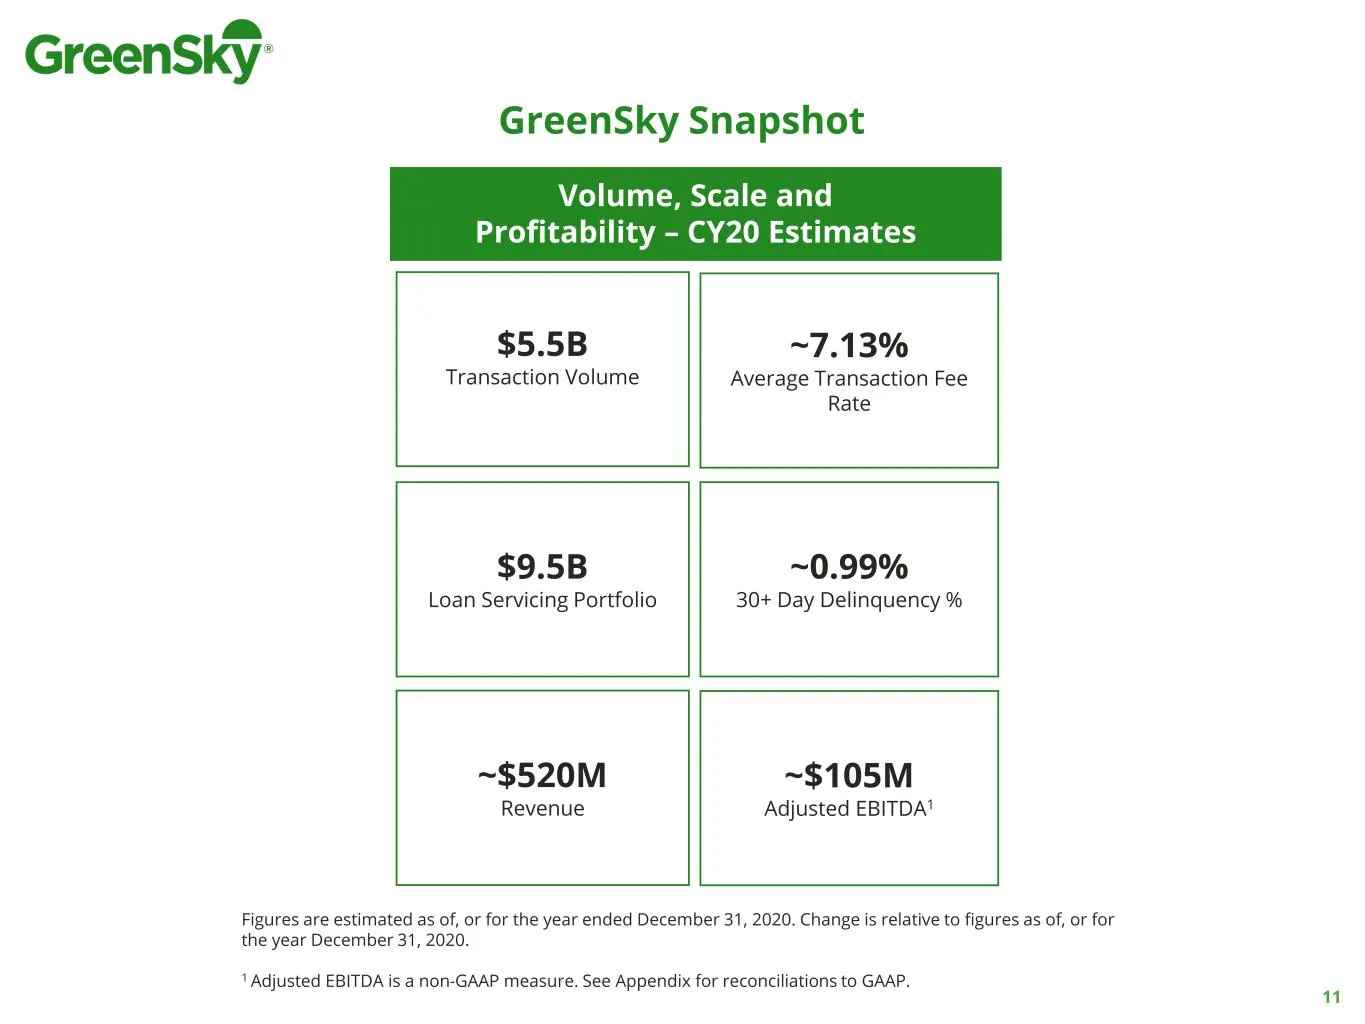
Figures are estimated as of, or for the year ended December 31, 2020. Change is relative to figures as of, or for the year December 31, 2020. 1 Adjusted EBITDA is a non-GAAP measure. See Appendix for reconciliations to GAAP. Volume, Scale and Profitability – CY20 Estimates ~7.13% Average Transaction
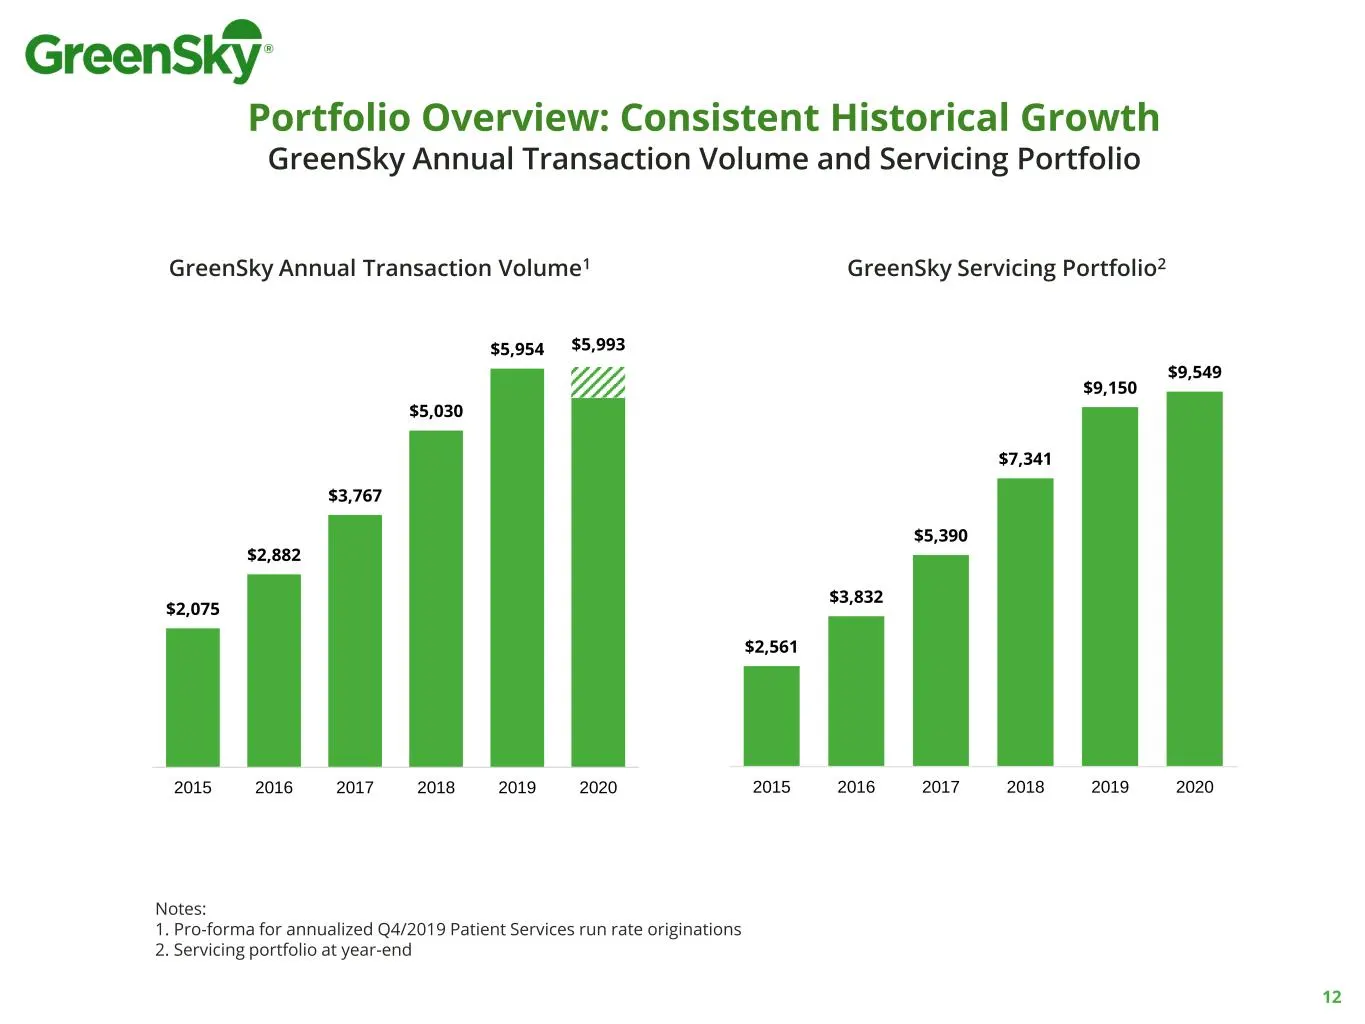
Slide 12: Portfolio Overview: Consistent Historical Growth
Portfolio Overview: Consistent Historical Growth GreenSky Annual Transaction Volume and Servicing Portfolio Notes: 1. Pro-forma for annualized Q4/2019 Patient Services run rate originations 2. Servicing portfolio at year-end 12 $2,561 $3,832 $5,390 $7,341 $9,150 $9,549 2015 2016 2017 2018 2019 2020
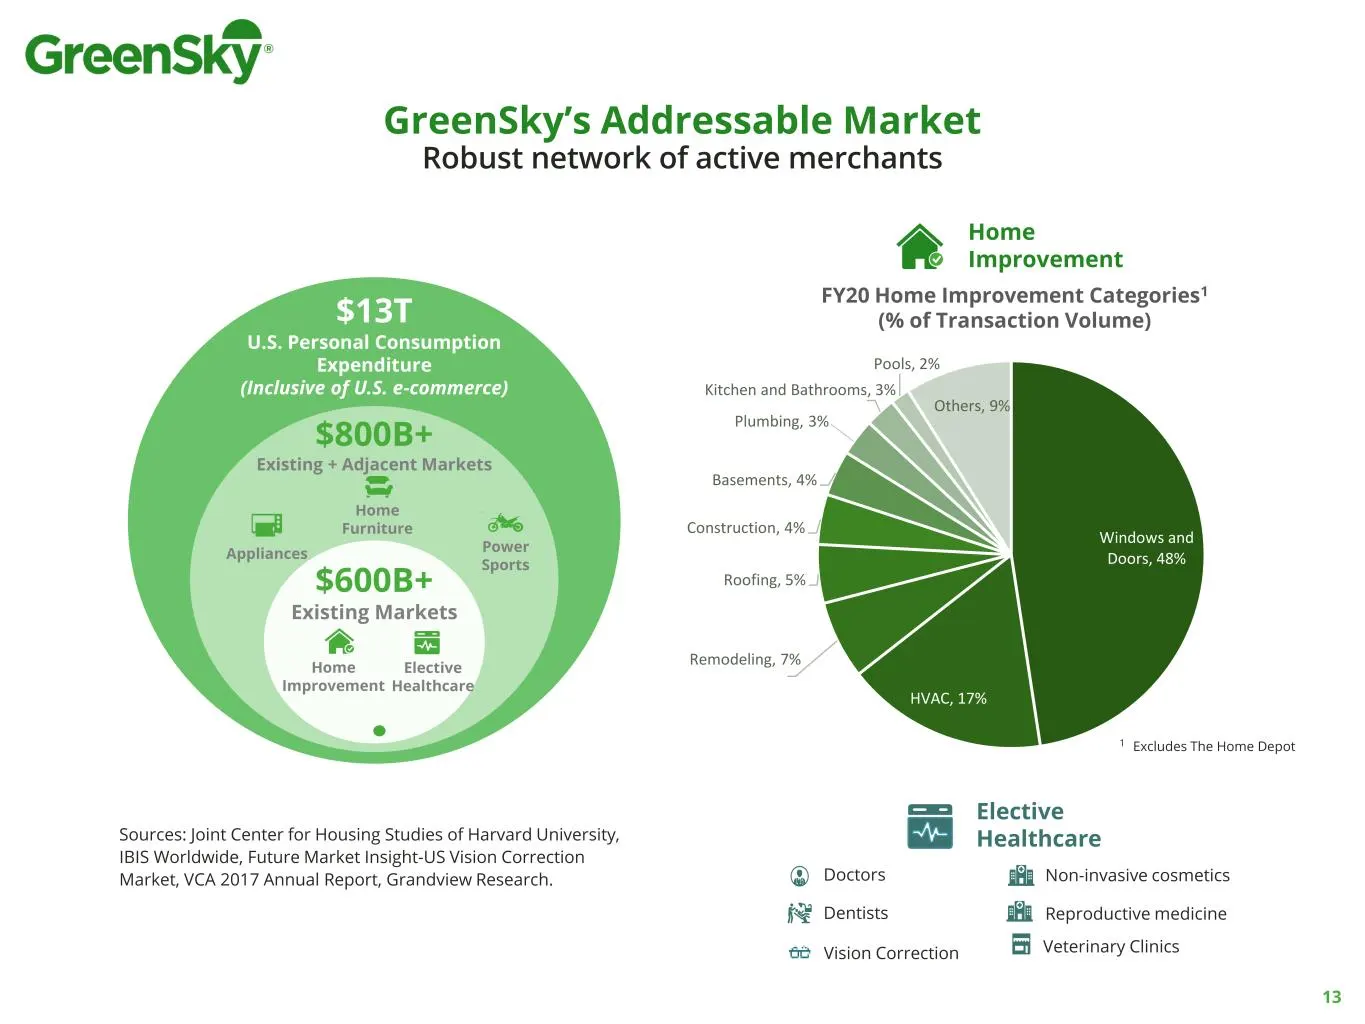
Slide 13: GreenSky's Addressable Market
Windows and Doors, 48% HVAC, 17% Remodeling, 7% Roofing, 5% Construction, 4% Basements, 4% Kitchen and Bathrooms, 3% Pools, 2% Others, 9% $13T U.S. Personal Consumption Expenditure (Inclusive of U.S. e-commerce) $800B+ Existing + Adjacent Markets $600B+ Existing Markets Elective Healthcare Appliance
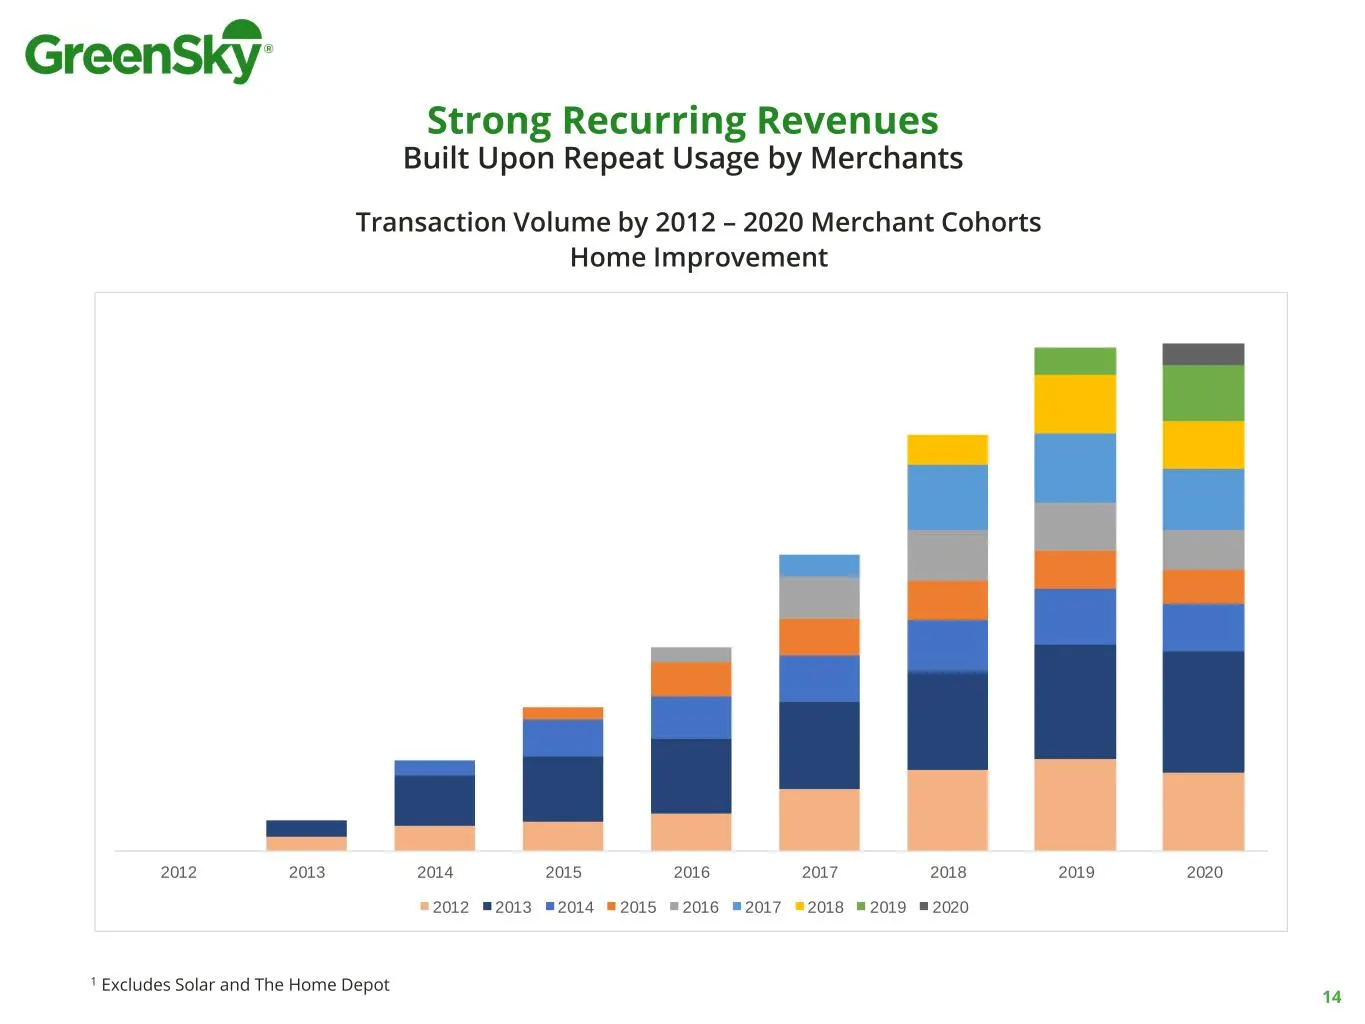
Slide 14: Strong Recurring Revenues Built Upon Repeat Usage by Merchants
Strong Recurring Revenues Built Upon Repeat Usage by Merchants 1 Excludes Solar and The Home Depot 14 2012 2013 2014 2015 2016 2017 2018 2019 2020 2012 2013 2014 2015 2016 2017 2018 2019 2020 Transaction Volume by 2012 – 2020 Merchant Cohorts Home Improvement
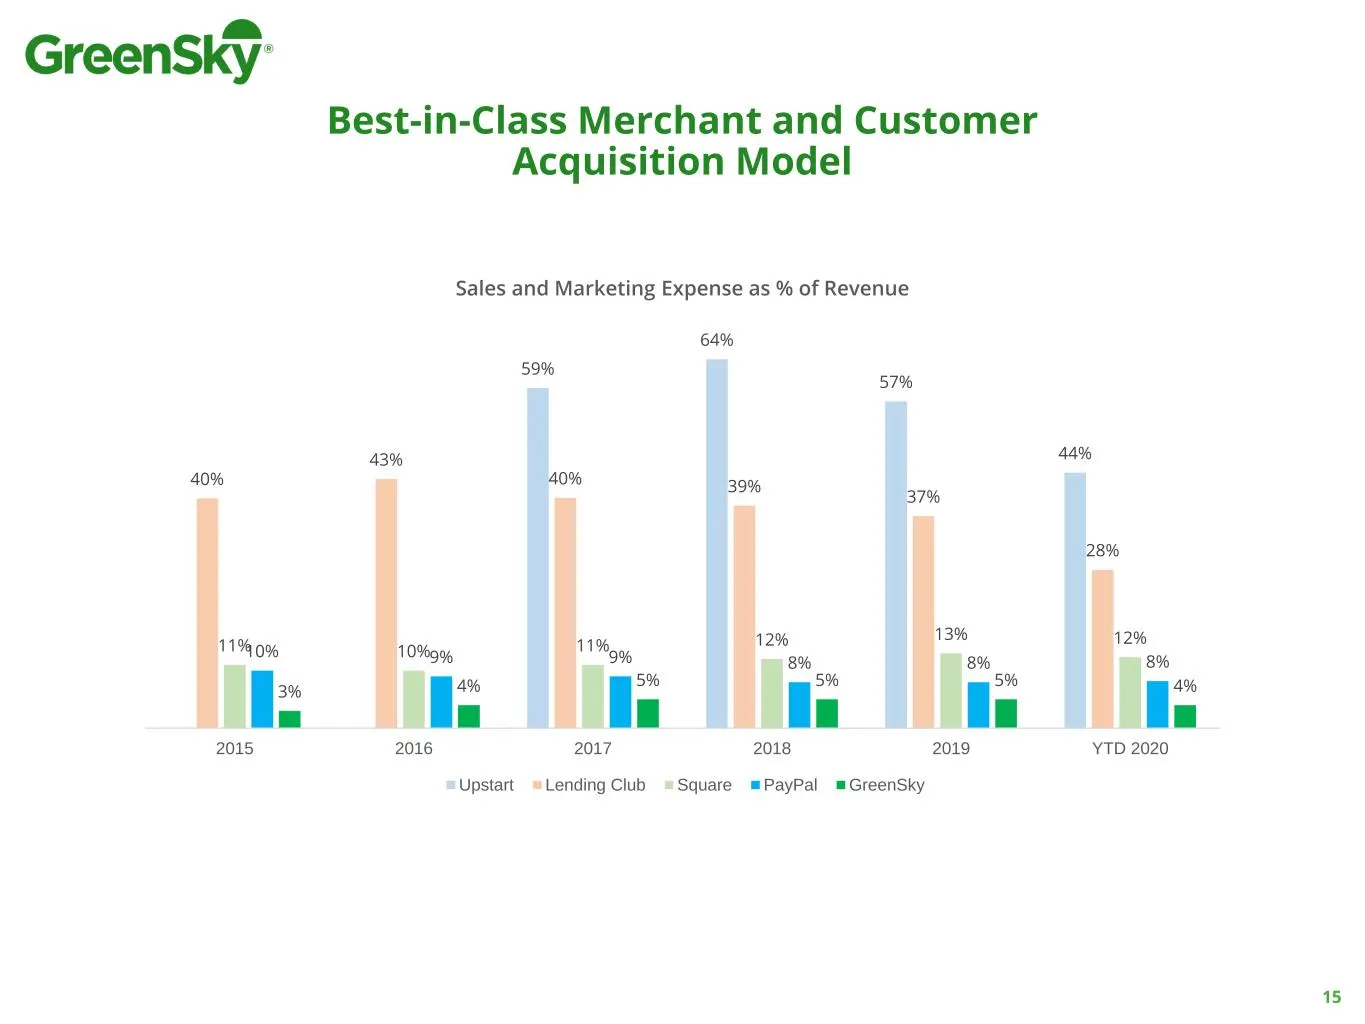
Slide 15: Best-in-Class Merchant and Customer Acquisition Model
Best-in-Class Merchant and Customer Acquisition Model 15 59% 64% 57% 44% 40% 43% 40% 39% 37% 28% 11% 10% 11% 12% 13% 12% 10% 9% 9% 8% 8% 8% 3% 4% 5% 5% 5% 4% 2015 2016 2017 2018 2019 YTD 2020 Sales and Marketing Expense as % of Revenue Upstart Lending Club Square PayPal GreenSky
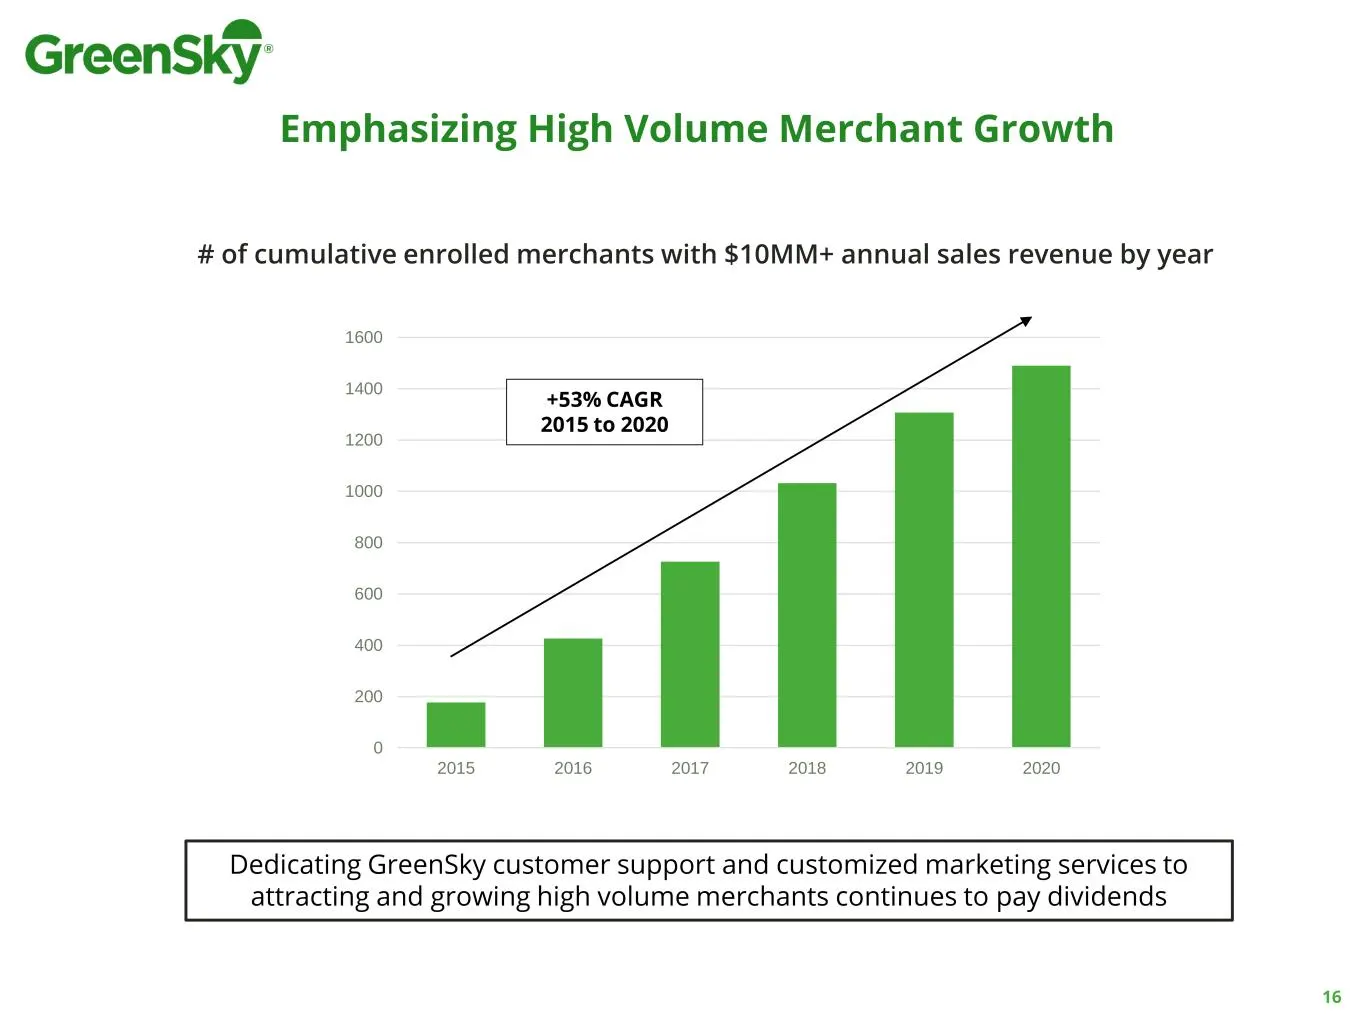
Slide 16: Emphasizing High Volume Merchant Growth
0 200 400 600 800 1000 1200 1400 1600 2015 2016 2017 2018 2019 2020 Emphasizing High Volume Merchant Growth # of cumulative enrolled merchants with $10MM+ annual sales revenue by year +53% CAGR 2015 to 2020 Dedicating GreenSky customer support and customized marketing services to attracting and grow
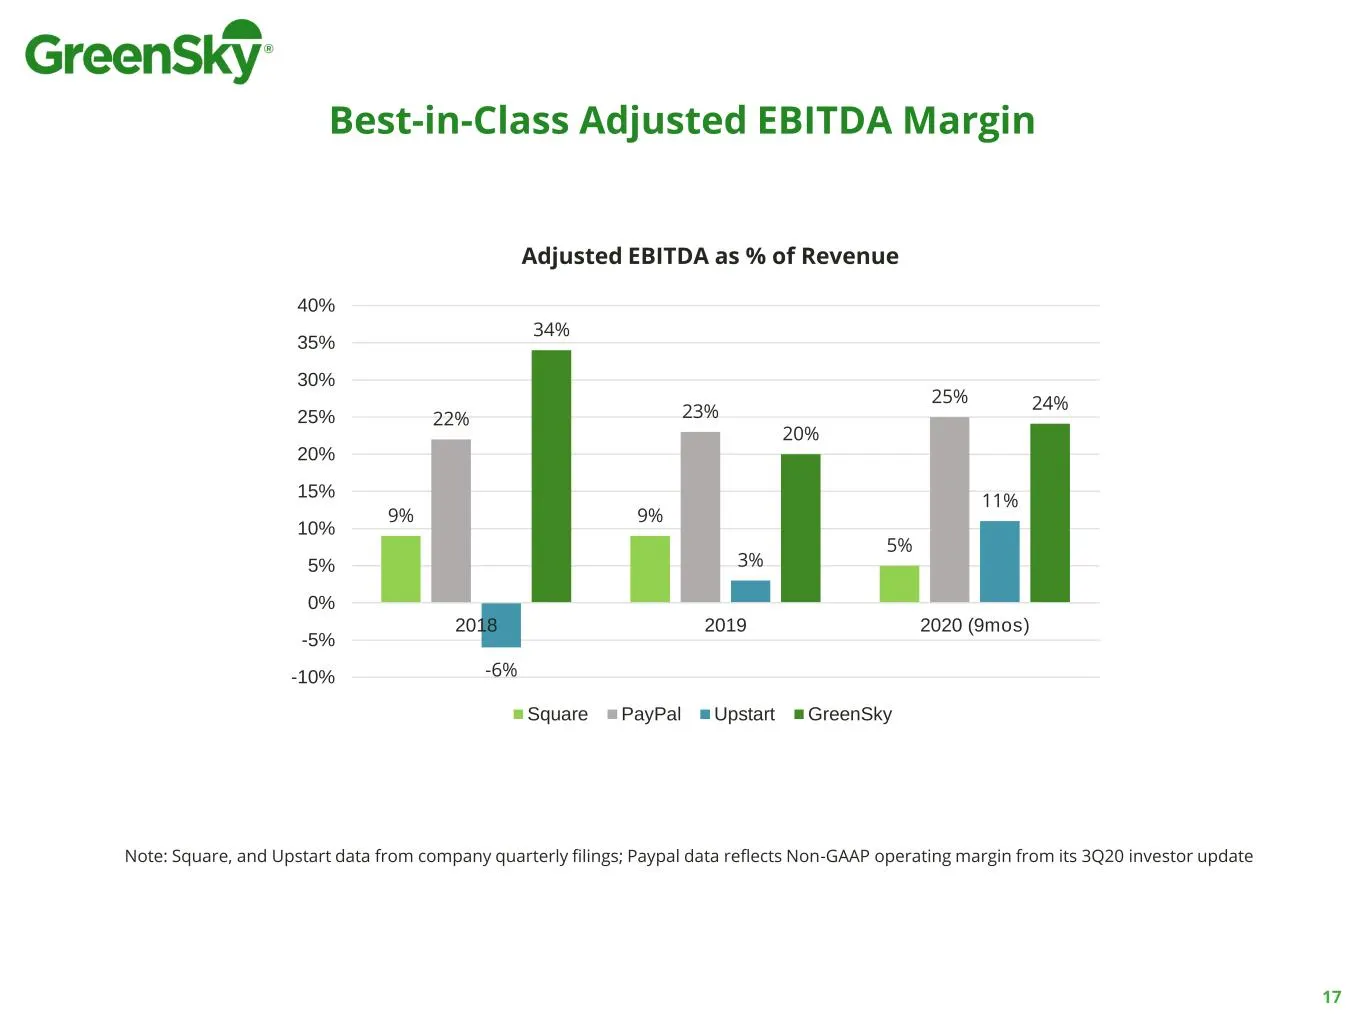
Slide 17: Best-in-Class Adjusted EBITDA Margin
Best-in-Class Adjusted EBITDA Margin Note: Square, and Upstart data from company quarterly filings; Paypal data reflects Non-GAAP operating margin from its 3Q20 investor update 17 9% 9% 5% 22% 23% 25% -6% 3% 11% 34% 20% 24% -10% -5% 0% 5% 10% 15% 20% 25% 30% 35% 40% 2018 2019 2020 (9mos) Adjusted EB
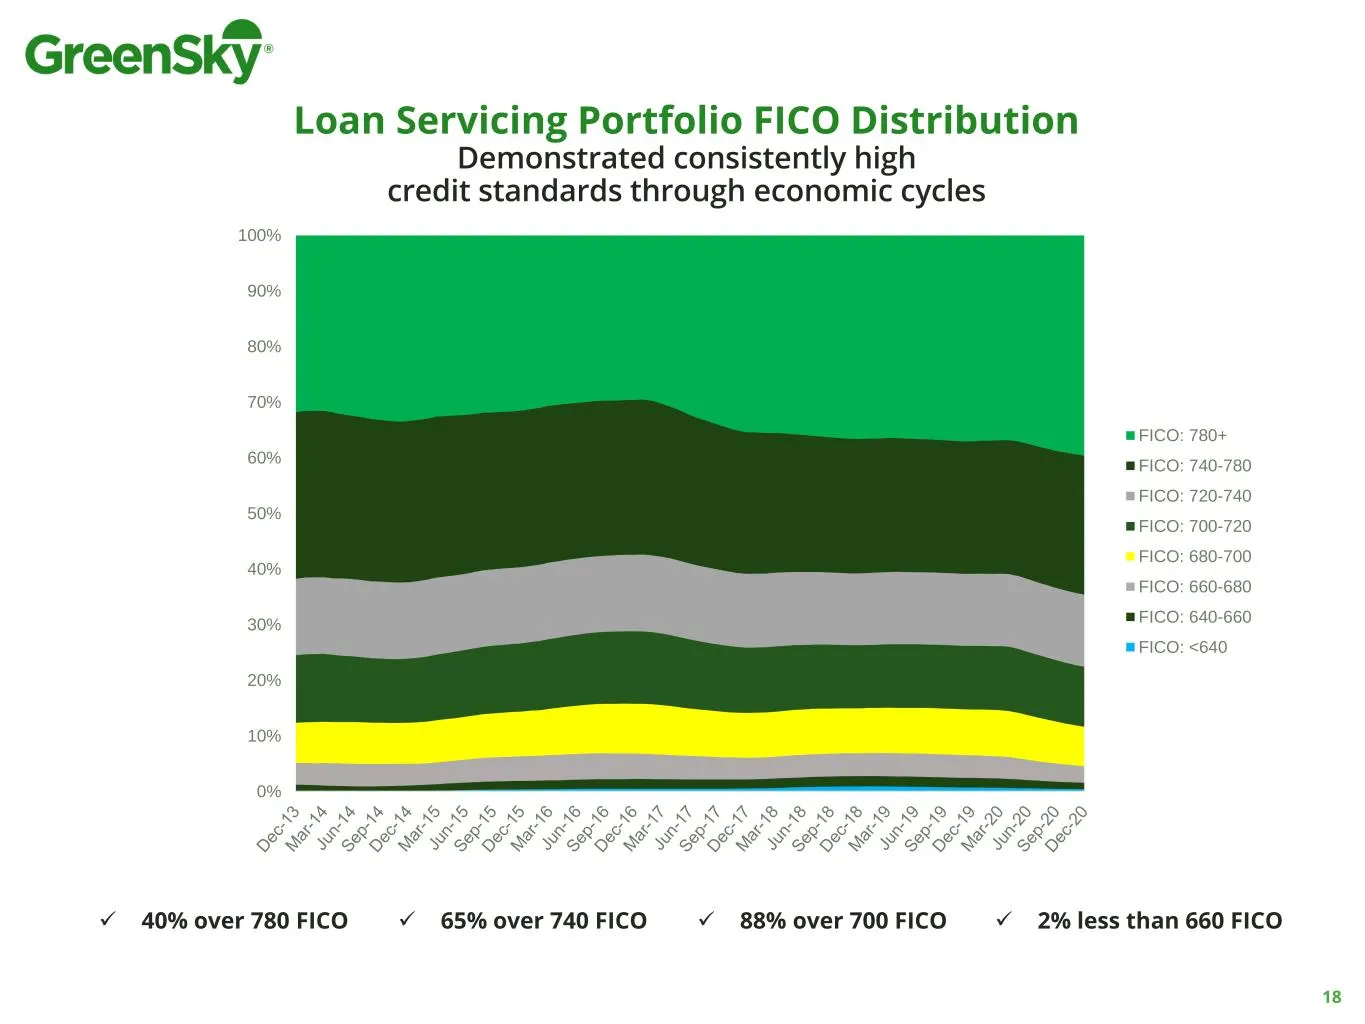
Slide 18: Loan Servicing Portfolio FICO Distribution
Loan Servicing Portfolio FICO Distribution Demonstrated consistently high credit standards through economic cycles ✓ 65% over 740 FICO ✓ 88% over 700 FICO ✓ 2% less than 660 FICO✓ 40% over 780 FICO 18 0% 10% 20% 30% 40% 50% 60% 70% 80% 90% 100% FICO: 780+ FICO: 740-780 FICO: 720-740 FICO: 700-720 FI
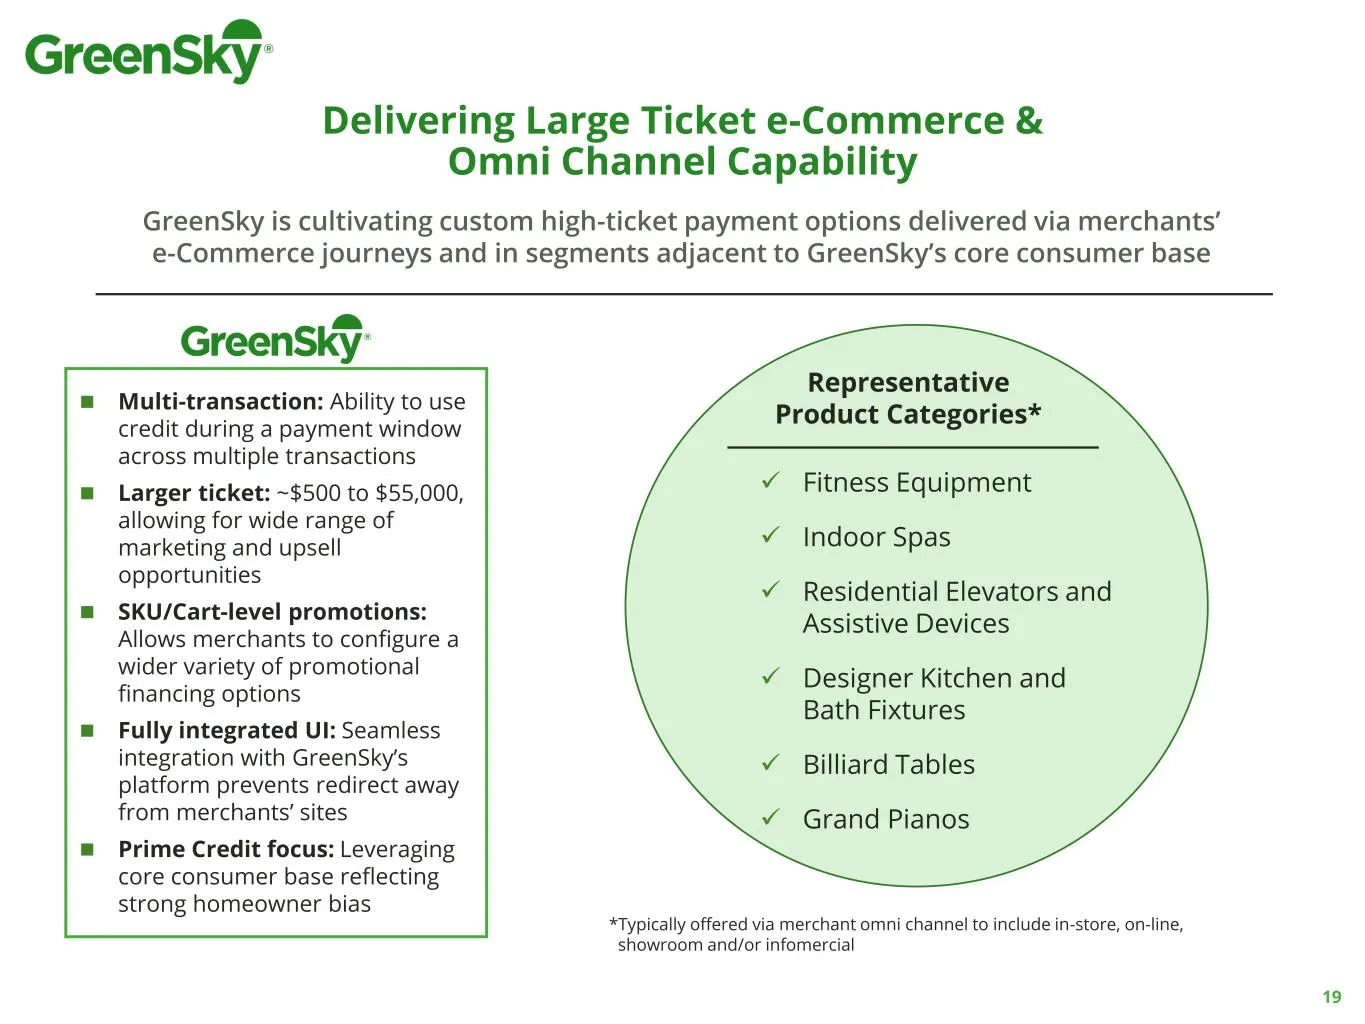
Slide 19: Large Ticket e-Commerce & Omni Channel Capability
19 GreenSky is cultivating custom high-ticket payment options delivered via merchants’ e-Commerce journeys and in segments adjacent to GreenSky’s core consumer base ◼ Multi-transaction: Ability to use credit during a payment window across multiple transactions ◼ Larger ticket: ~$500 to $55,000, allo
Slide 20: GreenSky Consumers Highly Interested in Other Financial Products
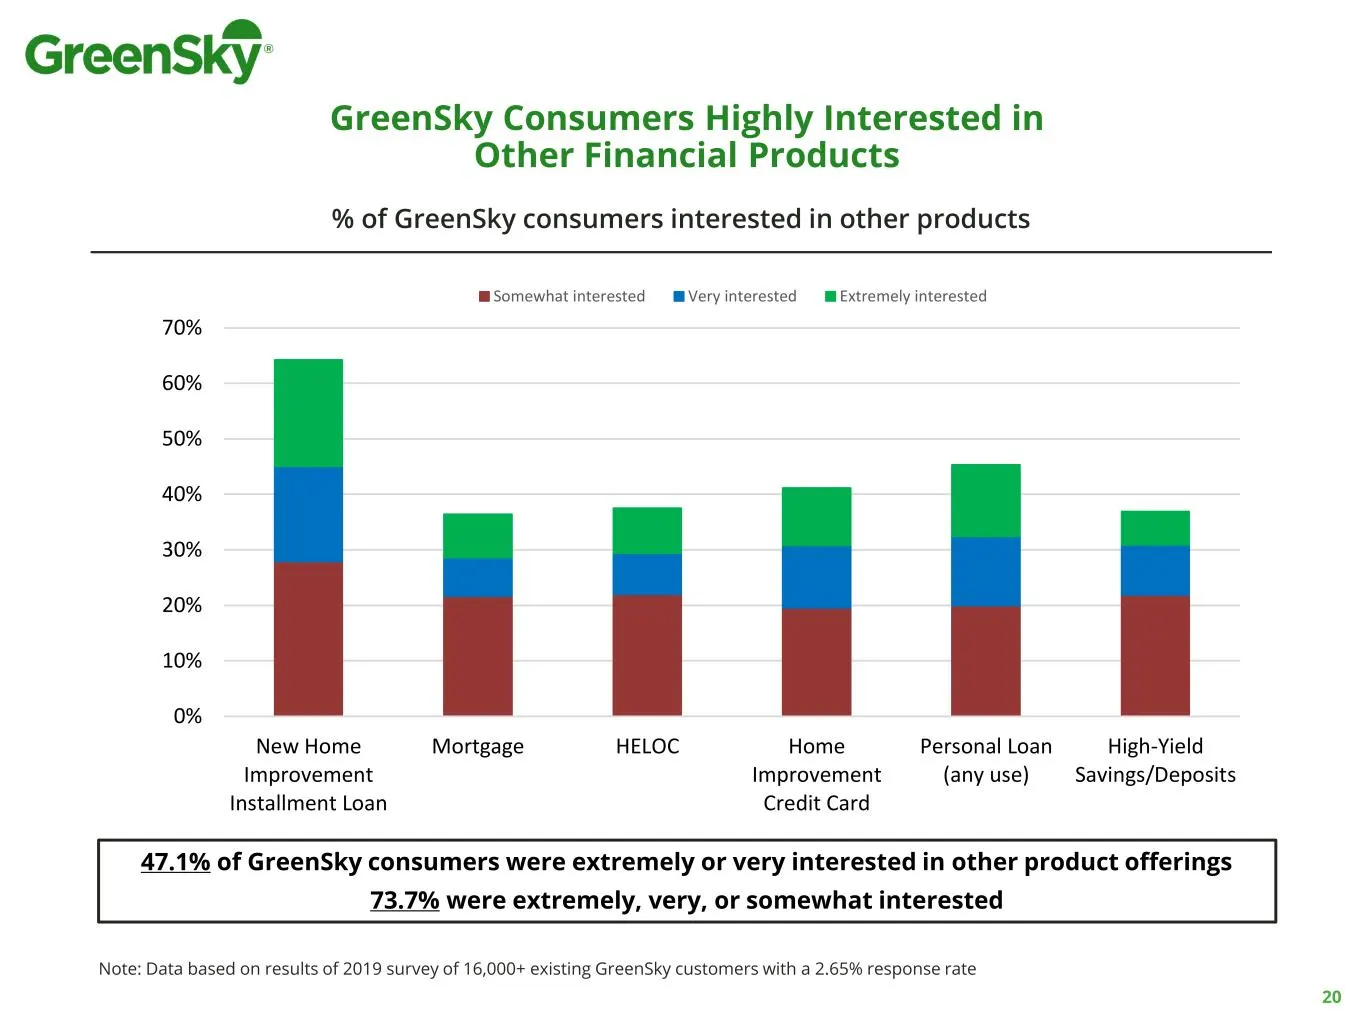
GreenSky Consumers Highly Interested in Other Financial Products 0% 10% 20% 30% 40% 50% 60% 70% New Home Improvement Installment Loan Mortgage HELOC Home Improvement Credit Card Personal Loan (any use) High-Yield Savings/Deposits % of GreenSky Customers Interested in Other Products Somewhat interest
Slide 21: Key Investment Considerations
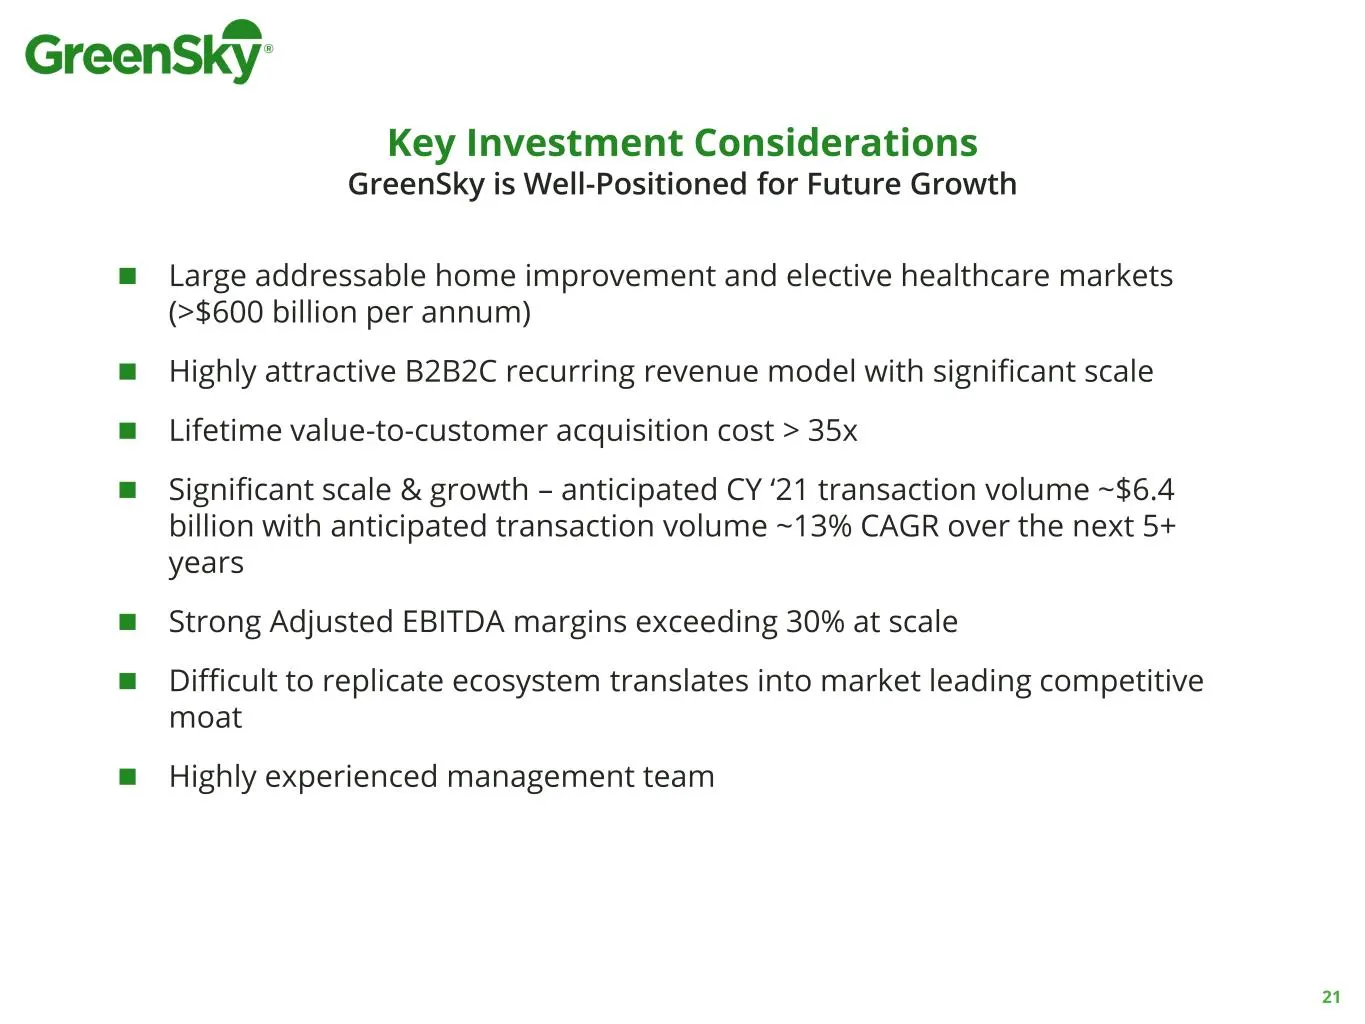
Key Investment Considerations GreenSky is Well-Positioned for Future Growth ◼ Large addressable home improvement and elective healthcare markets (>$600 billion per annum) ◼ Highly attractive B2B2C recurring revenue model with significant scale ◼ Lifetime value-to-customer acquisition cost > 35x ◼ Si
Slide 22: GreenSky Value Proposition and Risk Management
Tim Kaliban President & Chief Risk Officer GreenSky Value Proposition and Risk Management
Slide 23: Proprietary Platform Delivers Best-in-Class User Experience
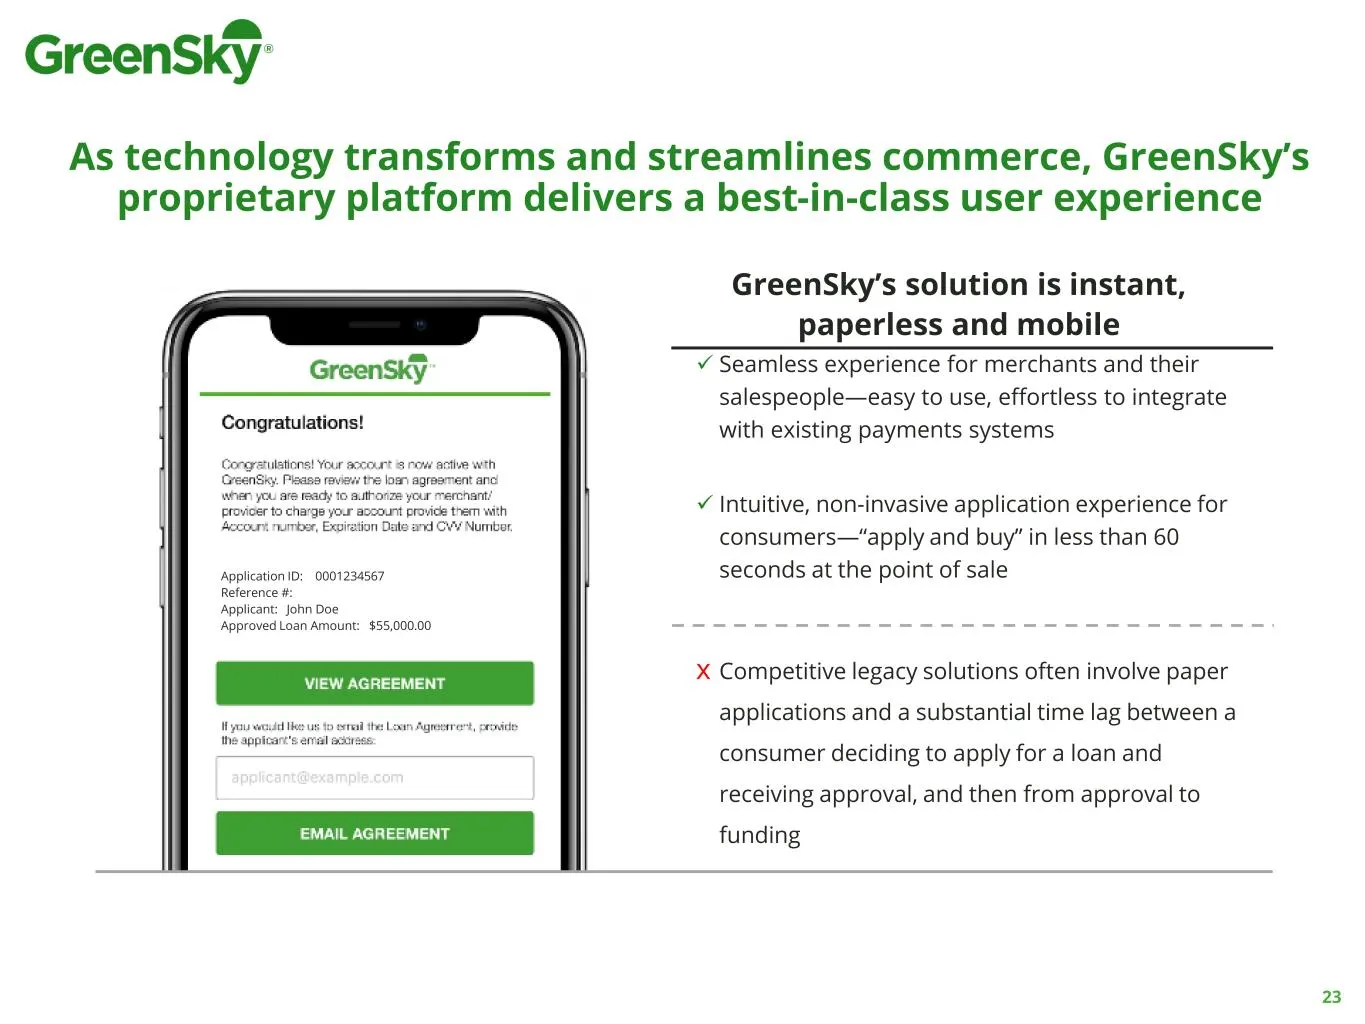
As technology transforms and streamlines commerce, GreenSky’s proprietary platform delivers a best-in-class user experience Application ID: 0001234567 Reference #: Applicant: John Doe Approved Loan Amount: $55,000.00 GreenSky’s solution is instant, paperless and mobile ✓ Seamless experience for merc
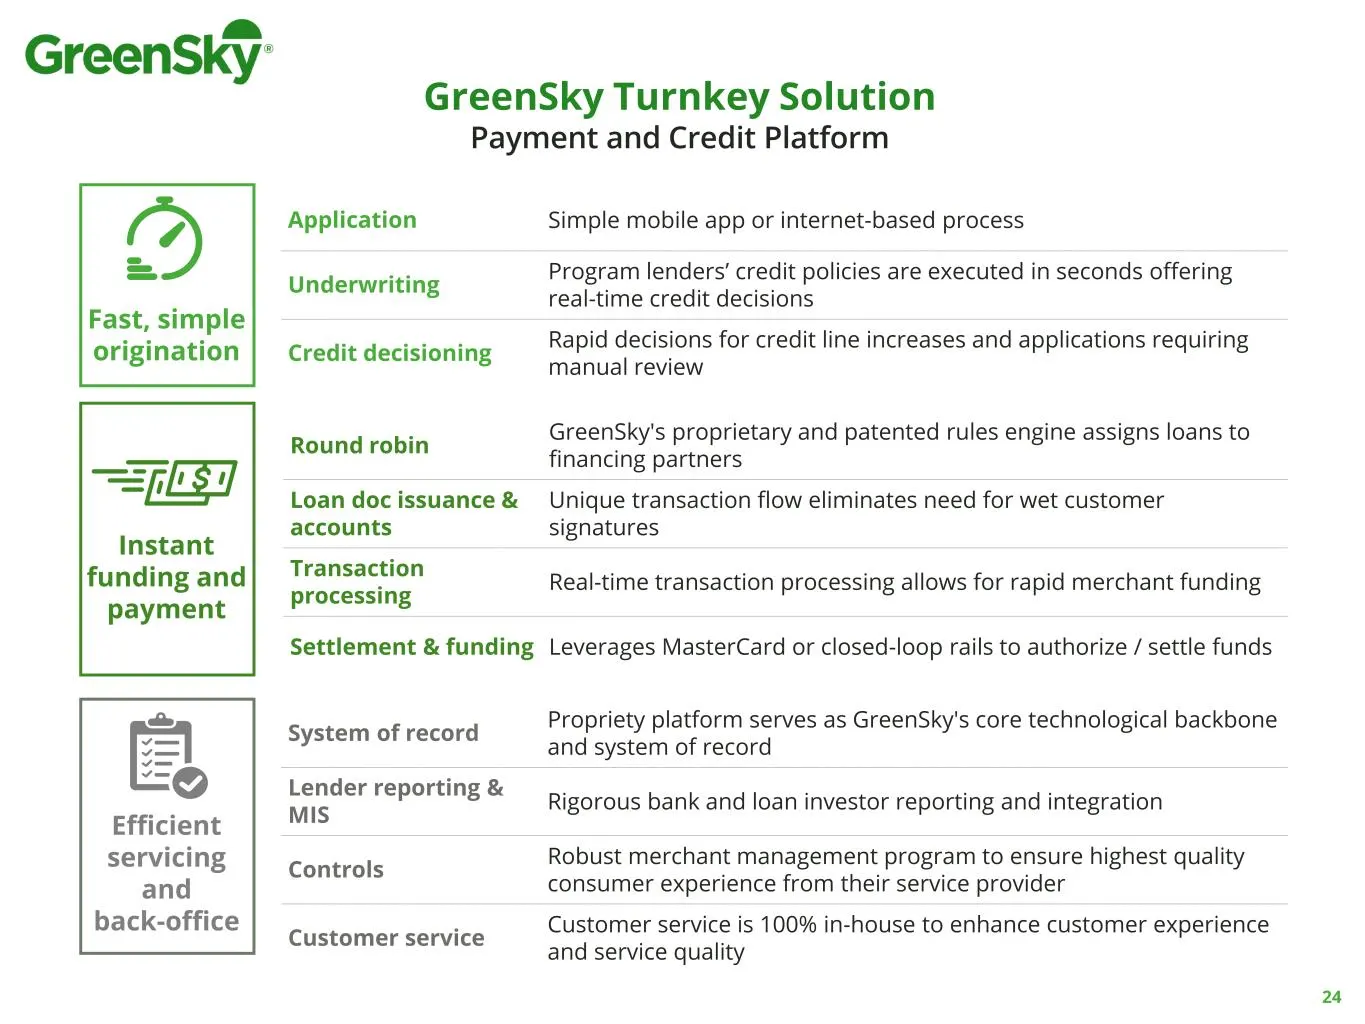
Slide 24: Loan Origination and Servicing Process
Application Simple mobile app or internet-based process Underwriting Program lenders’ credit policies are executed in seconds offering real-time credit decisions Credit decisioning Rapid decisions for credit line increases and applications requiring manual review Round robin GreenSky's proprietary a
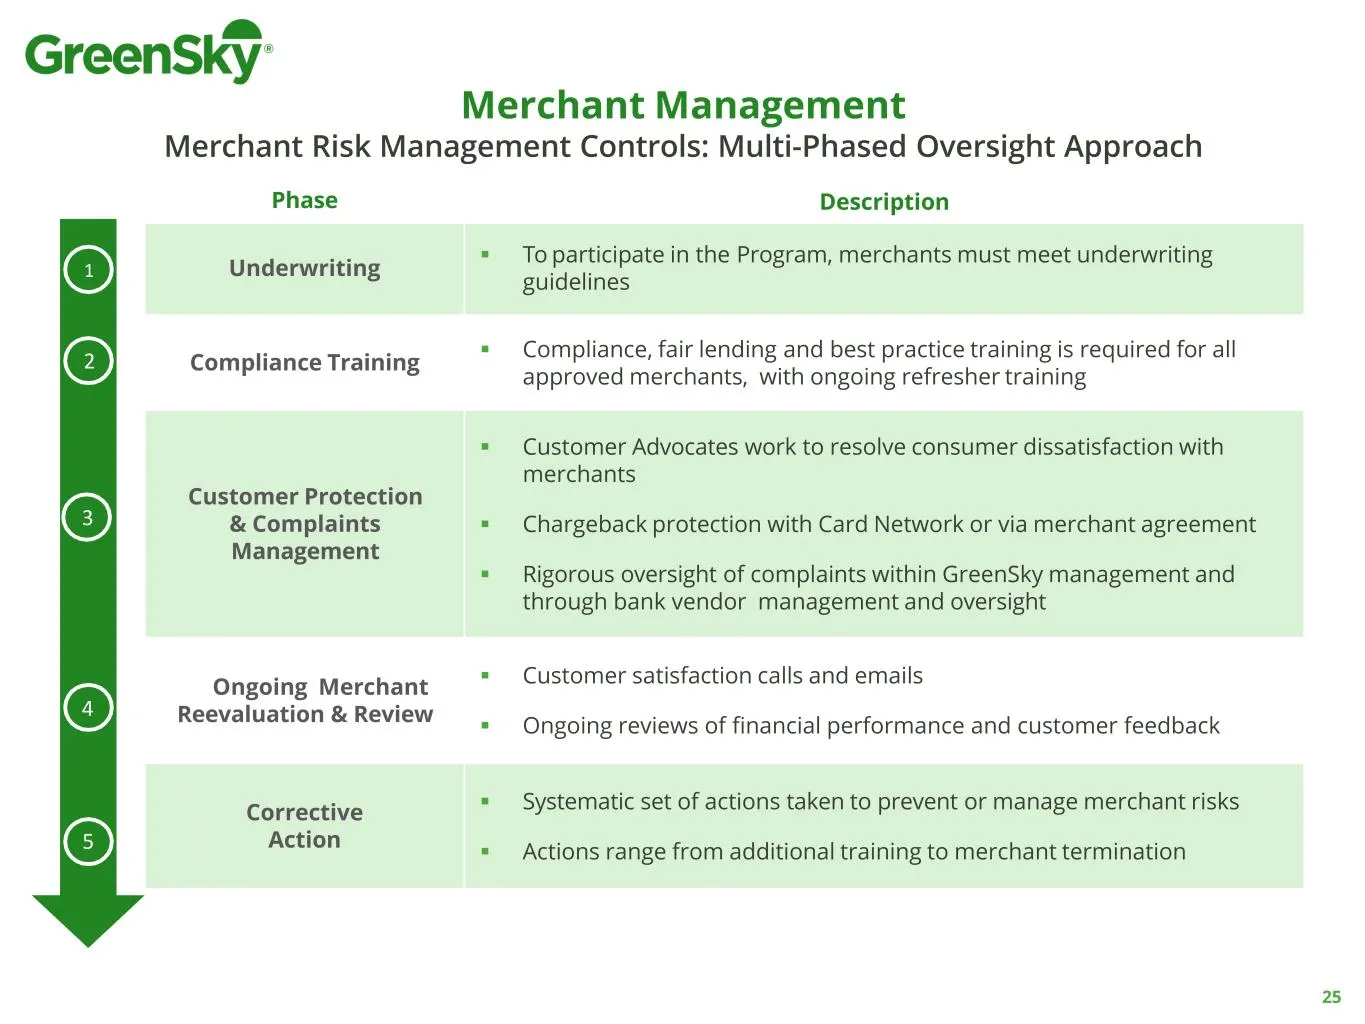
Slide 25: Merchant Management and Risk Management
Phase Description Underwriting ▪ To participate in the Program, merchants must meet underwriting guidelines Compliance Training ▪ Compliance, fair lending and best practice training is required for all approved merchants, with ongoing refresher training Customer Protection & Complaints Management ▪
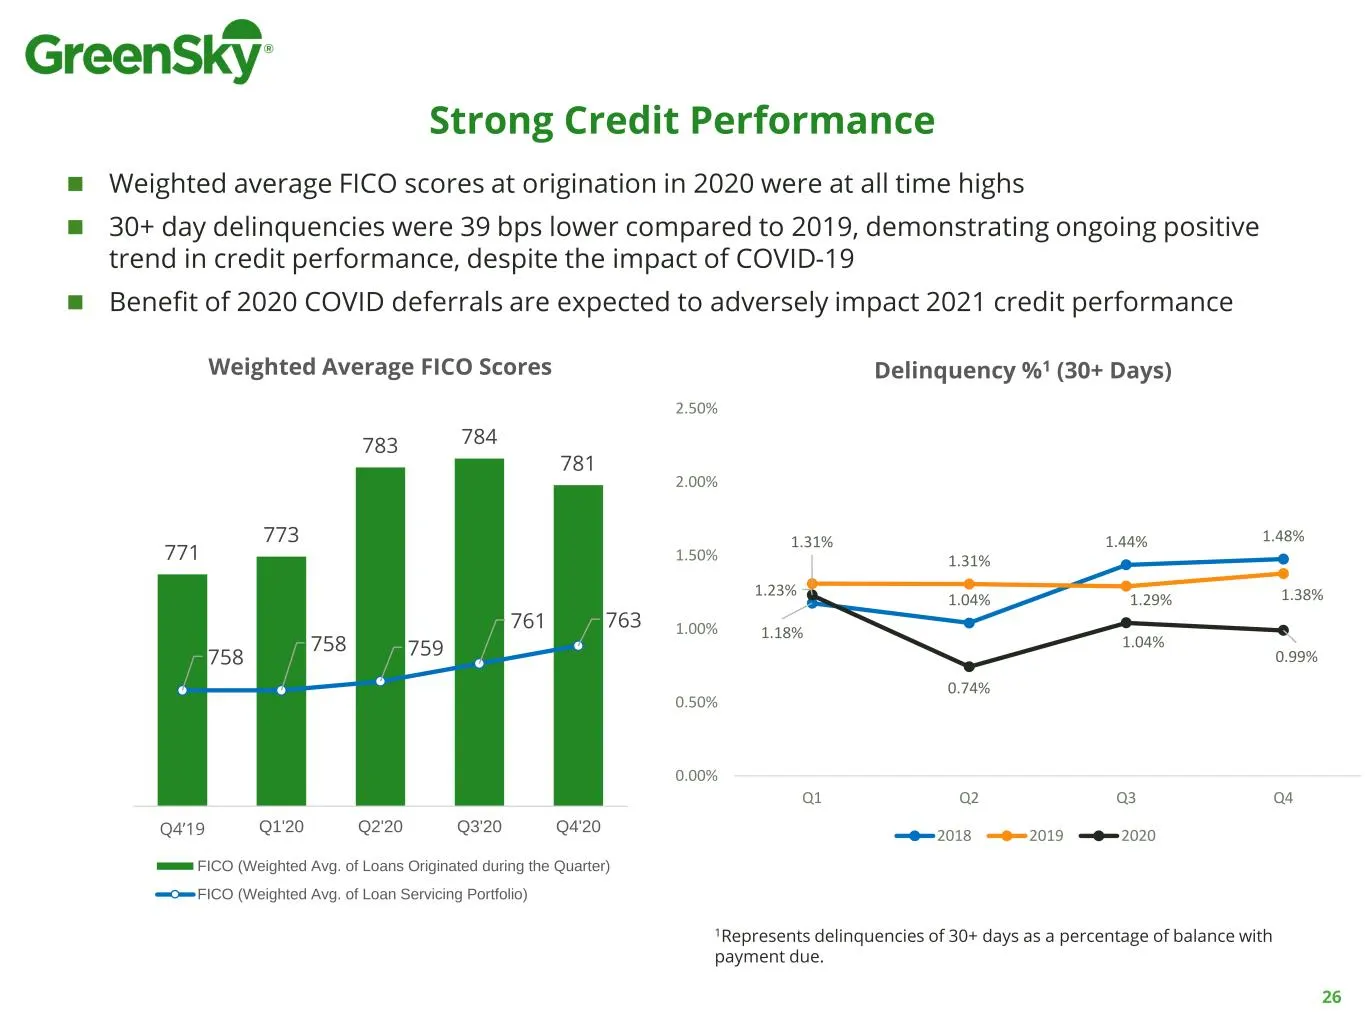
Slide 26: Strong Credit Performance
Strong Credit Performance ◼ Weighted average FICO scores at origination in 2020 were at all time highs ◼ 30+ day delinquencies were 39 bps lower compared to 2019, demonstrating ongoing positive trend in credit performance, despite the impact of COVID-19 ◼ Benefit of 2020 COVID deferrals are expected
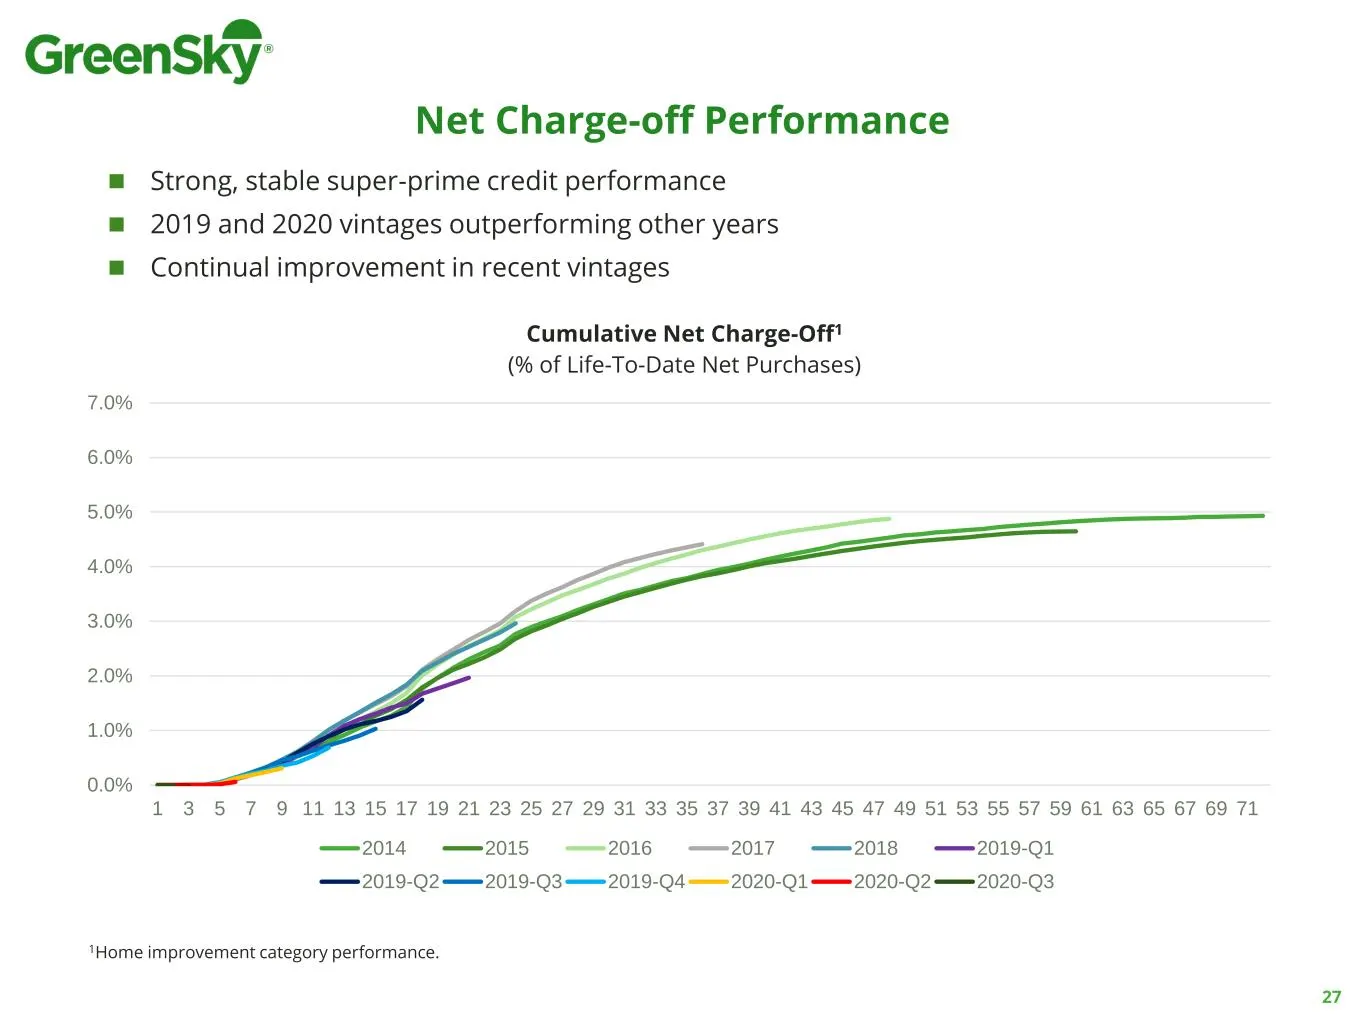
Slide 27: Net Charge-off Performance
Net Charge-off Performance ◼ Strong, stable super-prime credit performance ◼ 2019 and 2020 vintages outperforming other years ◼ Continual improvement in recent vintages 27 0.0% 1.0% 2.0% 3.0% 4.0% 5.0% 6.0% 7.0% 1 3 5 7 9 11 13 15 17 19 21 23 25 27 29 31 33 35 37 39 41 43 45 47 49 51 53 55 57 59 61
Slide 28: Technology Overview
Minaz Vastani Chief Technology Officer Technology Overview
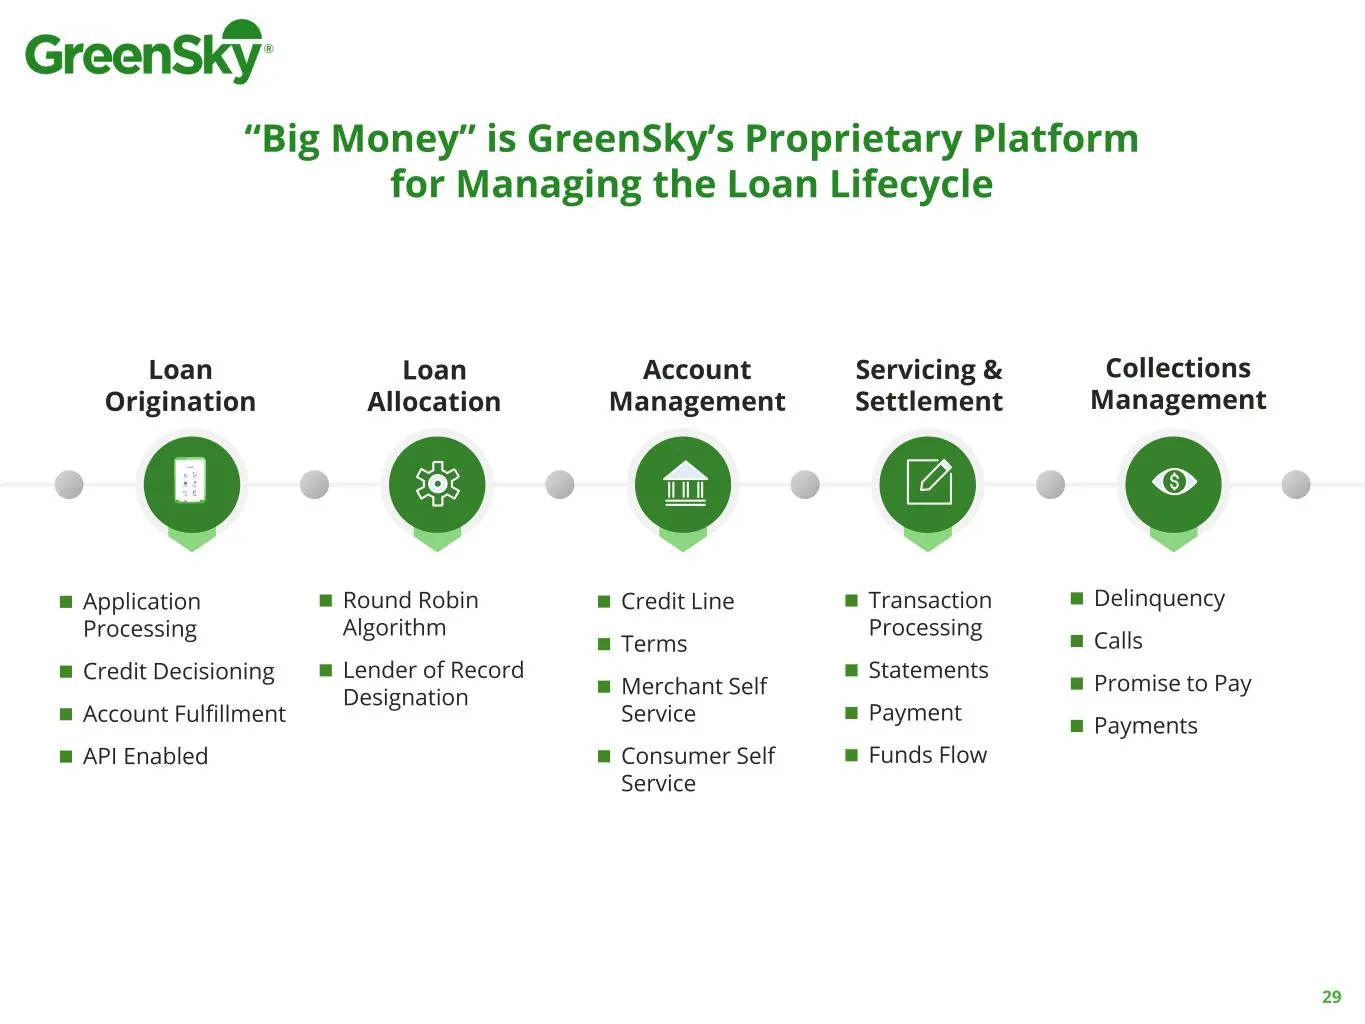
Slide 29: Big Money Proprietary Platform for Managing the Loan Lifecycle
◼ Round Robin Algorithm ◼ Lender of Record Designation Loan Allocation ◼ Credit Line ◼ Terms ◼ Merchant Self Service ◼ Consumer Self Service Account Management ◼ Transaction Processing ◼ Statements ◼ Payment ◼ Funds Flow Servicing & Settlement ◼ Application Processing ◼ Credit Decisioning ◼ Account
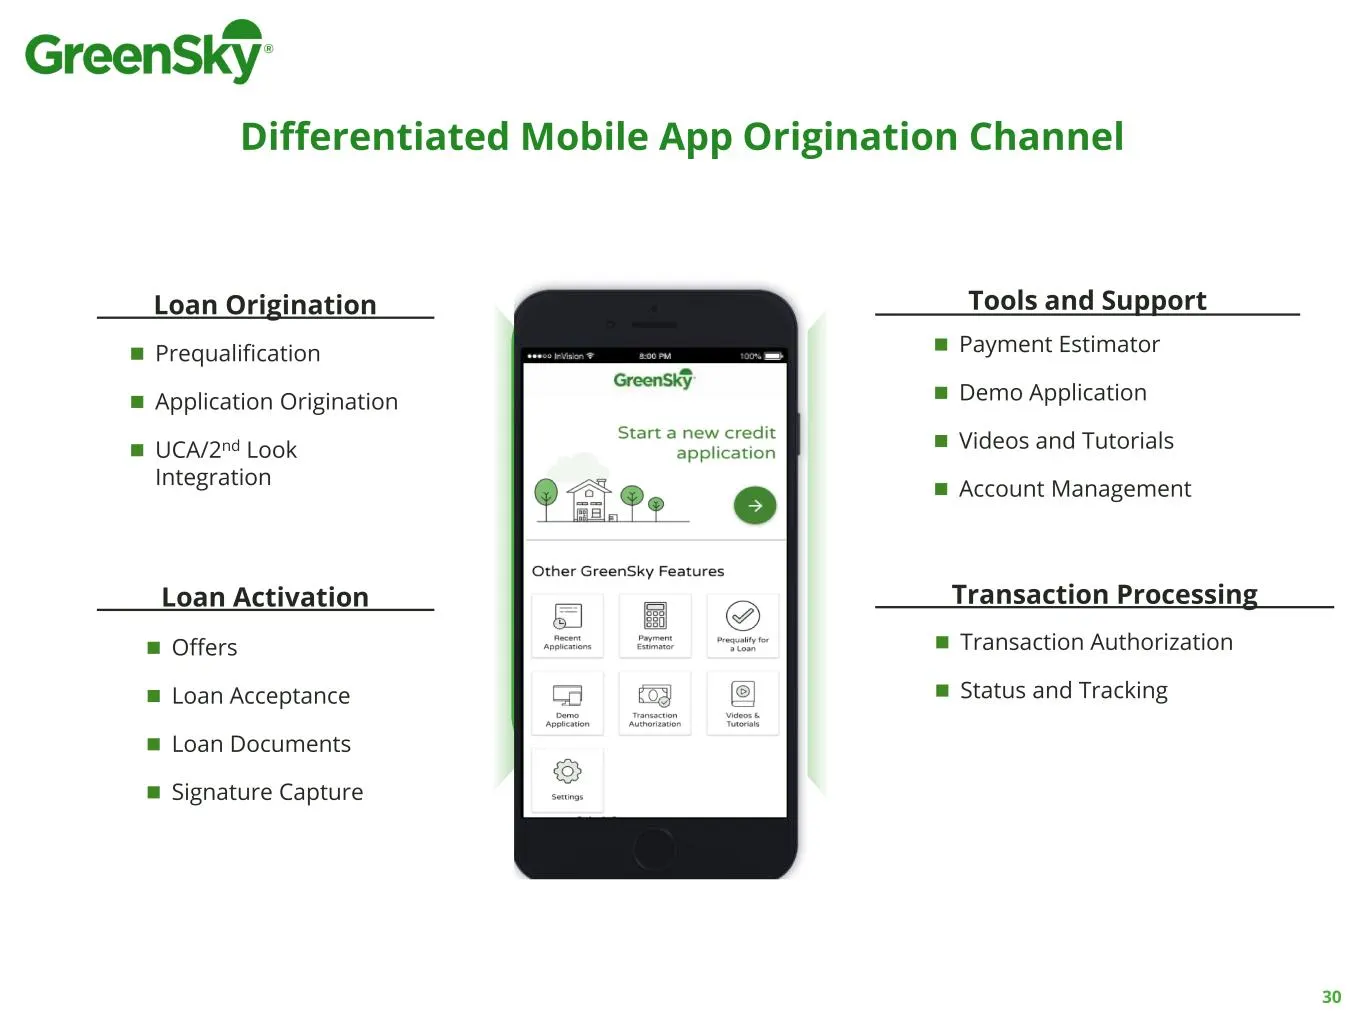
Slide 30: Differentiated Mobile App Origination Channel
Differentiated Mobile App Origination Channel Loan Origination Transaction ProcessingLoan Activation Tools and Support ◼ Prequalification ◼ Application Origination ◼ UCA/2nd Look Integration ◼ Transaction Authorization ◼ Status and Tracking ◼ Offers ◼ Loan Acceptance ◼ Loan Documents ◼ Signature Cap
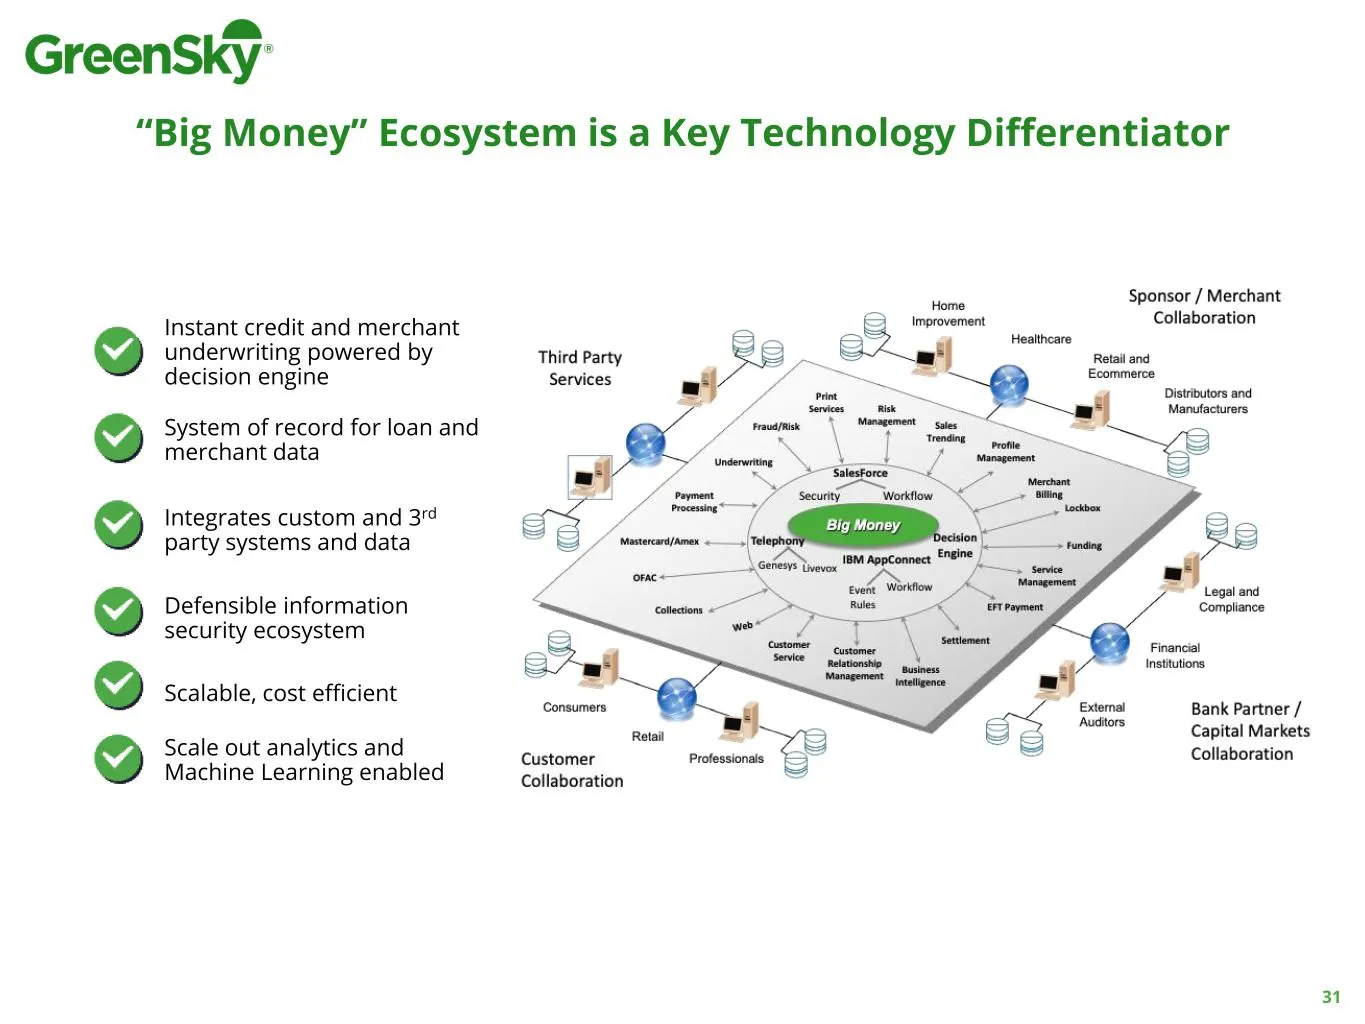
Slide 31: Big Money Ecosystem is a Key Technology Differentiator
“Big Money” Ecosystem is a Key Technology Differentiator Instant credit and merchant underwriting powered by decision engine System of record for loan and merchant data Integrates custom and 3rd party systems and data Defensible information security ecosystem Scalable, cost efficient Scale out analy
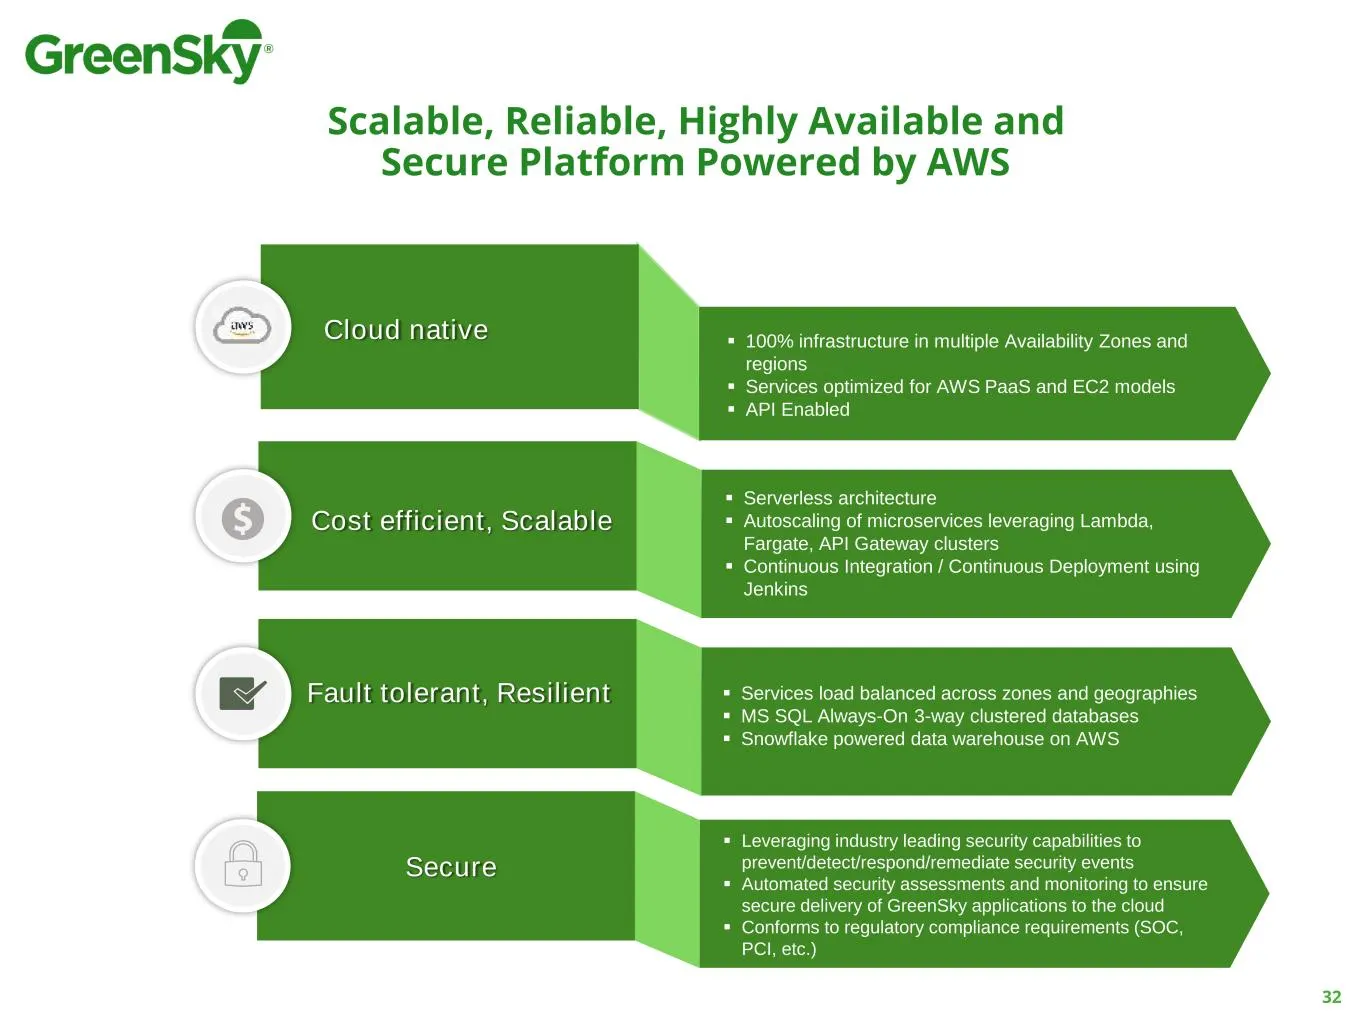
Slide 32: Scalable, Reliable, Highly Available and Secure Platform Powered by AWS
32 Scalable, Reliable, Highly Available and Secure Platform Powered by AWS Cloud native ▪ 100% infrastructure in multiple Availability Zones and regions ▪ Services optimized for AWS PaaS and EC2 models ▪ API Enabled Cost efficient, Scalable ▪ Serverless architecture ▪ Autoscaling of microservices le
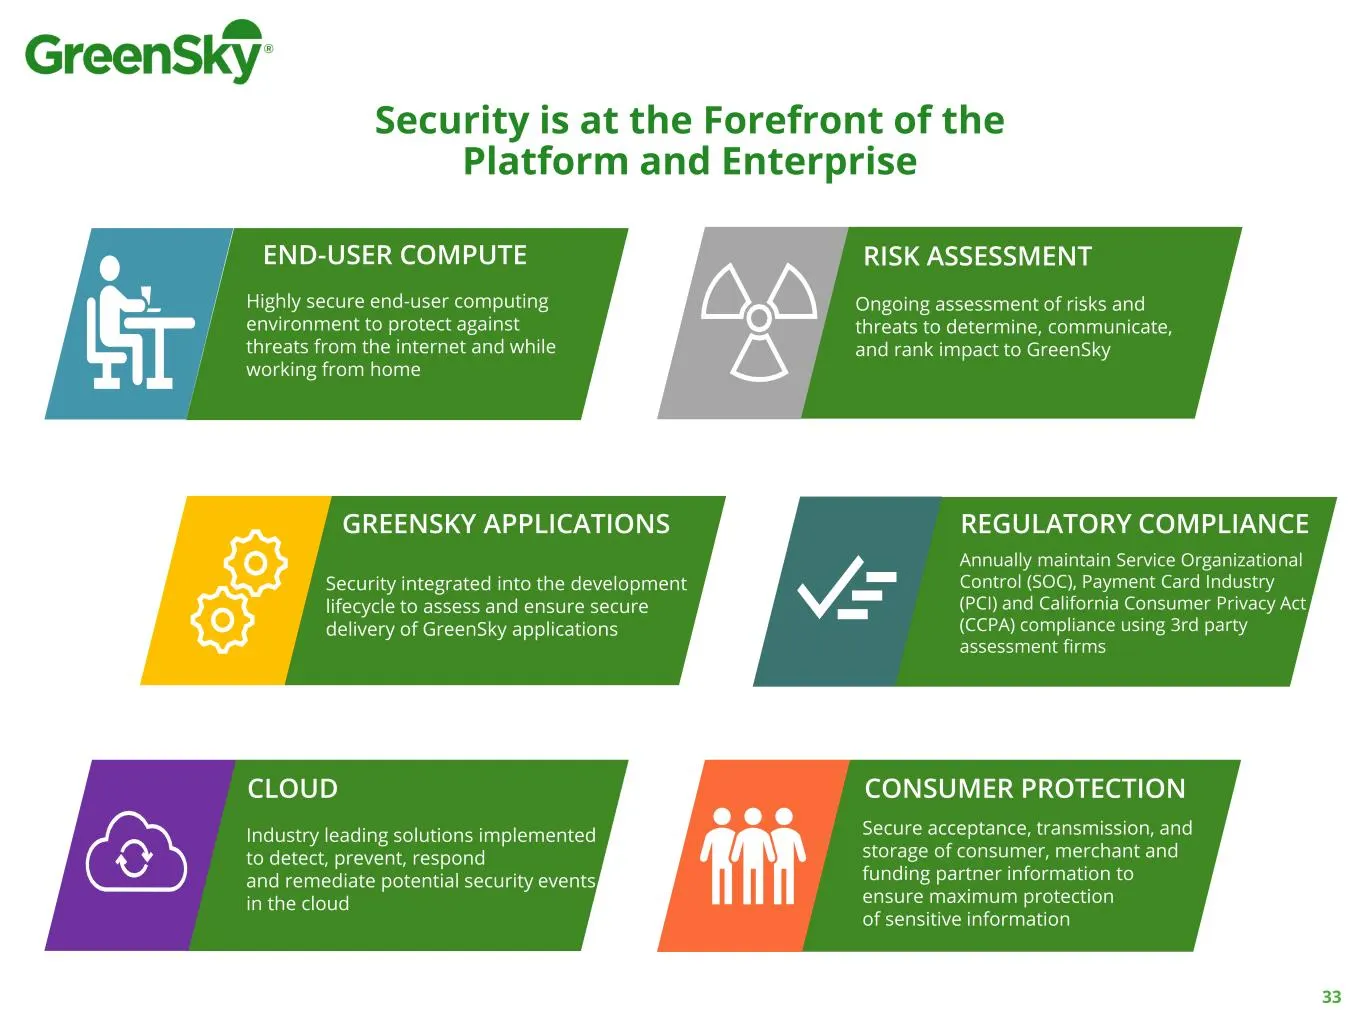
Slide 33: Security is at the Forefront
33 Highly secure end-user computing environment to protect against threats from the internet and while working from home END-USER COMPUTE Industry leading solutions implemented to detect, prevent, respond and remediate potential security events in the cloud CLOUD REGULATORY COMPLIANCE Annually maint
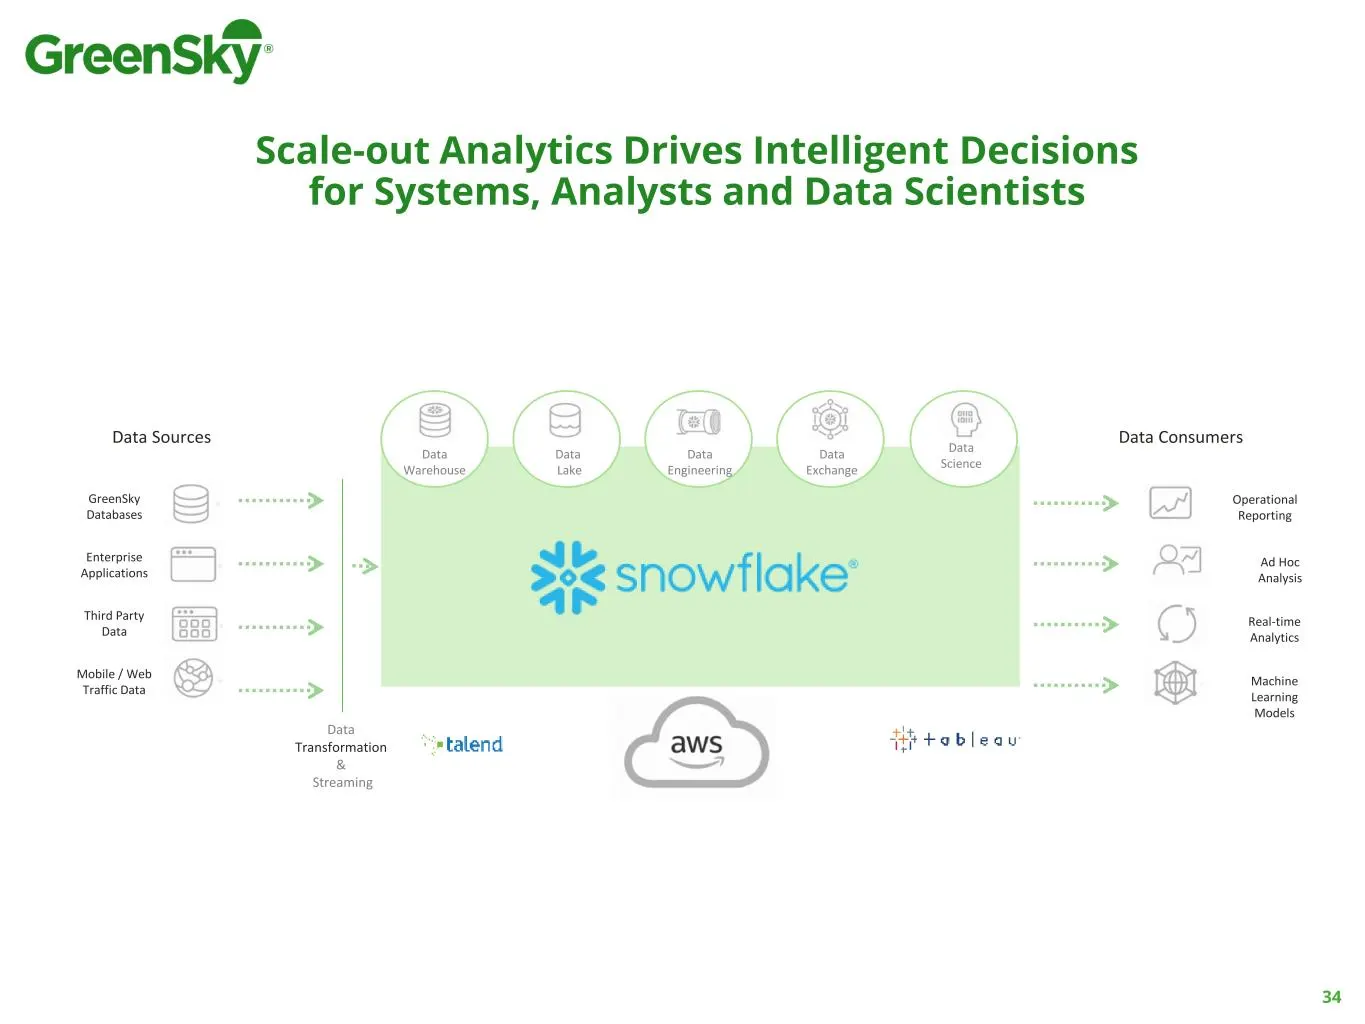
Slide 34: Scale-out Analytics Drives Intelligent Decisions
Scale-out Analytics Drives Intelligent Decisions for Systems, Analysts and Data Scientists Data Warehouse Data Lake Data Engineering Data Science Data Exchange Data Sources Data Consumers GreenSky Databases Enterprise Applications Third Party Data Mobile / Web Traffic Data Operational Reporting Ad H
Slide 35: Elective Healthcare
Dennis Kelly President, Patient Solutions Elective Healthcare
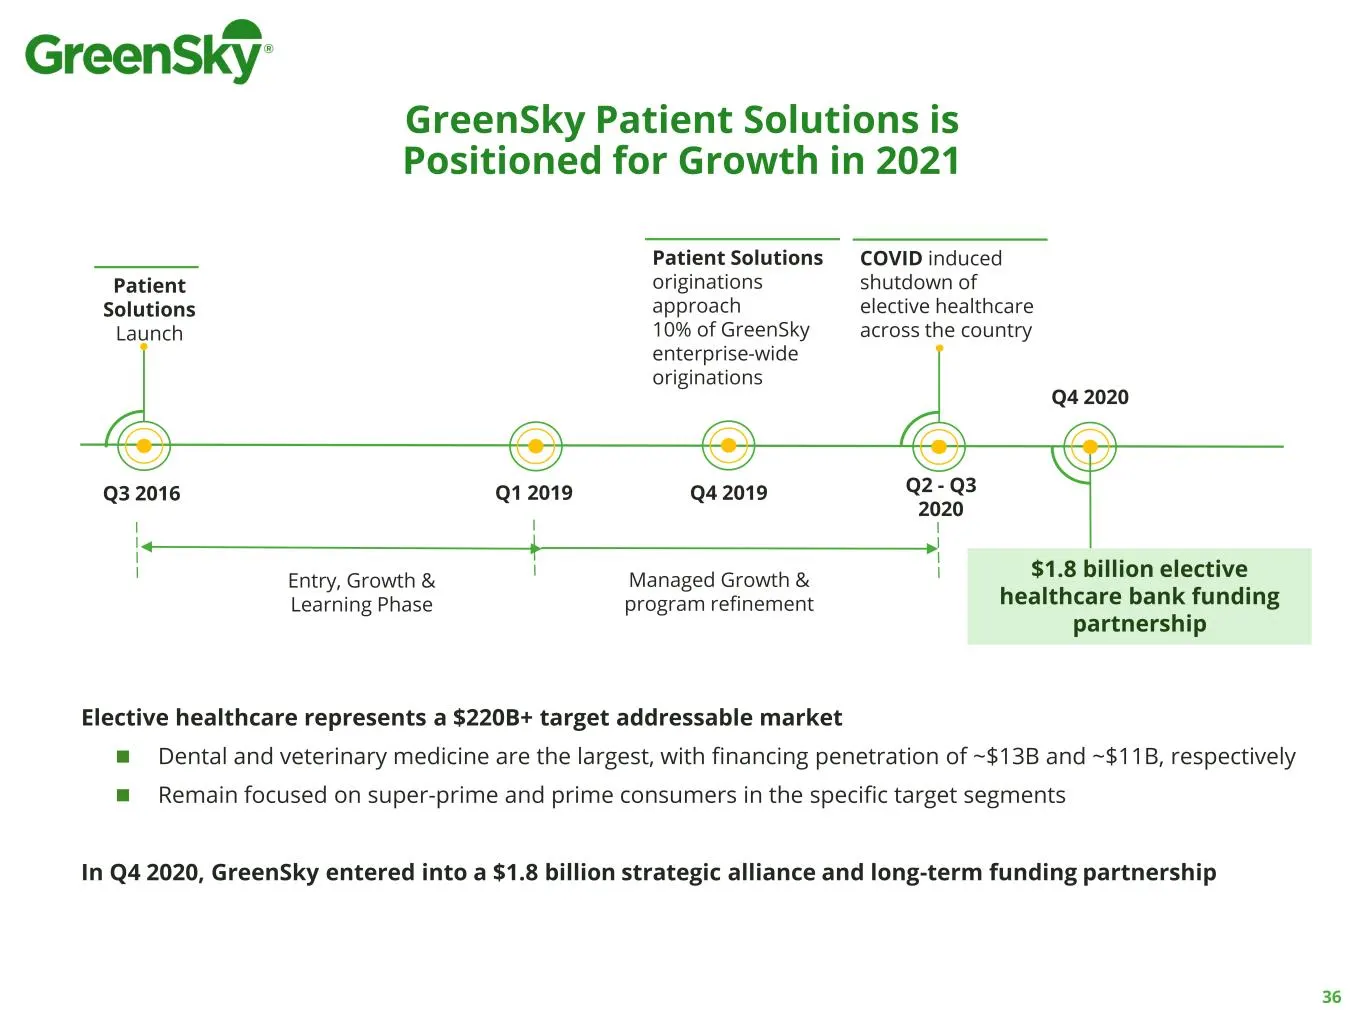
Slide 36: GreenSky Patient Solutions is Positioned for Growth in 2021
GreenSky Patient Solutions is Positioned for Growth in 2021 Q3 2016 Patient Solutions Launch Entry, Growth & Learning Phase Managed Growth & program refinement Q2 - Q3 2020 COVID induced shutdown of elective healthcare across the country Q4 2020 $1.8 billion elective healthcare bank funding partners
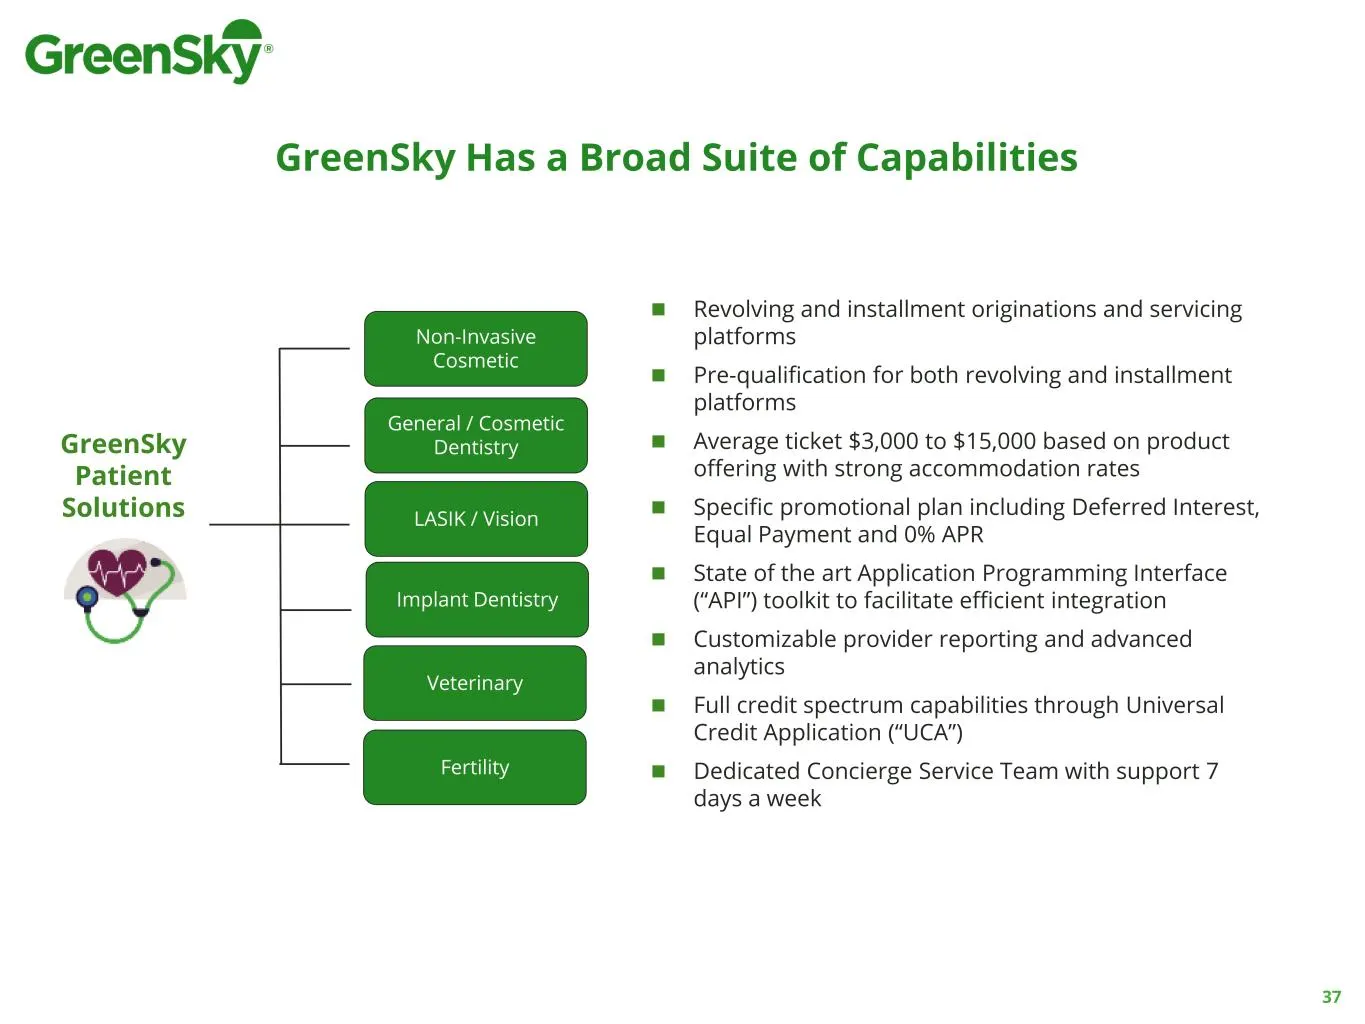
Slide 37: GreenSky Has a Broad Suite of Capabilities
GreenSky Has a Broad Suite of Capabilities ◼ Revolving and installment originations and servicing platforms ◼ Pre-qualification for both revolving and installment platforms ◼ Average ticket $3,000 to $15,000 based on product offering with strong accommodation rates ◼ Specific promotional plan includ
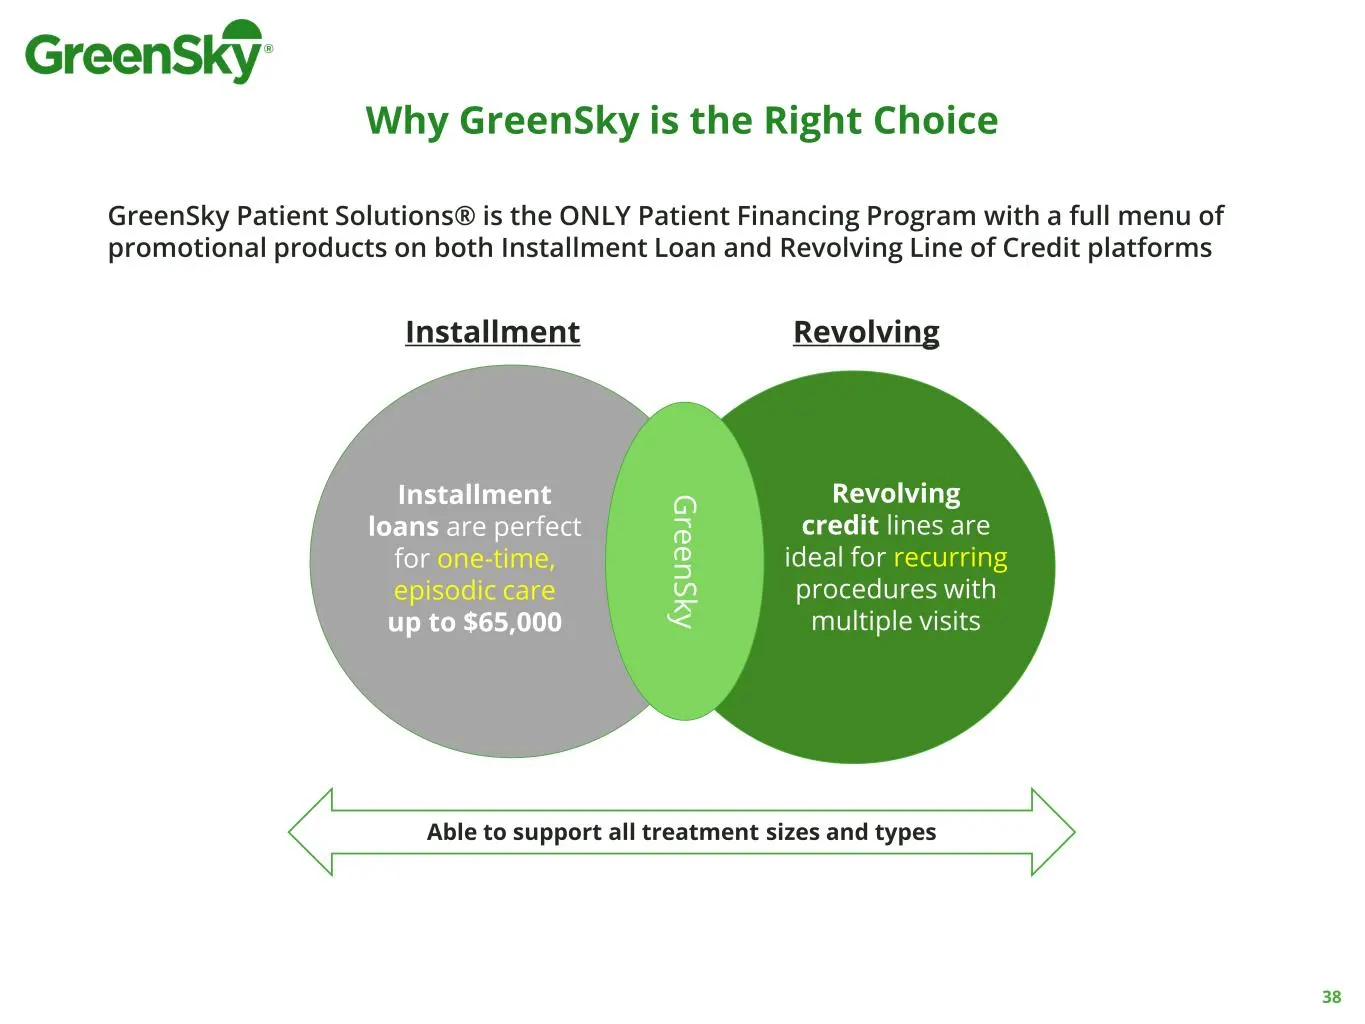
Slide 38: Why GreenSky is the Right Choice
Why GreenSky is the Right Choice GreenSky Patient Solutions® is the ONLY Patient Financing Program with a full menu of promotional products on both Installment Loan and Revolving Line of Credit platforms Installment Installment loans are perfect for one-time, episodic care up to $65,000 Revolving cr
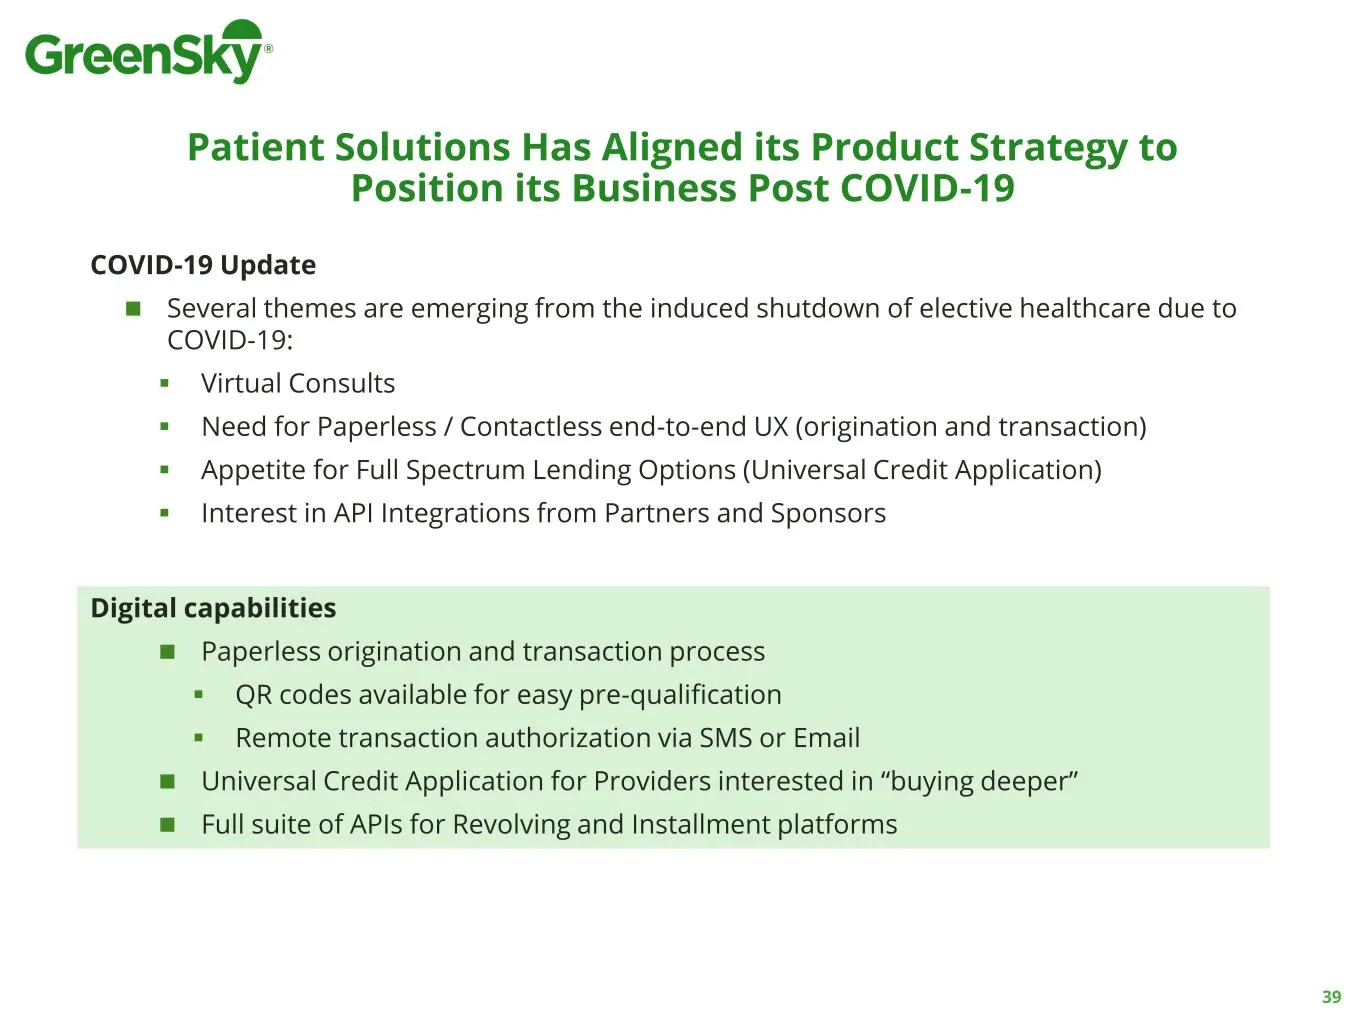
Slide 39: Patient Solutions Product Strategy Post COVID-19
Patient Solutions Has Aligned its Product Strategy to Position its Business Post COVID-19 COVID-19 Update ◼ Several themes are emerging from the induced shutdown of elective healthcare due to COVID-19: ▪ Virtual Consults ▪ Need for Paperless / Contactless end-to-end UX (origination and transaction)
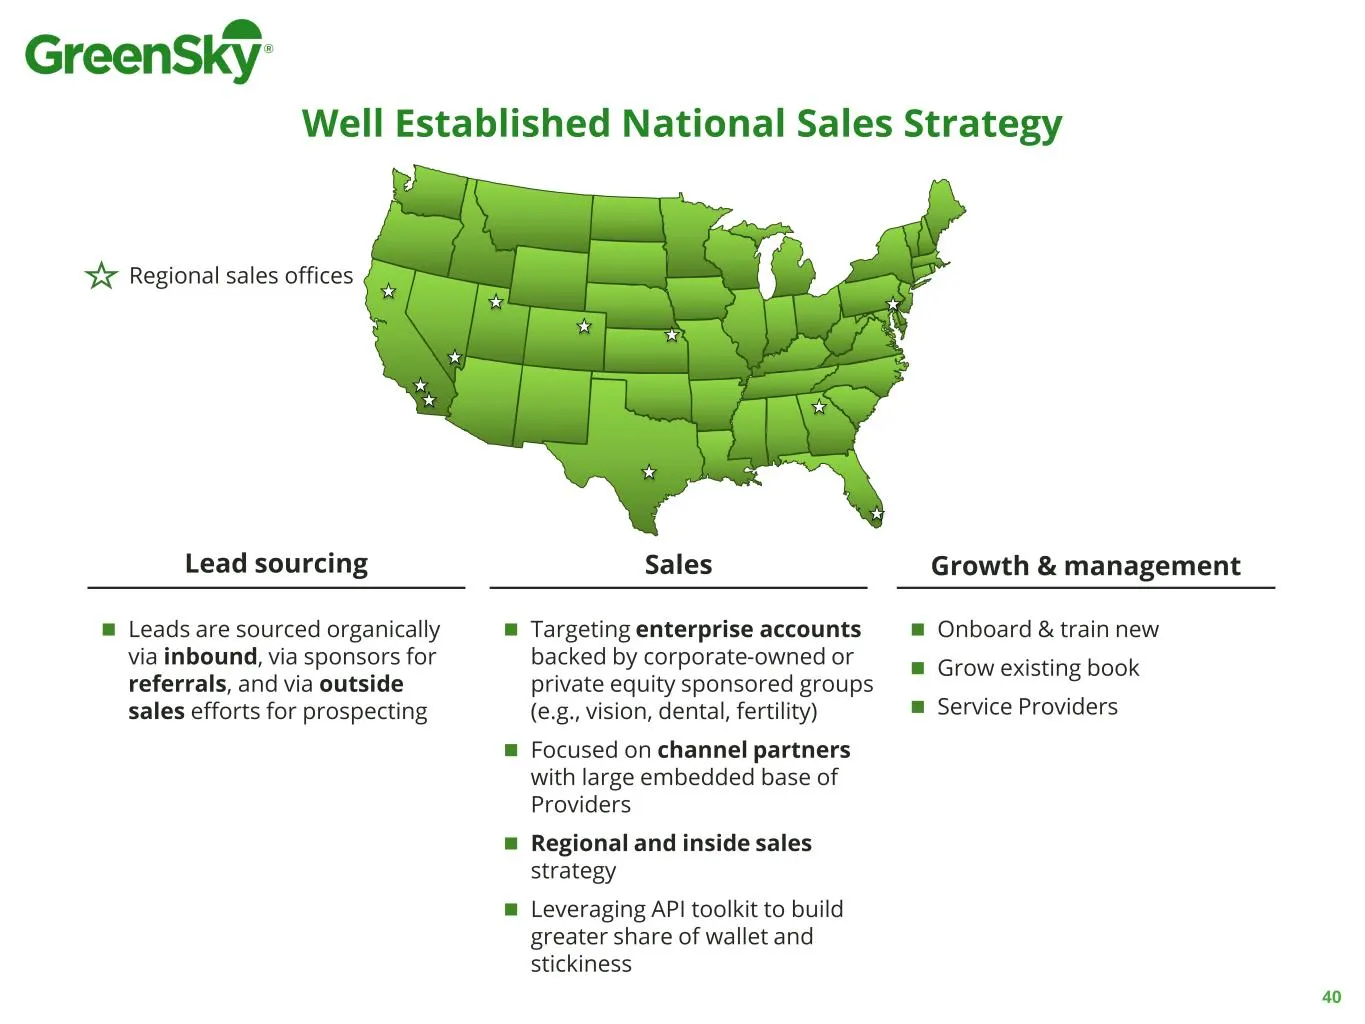
Slide 40: Well Established National Sales Strategy
Well Established National Sales Strategy ◼ Leads are sourced organically via inbound, via sponsors for referrals, and via outside sales efforts for prospecting Lead sourcing ◼ Targeting enterprise accounts backed by corporate-owned or private equity sponsored groups (e.g., vision, dental, fertility)
Slide 41: Home Improvement
Jesse Davis President, Home Improvement Home Improvement
Slide 42: U.S. Housing Stock Continues to Increase in Age
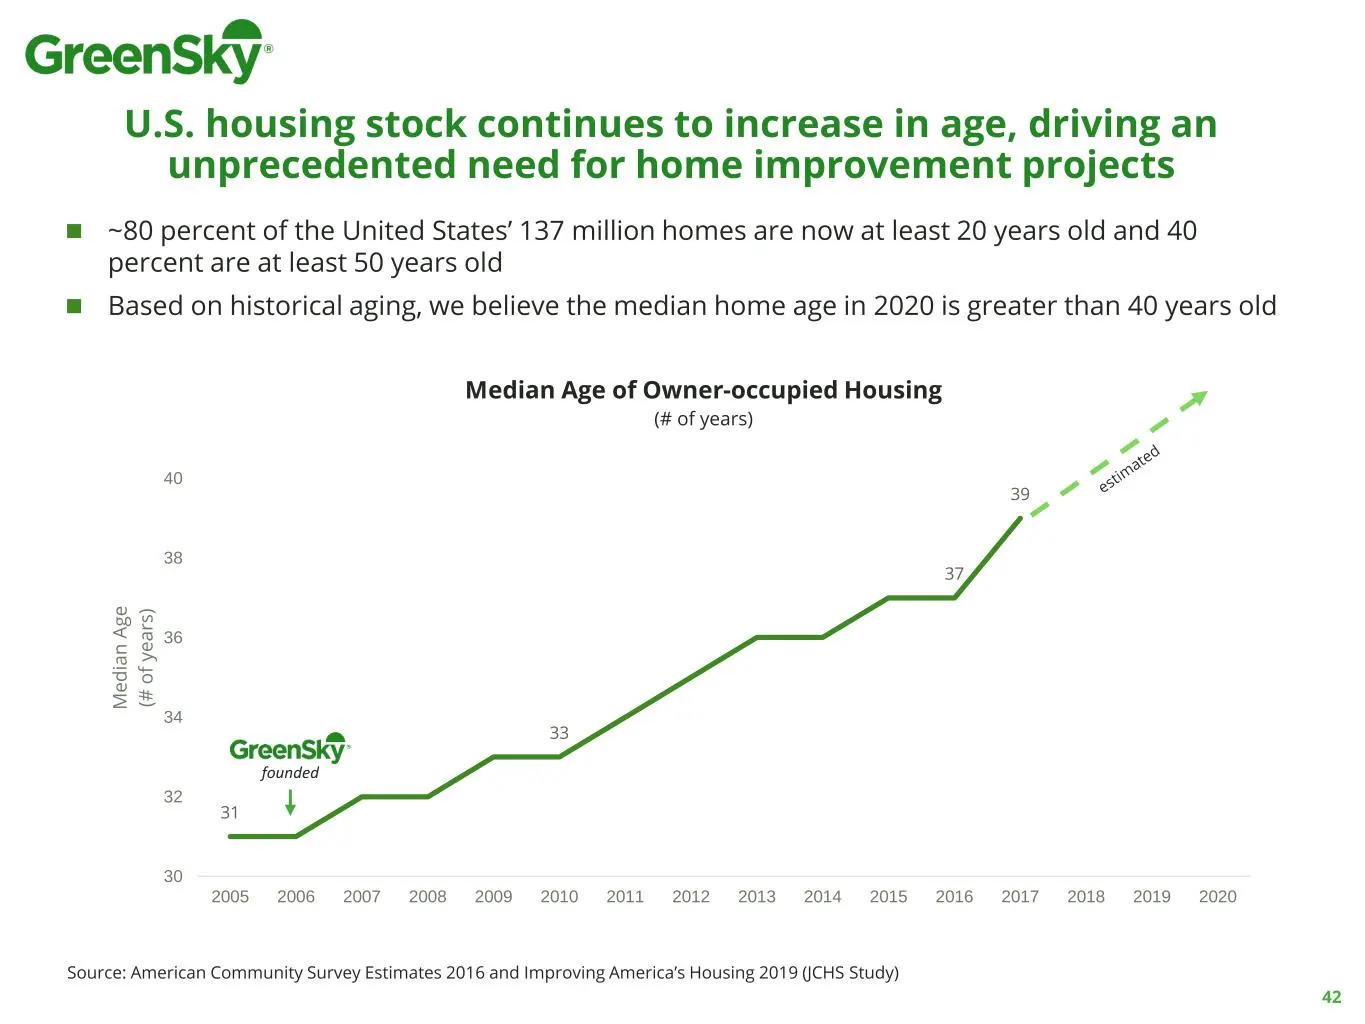
U.S. housing stock continues to increase in age, driving an unprecedented need for home improvement projects Median Age of Owner-occupied Housing (# of years) Source: American Community Survey Estimates 2016 and Improving America’s Housing 2019 (JCHS Study) 31 33 37 39 30 32 34 36 38 40 2005 2006 20
Slide 43: Home Improvement Growth Rate Exceeds Broader Market
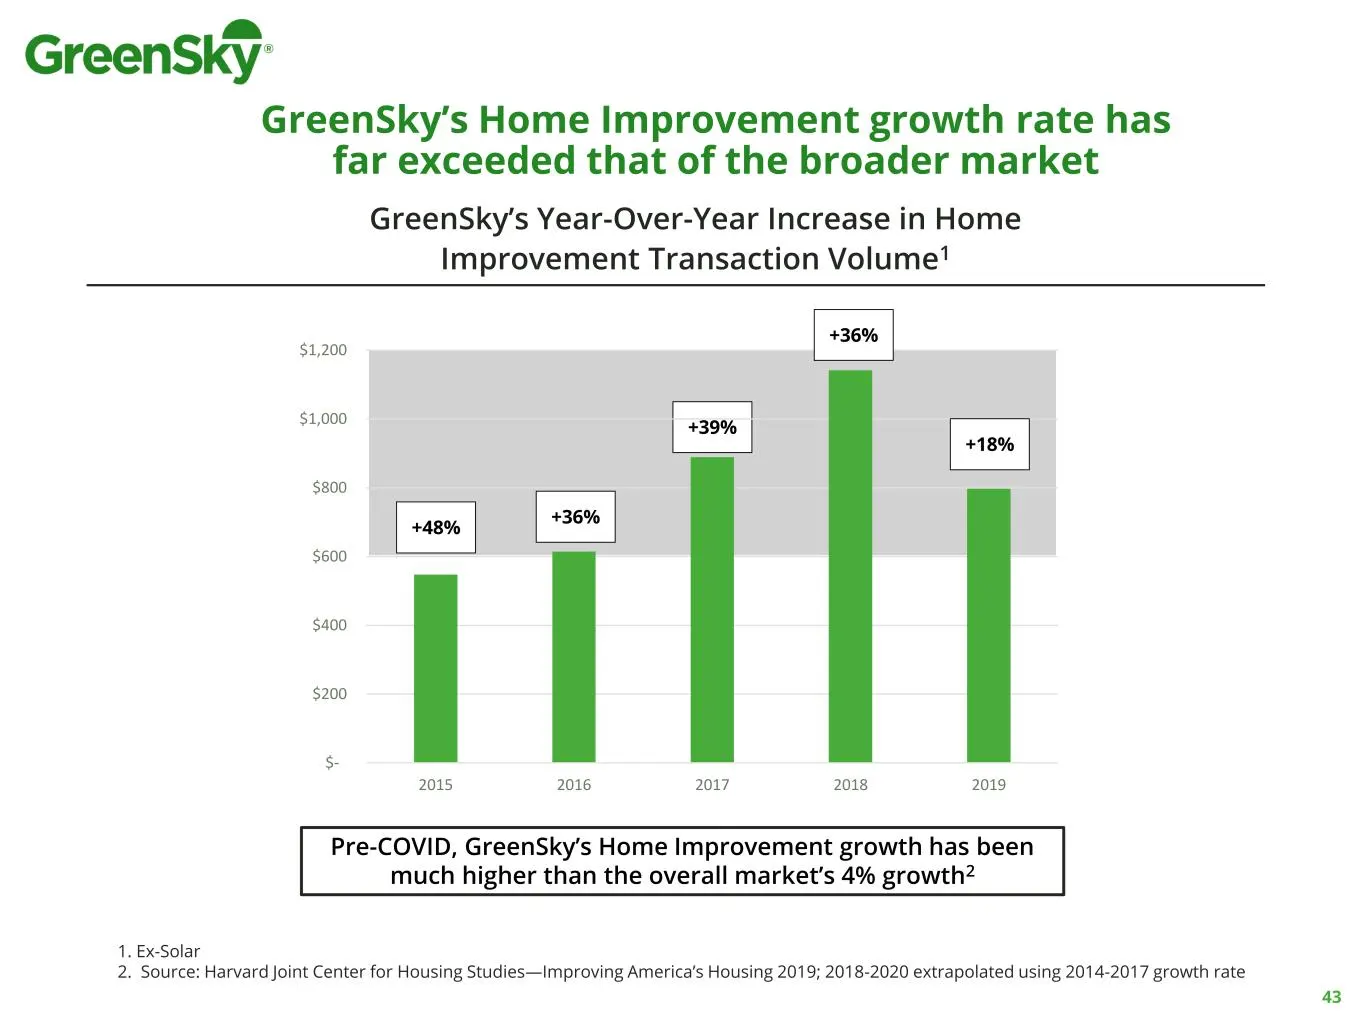
43 GreenSky’s Home Improvement growth rate has far exceeded that of the broader market GreenSky’s Year-Over-Year Increase in Home Improvement Transaction Volume1 1. Ex-Solar 2. Source: Harvard Joint Center for Housing Studies—Improving America’s Housing 2019; 2018-2020 extrapolated using 2014-2017 g
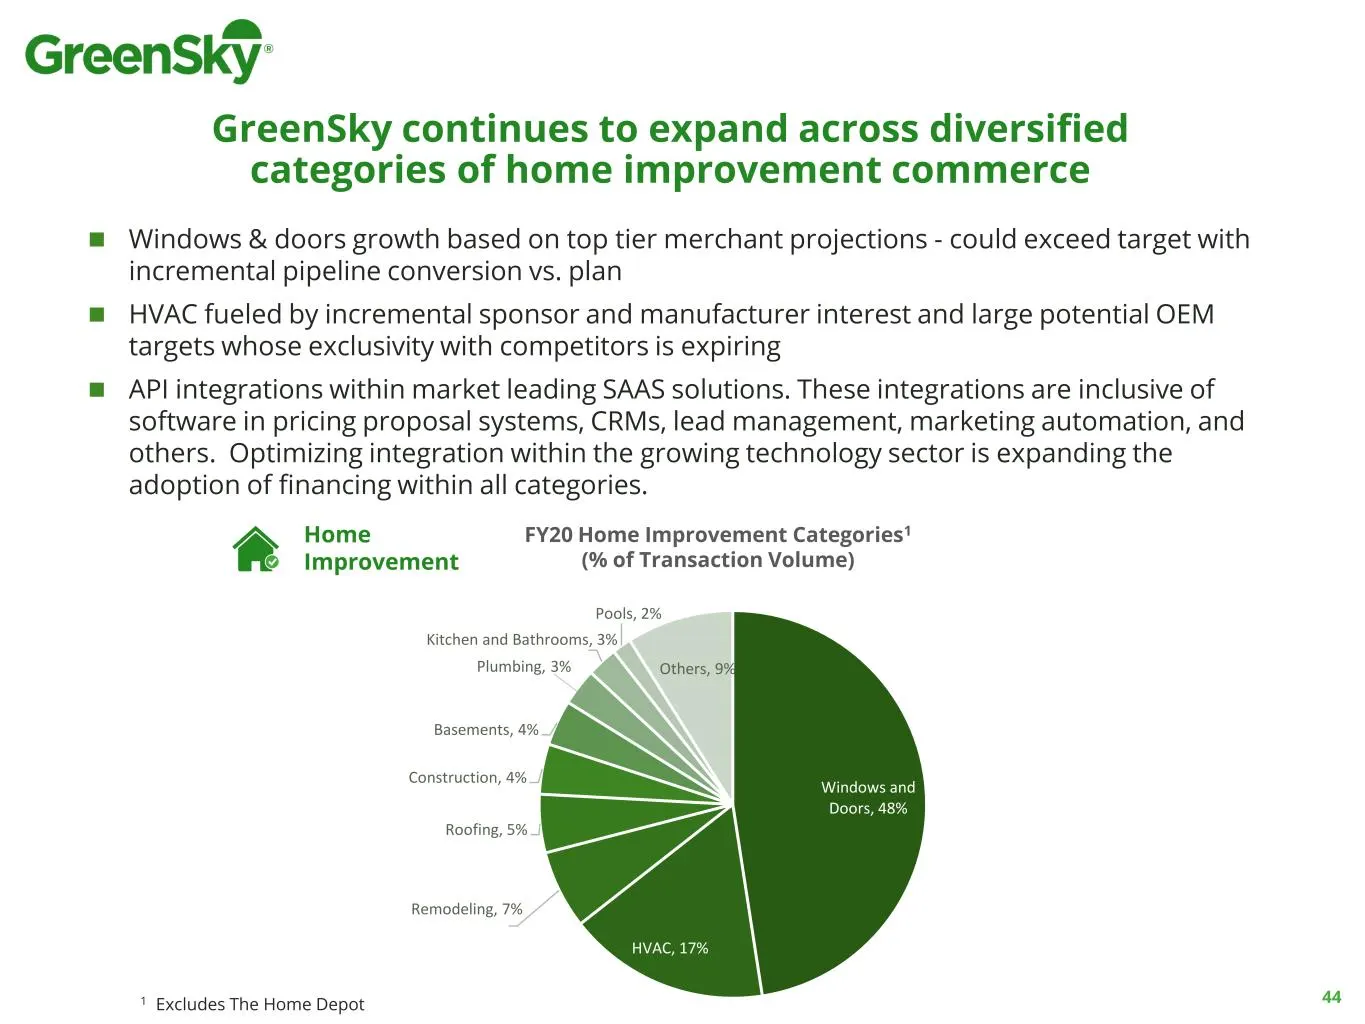
Slide 44: Expansion Across Diversified Categories of Home Improvement Commerce
GreenSky continues to expand across diversified categories of home improvement commerce ◼ Windows & doors growth based on top tier merchant projections - could exceed target with incremental pipeline conversion vs. plan ◼ HVAC fueled by incremental sponsor and manufacturer interest and large potenti
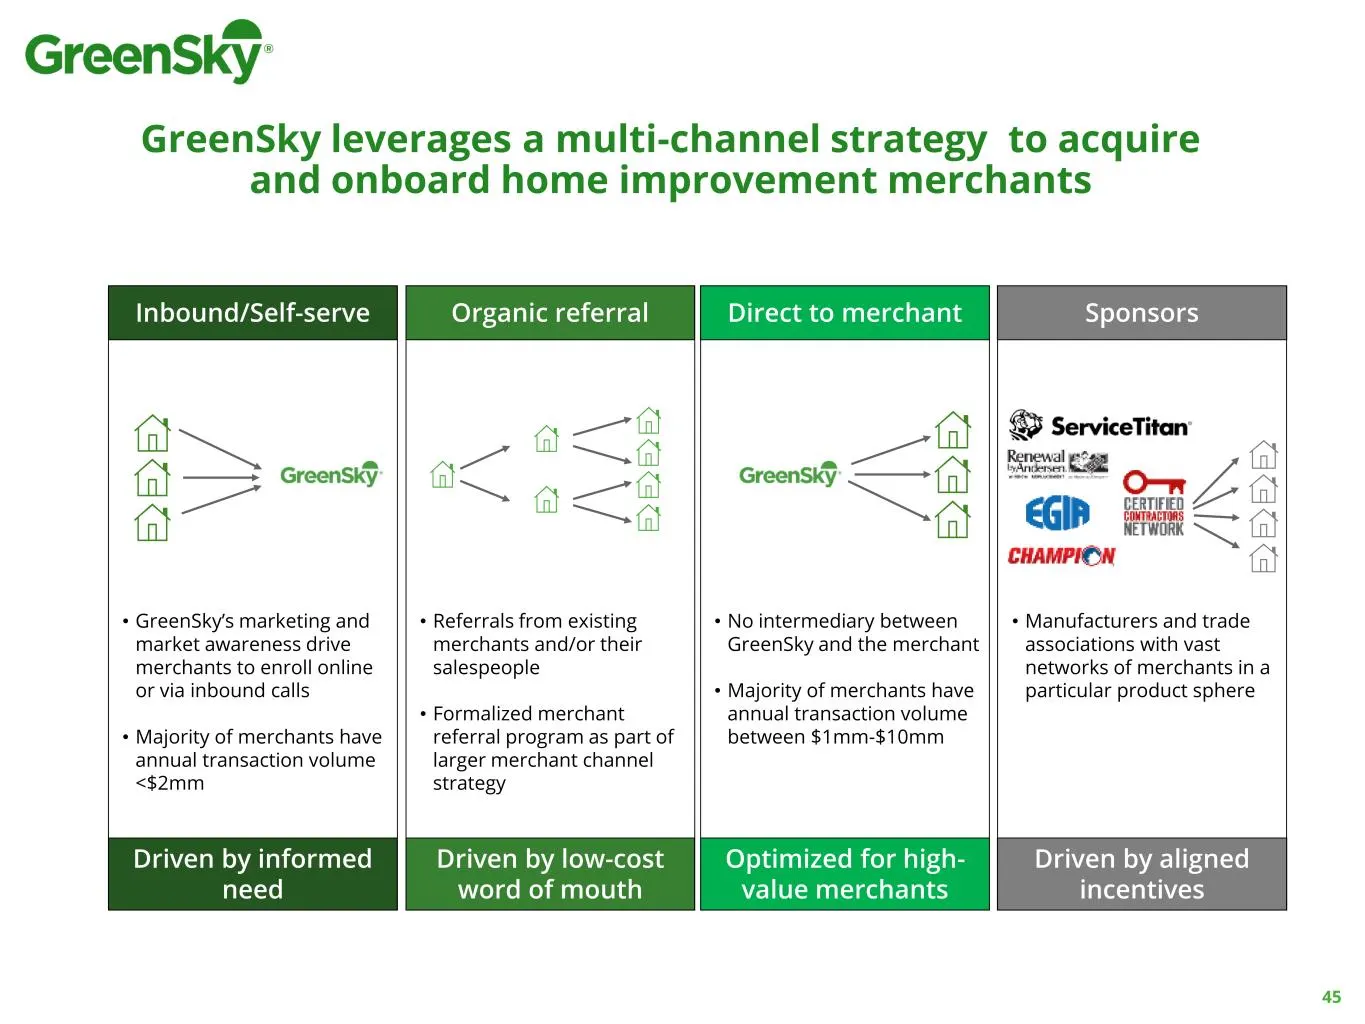
Slide 45: Multi-Channel Strategy to Acquire and Onboard Merchants
GreenSky leverages a multi-channel strategy to acquire and onboard home improvement merchants Direct to merchant Organic referral SponsorsInbound/Self-serve Optimized for high- value merchants Driven by low-cost word of mouth Driven by aligned incentives Driven by informed need • Manufacturers and t
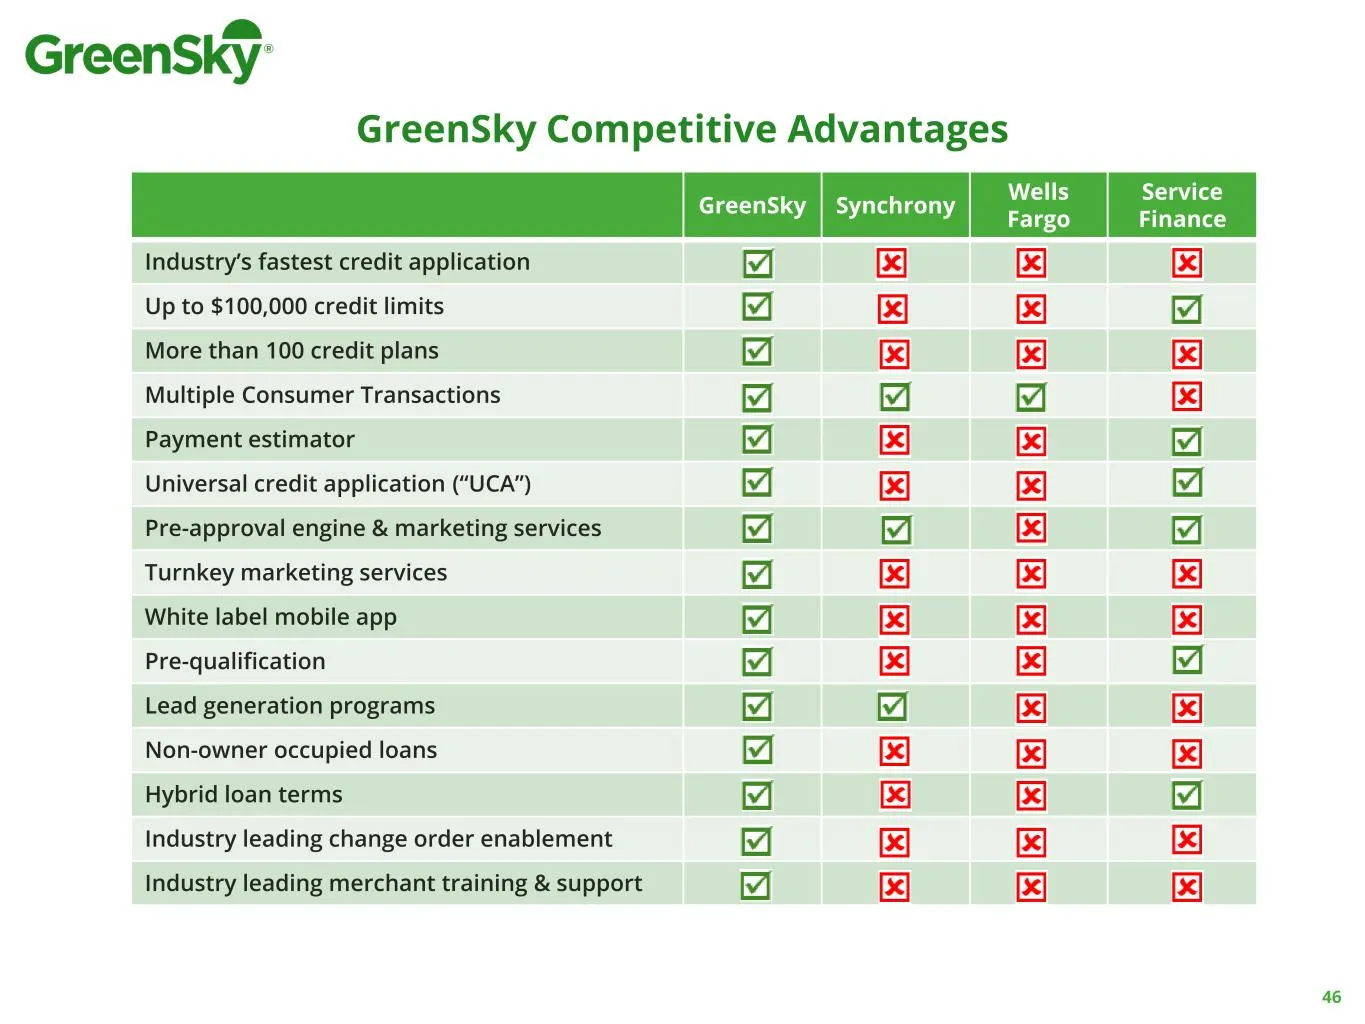
Slide 46: GreenSky Competitive Advantages
GreenSky Competitive Advantages GreenSky Synchrony Wells Fargo Service Finance Industry’s fastest credit application Up to $100,000 credit limits More than 100 credit plans Multiple Consumer Transactions Payment estimator Universal credit application (“UCA”) Pre-approval engine & marketing services
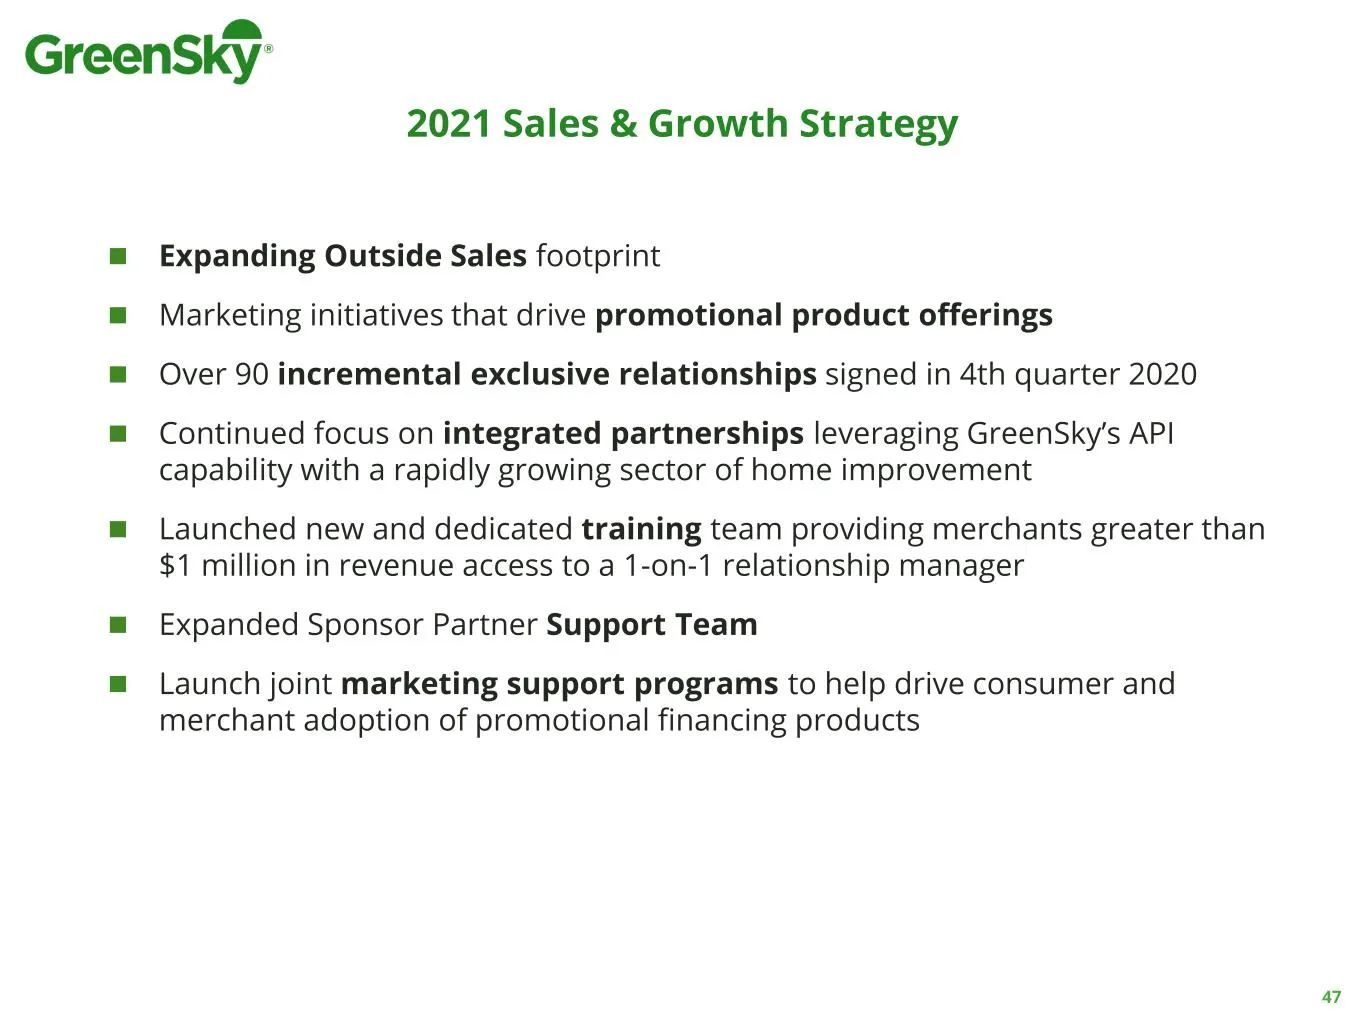
Slide 47: 2021 Sales & Growth Strategy
2021 Sales & Growth Strategy ◼ Expanding Outside Sales footprint ◼ Marketing initiatives that drive promotional product offerings ◼ Over 90 incremental exclusive relationships signed in 4th quarter 2020 ◼ Continued focus on integrated partnerships leveraging GreenSky’s API capability with a rapidly
Slide 48: Financial Outlook
Andrew Kang Executive Vice President & Chief Financial Officer Financial Outlook
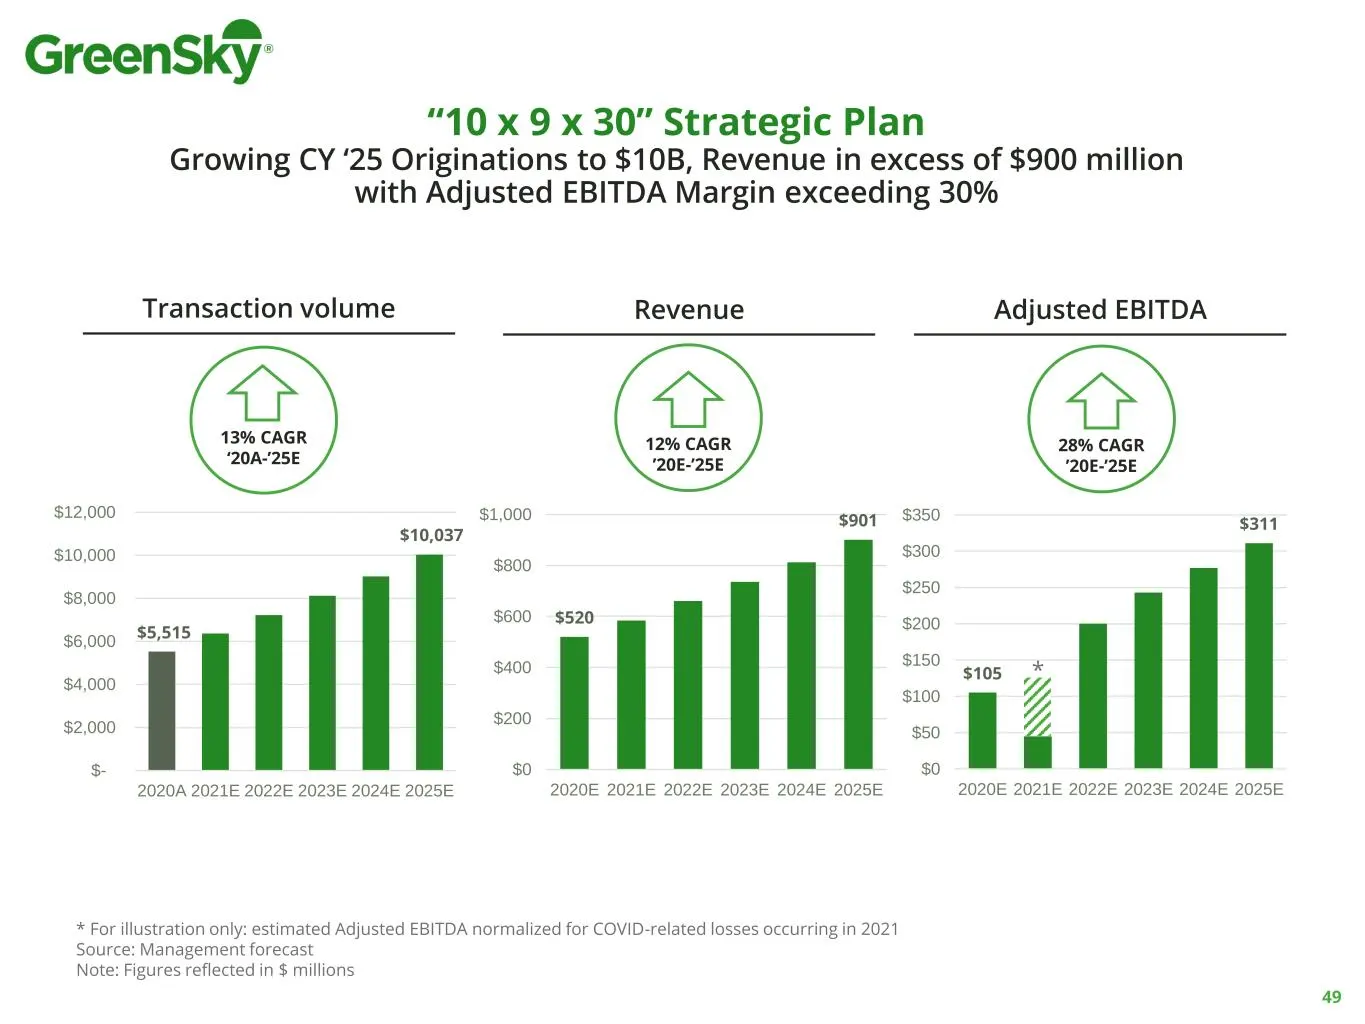
Slide 49: 10 x 9 x 30 Strategic Plan
49 Transaction volume Revenue Adjusted EBITDA 13% CAGR ‘20A-’25E 28% CAGR ’20E-’25E 12% CAGR ’20E-’25E $5,515 $10,037 $- $2,000 $4,000 $6,000 $8,000 $10,000 $12,000 2020A 2021E 2022E 2023E 2024E 2025E $520 $901 $0 $200 $400 $600 $800 $1,000 2020E 2021E 2022E 2023E 2024E 2025E $105 $311 $0 $50 $100 $
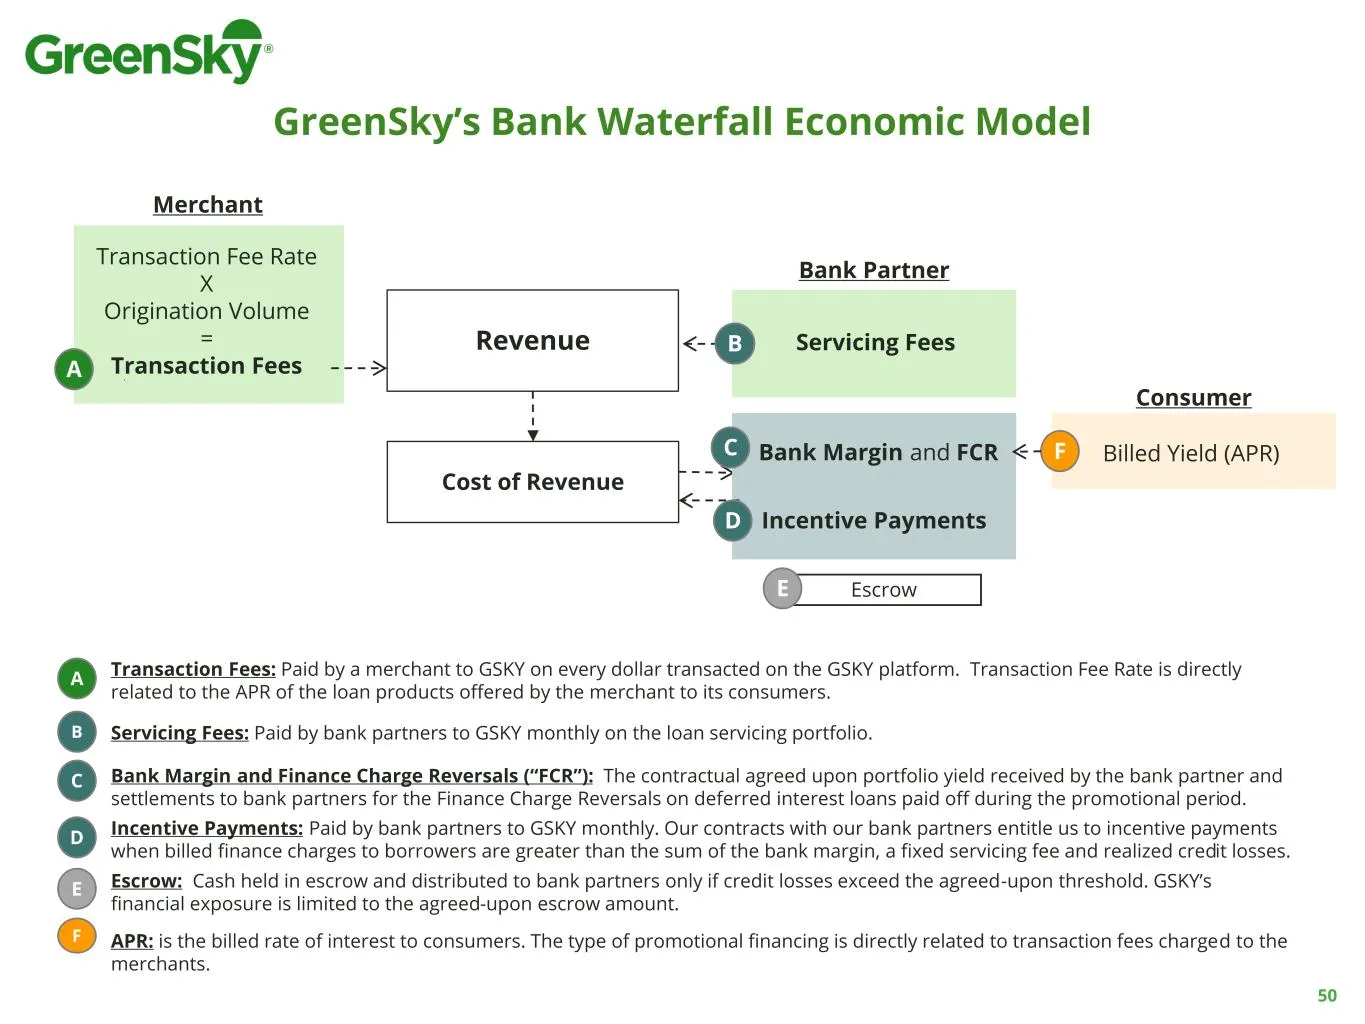
Slide 50: GreenSky's Revenue Model
B Servicing Fees: Paid by bank partners to GSKY monthly on the loan servicing portfolio. C Bank Margin and Finance Charge Reversals (“FCR”): The contractual agreed upon portfolio yield received by the bank partner and settlements to bank partners for the Finance Charge Reversals on deferred interest
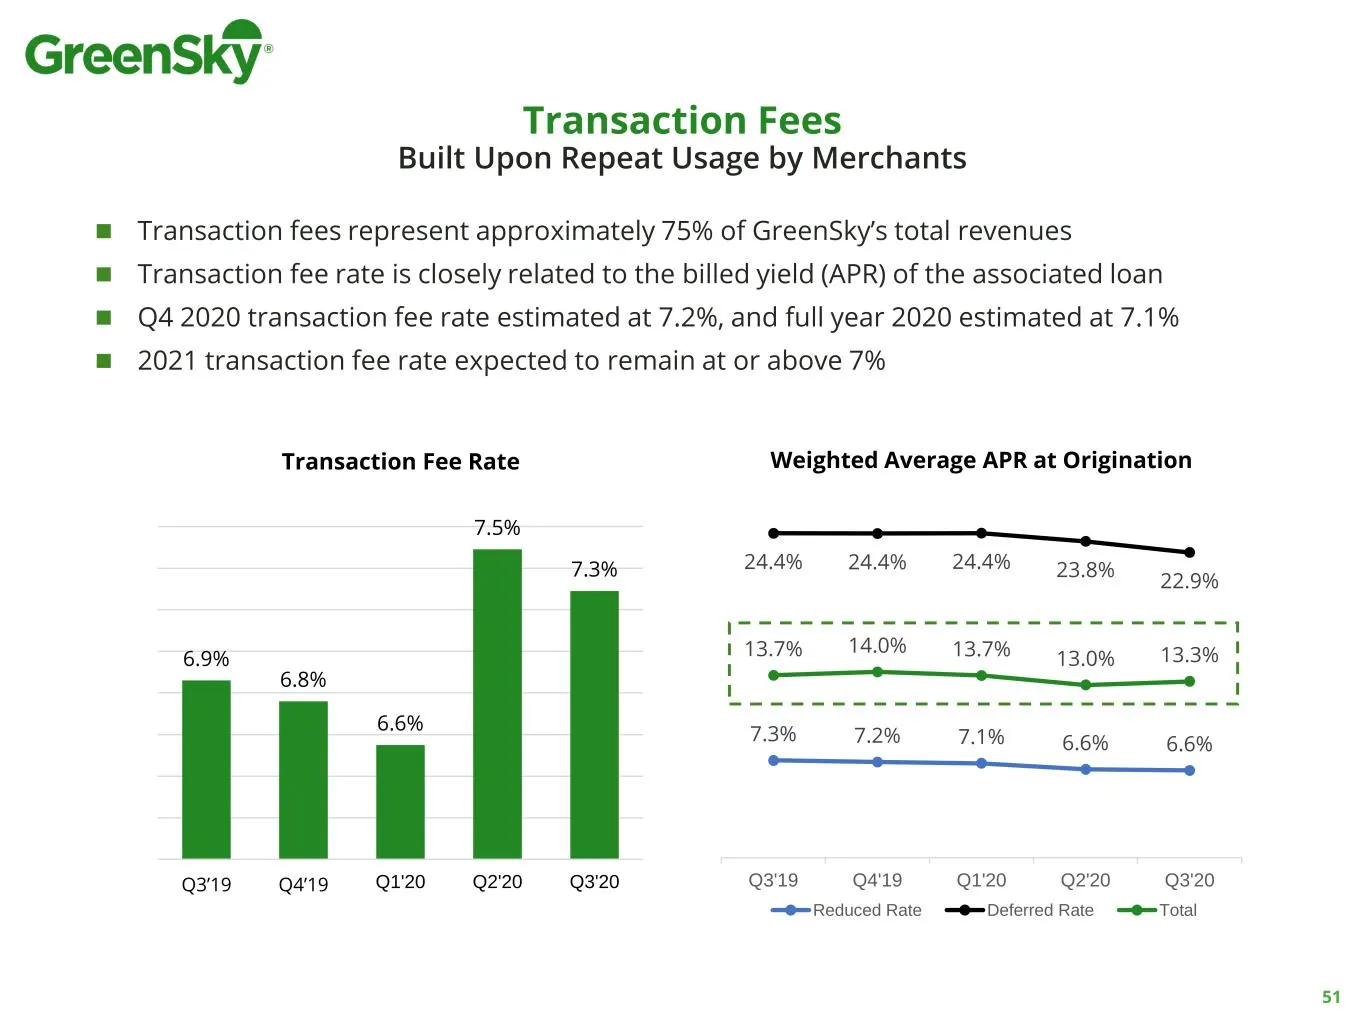
Slide 51: Transaction Fees Built Upon Repeat Usage by Merchants
Transaction Fees Built Upon Repeat Usage by Merchants 51 6.9% 6.8% 6.6% 7.5% 7.3% Q3’19 Q4’19 Q1'20 Q2'20 Q3'20 Transaction Fee Rate ◼ Transaction fees represent approximately 75% of GreenSky’s total revenues ◼ Transaction fee rate is closely related to the billed yield (APR) of the associated loan
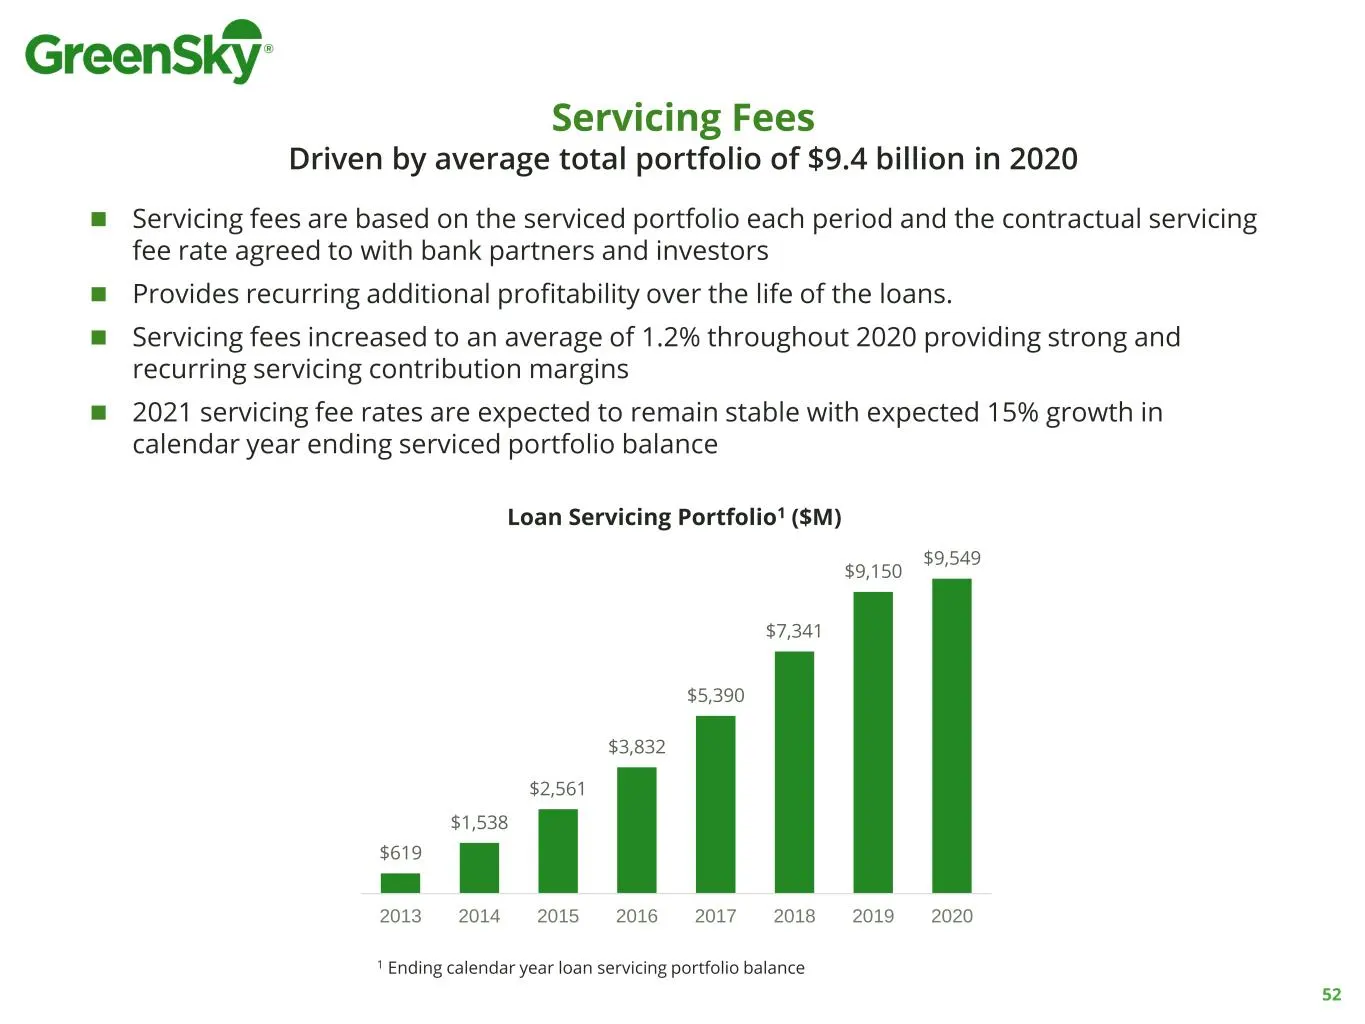
Slide 52: Servicing Fees
◼ Servicing fees are based on the serviced portfolio each period and the contractual servicing fee rate agreed to with bank partners and investors ◼ Provides recurring additional profitability over the life of the loans. ◼ Servicing fees increased to an average of 1.2% throughout 2020 providing stro
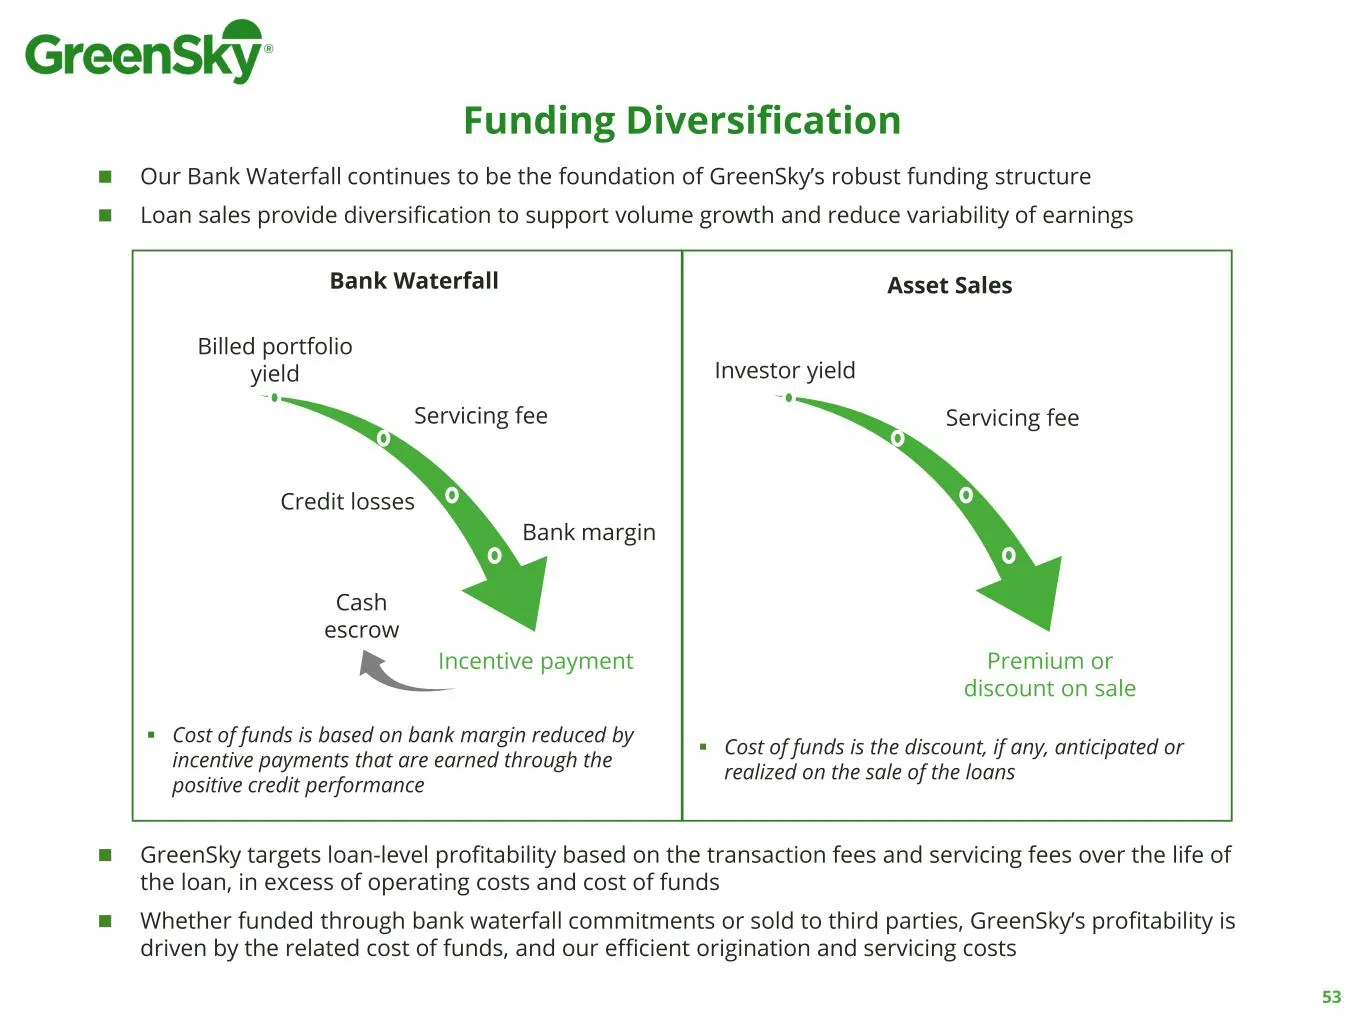
Slide 53: Funding Diversification
Funding Diversification 53 Bank Waterfall Billed portfolio yield Servicing fee Credit losses Cash escrow Bank margin Incentive payment Asset Sales Servicing fee Investor yield Premium or discount on sale ◼ Our Bank Waterfall continues to be the foundation of GreenSky’s robust funding structure ◼ Loa
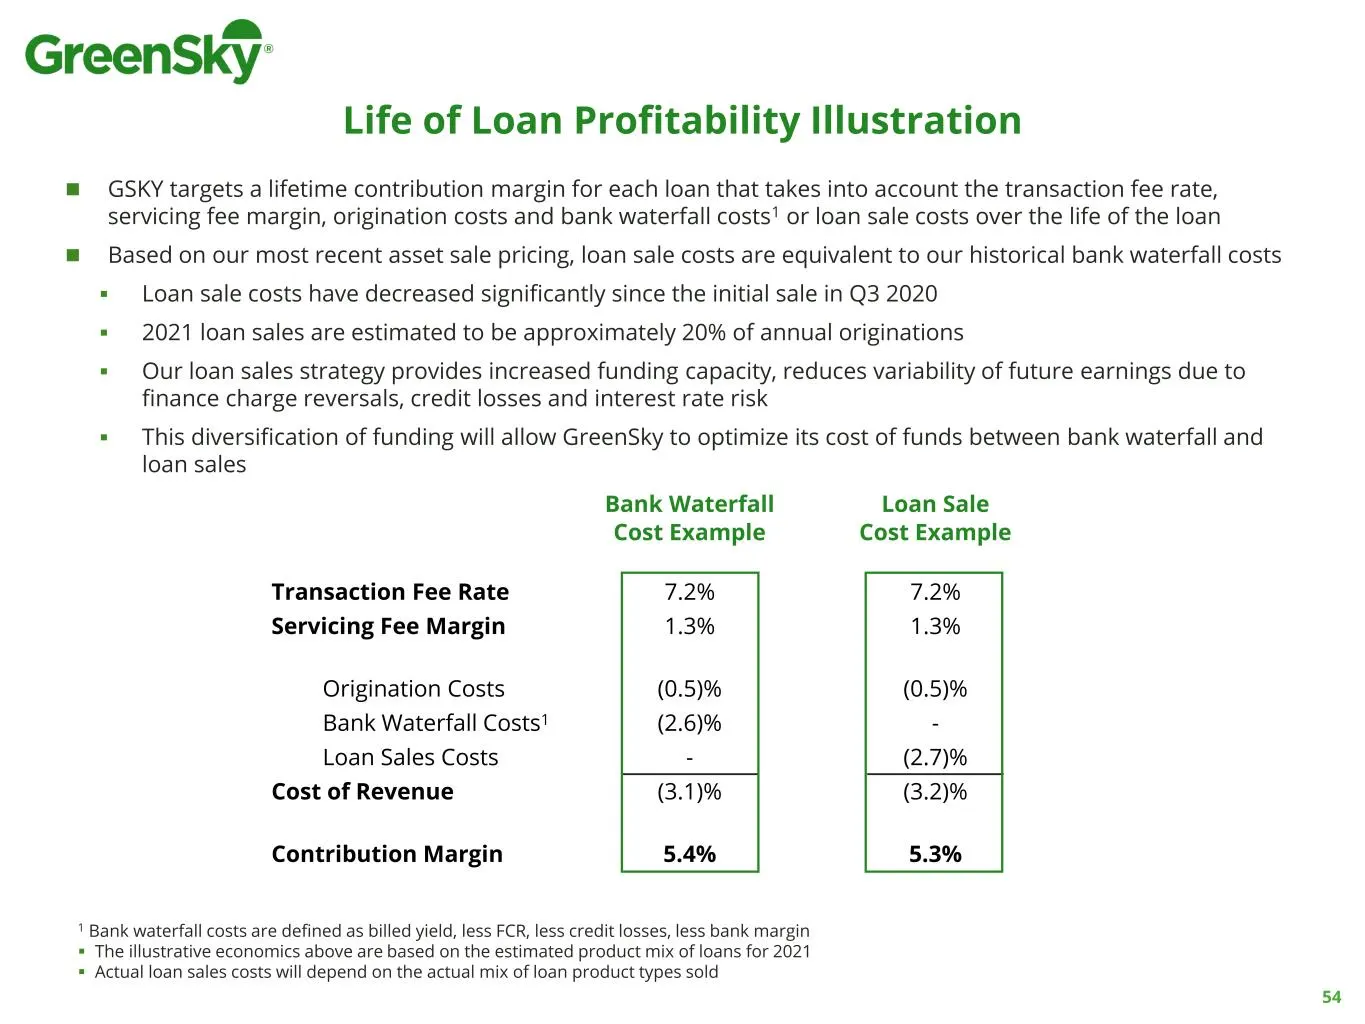
Slide 54: Life of Loan Profitability Illustration
Life of Loan Profitability Illustration 54 ◼ GSKY targets a lifetime contribution margin for each loan that takes into account the transaction fee rate, servicing fee margin, origination costs and bank waterfall costs1 or loan sale costs over the life of the loan ◼ Based on our most recent asset sal
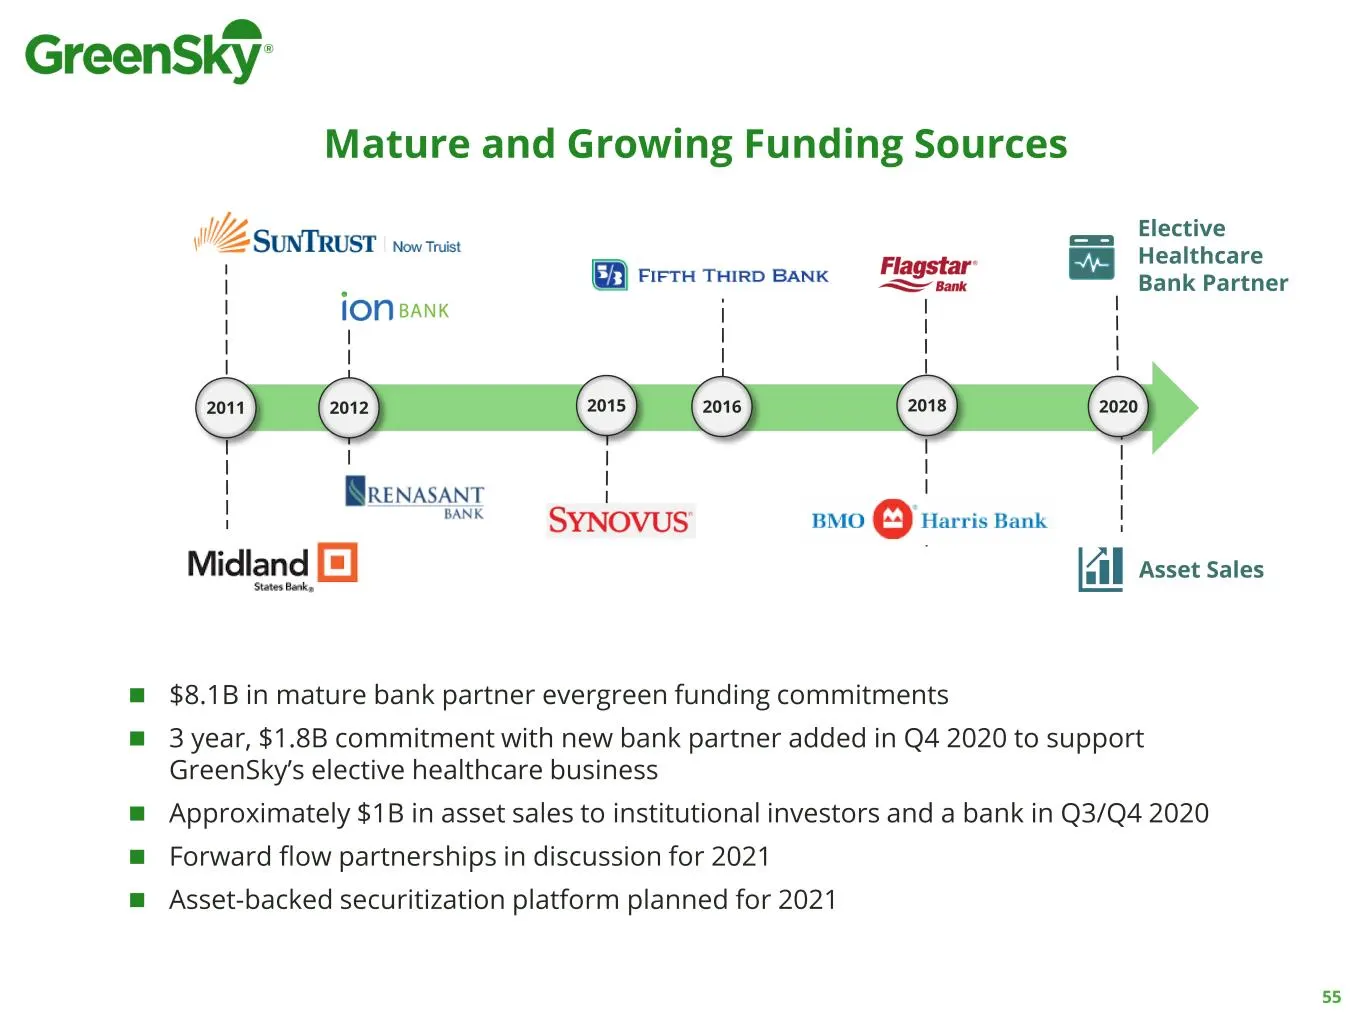
Slide 55: Mature and Growing Funding Sources
55 20162011 2015 20182012 2020 ◼ $8.1B in mature bank partner evergreen funding commitments ◼ 3 year, $1.8B commitment with new bank partner added in Q4 2020 to support GreenSky’s elective healthcare business ◼ Approximately $1B in asset sales to institutional investors and a bank in Q3/Q4 2020 ◼ Fo
Slide 56: Diverse Funding to Support Growth
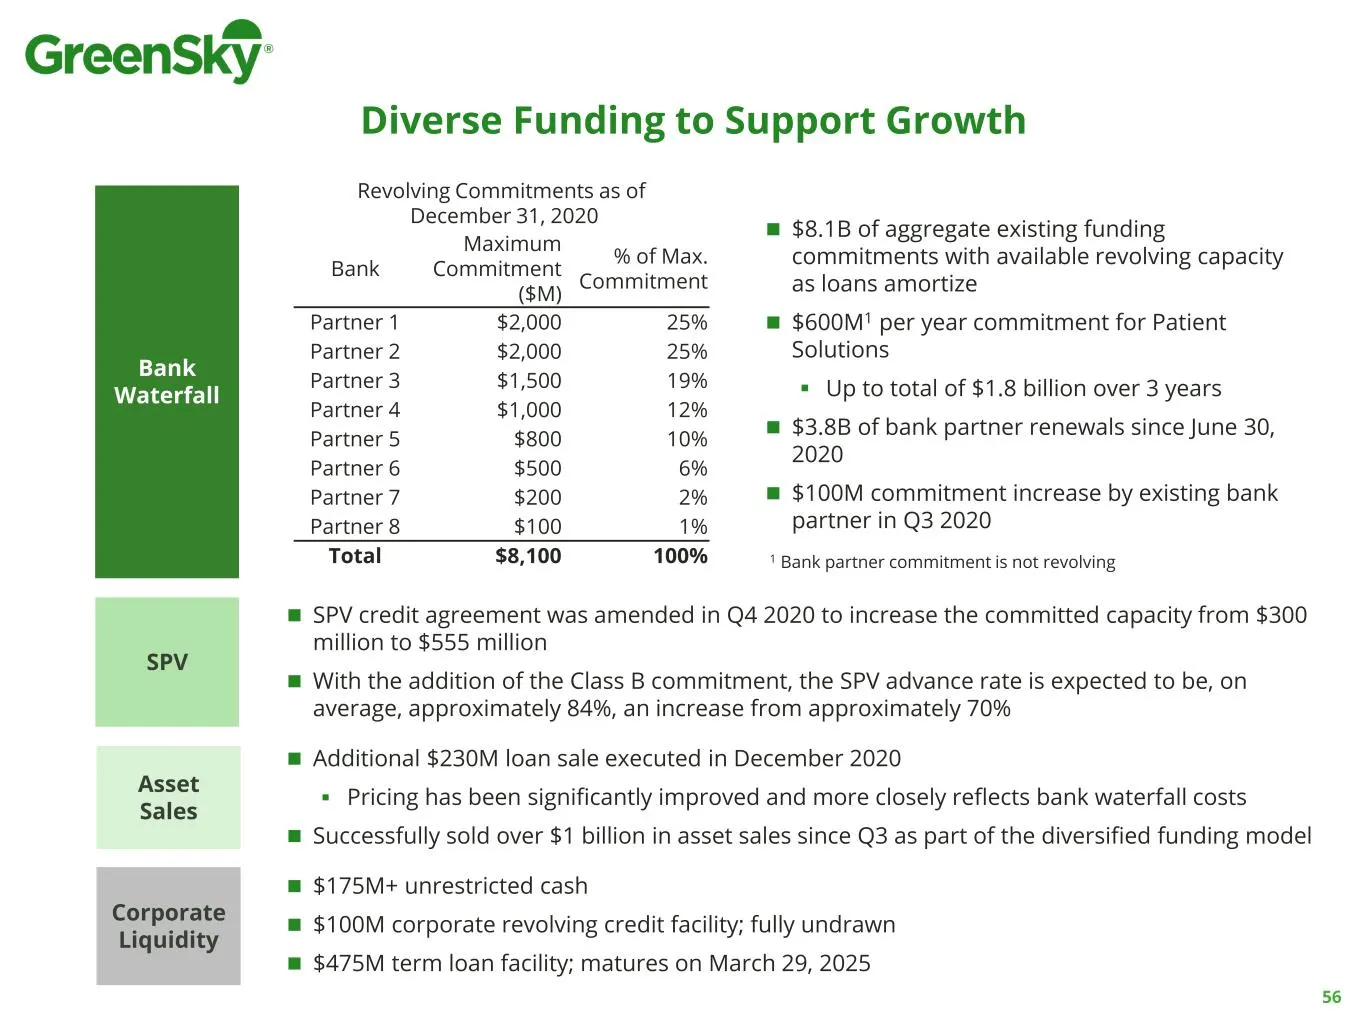
Diverse Funding to Support Growth 56 Bank Waterfall SPV Revolving Commitments as of December 31, 2020 Bank Maximum Commitment ($M) % of Max. Commitment Partner 1 $2,000 25% Partner 2 $2,000 25% Partner 3 $1,500 19% Partner 4 $1,000 12% Partner 5 $800 10% Partner 6 $500 6% Partner 7 $200 2% Partner 8
Slide 57: Full Year 2020 Estimates and Forward Guidance
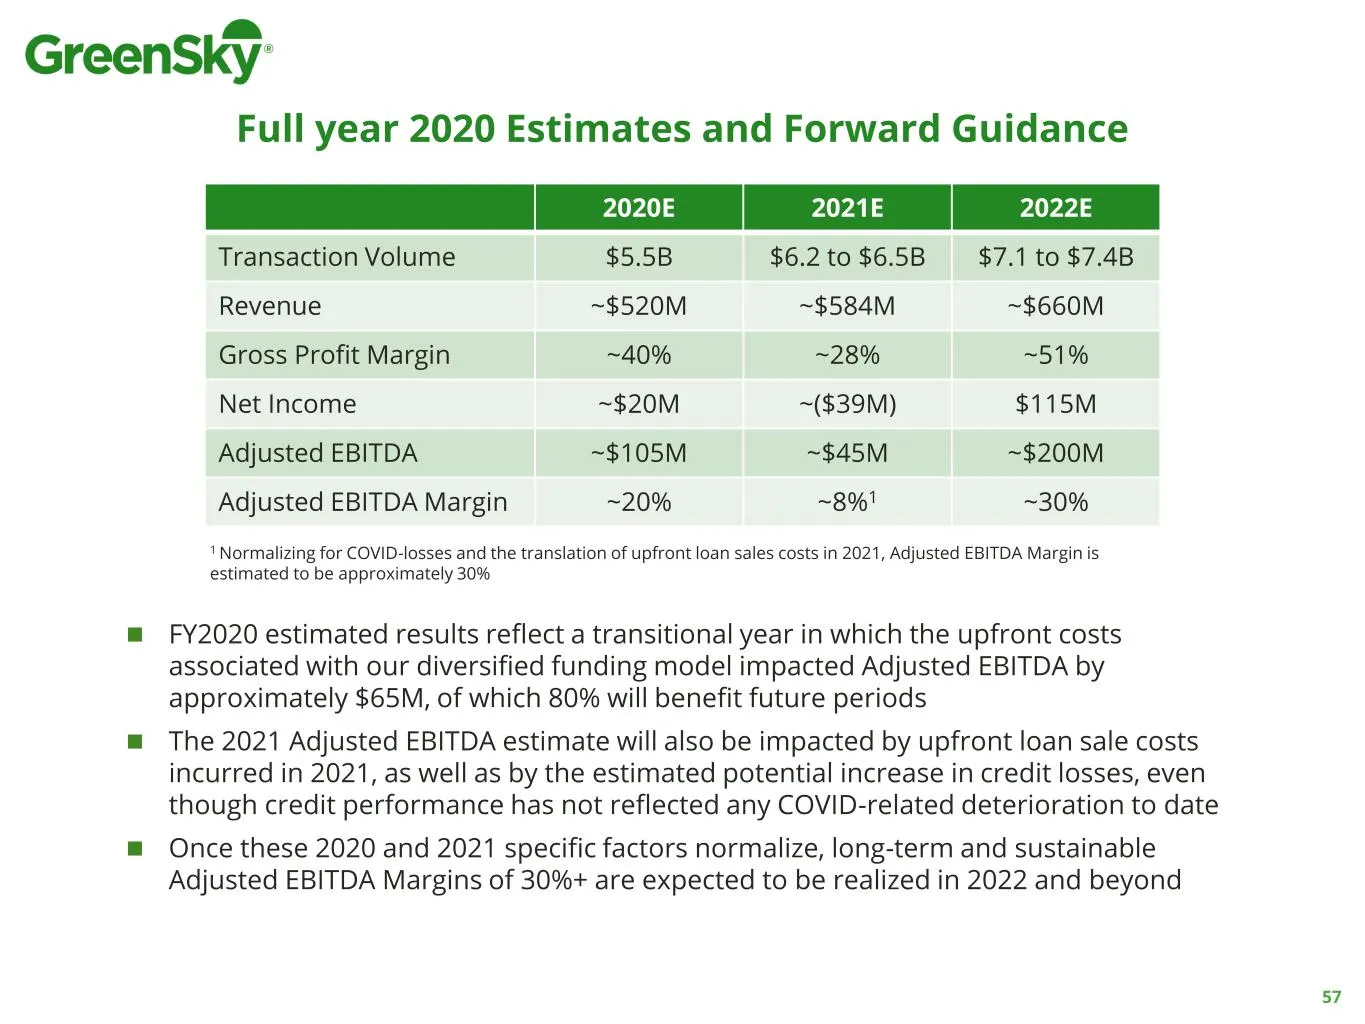
Full year 2020 Estimates and Forward Guidance 57 2020E 2021E 2022E Transaction Volume $5.5B $6.2 to $6.5B $7.1 to $7.4B Revenue ~$520M ~$584M ~$660M Gross Profit Margin ~40% ~28% ~51% Net Income ~$20M ~($39M) $115M Adjusted EBITDA ~$105M ~$45M ~$200M Adjusted EBITDA Margin ~20% ~8%1 ~30% ◼ FY2020 es
Slide 58: Key Investment Considerations
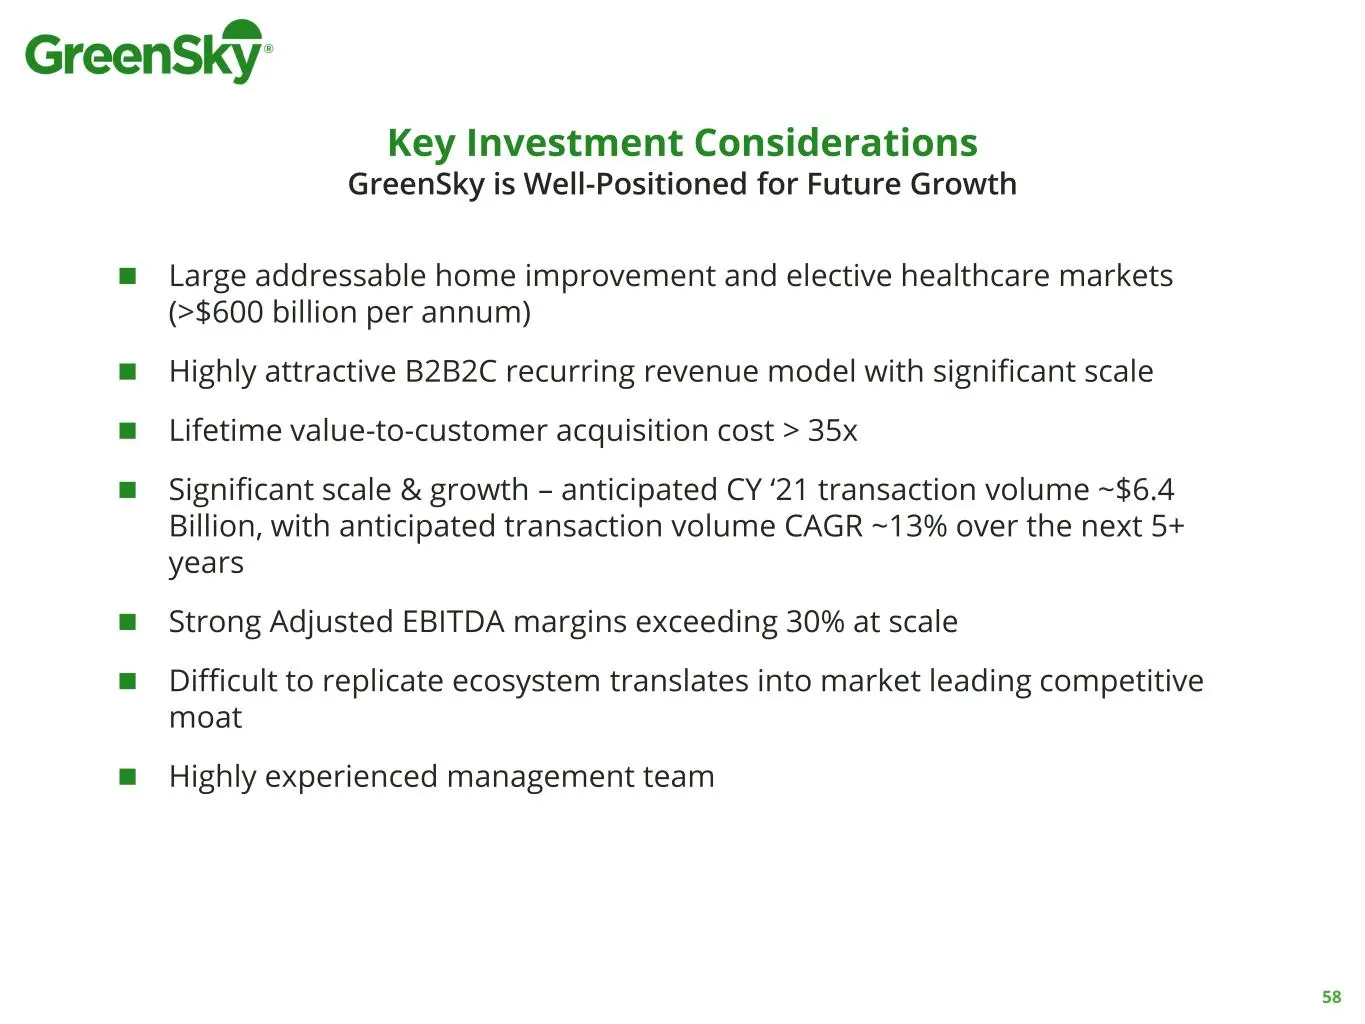
Key Investment Considerations GreenSky is Well-Positioned for Future Growth ◼ Large addressable home improvement and elective healthcare markets (>$600 billion per annum) ◼ Highly attractive B2B2C recurring revenue model with significant scale ◼ Lifetime value-to-customer acquisition cost > 35x ◼ Si
Slide 59: Thank You! Questions & Answers
Thank You! Questions & Answers
Slide 60: Appendix and Non-GAAP Reconciliations
Appendix and Non-GAAP Reconciliations
Slide 61: Loan Sale Cost Illustration - Life of Loan
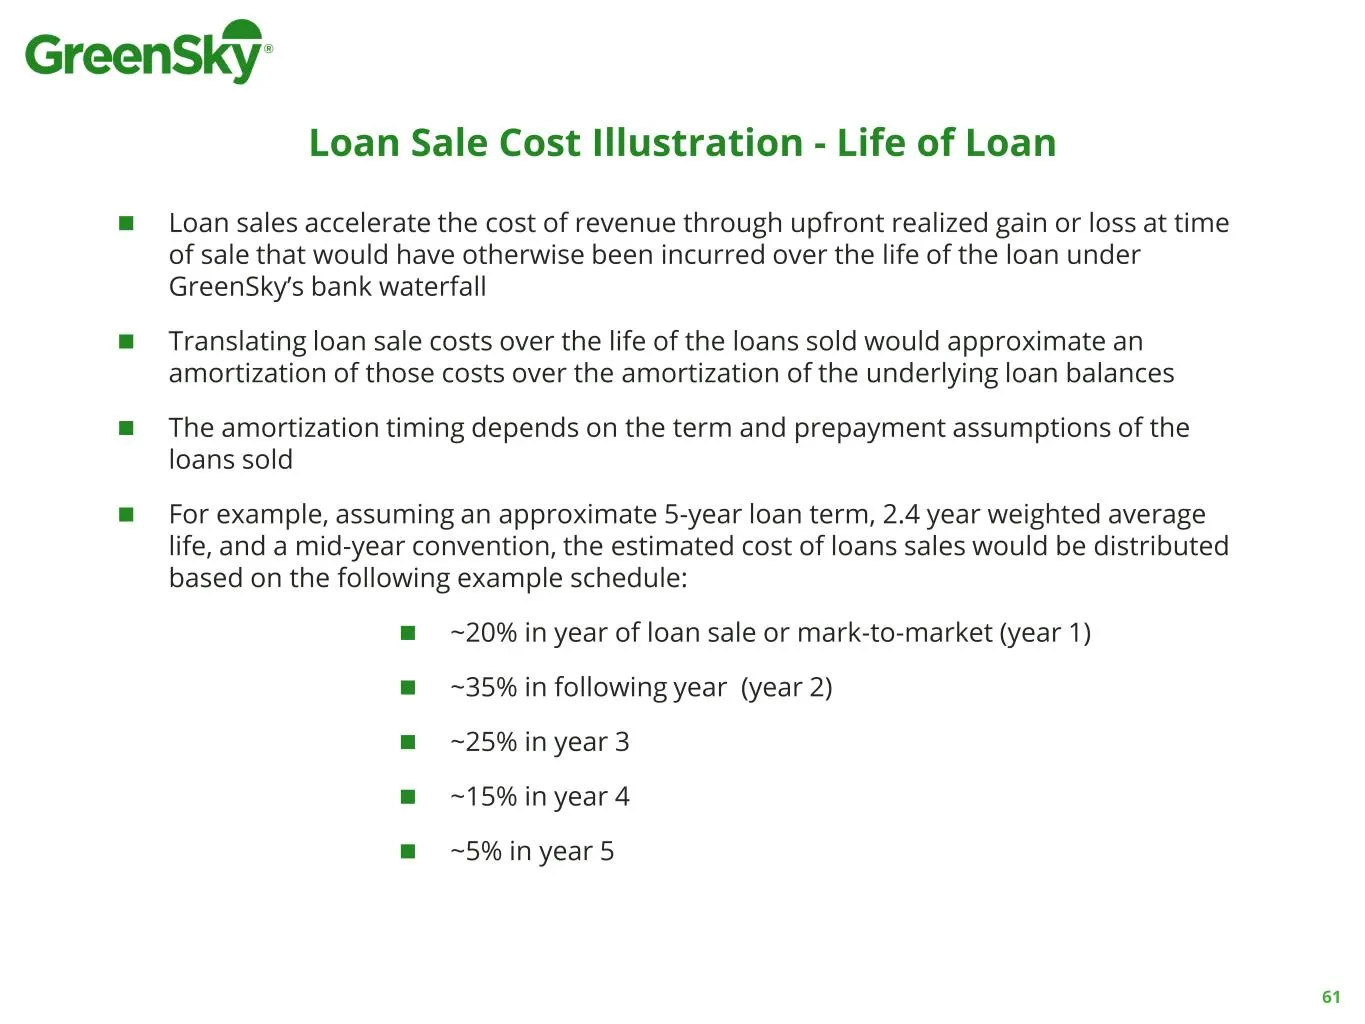
Loan Sale Cost Illustration - Life of Loan ◼ Loan sales accelerate the cost of revenue through upfront realized gain or loss at time of sale that would have otherwise been incurred over the life of the loan under GreenSky’s bank waterfall ◼ Translating loan sale costs over the life of the loans sold
Slide 62: Reconciliation of 2018 Adjusted EBITDA
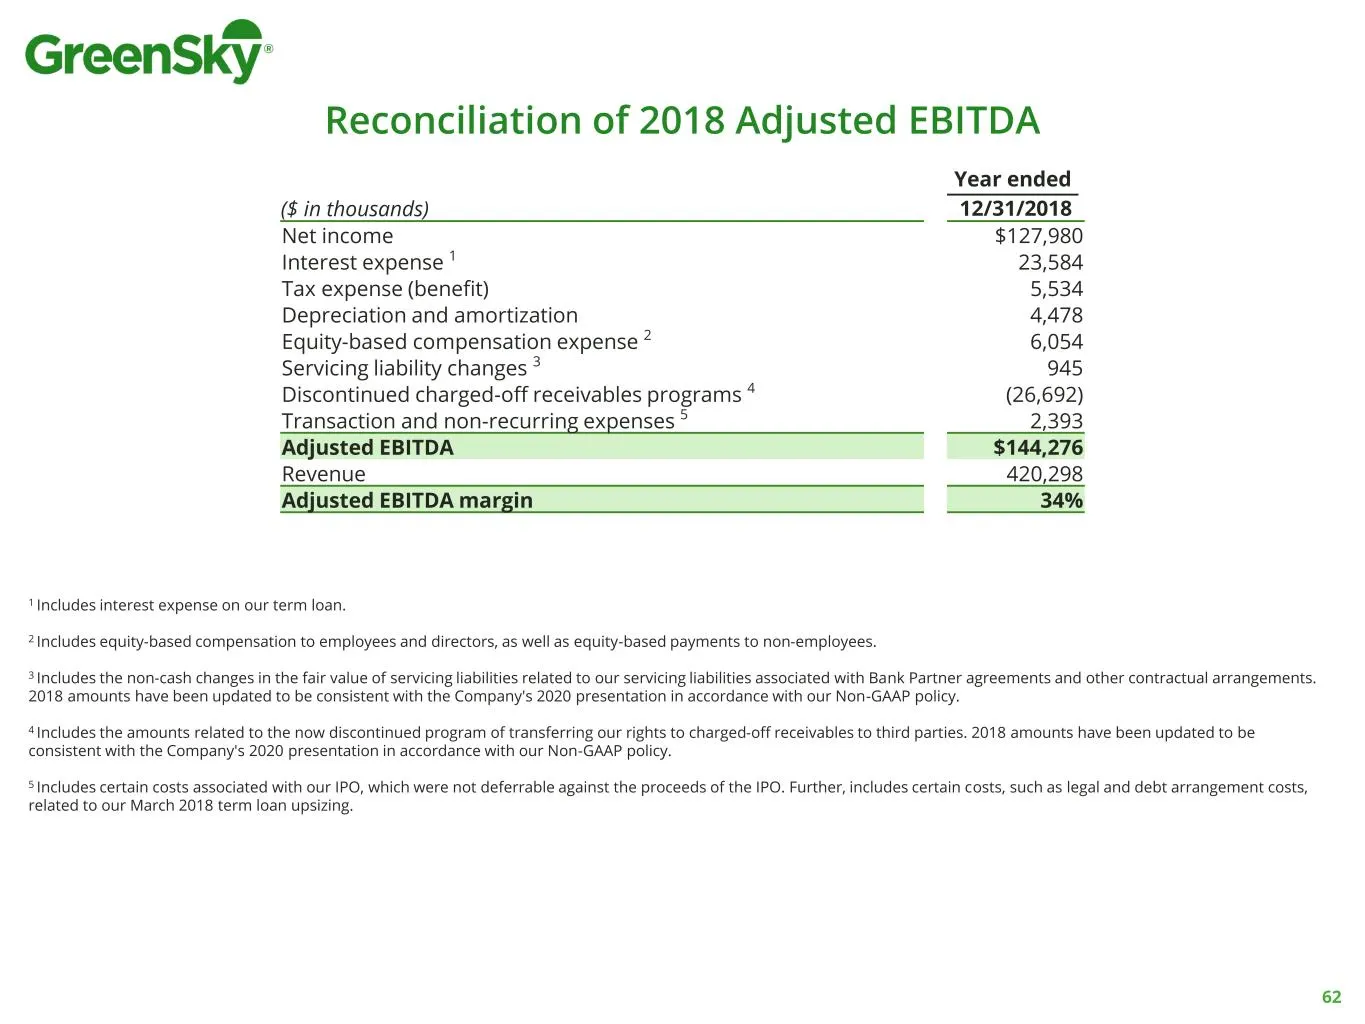
Reconciliation of 2018 Adjusted EBITDA Year ended ($ in thousands) 12/31/2018 Net income $127,980 Interest expense 1 23,584 Tax expense (benefit) 5,534 Depreciation and amortization 4,478 Equity-based compensation expense 2 6,054 Servicing liability changes 3 945 Discontinued charged-off receivables
Slide 63: Reconciliation of 2019 Adjusted EBITDA
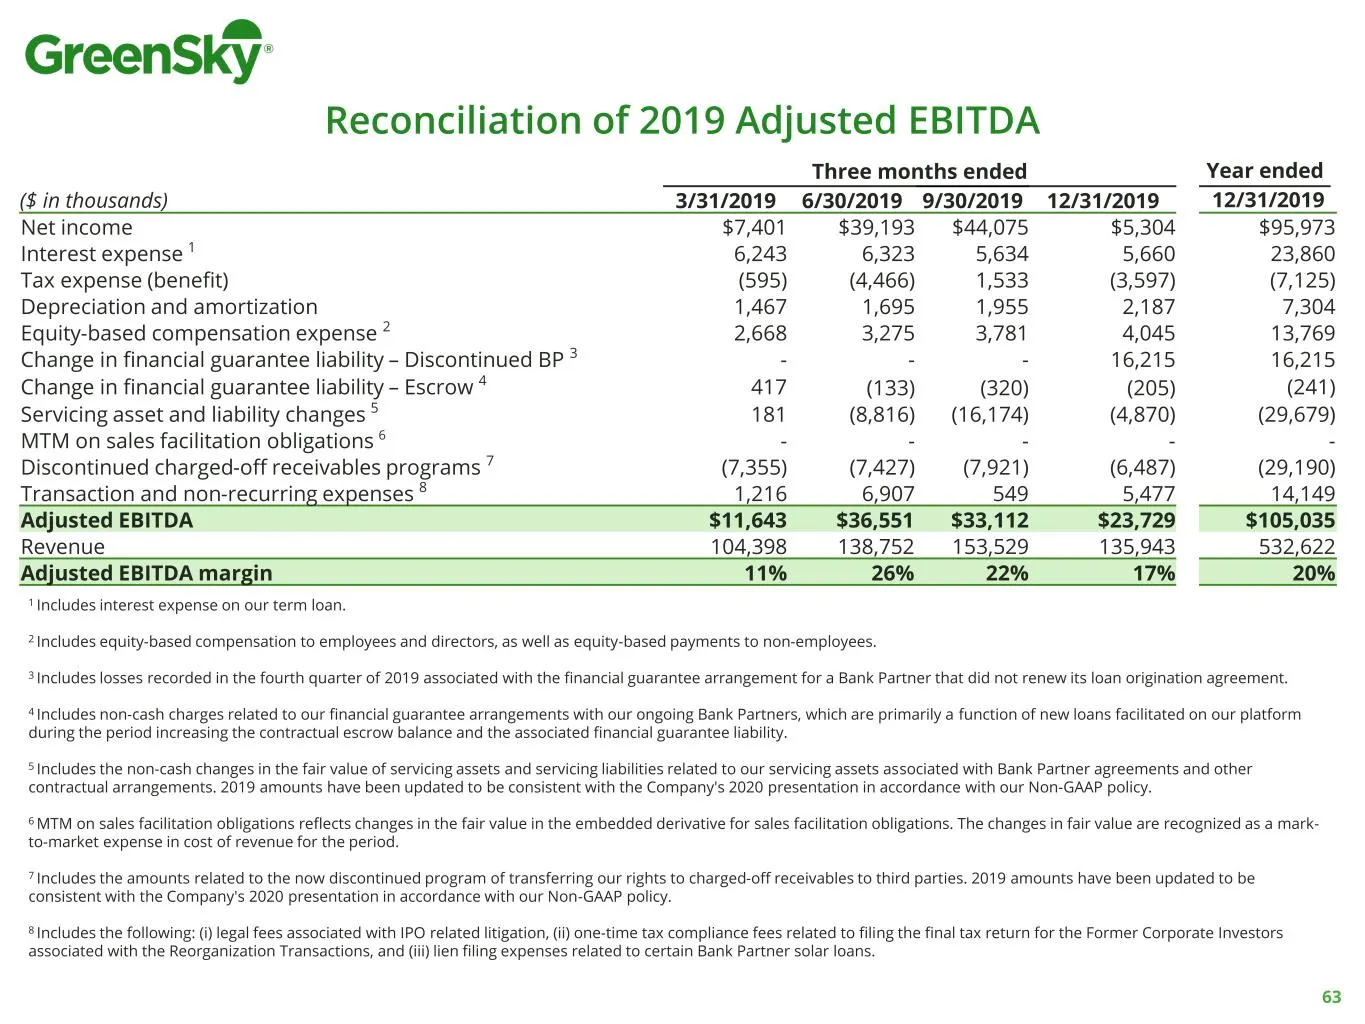
Reconciliation of 2019 Adjusted EBITDA Three months ended Year ended ($ in thousands) 3/31/2019 6/30/2019 9/30/2019 12/31/2019 12/31/2019 Net income $7,401 $39,193 $44,075 $5,304 $95,973 Interest expense 1 6,243 6,323 5,634 5,660 23,860 Tax expense (benefit) (595) (4,466) 1,533 (3,597) (7,125) Depre
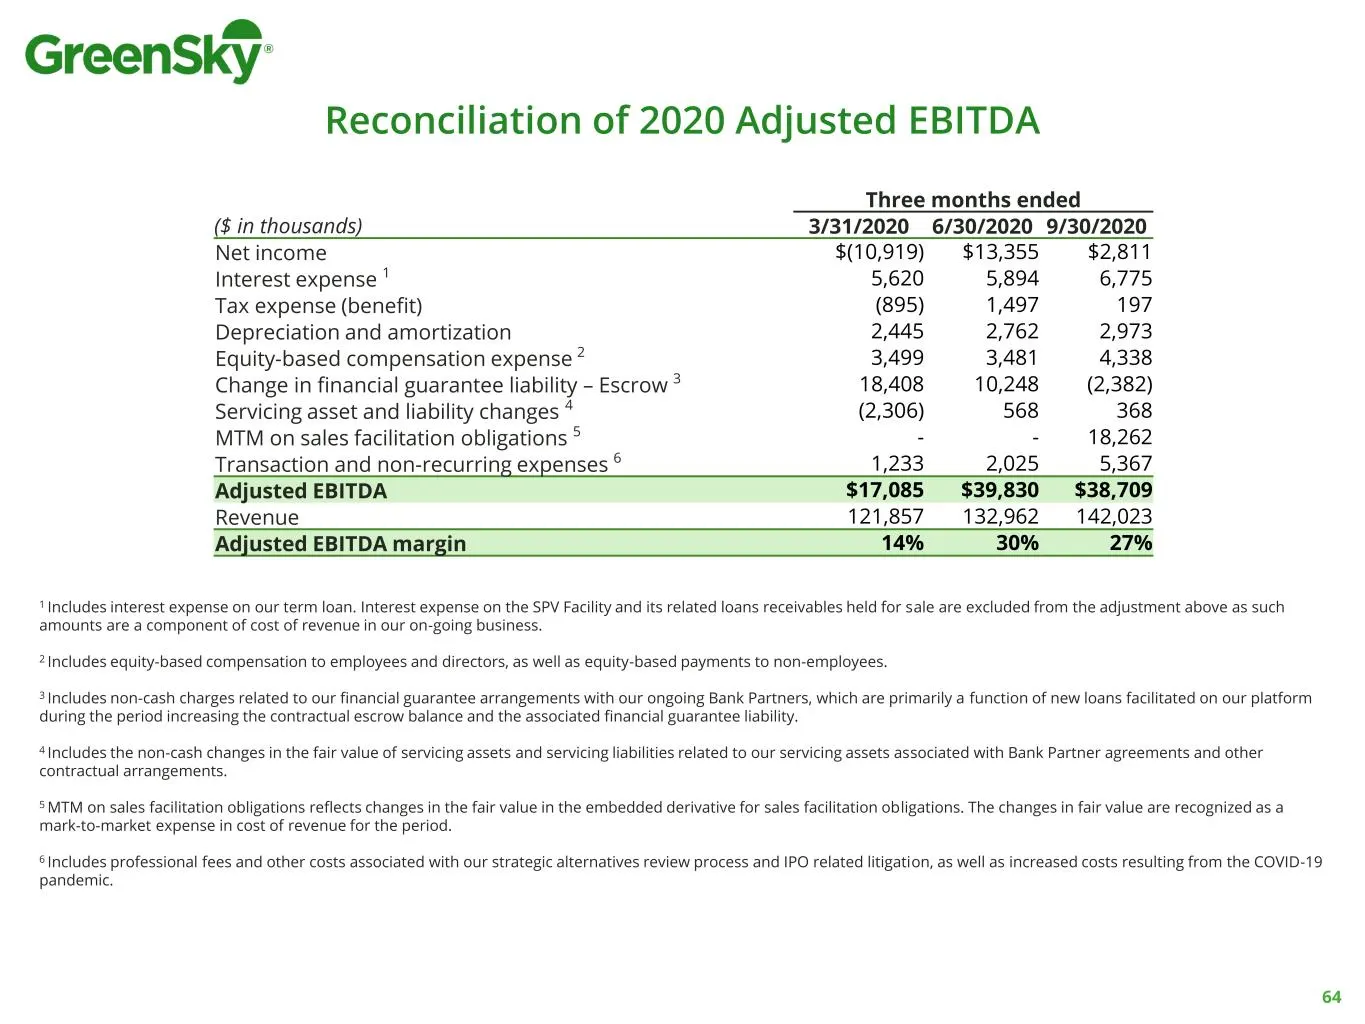
Slide 64: Reconciliation of 2020 Adjusted EBITDA
Reconciliation of 2020 Adjusted EBITDA Three months ended ($ in thousands) 3/31/2020 6/30/2020 9/30/2020 Net income $(10,919) $13,355 $2,811 Interest expense 1 5,620 5,894 6,775 Tax expense (benefit) (895) 1,497 197 Depreciation and amortization 2,445 2,762 2,973 Equity-based compensation expense 2
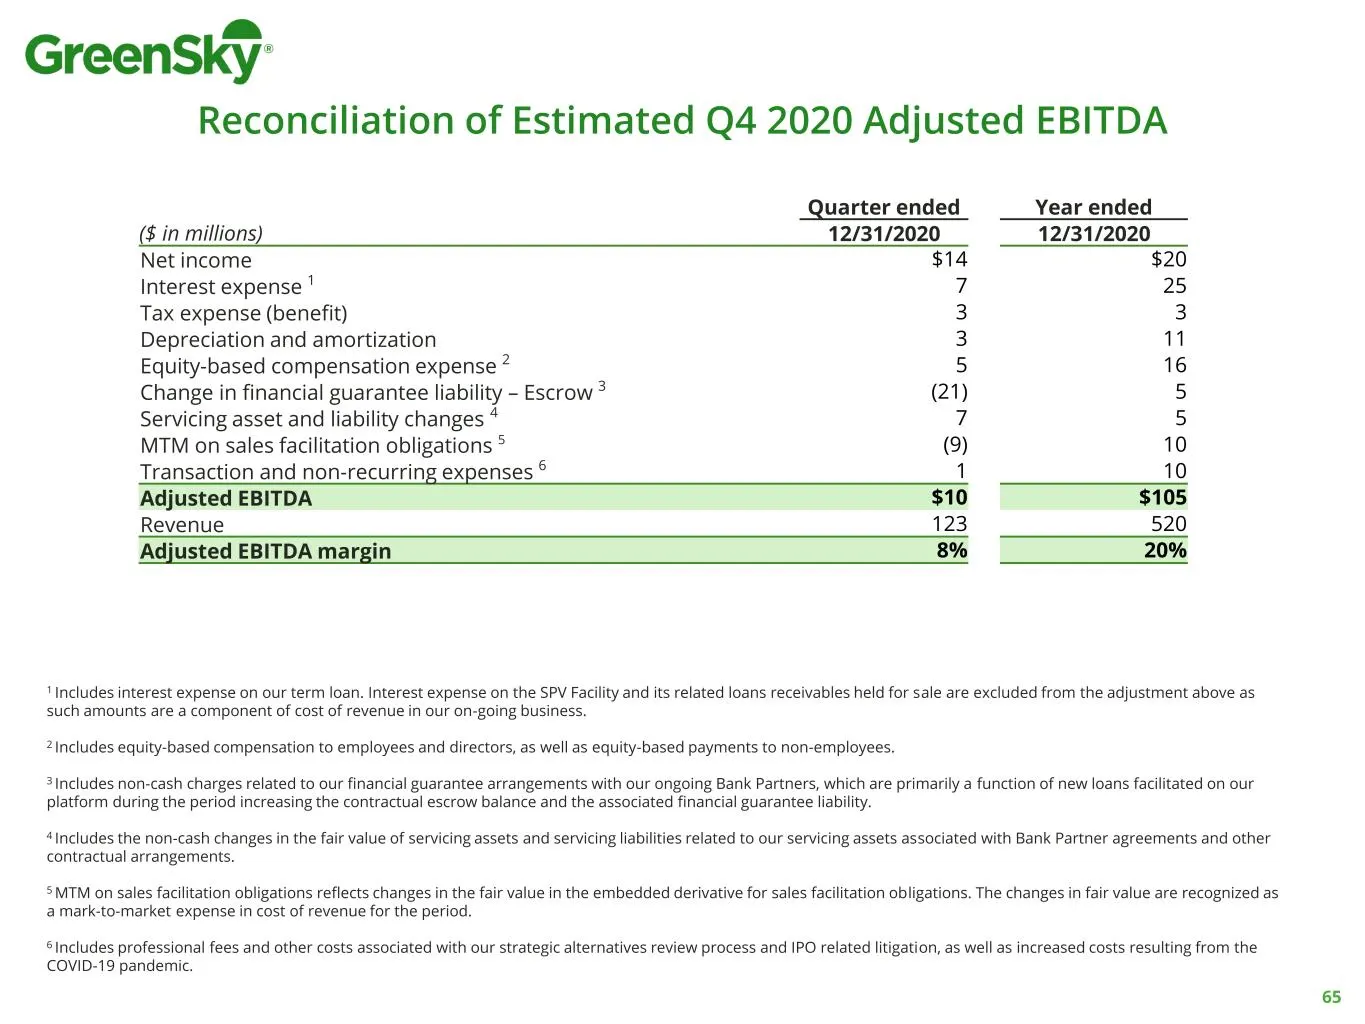
Slide 65: Reconciliation of Estimated Q4 2020 Adjusted EBITDA
Reconciliation of Estimated Q4 2020 Adjusted EBITDA Quarter ended Year ended ($ in millions) 12/31/2020 12/31/2020 Net income $14 $20 Interest expense 1 7 25 Tax expense (benefit) 3 3 Depreciation and amortization 3 11 Equity-based compensation expense 2 5 16 Change in financial guarantee liability
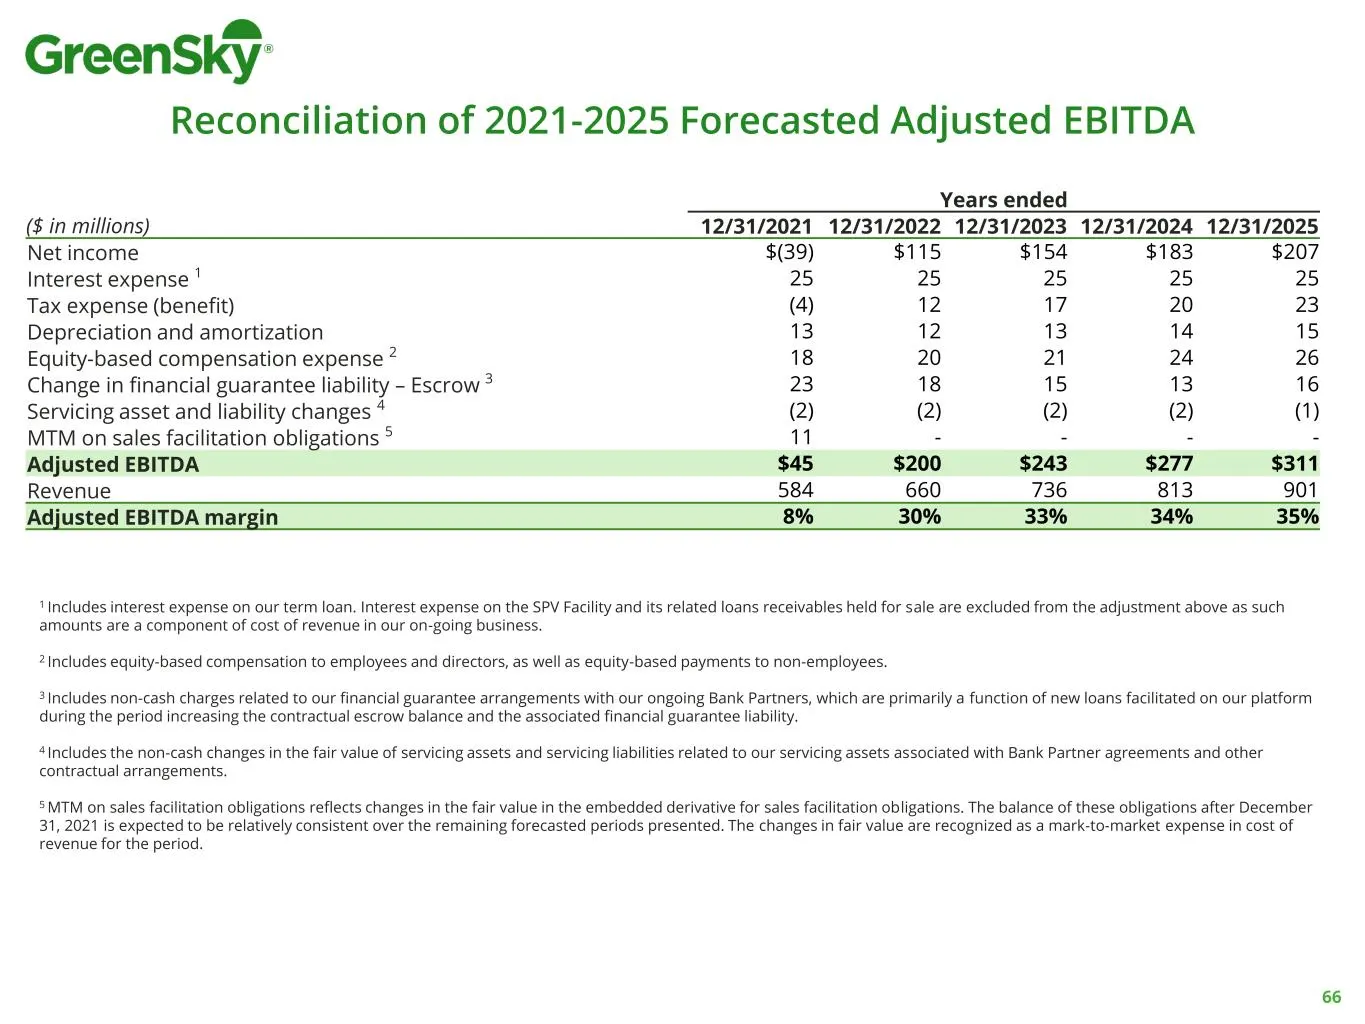
Slide 66: Reconciliation of 2021-2025 Forecasted Adjusted EBITDA
Reconciliation of 2021-2025 Forecasted Adjusted EBITDA Years ended ($ in millions) 12/31/2021 12/31/2022 12/31/2023 12/31/2024 12/31/2025 Net income $(39) $115 $154 $183 $207 Interest expense 1 25 25 25 25 25 Tax expense (benefit) (4) 12 17 20 23 Depreciation and amortization 13 12 13 14 15 Equity-b
Source: SEC EDGAR · 8-K filed Jan 12, 2021