NuStar Energy LP — 2014 NAPTP Master Limited Partnership Investor Conference
28 slides from NuStar Energy LP's conference presentation, May 21, 2014
Slide 1: 2014 NAPTP Master Limited Partnership Investor Conference
2014 NAPTP Master Limited Partnership Investor Conference May 21 & 22, 2014 Exhibit 99.1
Slide 2: Forward Looking Statements
Forward Looking Statements Statements contained in this presentation that state management’s expectations or predictions of the future are forward-looking statements as defined by federal securities law. While these forward-looking statements, and any assumptions upon which they are based, are made
Slide 3: NuStar Overview
NuStar Overview
Slide 4: NuStar Energy L.P. and NuStar GP Holdings structure
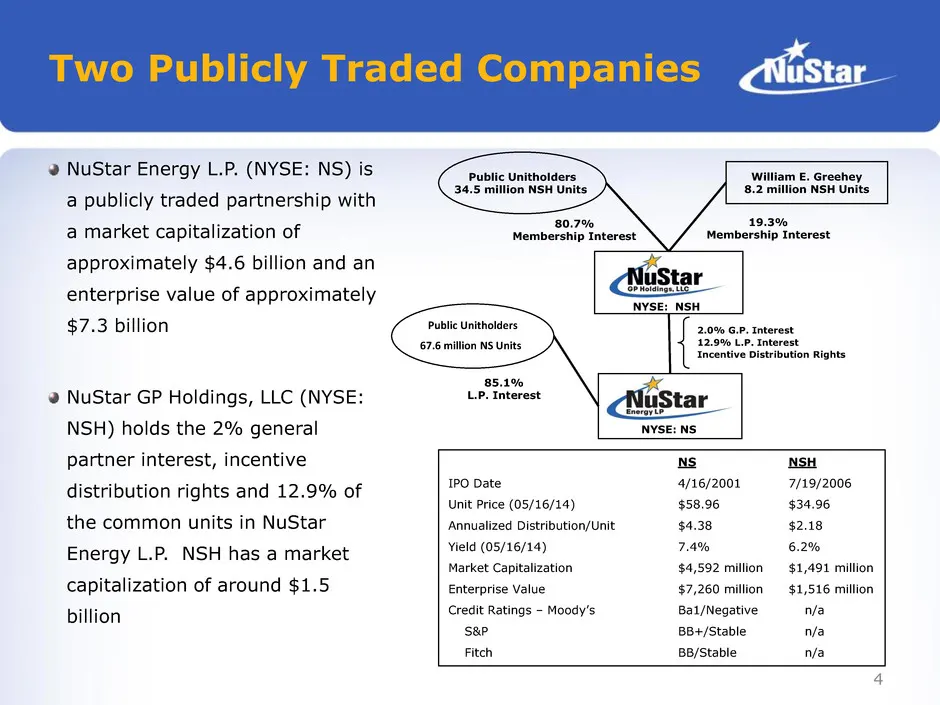
NuStar Energy L.P. (NYSE: NS) is a publicly traded partnership with a market capitalization of approximately $4.6 billion and an enterprise value of approximately $7.3 billion NuStar GP Holdings, LLC (NYSE: NSH) holds the 2% general partner interest, incentive distribution rights and 12.9% of the co
Slide 5: Large and Diverse Geographic Footprint with Assets in Key Locations
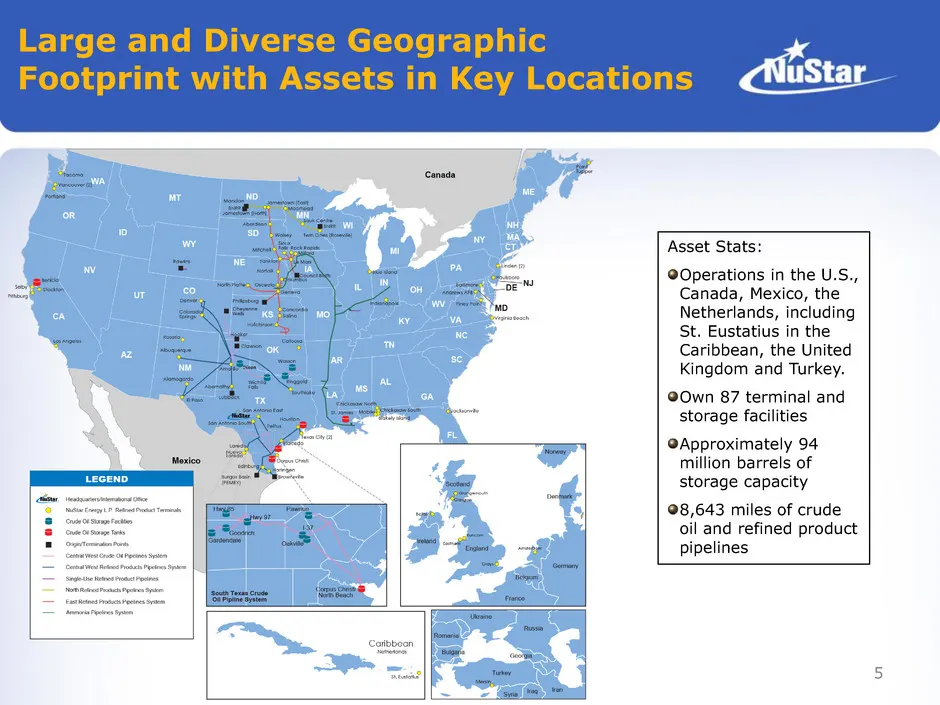
Large and Diverse Geographic Footprint with Assets in Key Locations Asset Stats: Operations in the U.S., Canada, Mexico, the Netherlands, including St. Eustatius in the Caribbean, the United Kingdom and Turkey. Own 87 terminal and storage facilities Approximately 94 million barrels of storage capaci
Slide 6: Majority of Operating Income Generated by Fee-Based Storage and Pipeline Segments
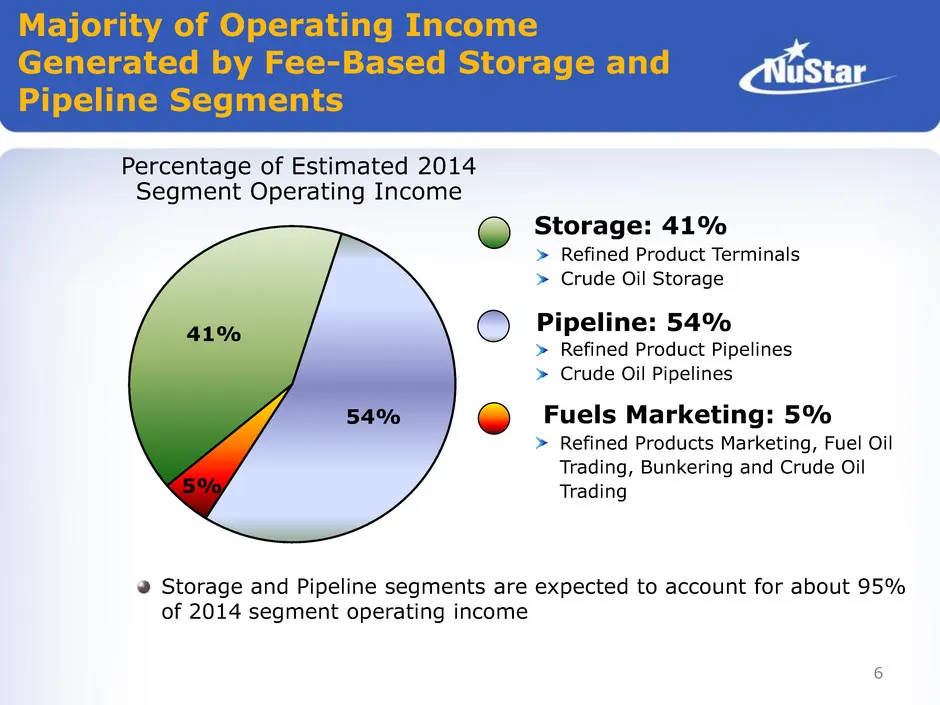
41% 54% 5% Percentage of Estimated 2014 Segment Operating Income Storage: 41% Refined Product Terminals Crude Oil Storage Pipeline: 54% Refined Product Pipelines Crude Oil Pipelines Fuels Marketing: 5% Refined Products Marketing, Fuel Oil Trading, Bunkering and Crude Oil Trading Storage and Pipeline
Slide 7: First Quarter 2014 Highlights
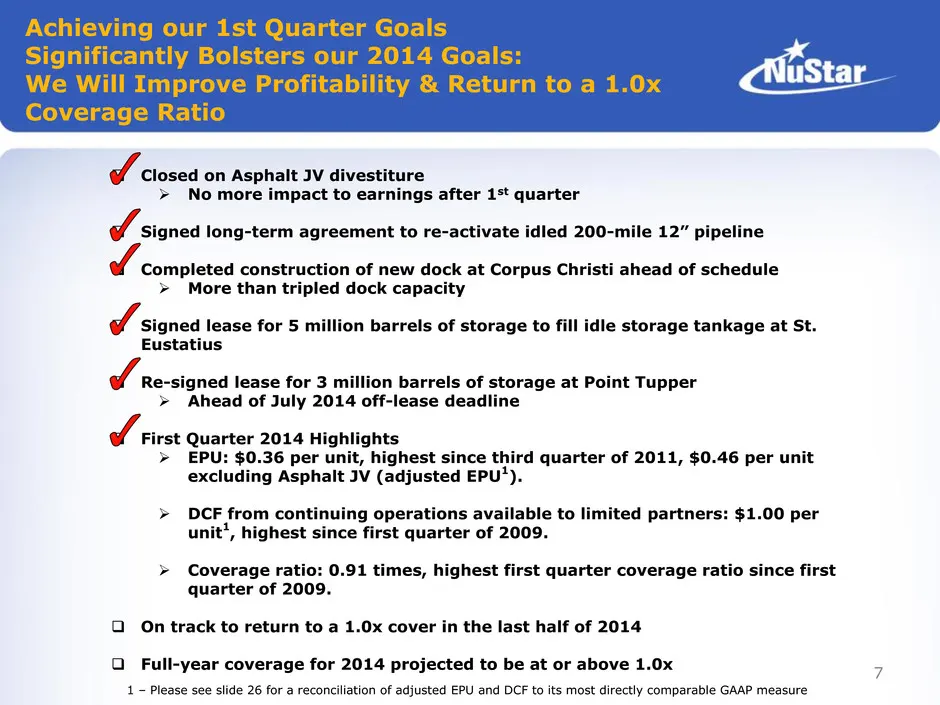
Closed on Asphalt JV divestiture No more impact to earnings after 1st quarter Signed long-term agreement to re-activate idled 200-mile 12” pipeline Completed construction of new dock at Corpus Christi ahead of schedule More than tripled dock capacity Signed lease for 5 million barrels of
Slide 8: Pipeline Segment Update
Pipeline Segment Update
Slide 9: Growth in Eagle Ford Shale Region Leading to Growth in Pipeline Segment EBITDA
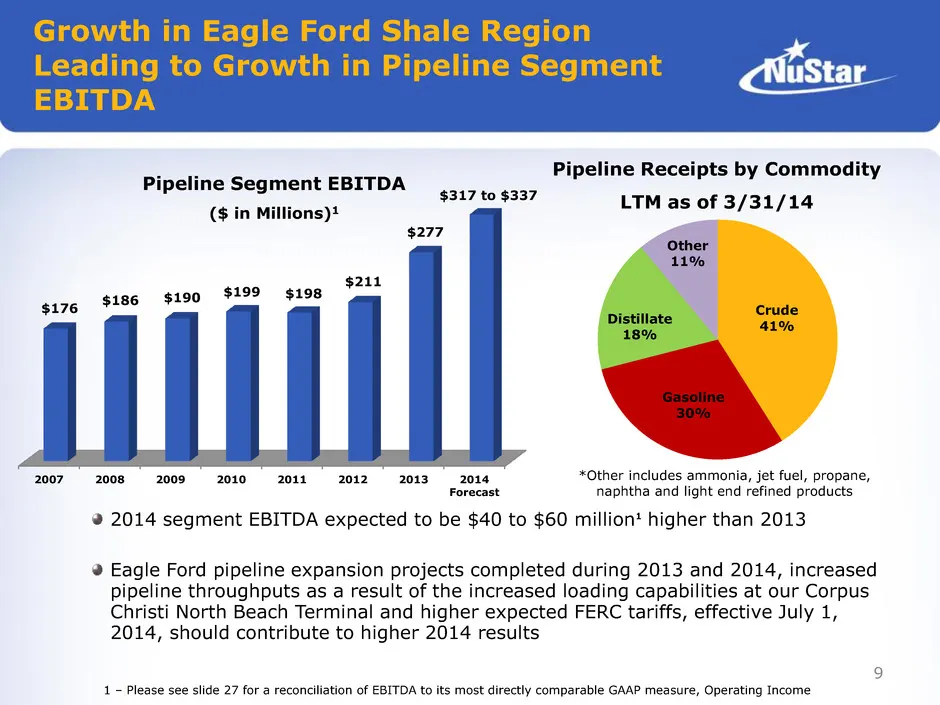
Pipeline Segment EBITDA ($ in Millions)1 Pipeline Receipts by Commodity LTM as of 3/31/14 *Other includes ammonia, jet fuel, propane, naphtha and light end refined products 2014 segment EBITDA expected to be $40 to $60 million1 higher than 2013 Eagle Ford pipeline expansion projects completed during
Slide 10: South Texas Crude Oil Pipeline Expansion
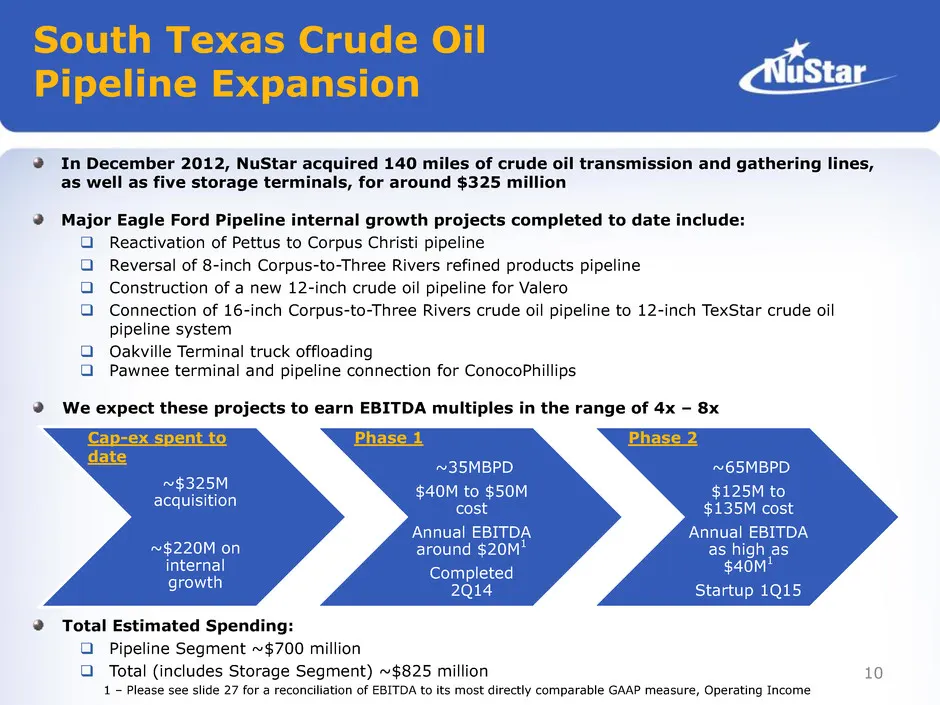
10 In December 2012, NuStar acquired 140 miles of crude oil transmission and gathering lines, as well as five storage terminals, for around $325 million Major Eagle Ford Pipeline internal growth projects completed to date include: Reactivation of Pettus to Corpus Christi pipeline Reversal of 8-i
Slide 11: NuStar Continues to Increase Throughputs in the Eagle Ford Shale Region
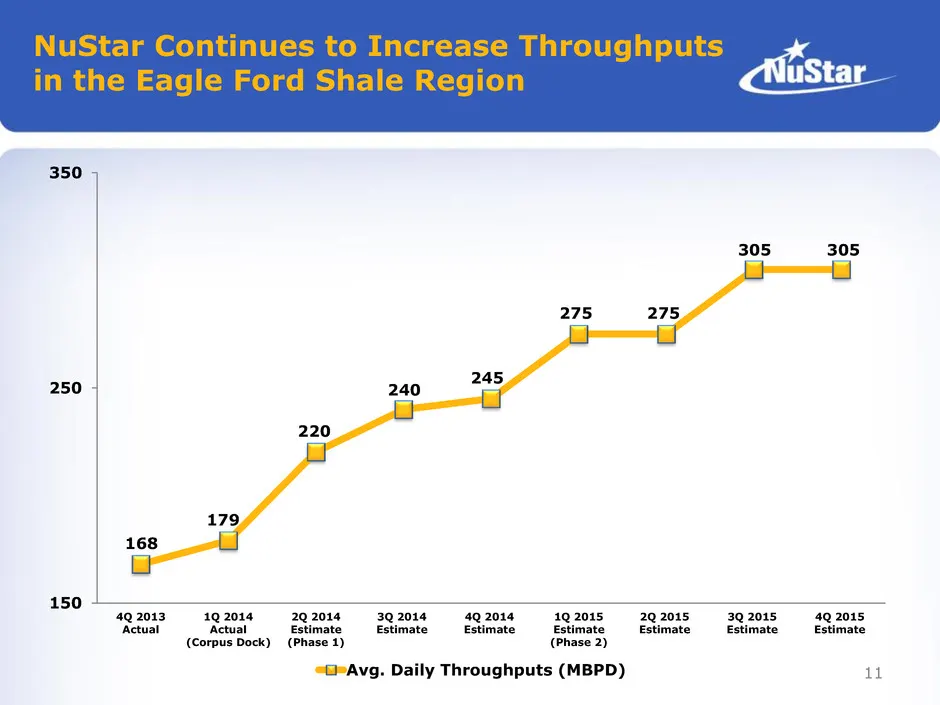
11 NuStar Continues to Increase Throughputs in the Eagle Ford Shale Region 168 179 220 240 245 275 275 305 305 150 250 350 4Q 2013 Actual 1Q 2014 Actual (Corpus Dock) 2Q 2014 Estimate (Phase 1) 3Q 2014 Estimate 4Q 2014 Estimate 1Q 2015 Estimate (Phase 2) 2Q 2015 Estimate 3Q 2015 Estimate 4Q 2015 Est
Slide 12: NuStar's Eagle Ford Presence
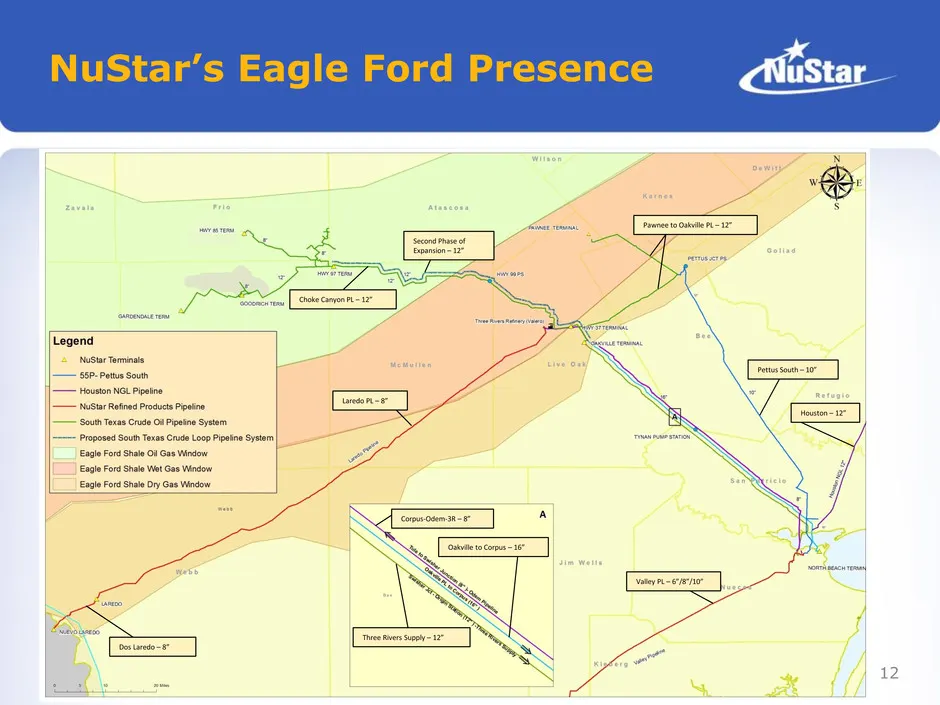
Choke Canyon PL – 12” Laredo PL – 8” Dos Laredo – 8” Valley PL – 6”/8”/10” Pettus South – 10” Houston – 12” Pawnee to Oakville PL – 12” Three Rivers Supply – 12” Corpus-Odem-3R – 8” Oakville to Corpus – 16” Second Phase of Expansion – 12” 12 NuStar’s Eagle Ford Presence
Slide 13: Reactivation of an Idle 12-inch Pipeline should increase EBITDA by $23 million
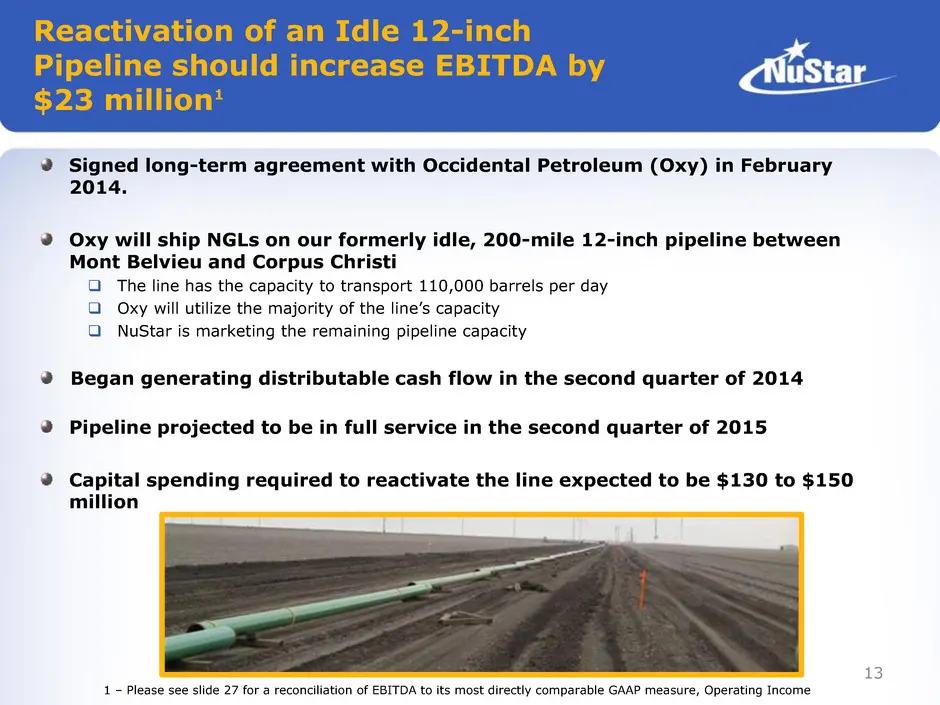
13 Reactivation of an Idle 12-inch Pipeline should increase EBITDA by $23 million1 Signed long-term agreement with Occidental Petroleum (Oxy) in February 2014. Oxy will ship NGLs on our formerly idle, 200-mile 12-inch pipeline between Mont Belvieu and Corpus Christi The line has the capacity to tr
Slide 14: Focusing on Other Pipeline Growth Opportunities
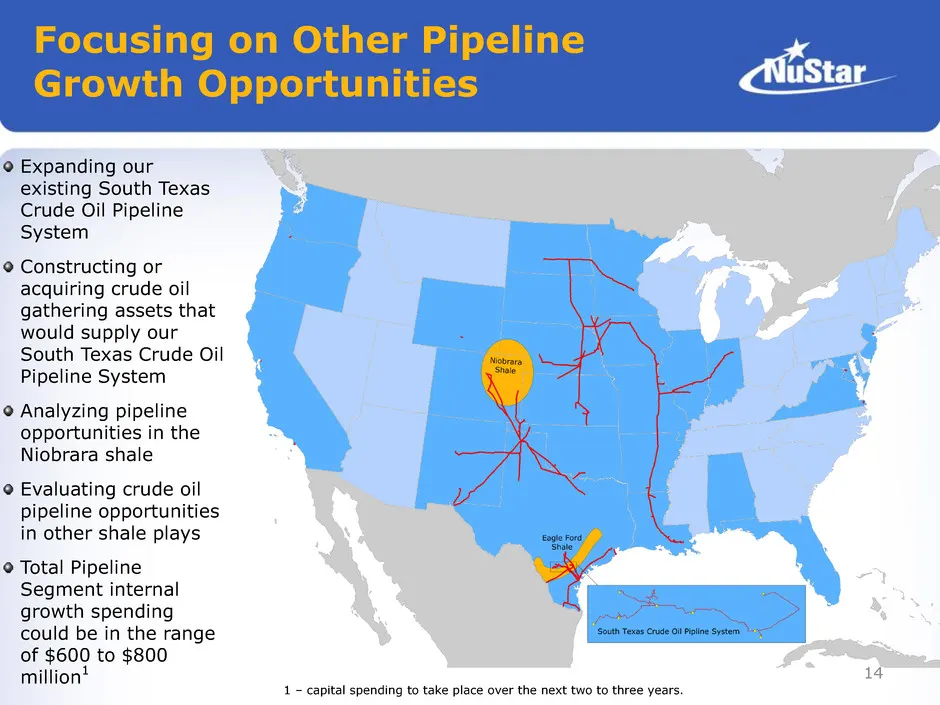
14 Focusing on Other Pipeline Growth Opportunities Expanding our existing South Texas Crude Oil Pipeline System Constructing or acquiring crude oil gathering assets that would supply our South Texas Crude Oil Pipeline System Analyzing pipeline opportunities in the Niobrara shale Evaluating crude oil
Slide 15: Storage Segment Update
Storage Segment Update
Slide 16: 2014 Storage Segment EBITDA Expected to be Comparable to 2013
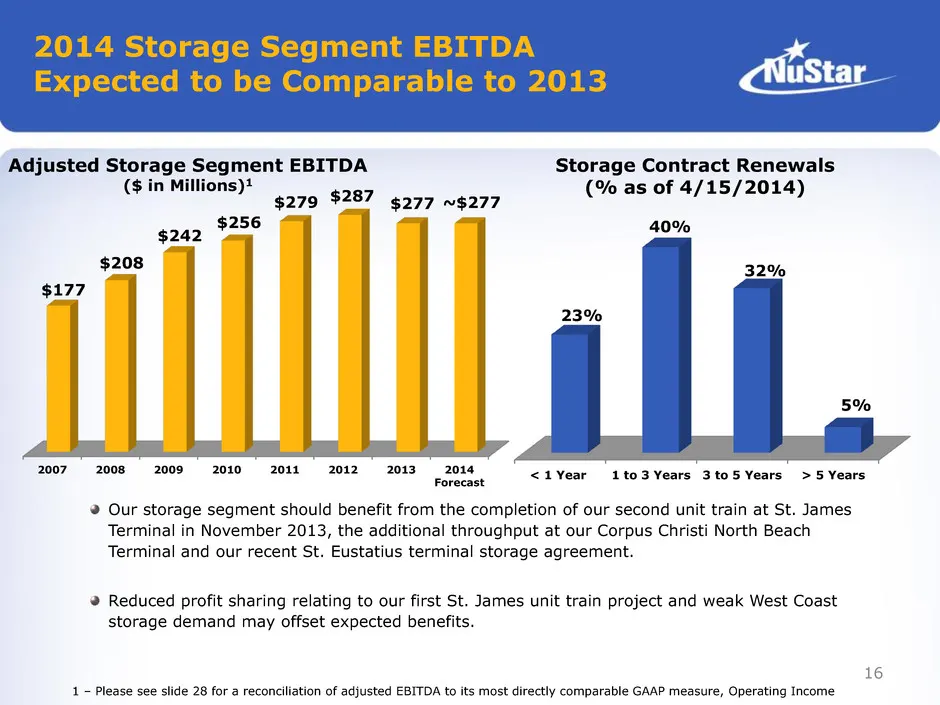
Adjusted Storage Segment EBITDA ($ in Millions)1 Storage Contract Renewals (% as of 4/15/2014) Our storage segment should benefit from the completion of our second unit train at St. James Terminal in November 2013, the additional throughput at our Corpus Christi North Beach Terminal and our recent S
Slide 17: Pursuing Other Storage Terminal Opportunities
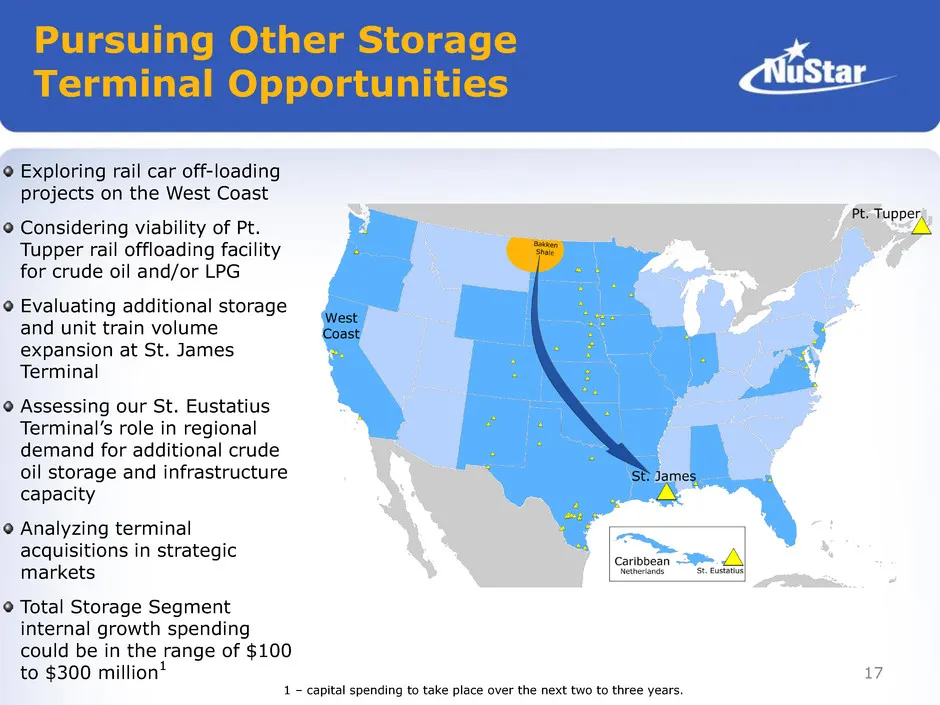
17 Pursuing Other Storage Terminal Opportunities Exploring rail car off-loading projects on the West Coast Considering viability of Pt. Tupper rail offloading facility for crude oil and/or LPG Evaluating additional storage and unit train volume expansion at St. James Terminal Assessing our St. Eusta
Slide 18: Fuels Marketing Segment Update
Fuels Marketing Segment Update
Slide 19: Reduced Working Capital Requirements and Minimized Volatility in Fuels Marketing
We Expect Reduced Working Capital Requirements and Minimized Volatility in the Fuels Marketing Segment 19 Segment is composed of: Refined Products Marketing Fuel Oil Trading and Bunkering Crude Oil Trading A back-to-back supply agreement at our St. Eustatius terminal: Reduced our working cap
Slide 20: Financial Overview
Financial Overview ctistar_
Slide 21: Capital Structure
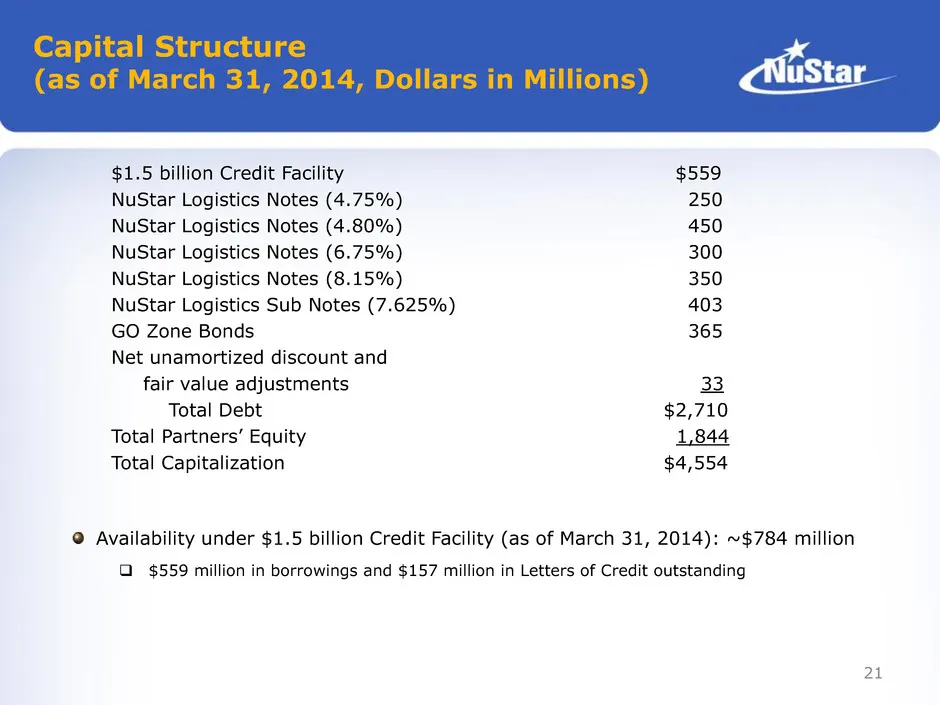
21 Capital Structure (as of March 31, 2014, Dollars in Millions) $1.5 billion Credit Facility $559 NuStar Logistics Notes (4.75%) 250 NuStar Logistics Notes (4.80%) 450 NuStar Logistics Notes (6.75%) 300 NuStar Logistics Notes (8.15%) 350 NuStar Logistics Sub Notes (7.625%) 403 GO Zone Bonds 365 Net
Slide 22: Debt Maturity Profile
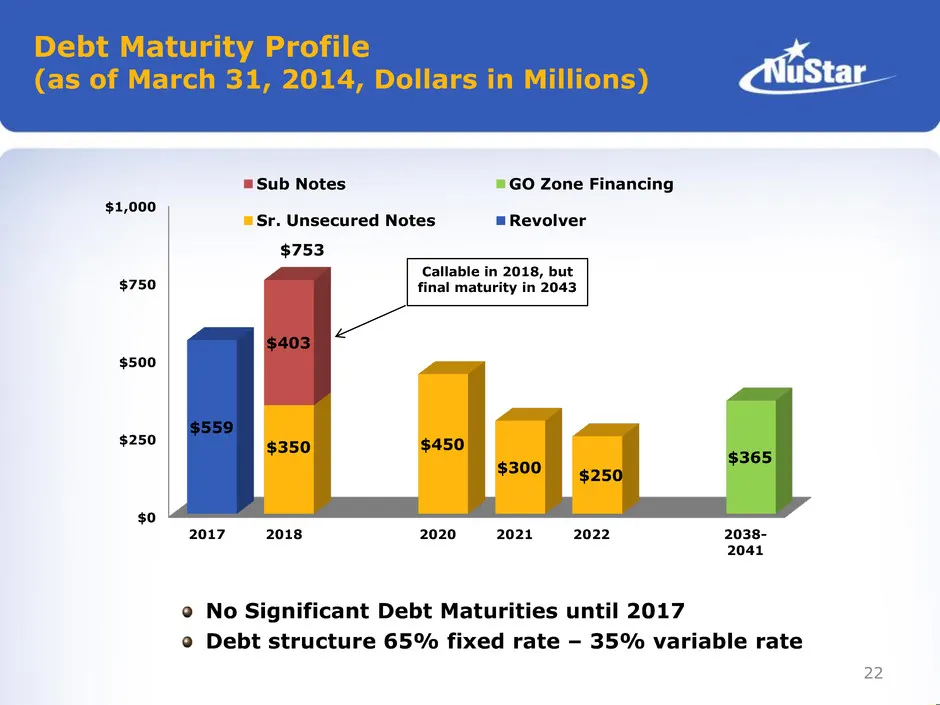
22 Debt Maturity Profile (as of March 31, 2014, Dollars in Millions) $0 $250 $500 $750 $1,000 2017 2018 2020 2021 2022 2038- 2041 $559 $350 $450 $300 $250 $365 $403 Sub Notes GO Zone Financing Sr. Unsecured Notes Revolver $753 No Significant Debt Maturities until 2017 Debt structure 65% fixed rate –
Slide 23: Internal Growth Spending: Expect $350 to $370 million for 2014
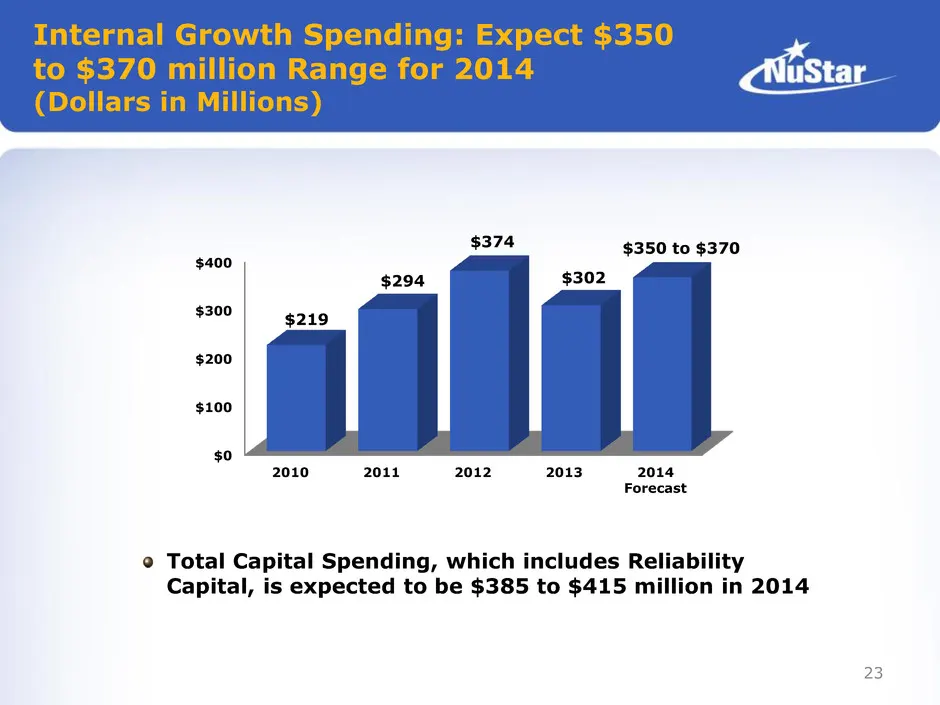
23 Internal Growth Spending: Expect $350 to $370 million Range for 2014 (Dollars in Millions) $0 $100 $200 $300 $400 2010 2011 2012 2013 2014 Forecast $219 $294 $374 $302 $350 to $370 Total Capital Spending, which includes Reliability Capital, is expected to be $385 to $415 million in 2014
Slide 24: Our Unitholders Can Rely on us to Continue Focusing on…
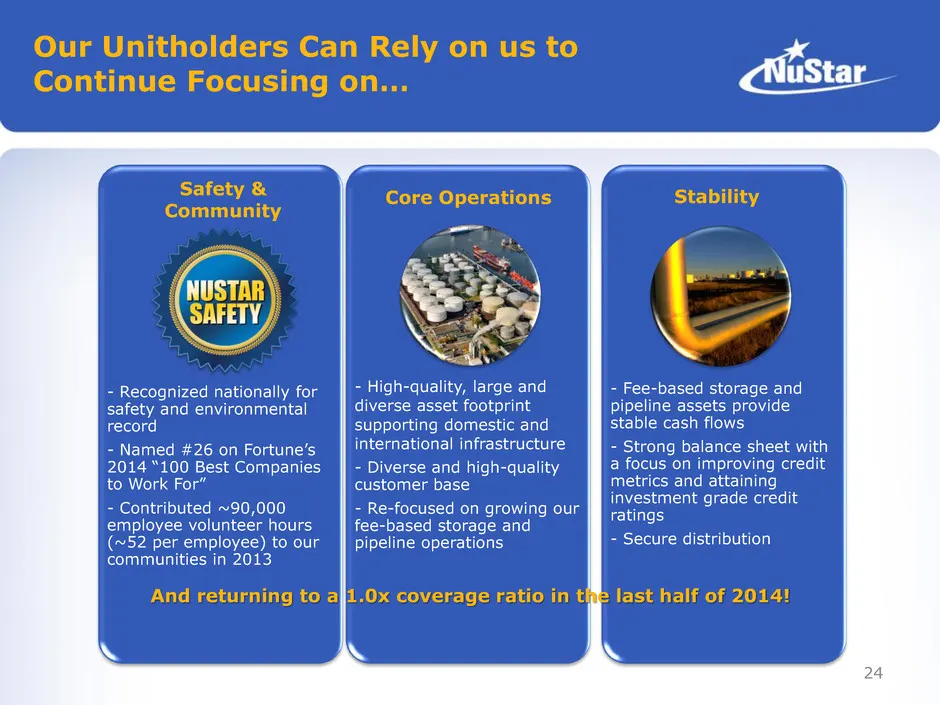
24 Our Unitholders Can Rely on us to Continue Focusing on… - Recognized nationally for safety and environmental record - Named #26 on Fortune’s 2014 “100 Best Companies to Work For” - Contributed ~90,000 employee volunteer hours (~52 per employee) to our communities in 2013 - High-quality, large and
Slide 25: Appendix
Appendix
Slide 26: Reconciliation of Non-GAAP Financial Information
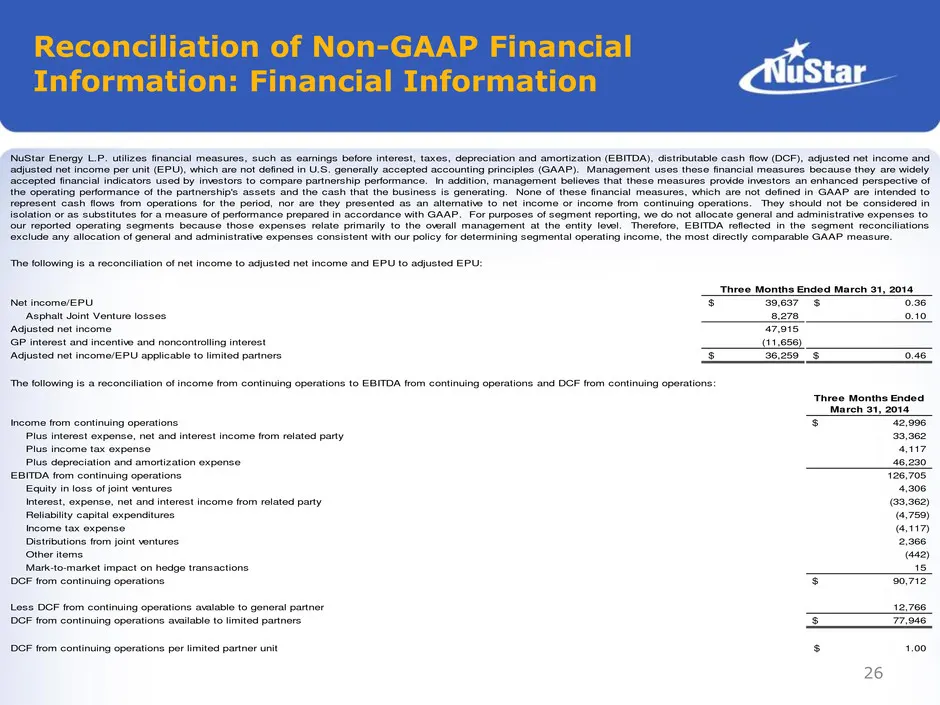
Reconciliation of Non-GAAP Financial Information: Financial Information Net income/EPU 39,637$ 0.36$ Asphalt Joint Venture losses 8,278 0.10 Adjusted net income 47,915 GP interest and incentive and noncontrolling interest (11,656) Adjusted net income/EPU applicable to limited partners 36,259$ 0.46$
Slide 27: Reconciliation of Non-GAAP Financial Information: Pipeline Segment
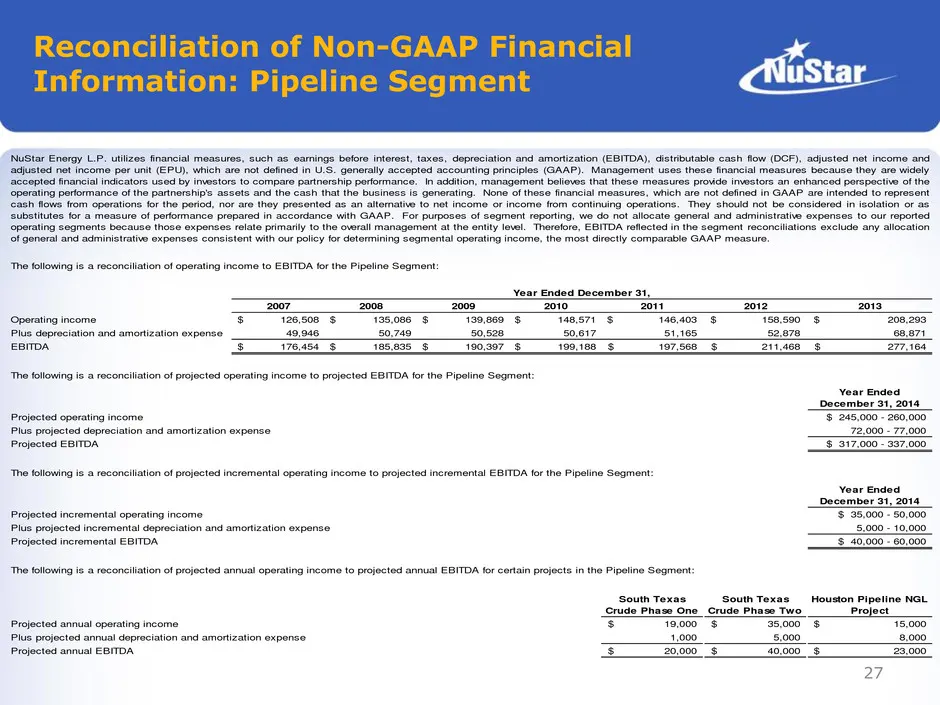
Reconciliation of Non-GAAP Financial Information: Pipeline Segment 2007 2008 2009 2010 2011 2012 2013 Operating income 126,508$ 135,086$ 139,869$ 148,571$ 146,403$ 158,590$ 208,293$ Plus depreciation and amortization expense 49,946 50,749 50,528 50,617 51,165 52,878 68,871 EBITDA 176,454$ 185,835$ 1
Slide 28: Reconciliation of Non-GAAP Financial Information: Storage & Fuels Marketing Segments
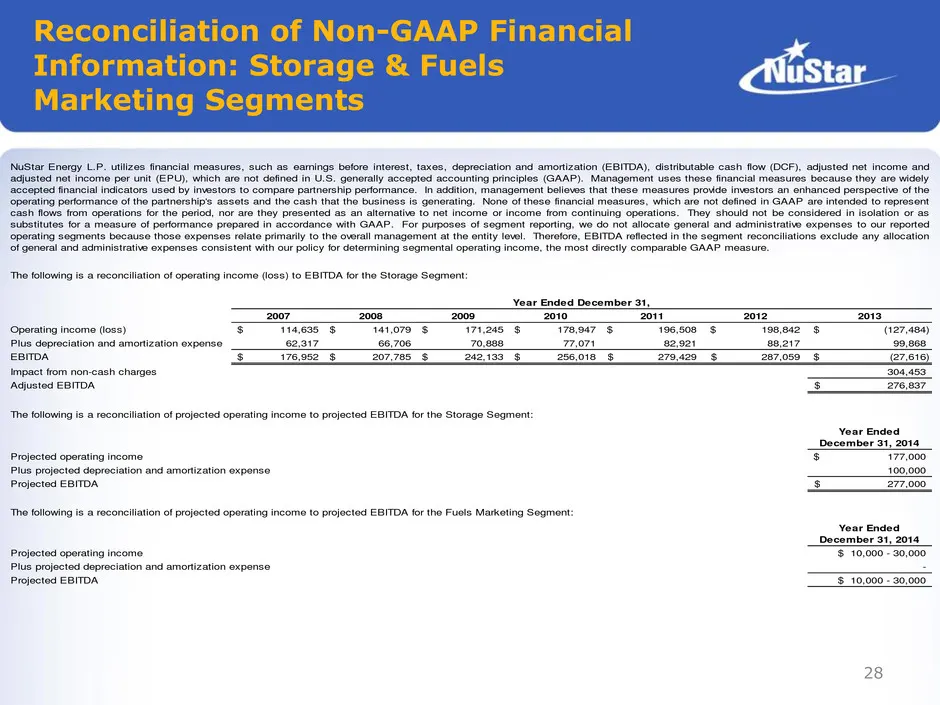
Reconciliation of Non-GAAP Financial Information: Storage & Fuels Marketing Segments 2007 2008 2009 2010 2011 2012 2013 Operating income (loss) 114,635$ 141,079$ 171,245$ 178,947$ 196,508$ 198,842$ (127,484)$ Plus depreciation and amortization expense 62,317 66,706 70,888 77,071 82,921 88,217 99,868
Source: SEC EDGAR · 8-K filed May 21, 2014
More decks from NuStar Energy LP
 Merger or Acquisition (January 2024)14 slides · Jan 22, 2024
 Investor Presentation (December 2023)35 slides · Dec 5, 2023
 Raymond James Virtual Energy Supply Chain Conference 2023; Pickering Energy Partners TE&MF36 slides · Sep 19, 2023
 Barclays CEO Energy-Power Conference 202336 slides · Sep 6, 2023
 Citi One-on-One Midstream/Energy Infrastructure Conference 202336 slides · Aug 22, 2023
 8th Annual J.P. Morgan Energy, Power & Renewables Conference 202336 slides · Jun 21, 2023