Energen — Barclay's CEO Energy-Power Conference 2013
28 slides from Energen's conference presentation, Sep 9, 2013
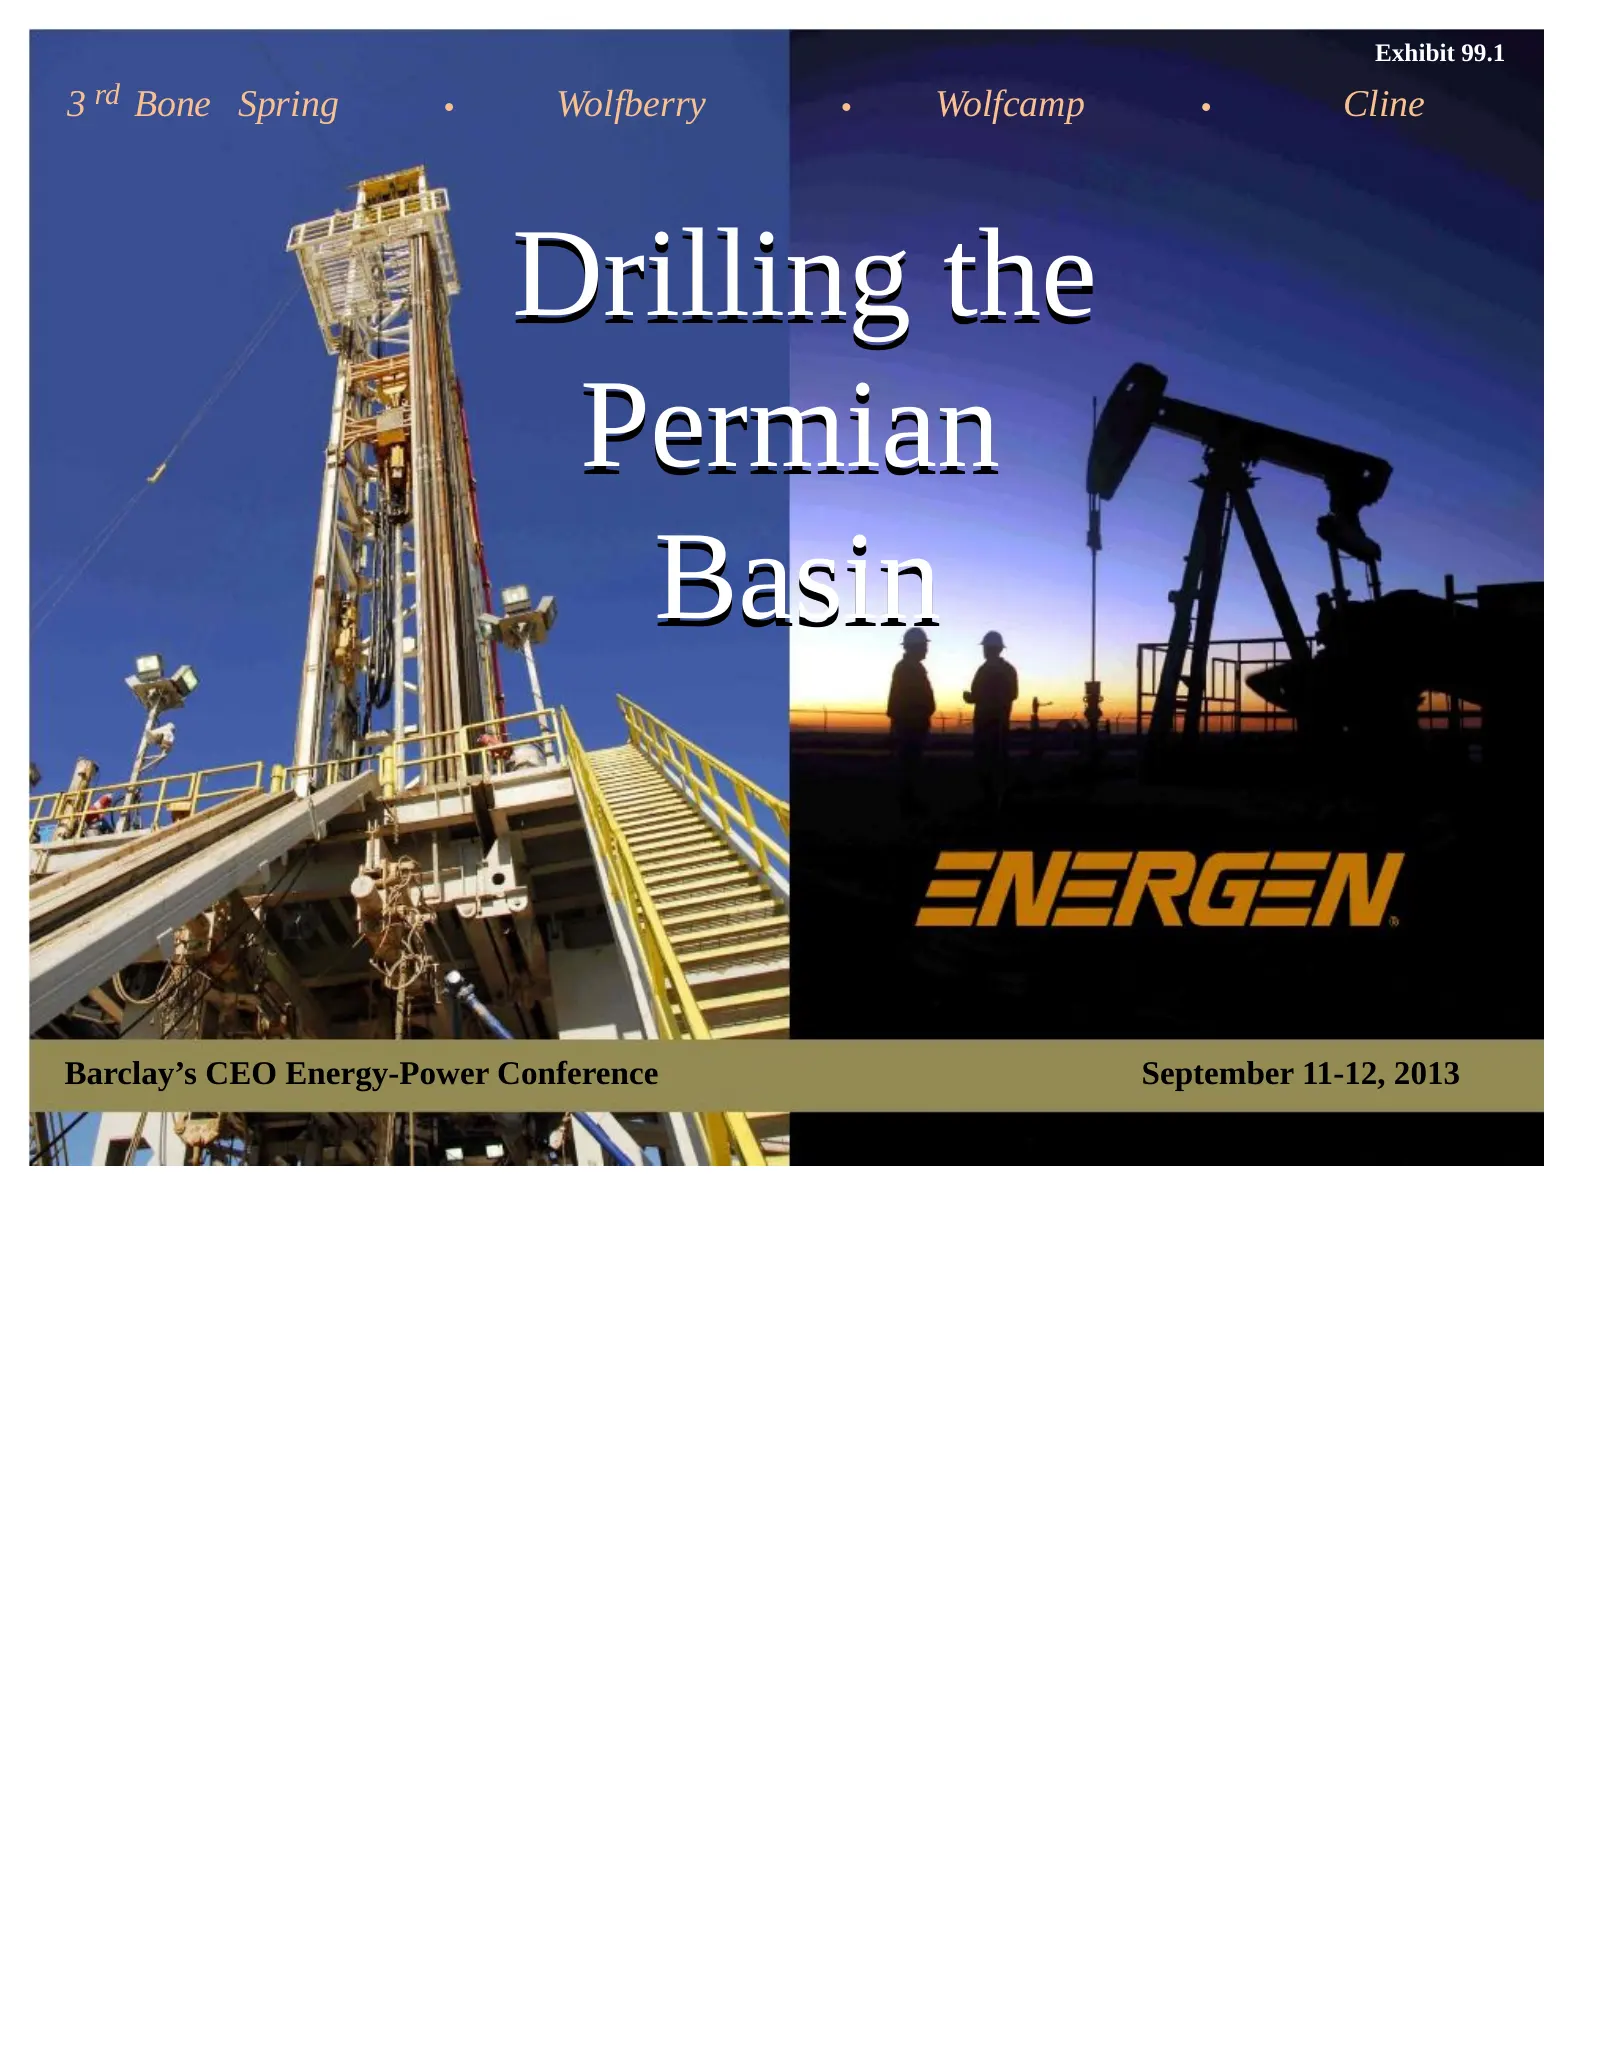
Slide 1: Drilling the Permian Basin
Exhibit 99.1 3 rd Bone Spring • Wolfberry • Wolfcamp • Cline Drilling the Permian Basin Barclay’s CEO Energy-Power Conference September 11-12, 2013

Slide 2: Forward-Looking Statements
Forward-Looking Statements This presentation (including associated oral commentary) contains statements expressing expectations of future plans, objectives, and performance that constitute forward-looking statements made pursuant to the Safe Harbor Provision of the Private Securities Litigation Refo
Slide 3: Oil & Gas Quantities: Cautionary Statement
Oil & Gas Quantities: Cautionary Statement The SEC permits oil and gas companies to disclose in SEC filings only proved, probable, and possible reserves that meet the SEC’s definitions for such terms, and price and cost sensitivities for such reserves, and prohibits disclosure of resources that do n
Slide 4: Energen Investment Highlights
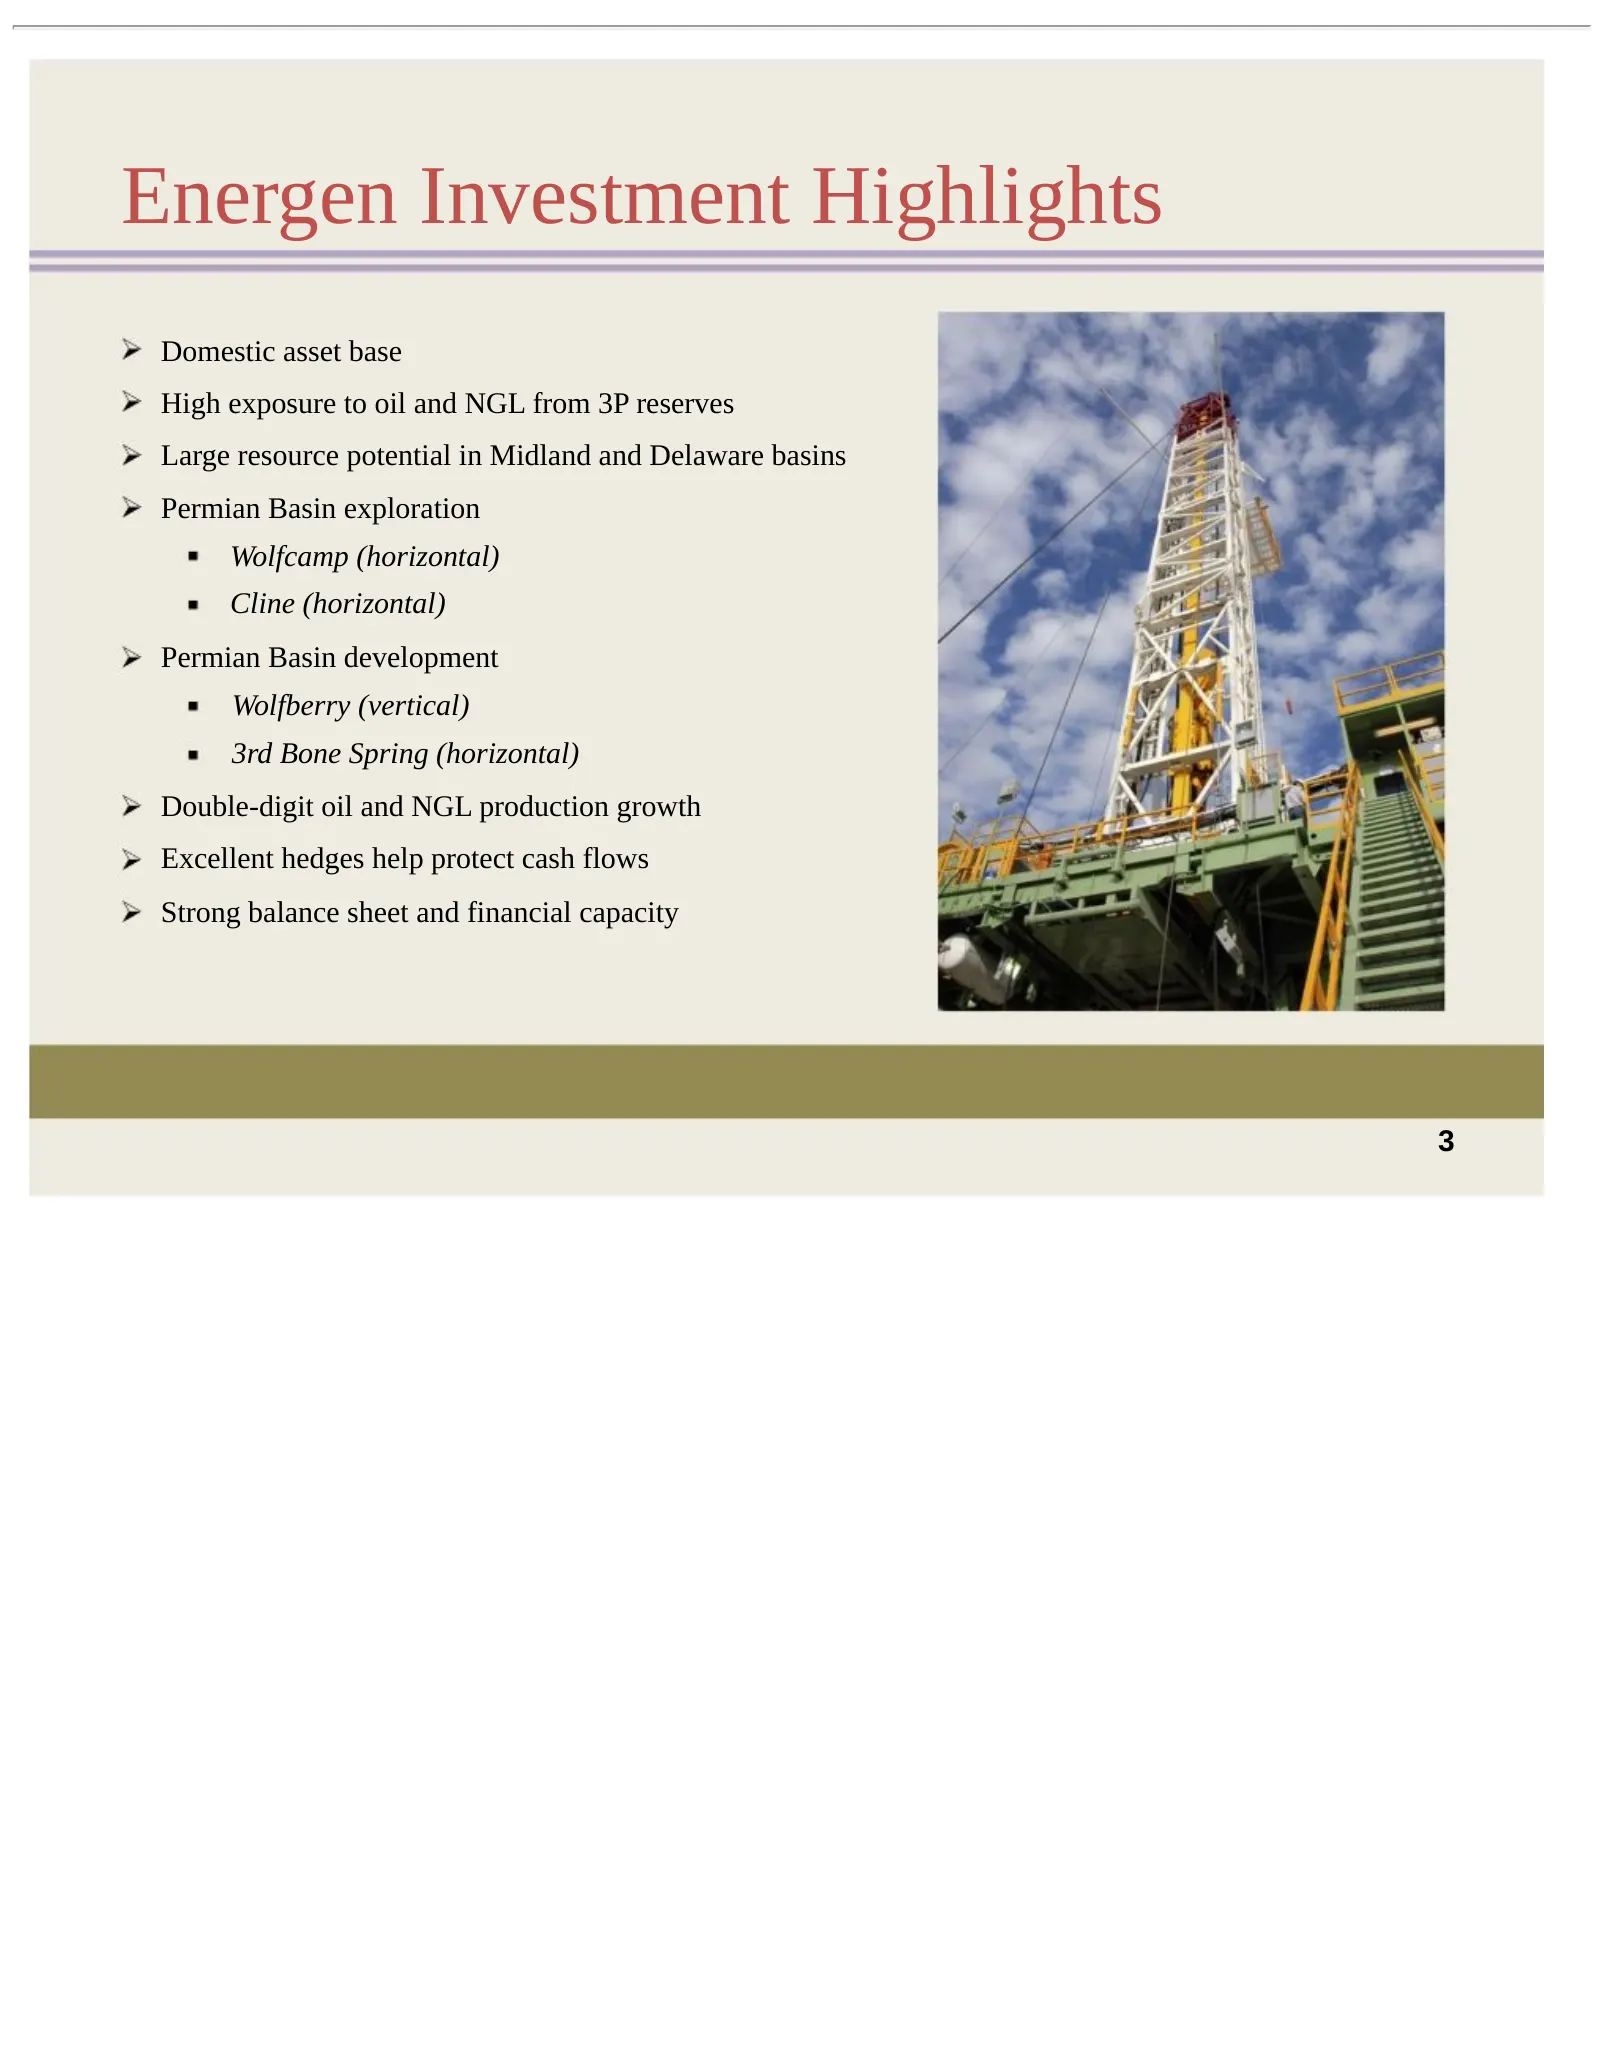
Energen Investment Highlights Domestic asset base High exposure to oil and NGL from 3P reserves Large resource potential in Midland and Delaware basins Permian Basin exploration Wolfcamp (horizontal) Cline (horizontal) Permian Basin development Wolfberry (vertical) 3rd Bone Spring (horizontal) Doubl
Slide 5: Energen Profile
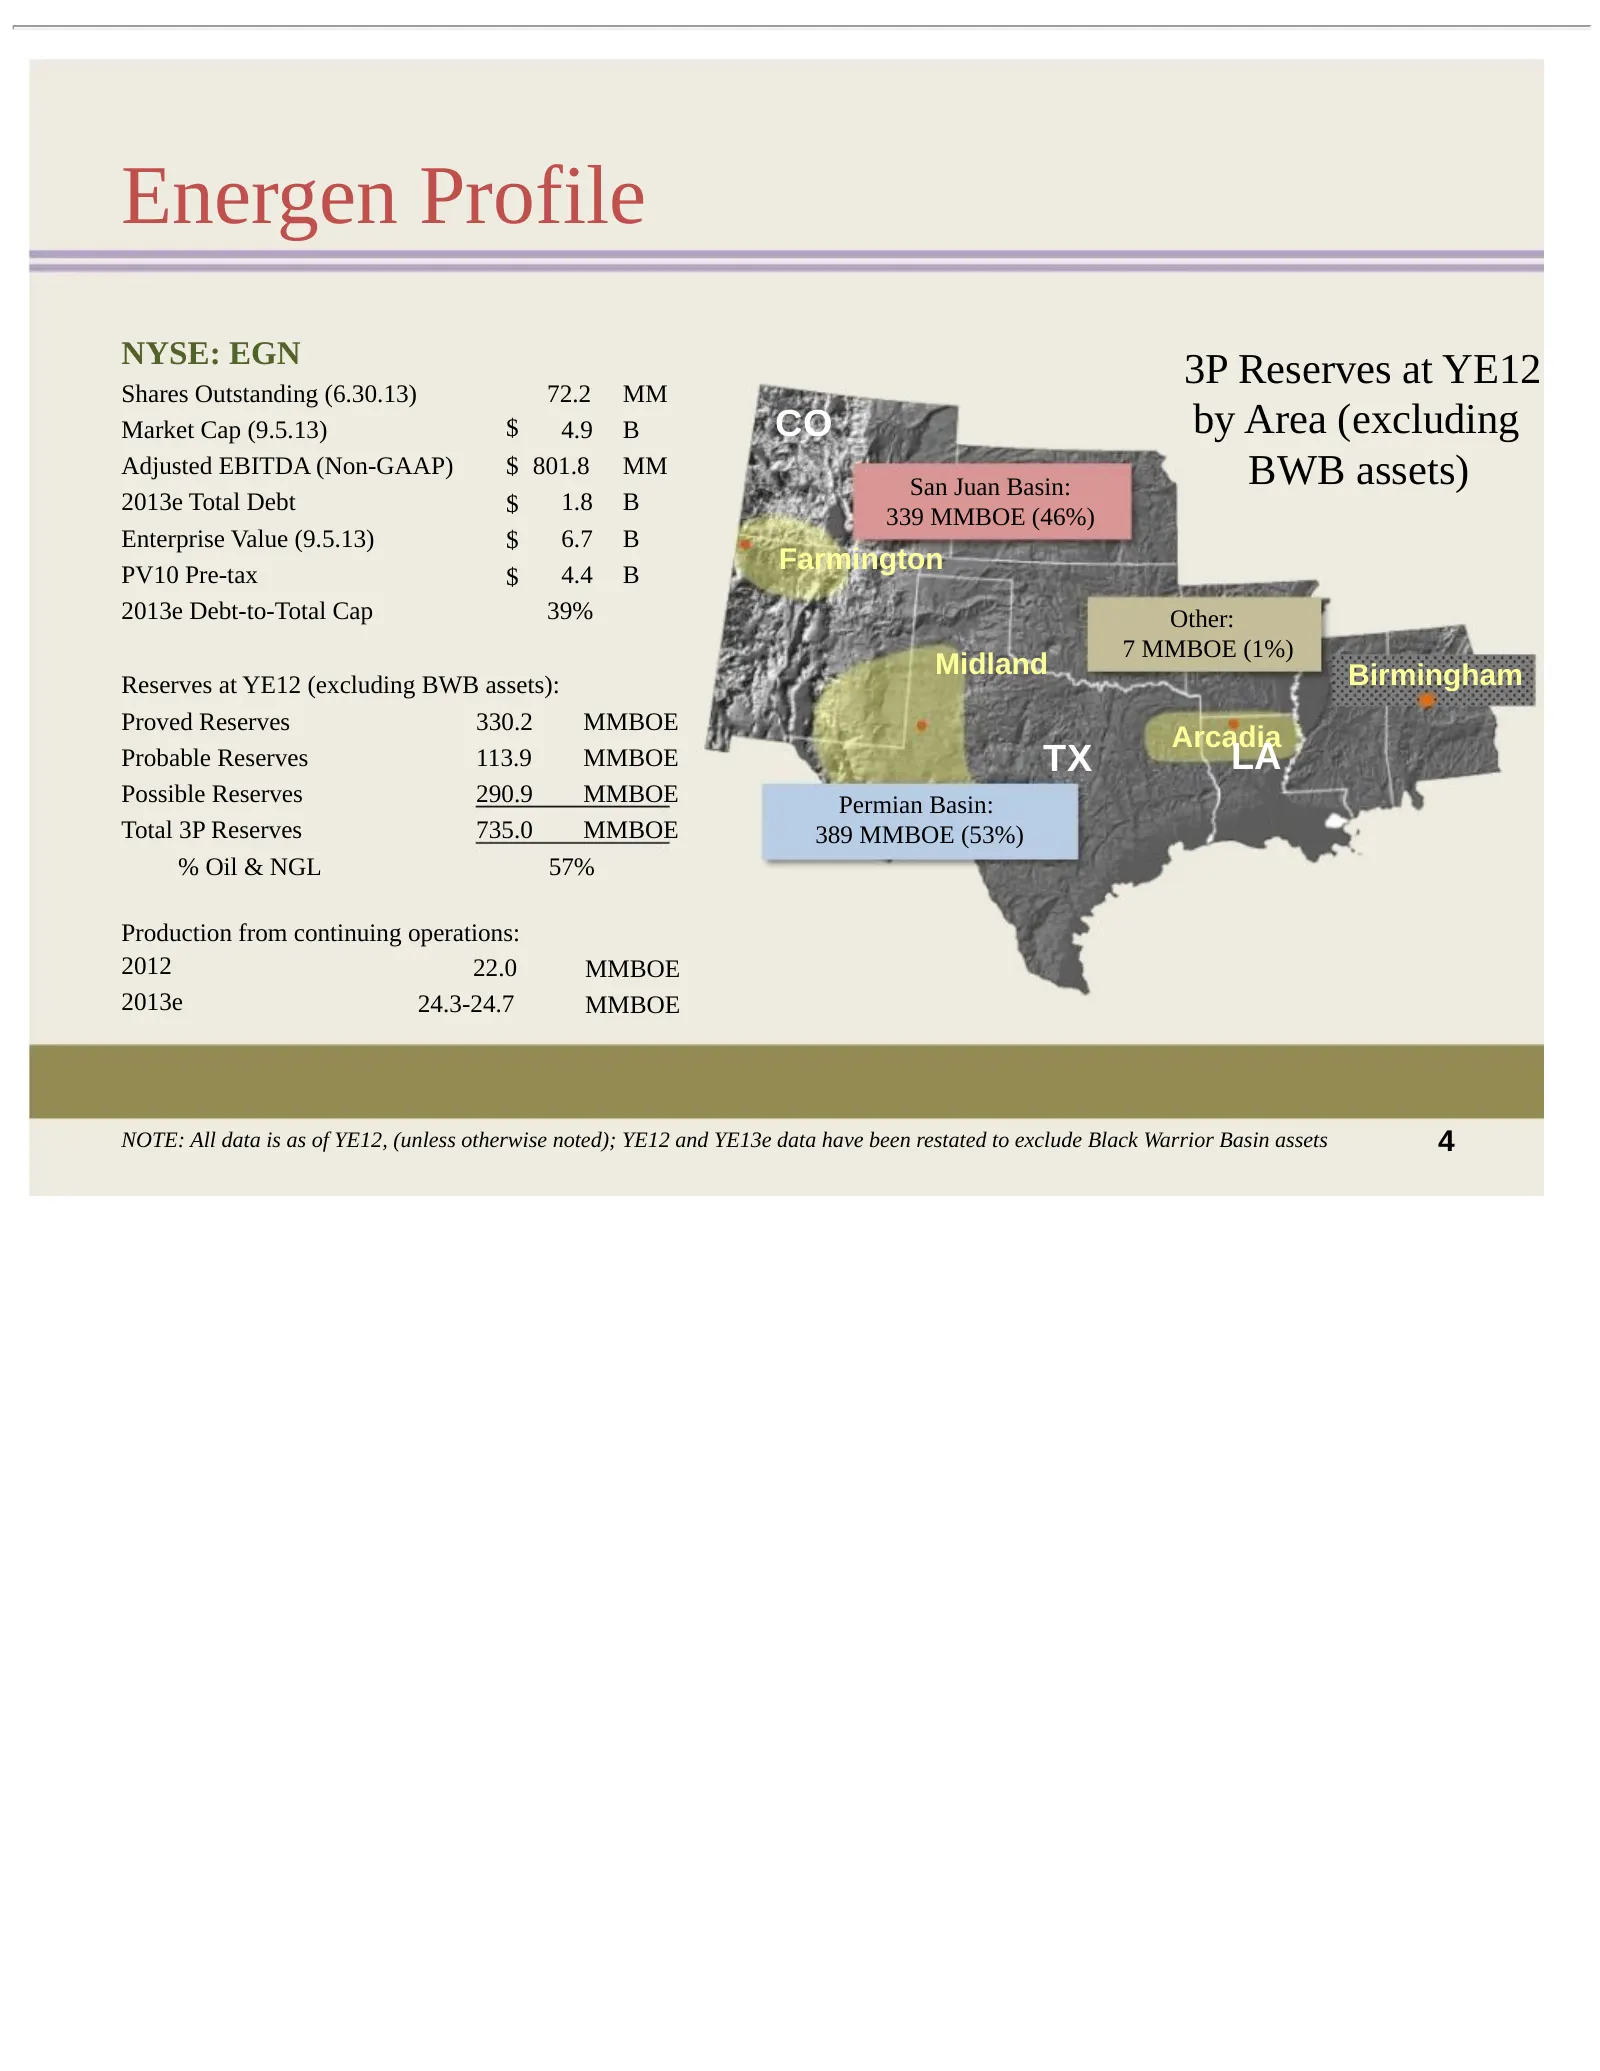
Energen Profile NYSE: EGN Shares Outstanding (6.30.13) 72.2 MM 3P Reserves at YE12 Market Cap (9.5.13) $ 4.9 B CO by Area (excluding Adjusted EBITDA (Non-GAAP) $ 801.8 MM San Juan Basin: BWB assets) 2013e Total Debt $ 1.8 B 339 MMBOE (46%) Enterprise Value (9.5.13) $ 6.7 B PV10 Pre-tax 4.4 B Farming
Slide 6: Double-Digit Liquids Production Growth
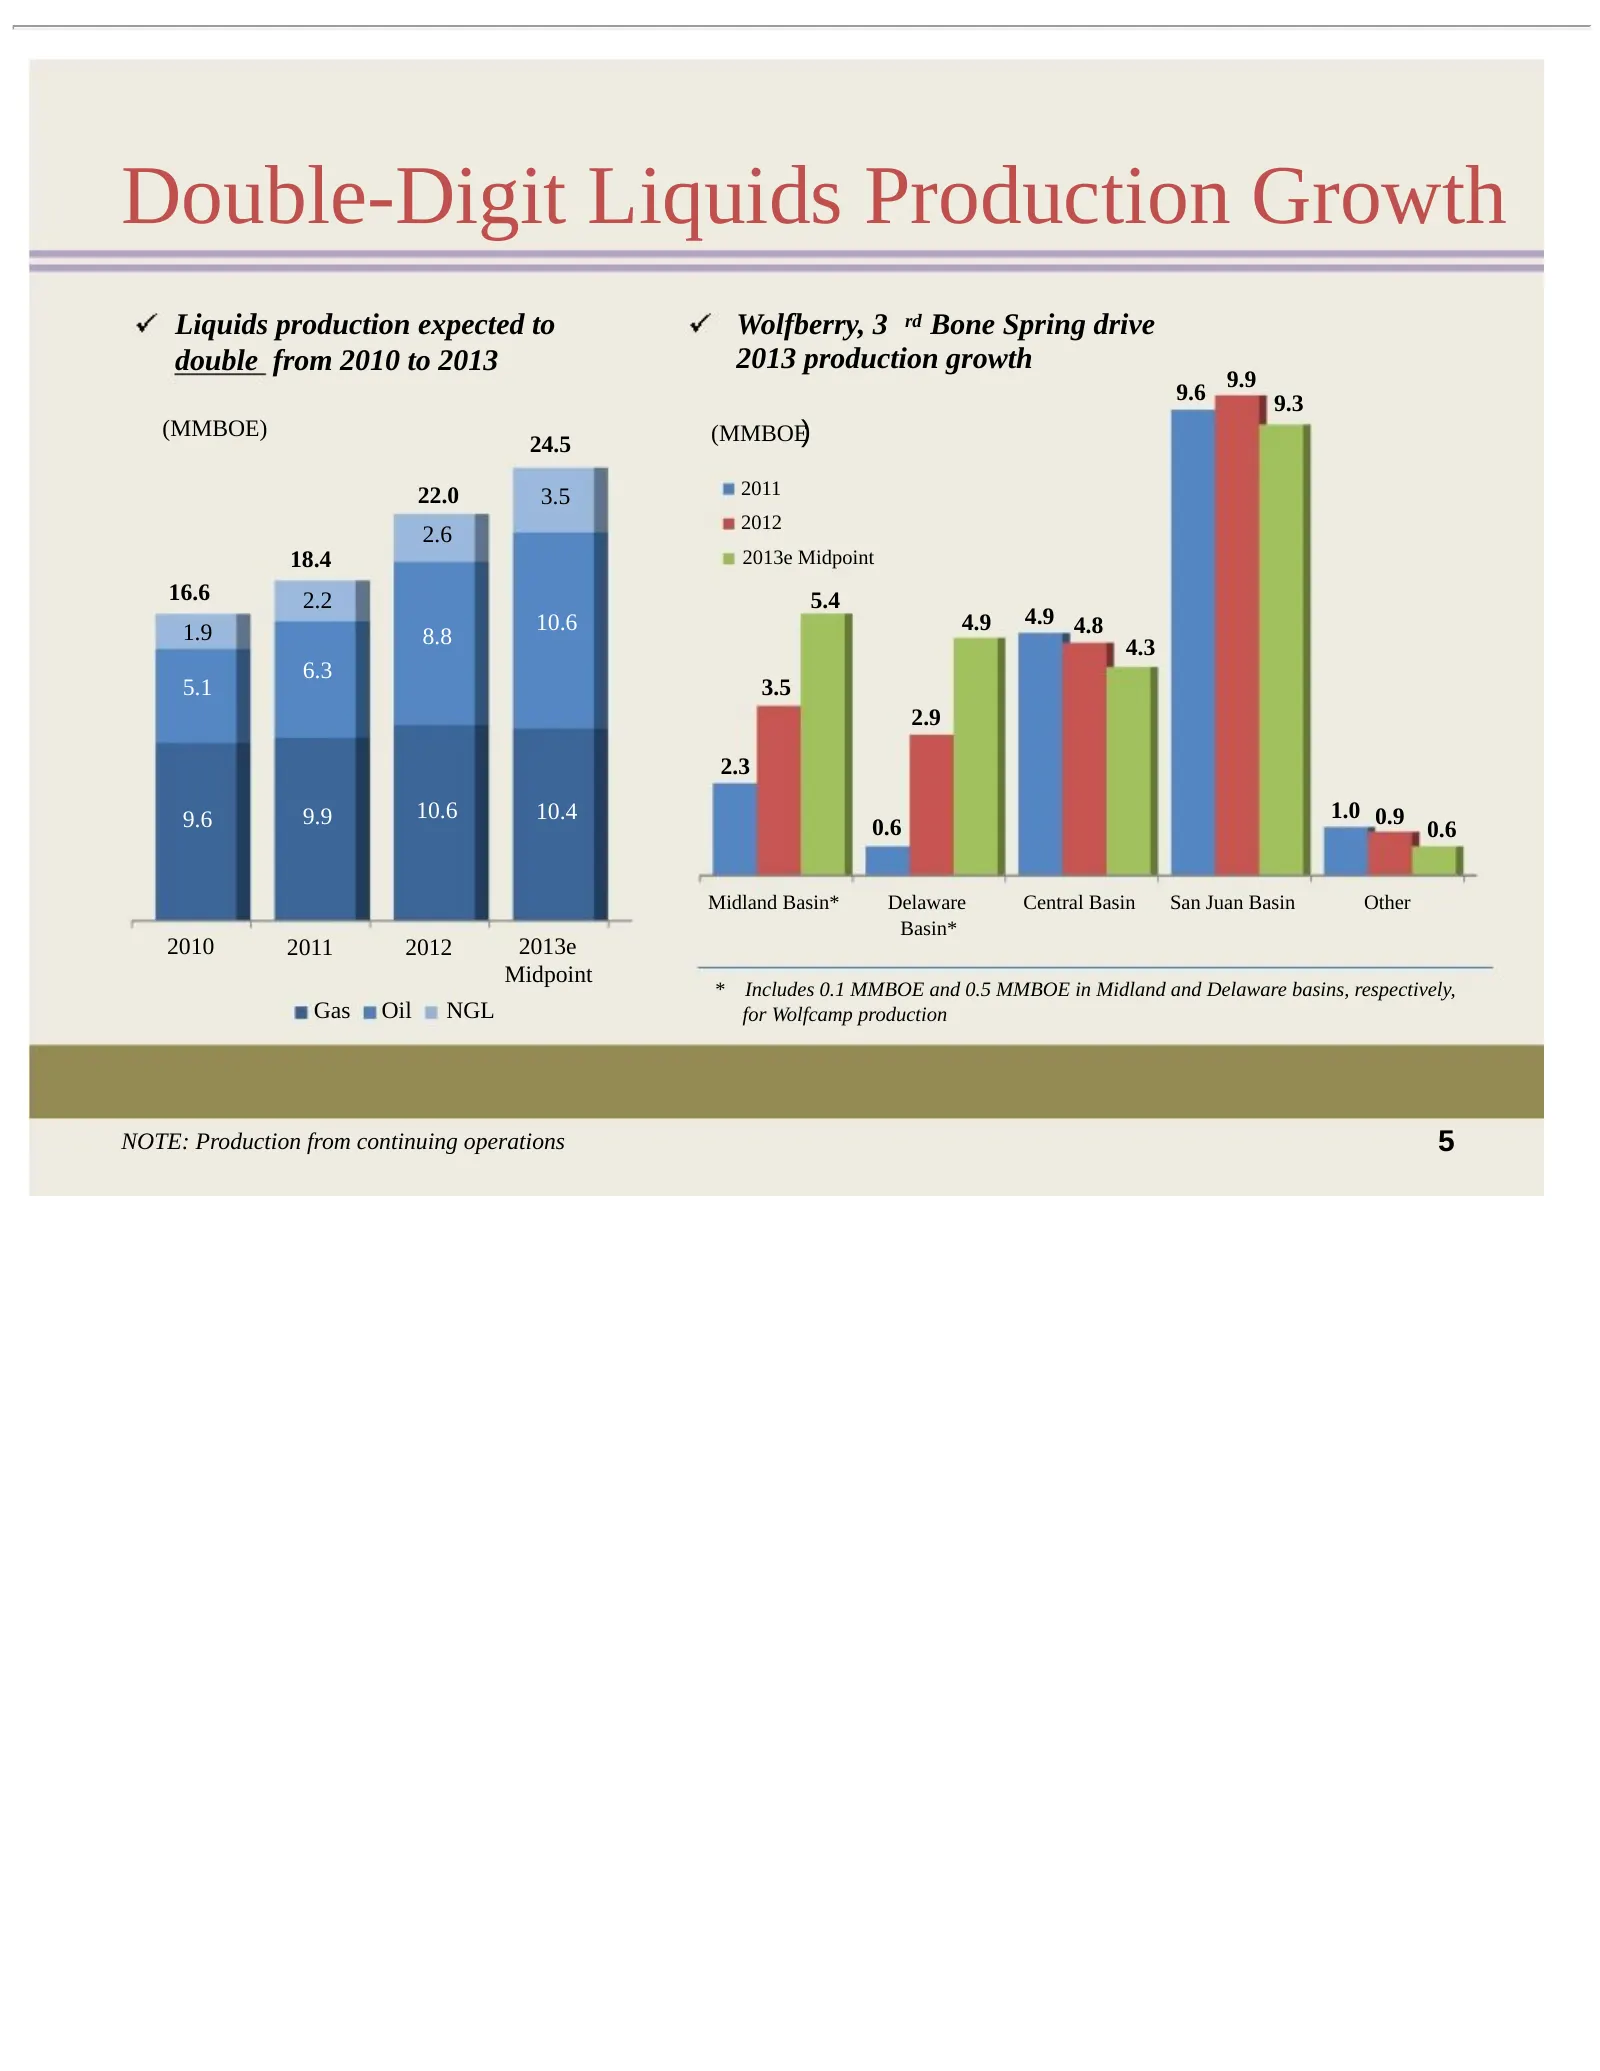
Double-Digit Liquids Production Growth Liquids production expected to Wolfberry, 3 rd Bone Spring drive double from 2010 to 2013 2013 production growth 9.9 9.6 9.3 (MMBOE) 24.5 (MMBOE) 22.0 3.5 2011 2012 2.6 18.4 2013e Midpoint 16.6 2.2 5.4 10.6 4.9 4.9 4.8 1.9 8.8 4.3 6.3 5.1 3.5 2.9 2.3 9.6 9.9 10
Slide 7: 2013e E&P Capital, Drilling Plans
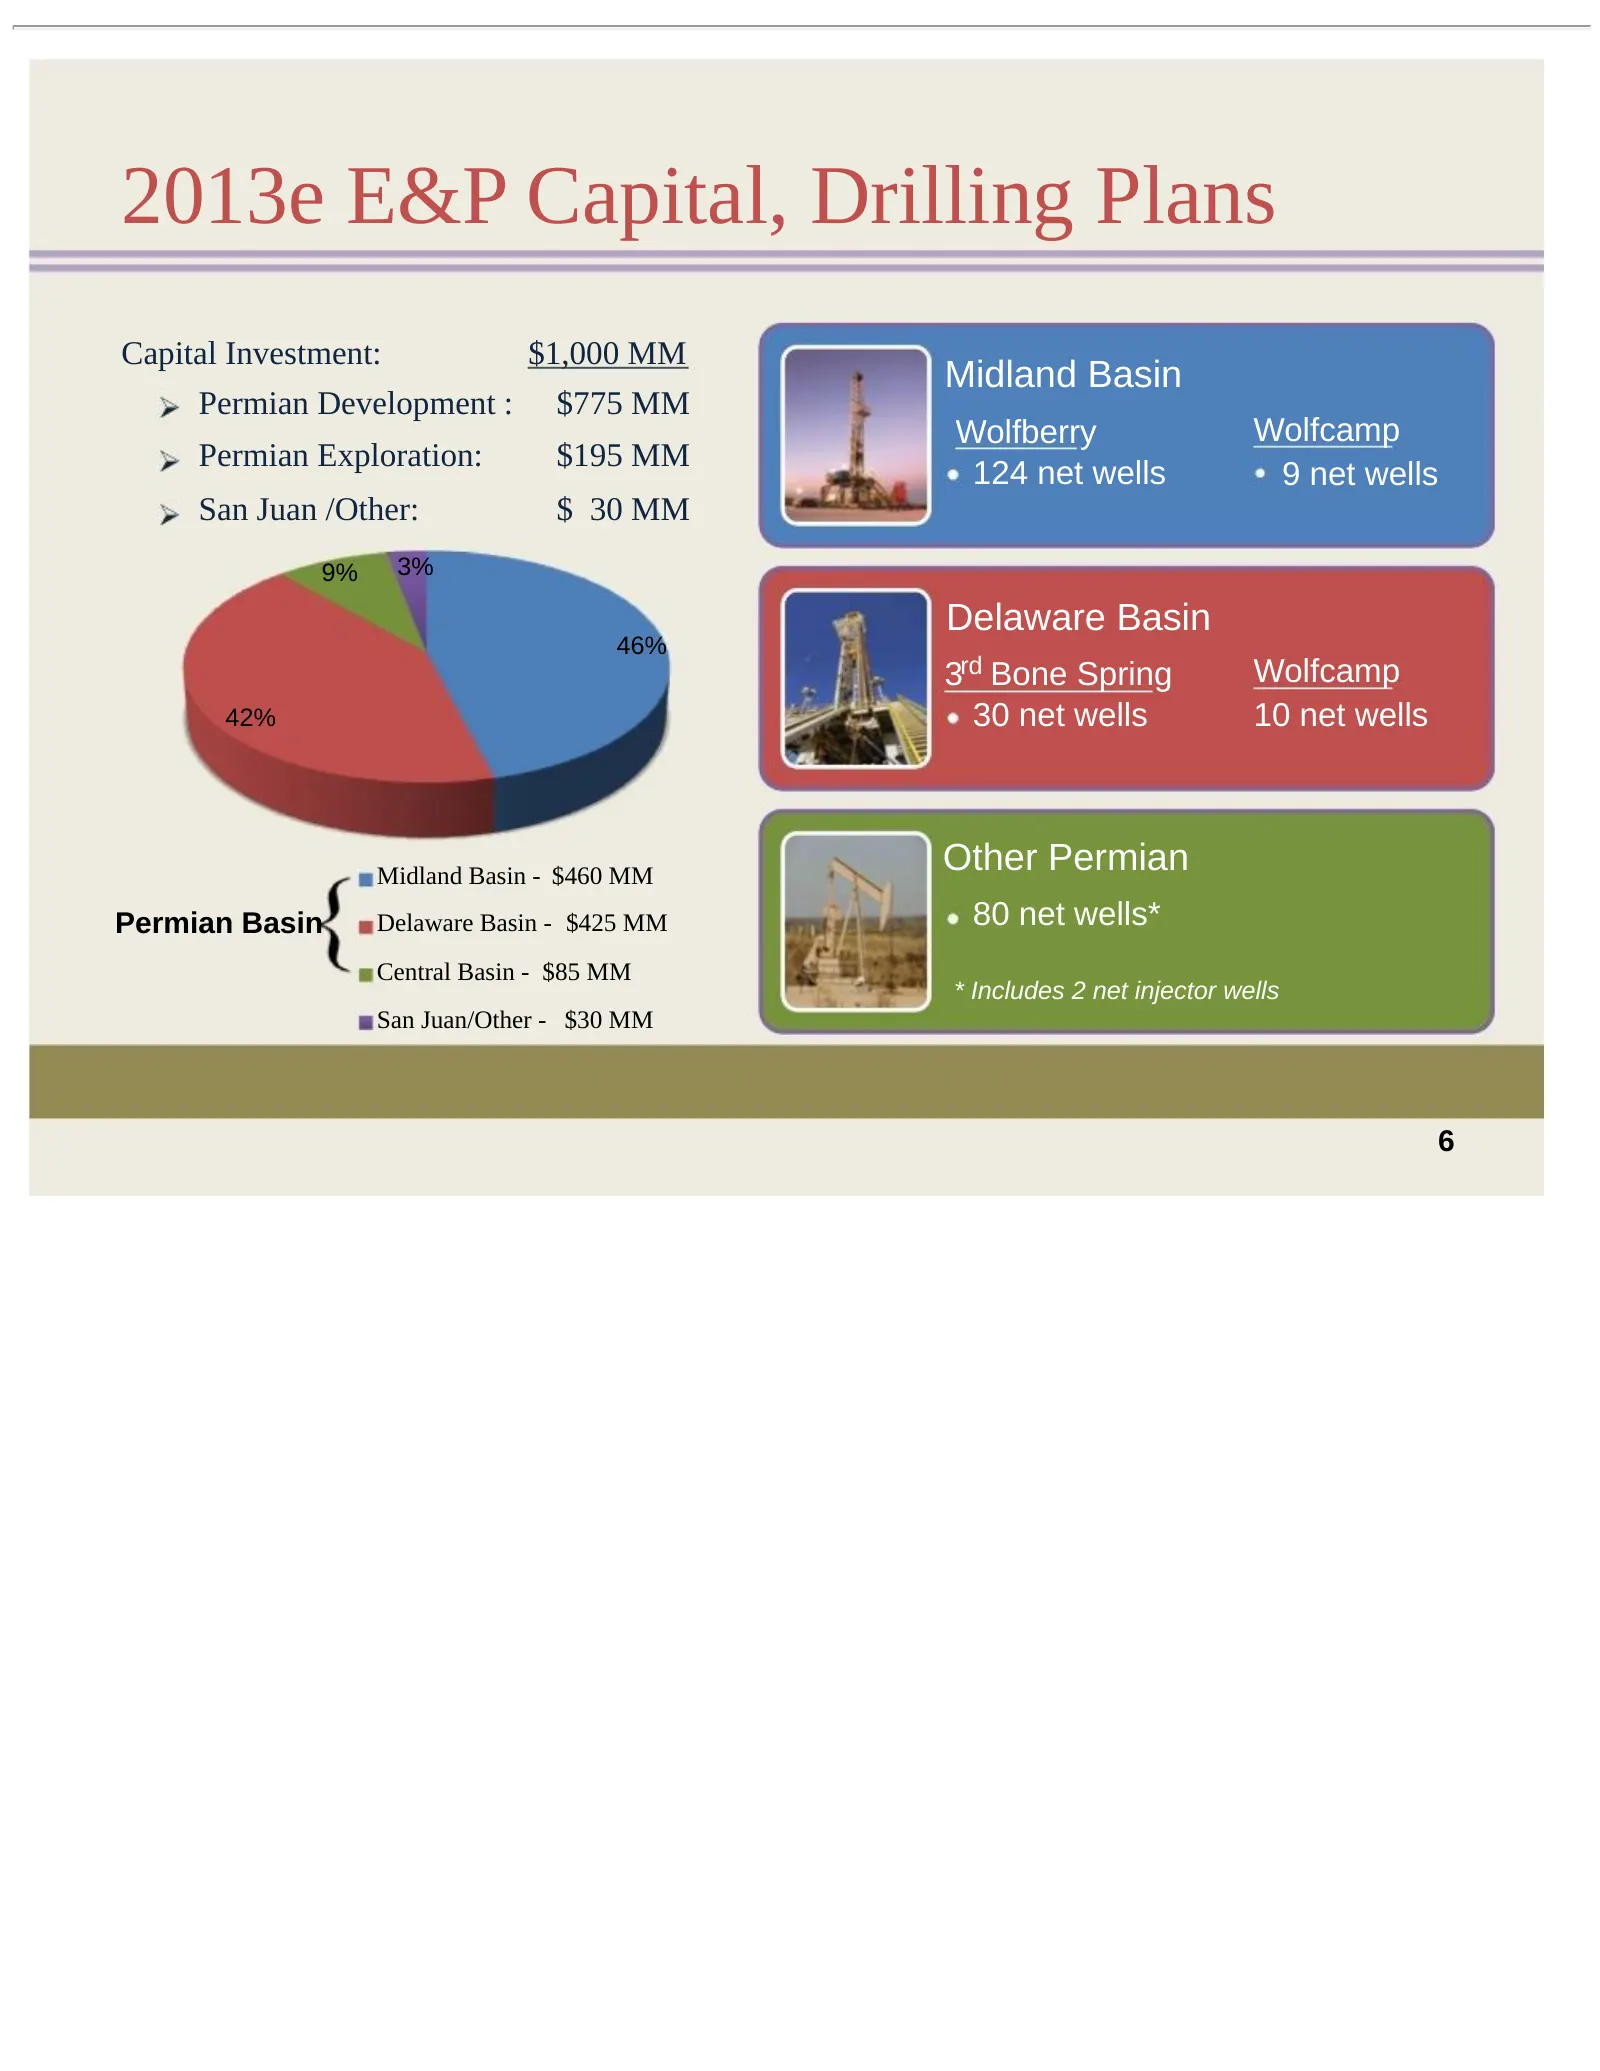
2013e E&P Capital, Drilling Plans Capital Investment: $1,000 MM Midland Basin Permian Development : $775 MM Wolfberry Wolfcamp Permian Exploration: $195 MM 124 net wells 9 net wells San Juan /Other: $ 30 MM 9% 3% Delaware Basin 46% 3rd Bone Spring Wolfcamp 42% 30 net wells 10 net wells Midland Basin
Slide 8: Energen After-Tax Cash Flows
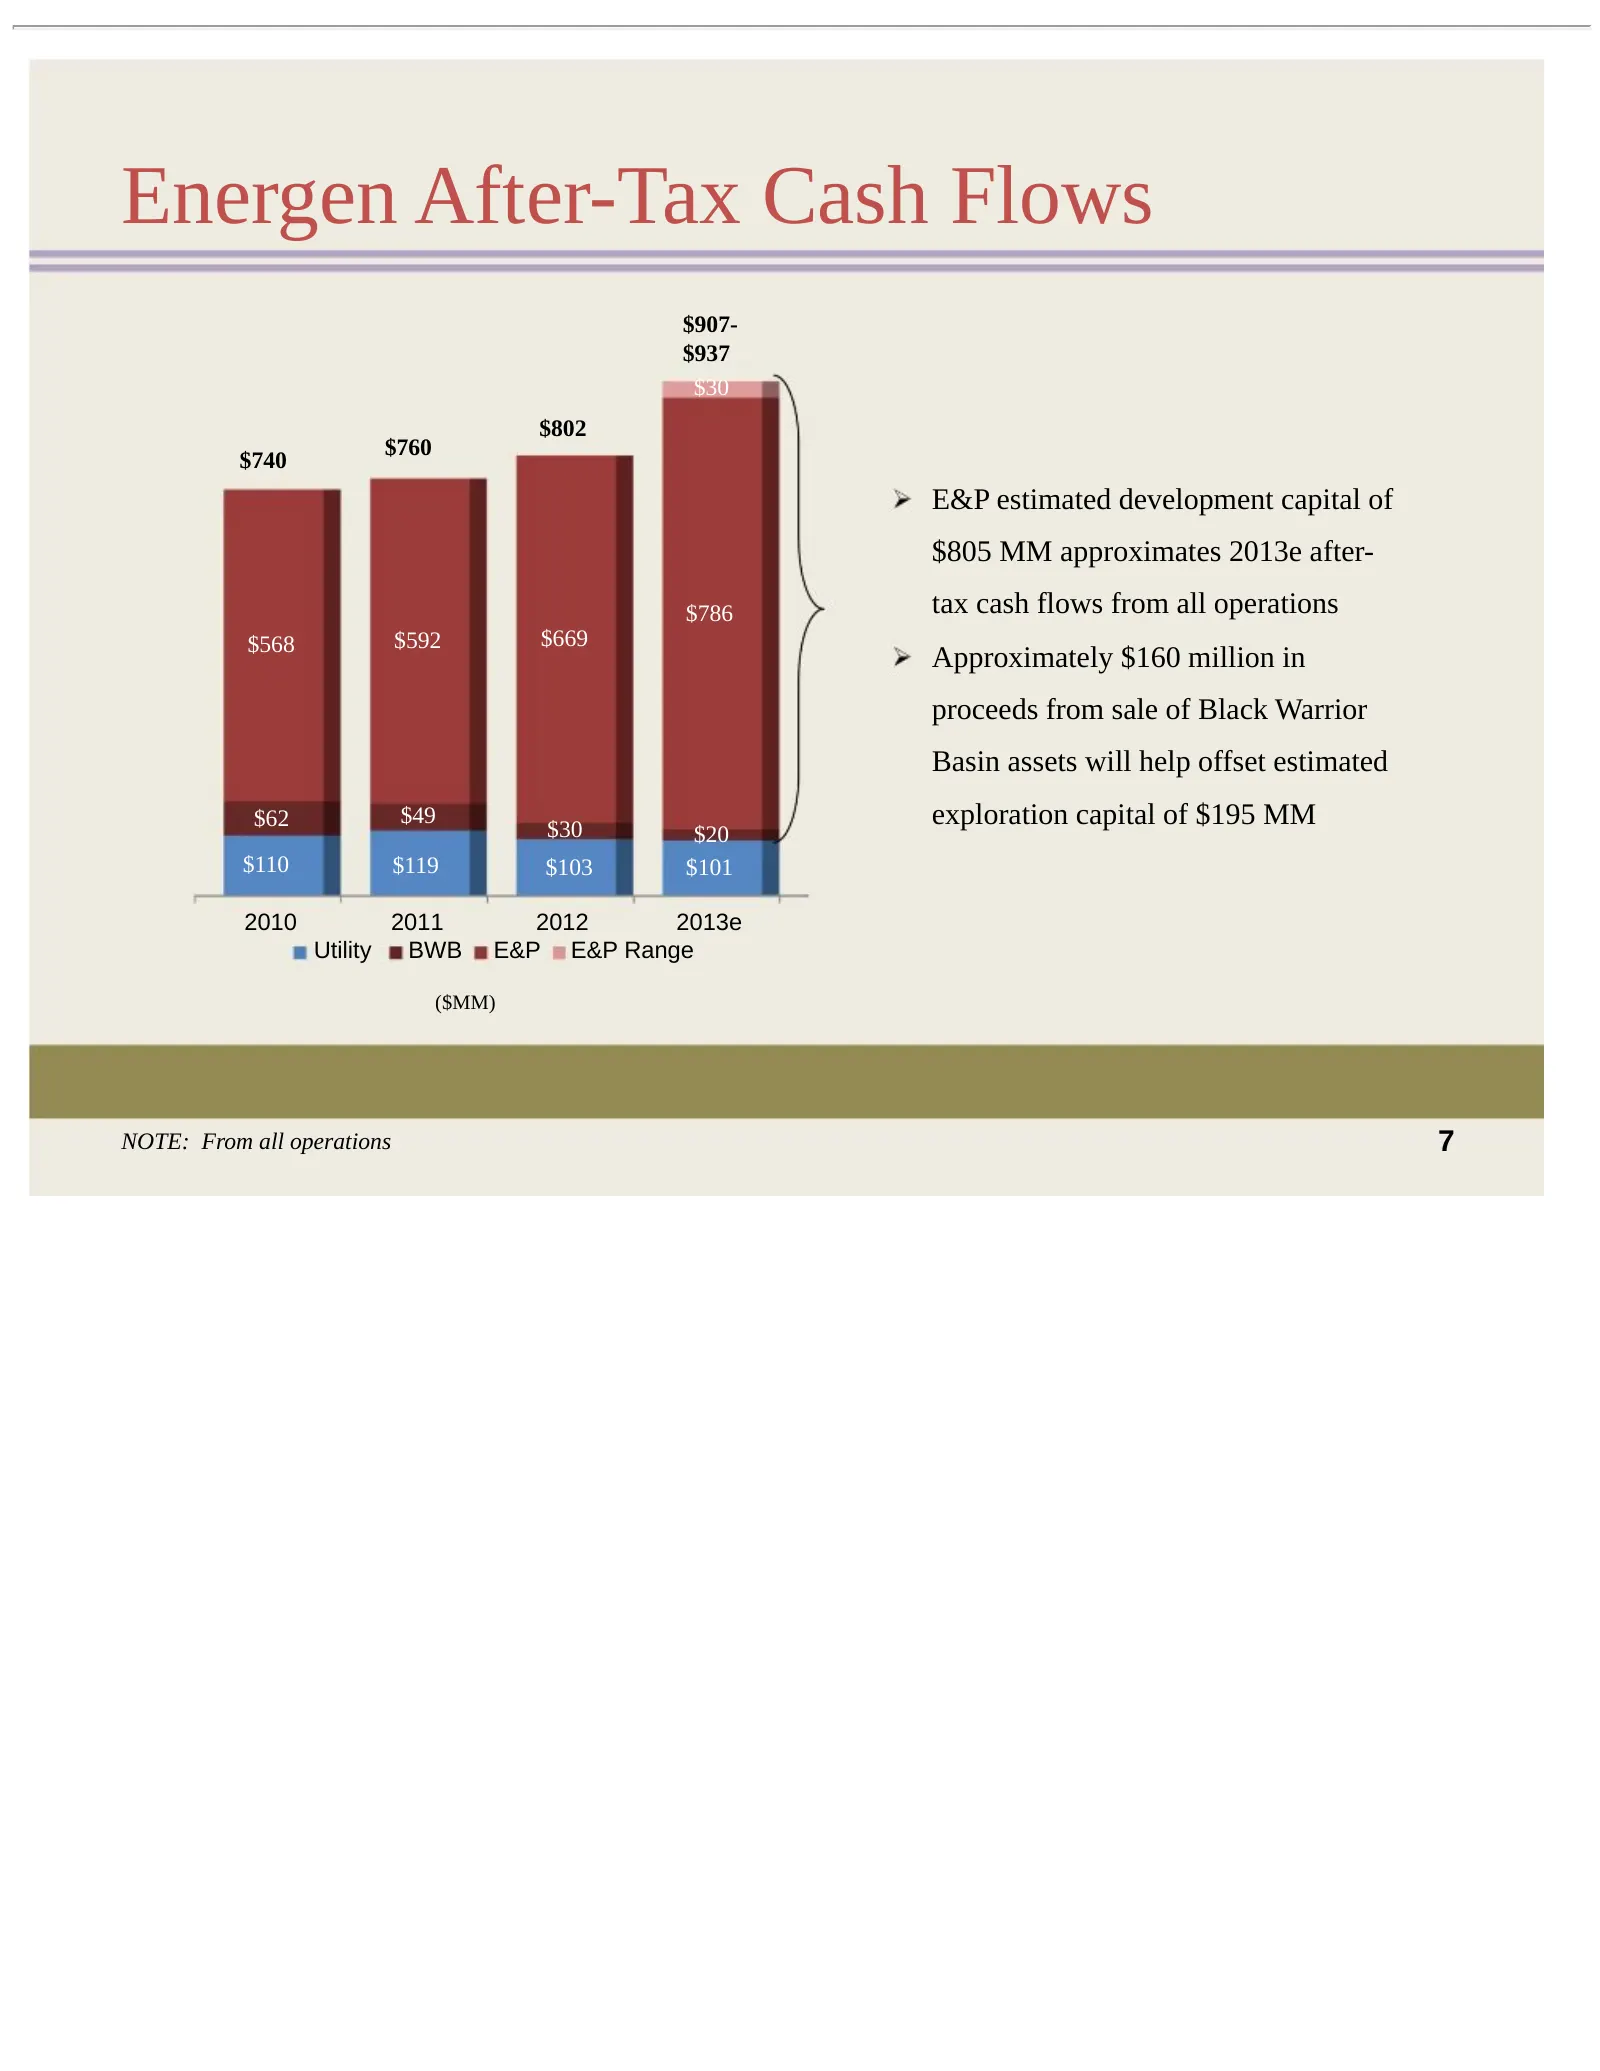
Energen After-Tax Cash Flows $907- $937 $30 $802 $760 $740 E&P estimated development capital of $805 MM approximates 2013e after- $786 tax cash flows from all operations $568 $592 $669 Approximately $160 million in proceeds from sale of Black Warrior Basin assets will help offset estimated $62 $49 $
Slide 9: 2013 Guidance
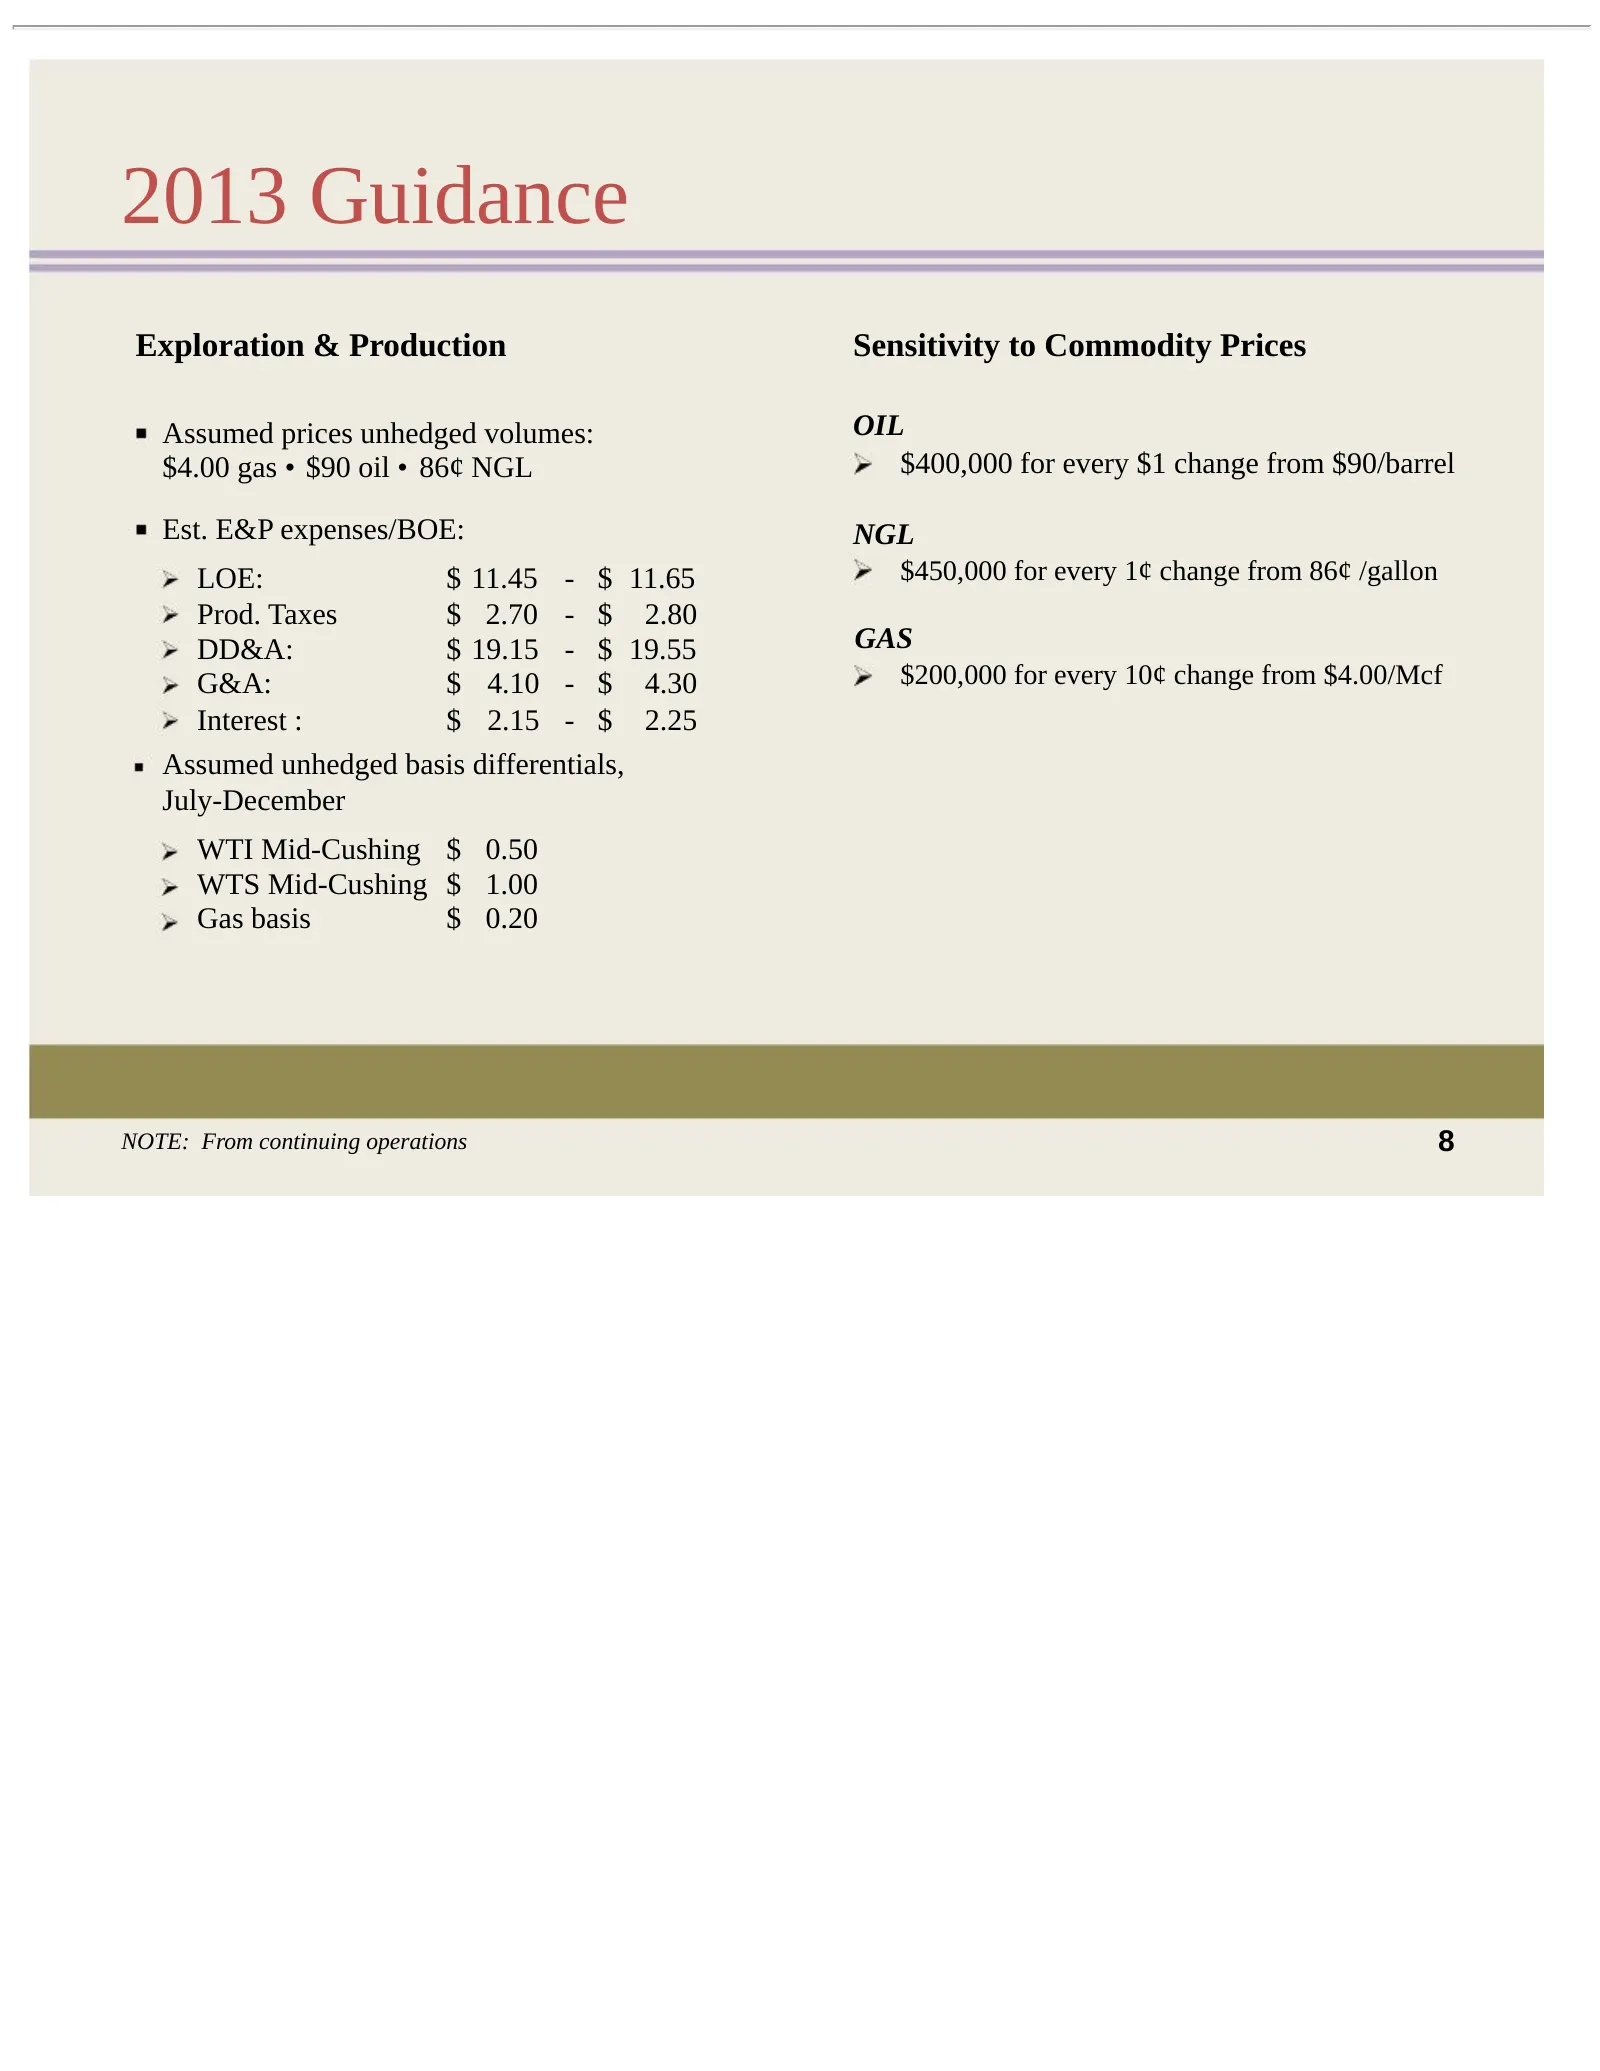
2013 Guidance Exploration & Production Sensitivity to Commodity Prices Assumed prices unhedged volumes: OIL $4.00 gas • $90 oil • 86¢ NGL $400,000 for every $1 change from $90/barrel Est. E&P expenses/BOE: NGL LOE: $ 11.45 - $ 11.65 $450,000 for every 1¢ change from 86¢ /gallon Prod. Taxes $ 2.70 -
Slide 10: Hedges Minimize Price Risk
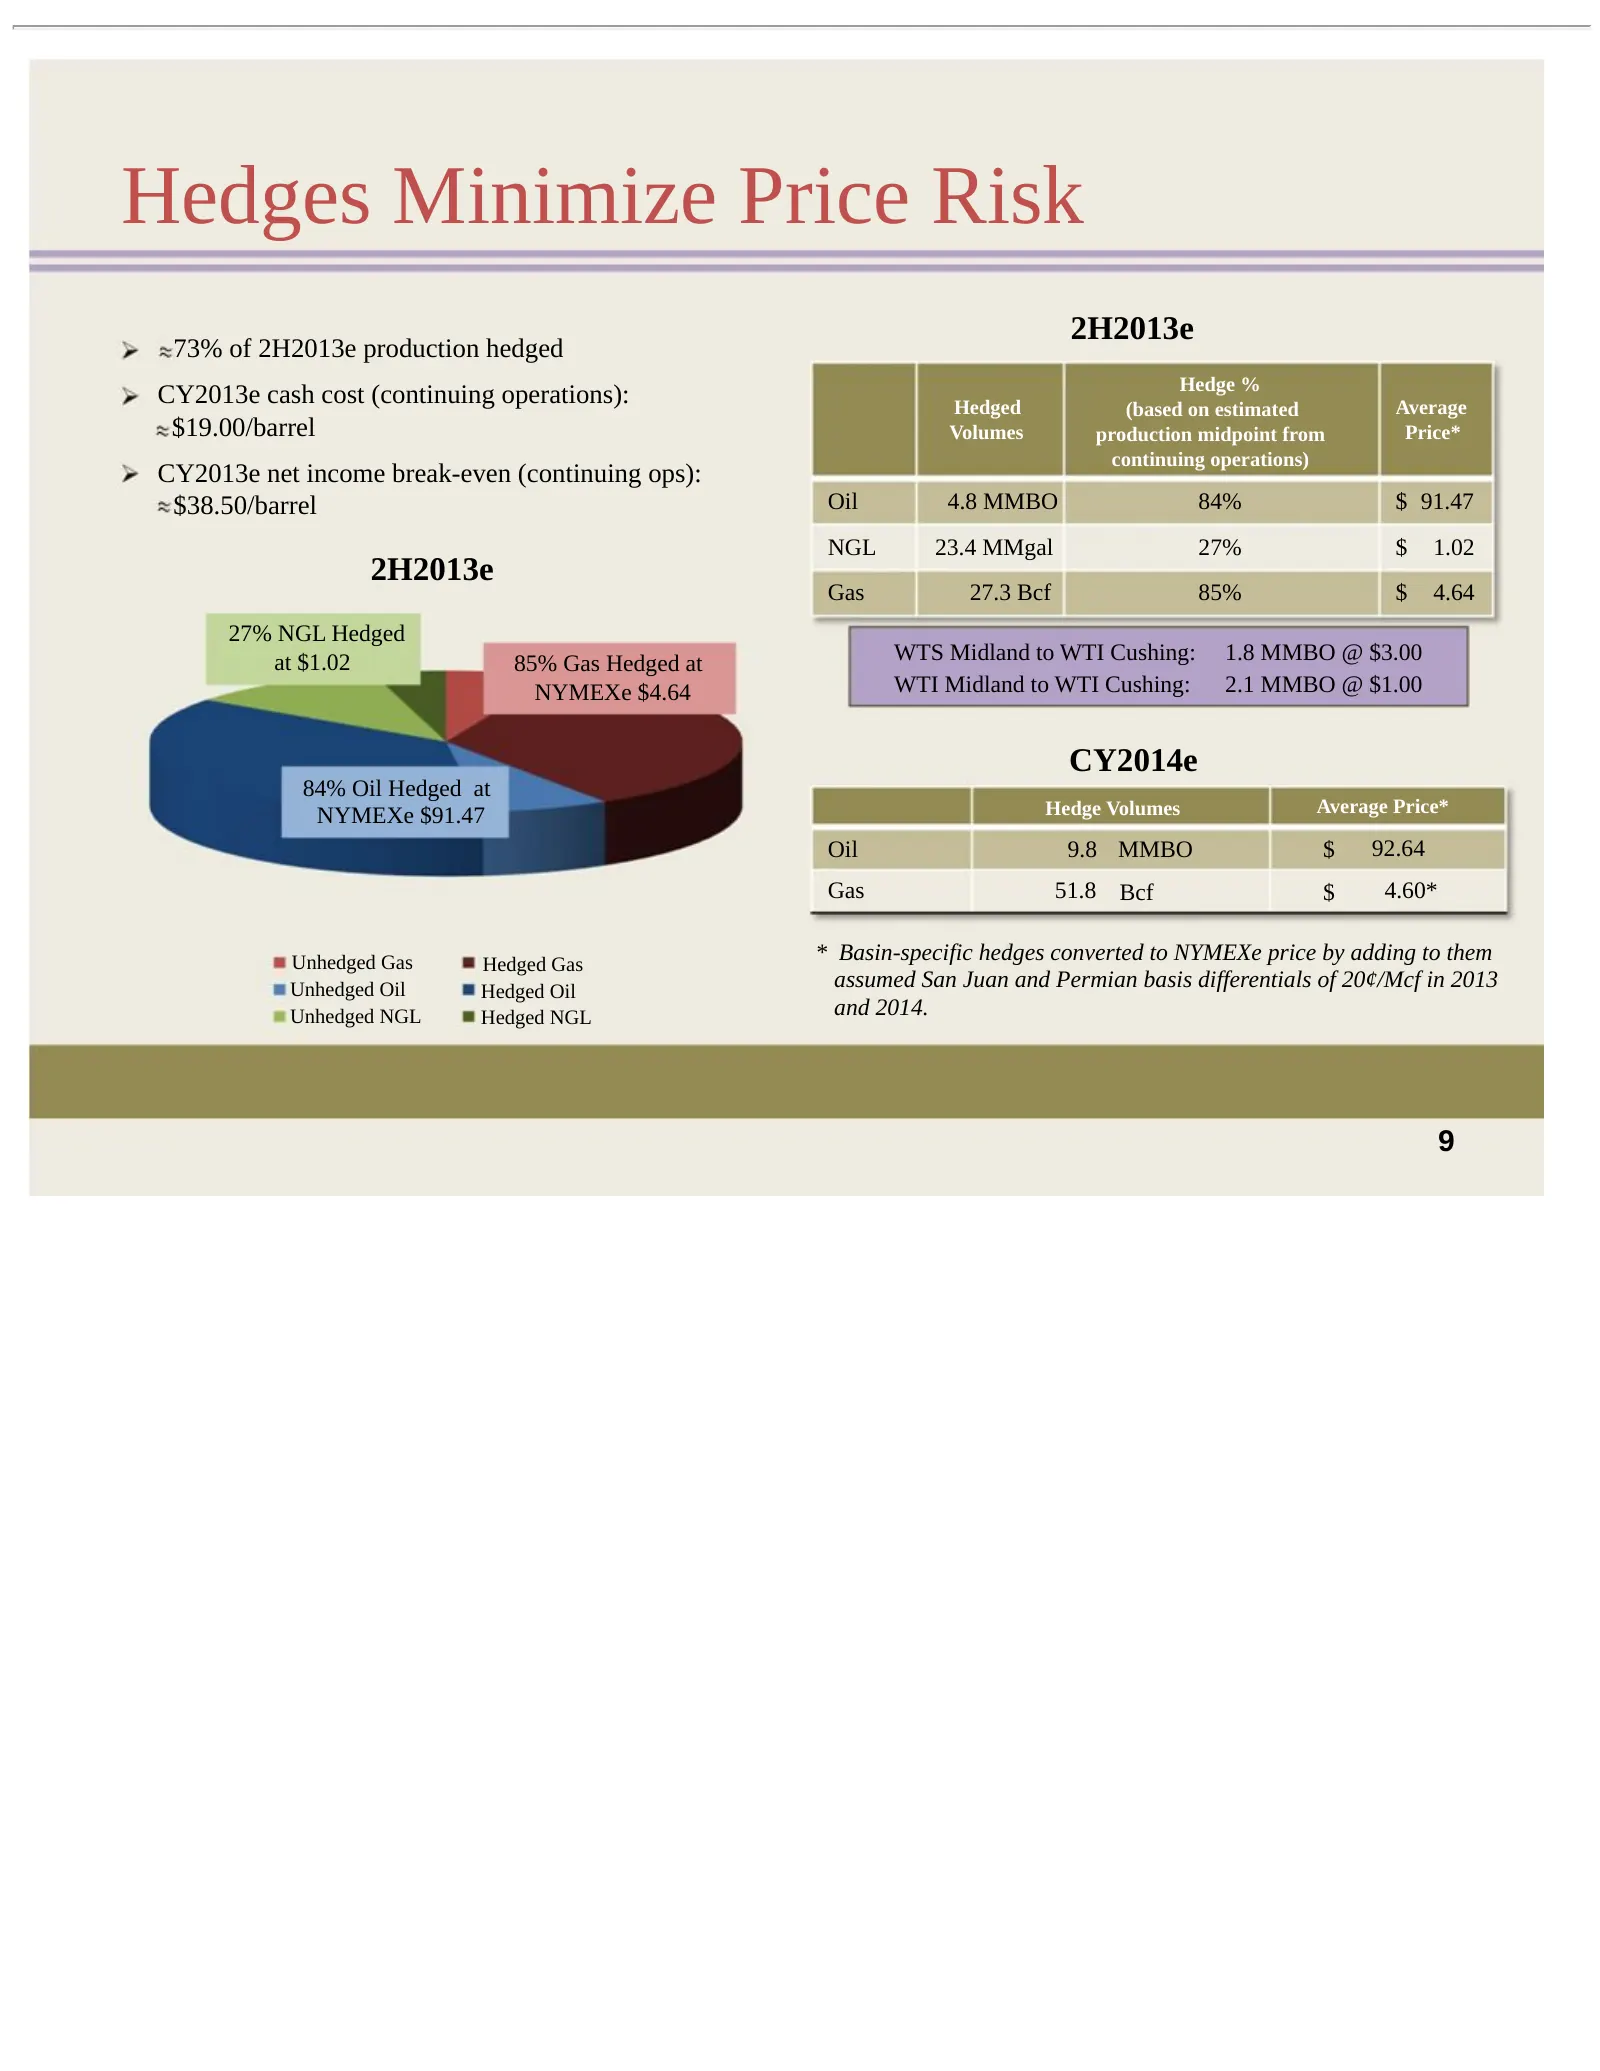
Hedges Minimize Price Risk 2H2013e 73% of 2H2013e production hedged Hedge % CY2013e cash cost (continuing operations): Hedged (based on estimated Average $19.00/barrel Volumes production midpoint from Price* continuing operations) CY2013e net income break-even (continuing ops): $38.50/barrel Oil 4.8
Slide 11: 3P Reserves Total 735 MMBOE (Adjusted)
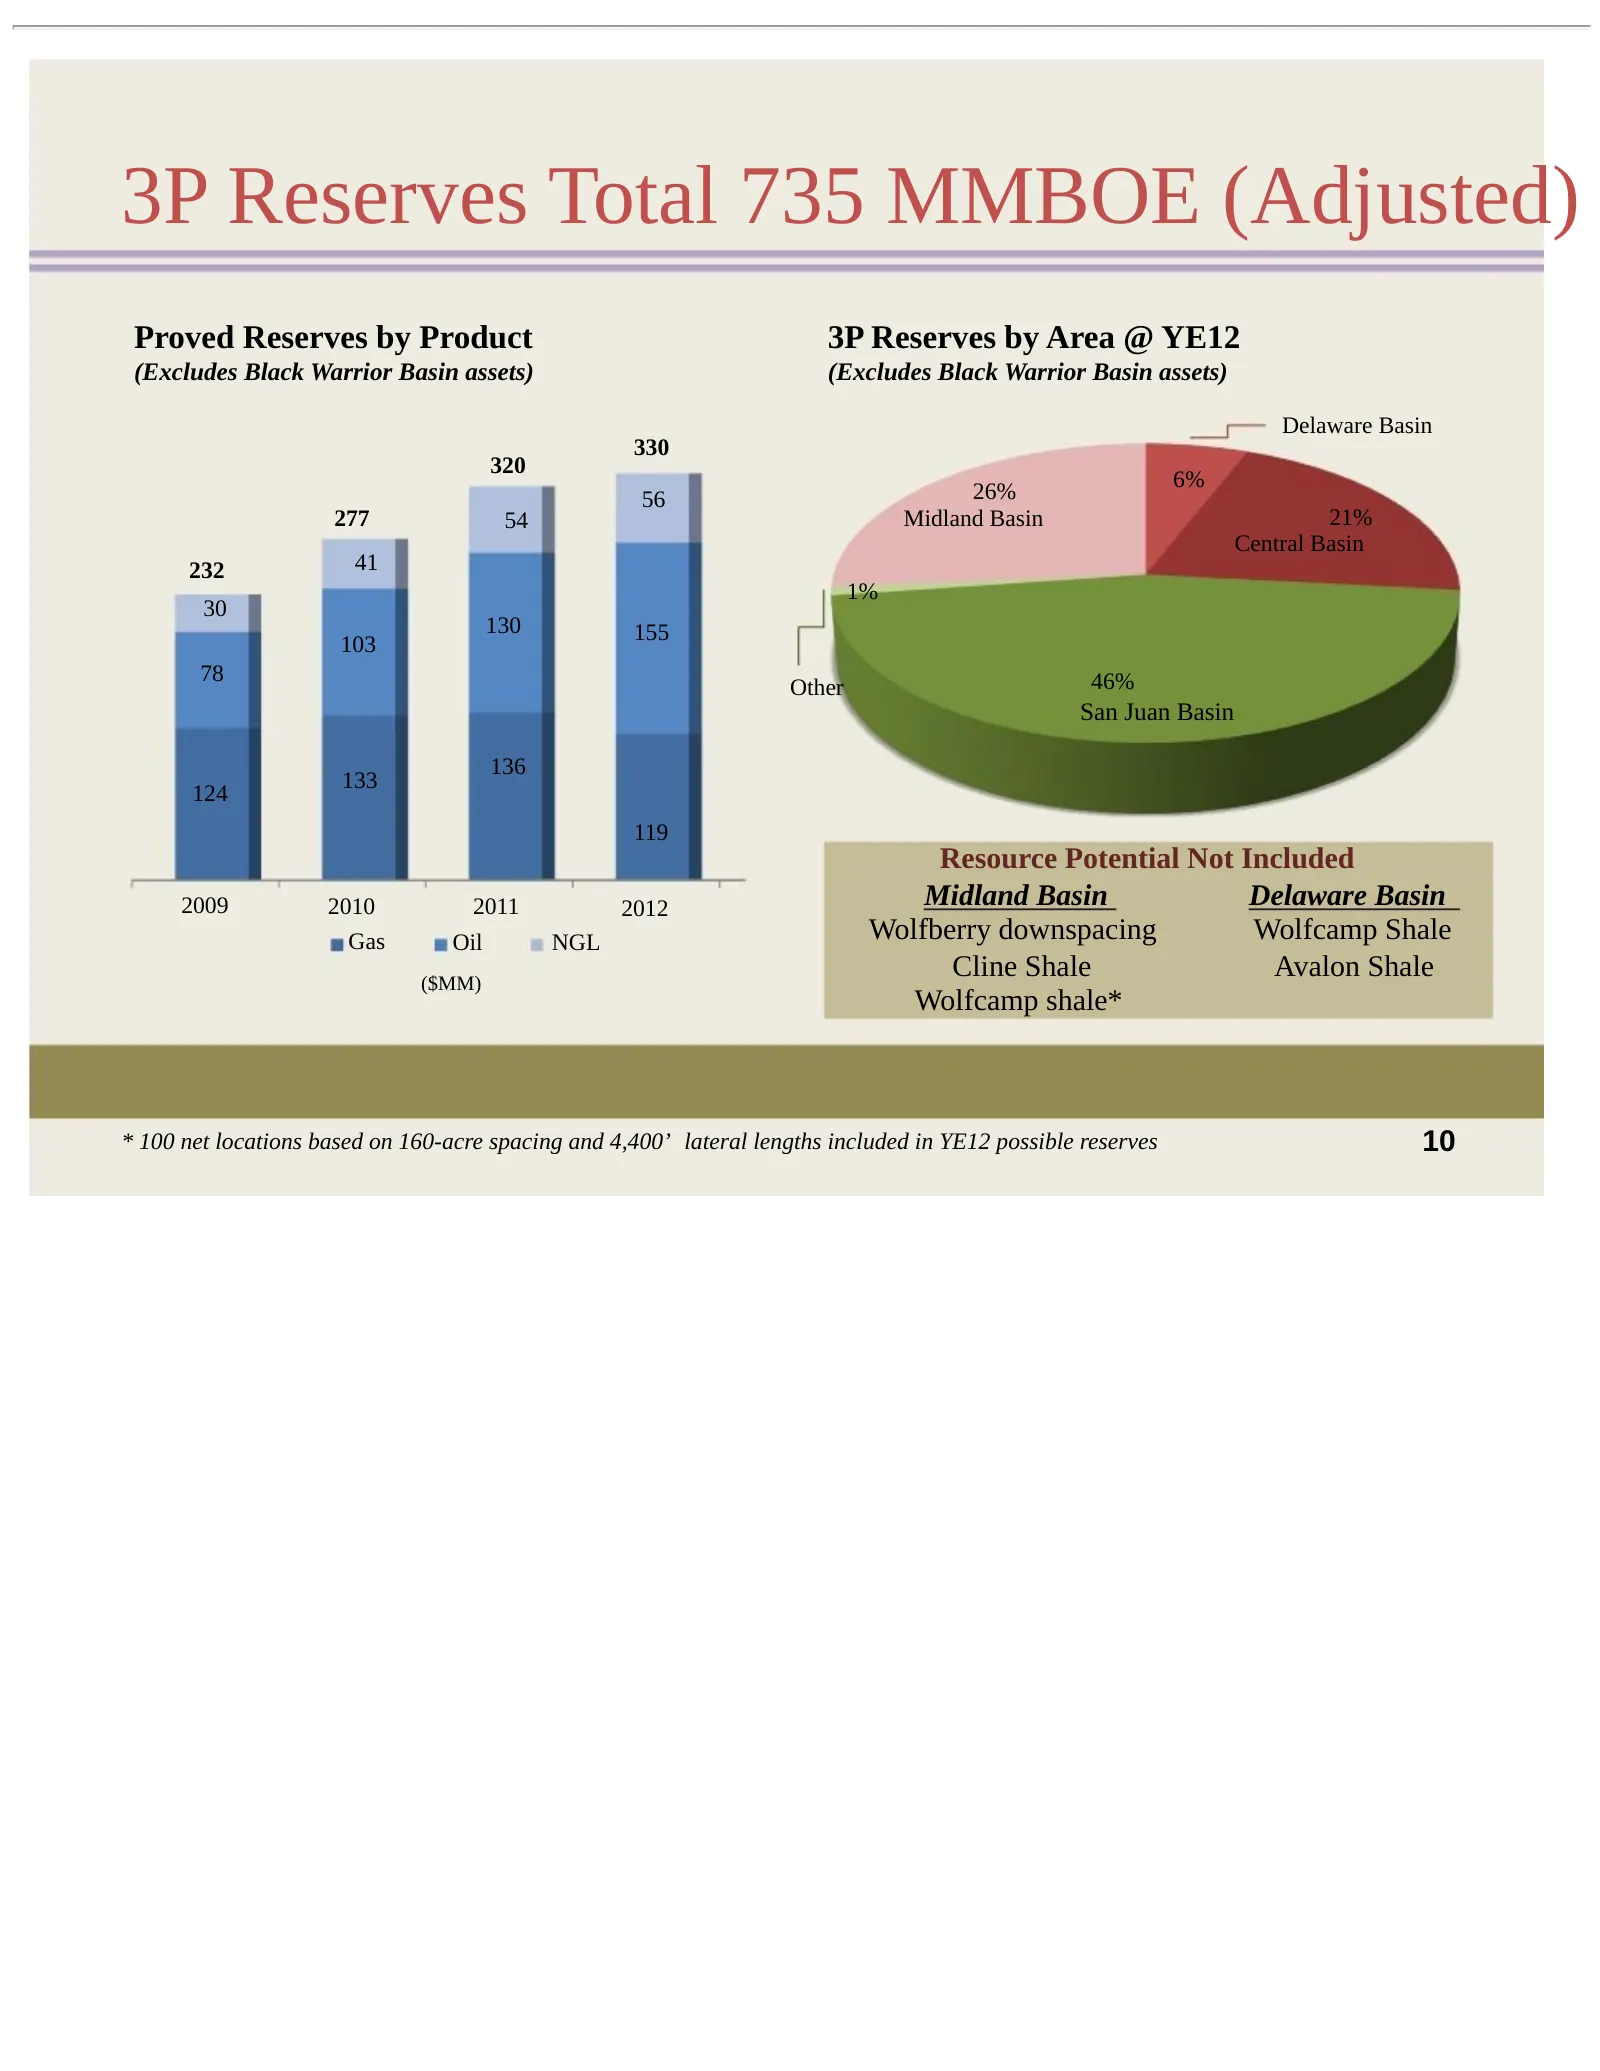
3P Reserves Total 735 MMBOE (Adjusted) Proved Reserves by Product 3P Reserves by Area @ YE12 (Excludes Black Warrior Basin assets) (Excludes Black Warrior Basin assets) Delaware Basin 330 320 6% 56 26% 277 54 Midland Basin 21% Central Basin 232 41 1% 30 130 155 103 78 46% Other San Juan Basin 136 13
Slide 12: Permian Overview
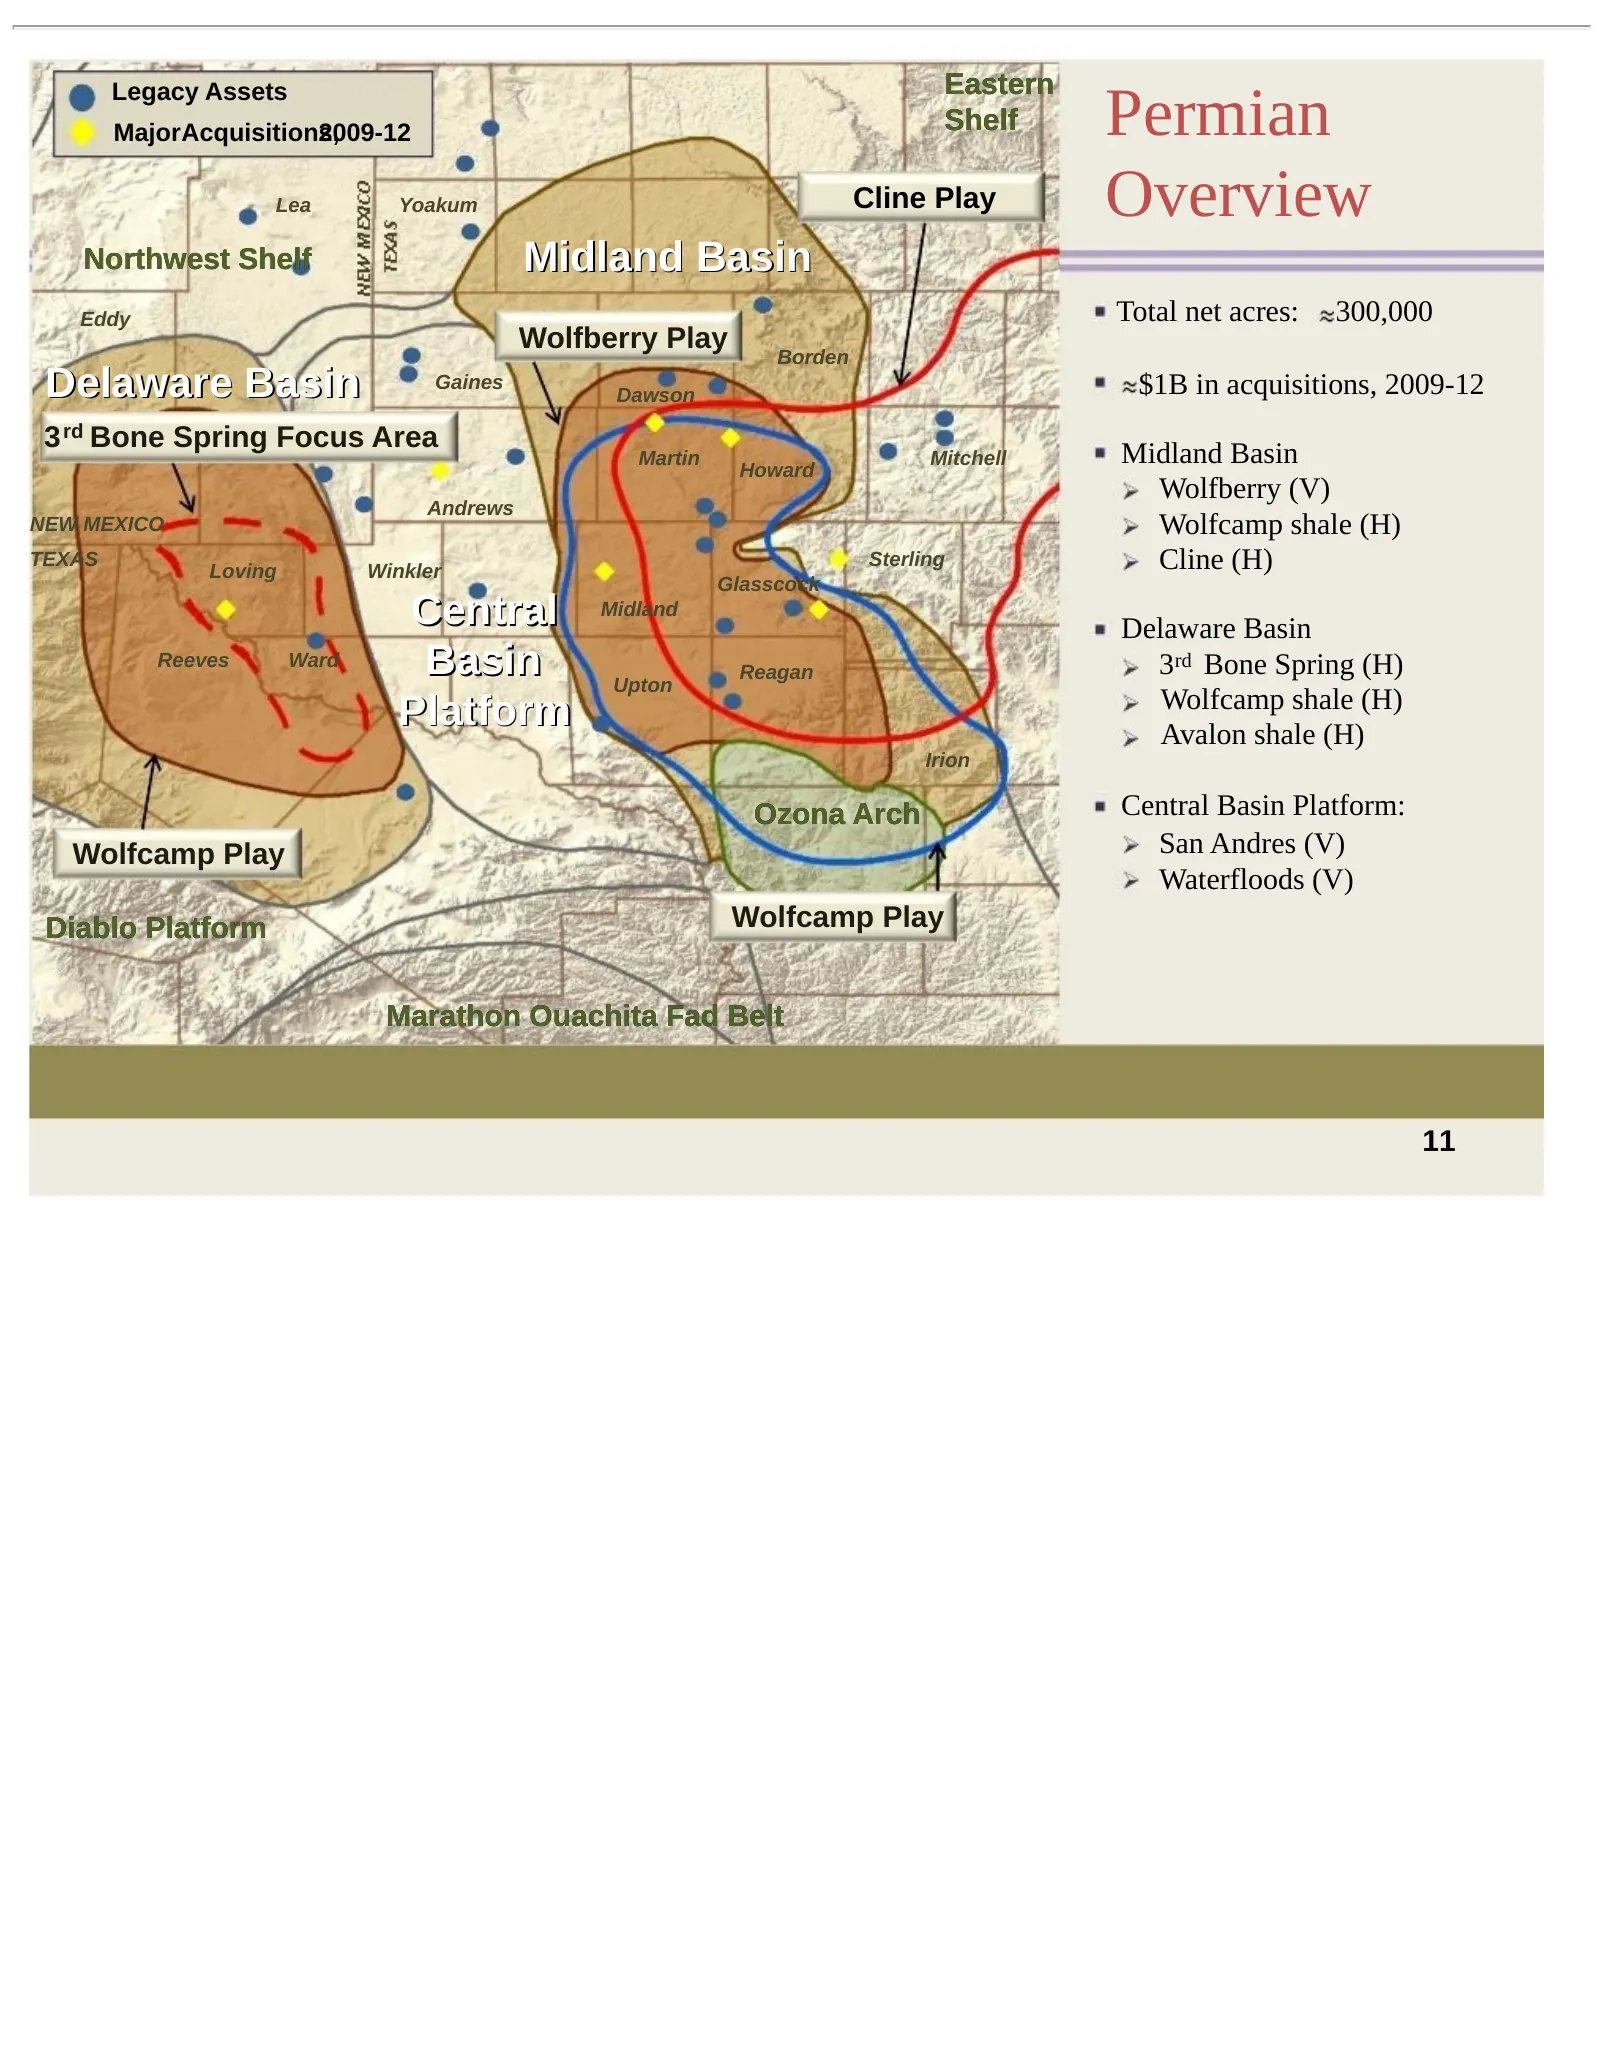
Eastern Permian Legacy Assets MajorAcquisitions, 2009-12 Shelf Lea Yoakum Cline Play Overview Northwest Shelf Midland Basin Eddy Total net acres: 300,000 Wolfberry Play Borden Delaware Basin Gaines Dawson $1B in acquisitions, 2009-12 3 rd Bone Spring Focus Area Martin Howard Mitchell Midland Basin W
Slide 13: Midland Basin
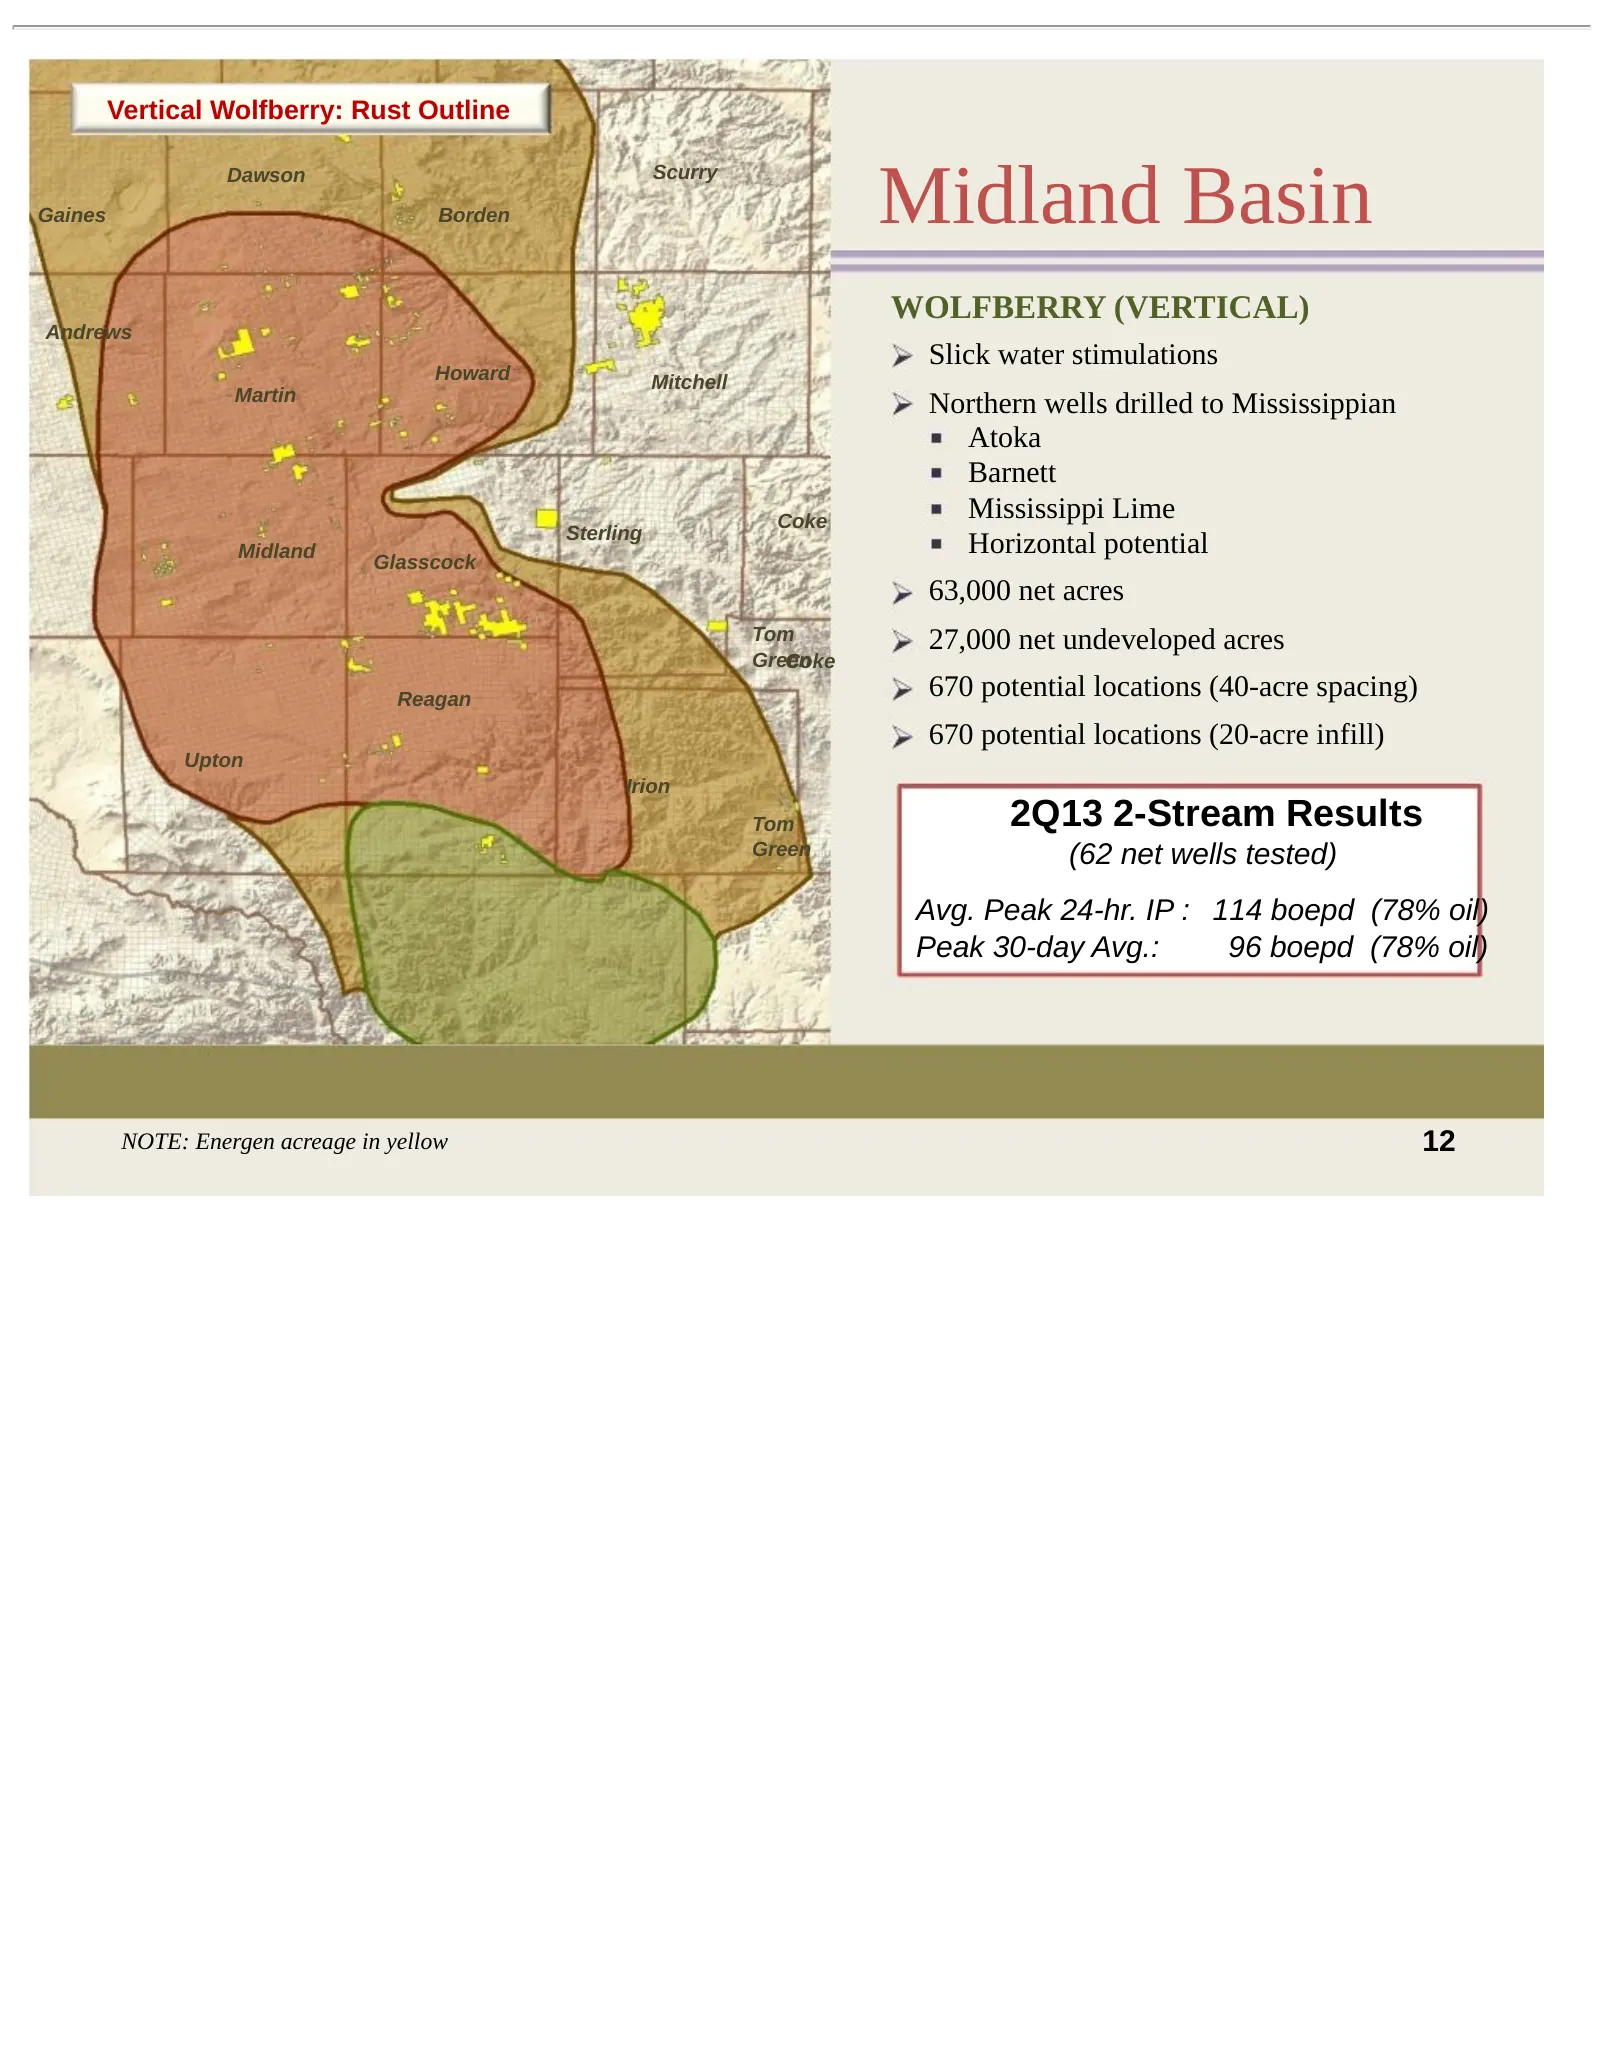
Vertical Wolfberry: Rust Outline Midland Basin Dawson Scurry Gaines Borden WOLFBERRY (VERTICAL) Andrews Slick water stimulations Howard Mitchell Martin Northern wells drilled to Mississippian Atoka Barnett Coke Mississippi Lime Sterling Midland Horizontal potential Glasscock 63,000 net acres Tom 27,
Slide 14: Average Wolfberry Type Curve
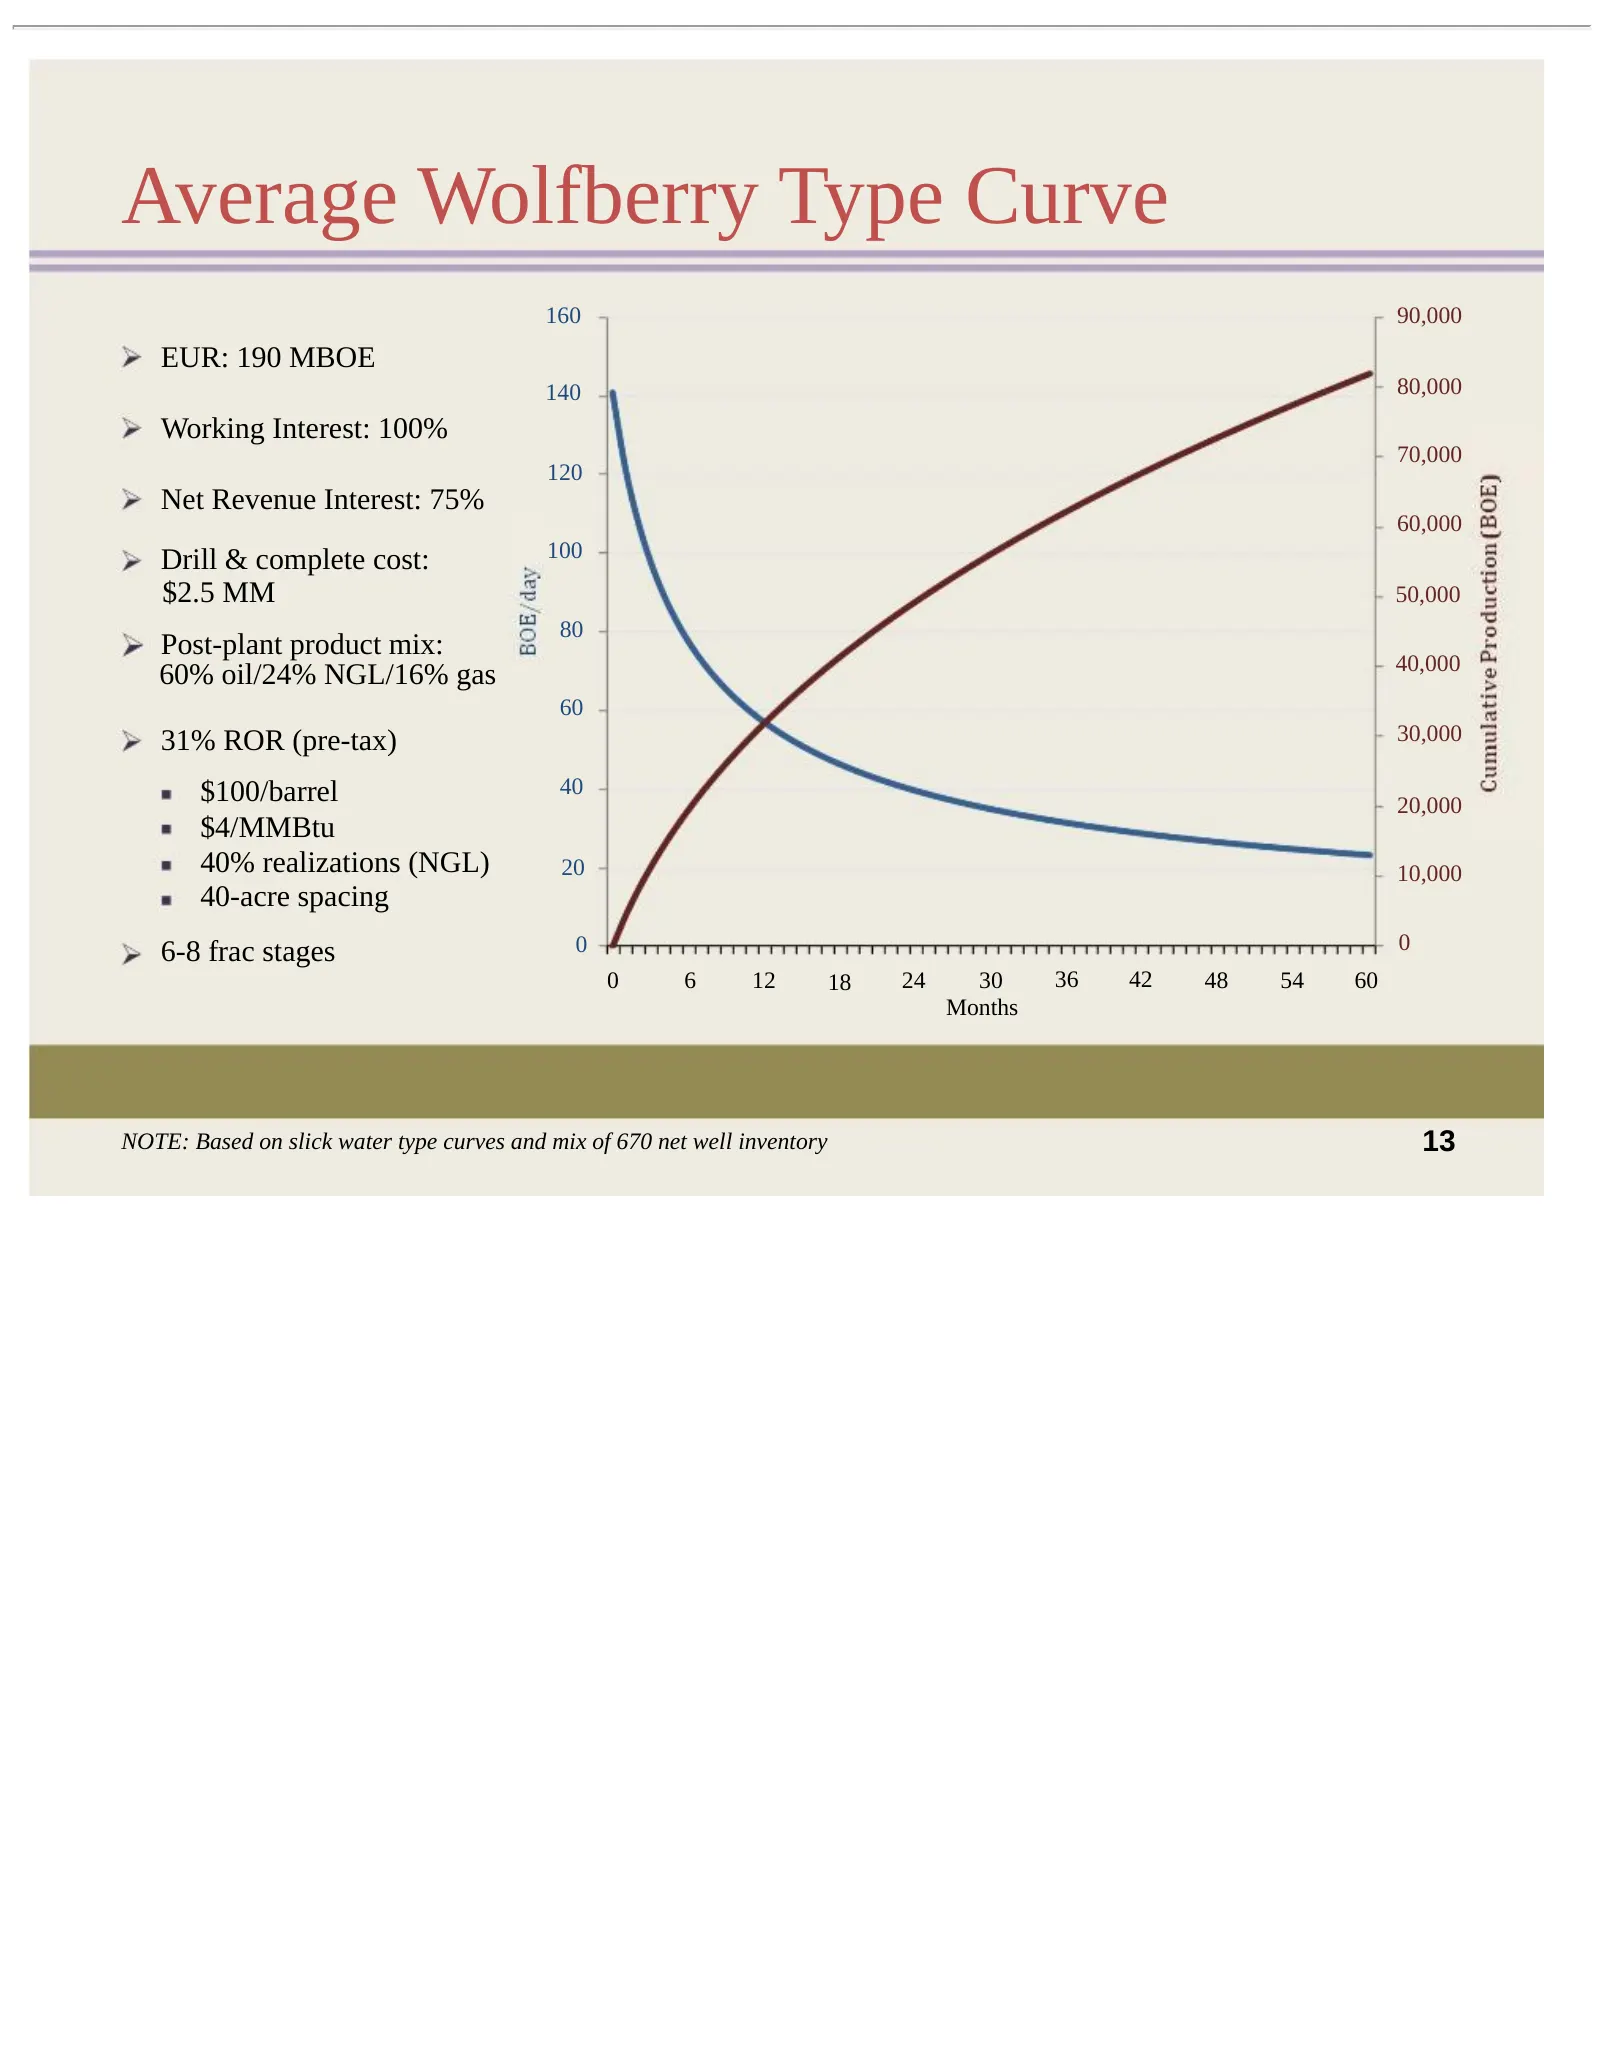
Average Wolfberry Type Curve 160 90,000 EUR: 190 MBOE 140 80,000 Working Interest: 100% 70,000 120 Net Revenue Interest: 75% 60,000 Drill & complete cost: 100 $2.5 MM 50,000 80 Post-plant product mix: 40,000 60% oil/24% NGL/16% gas 60 31% ROR (pre-tax) 30,000 $100/barrel 40 20,000 $4/MMBtu 40% reali
Slide 15: Midland Basin
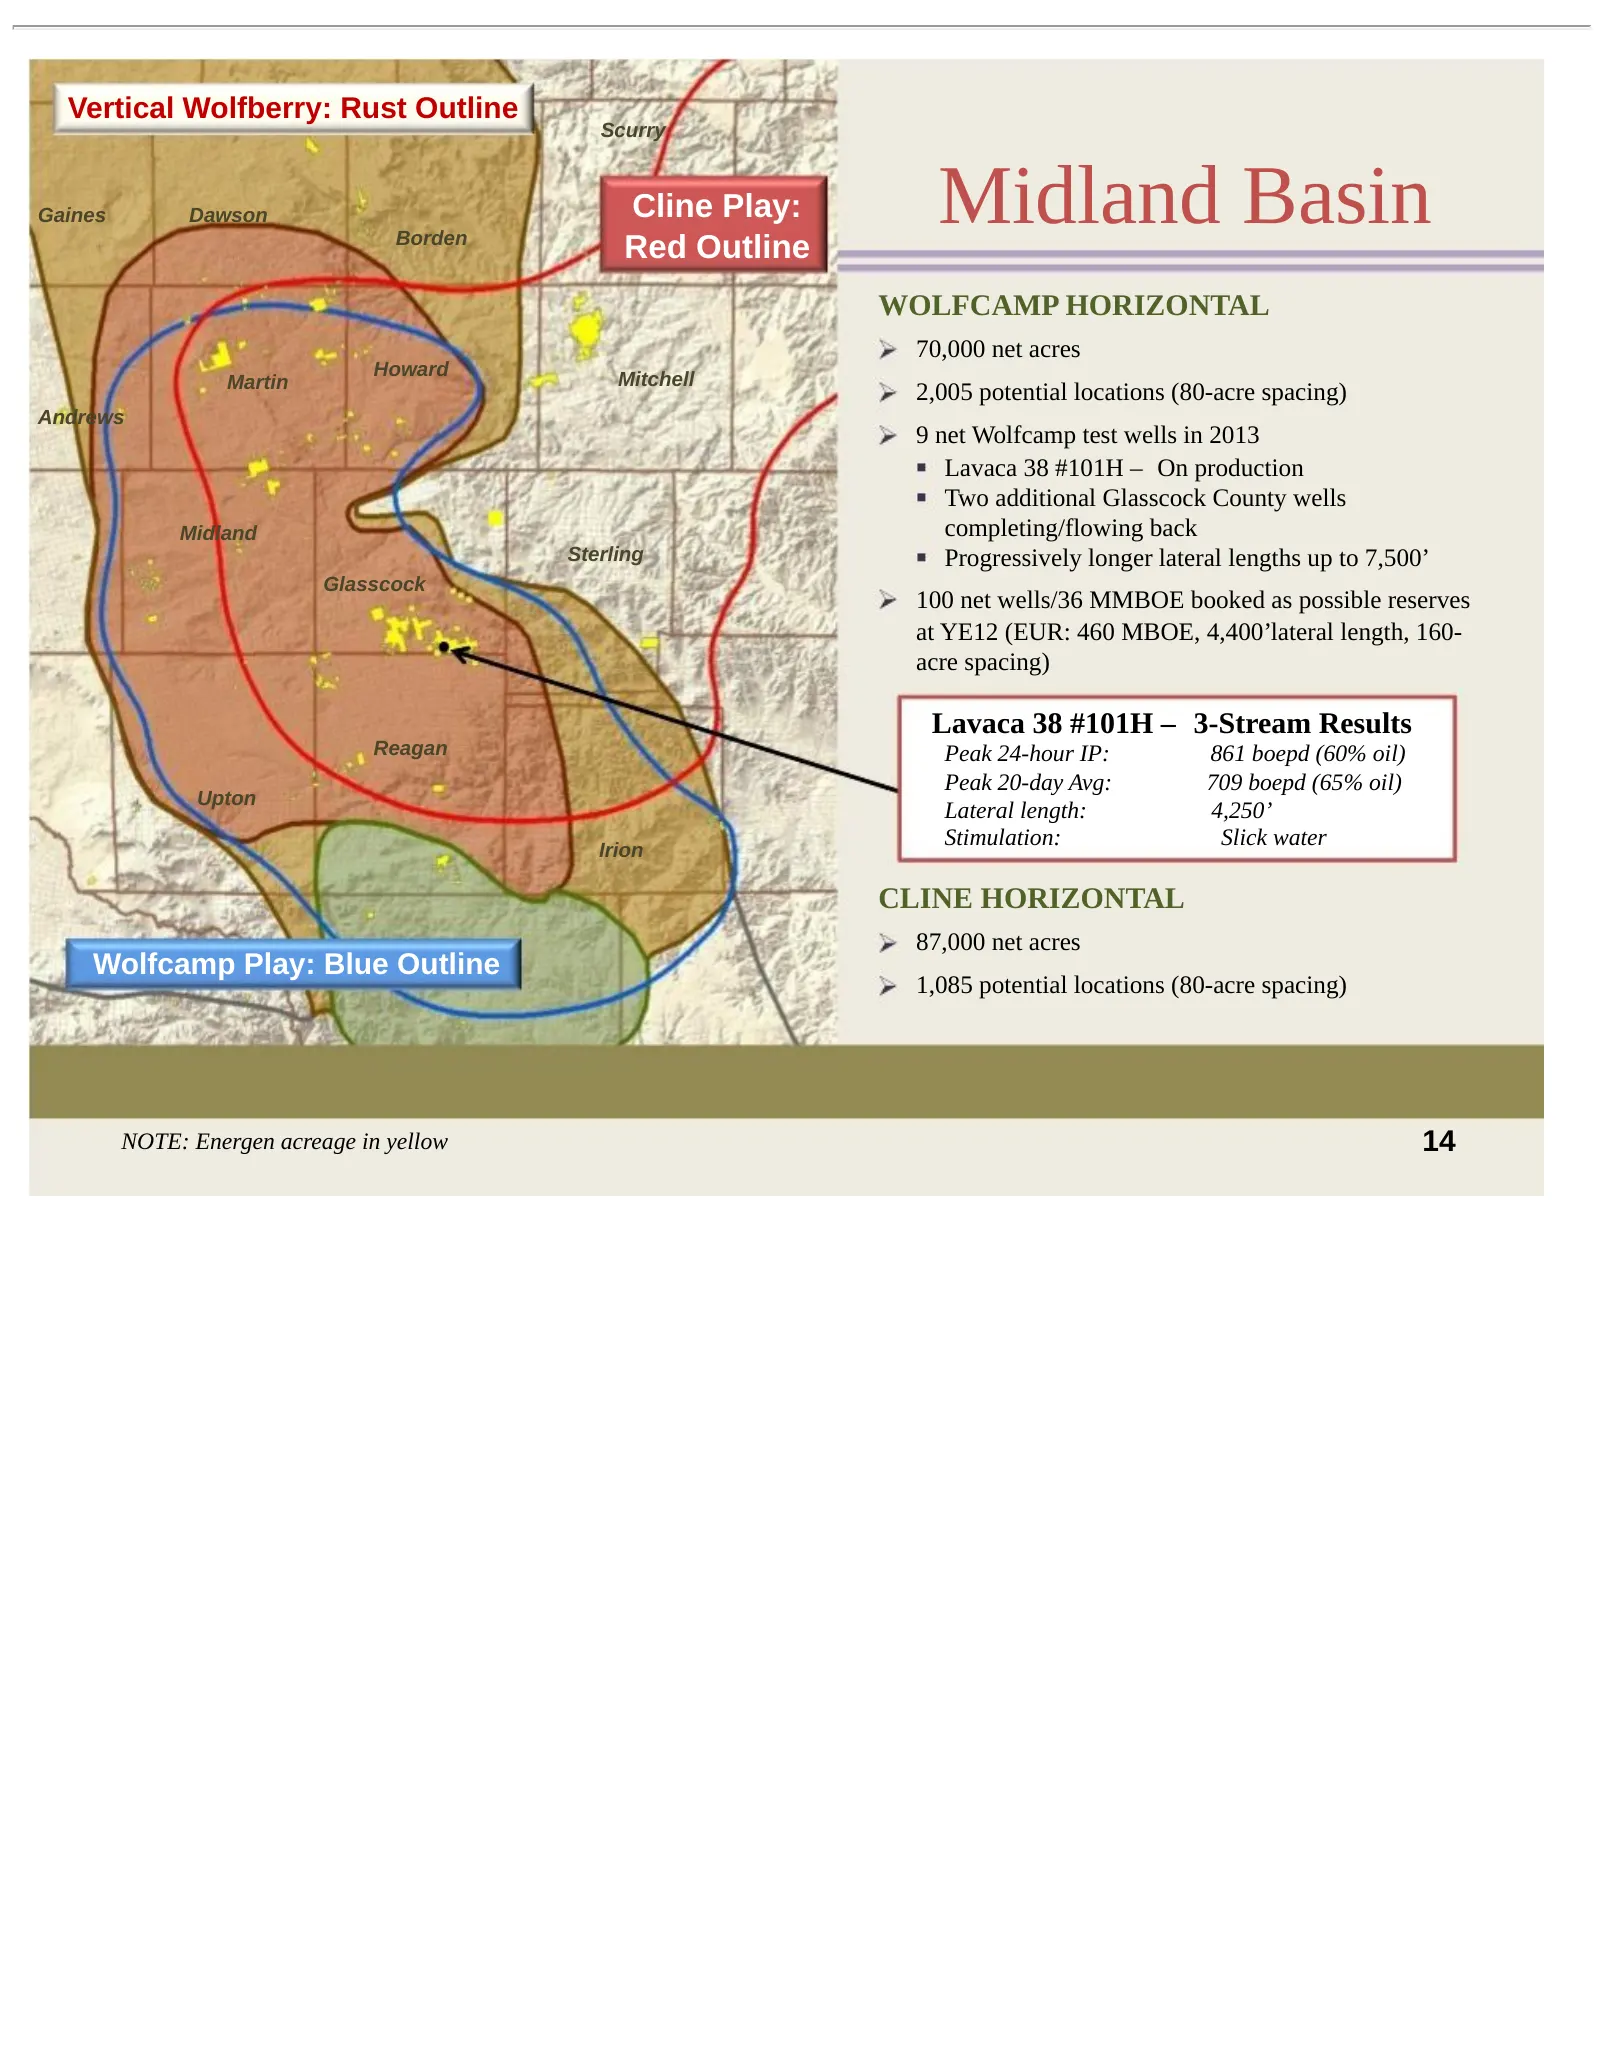
Vertical Wolfberry: Rust Outline Scurry Gaines Dawson Borden Cline Play: Red Outline Midland Basin WOLFCAMP HORIZONTAL 70,000 net acres Howard Mitchell Martin 2,005 potential locations (80-acre spacing) Andrews 9 net Wolfcamp test wells in 2013 Lavaca 38 #101H – On production Two additional Glasscoc
Slide 16: Midland Basin Wolfcamp, Cline Potential
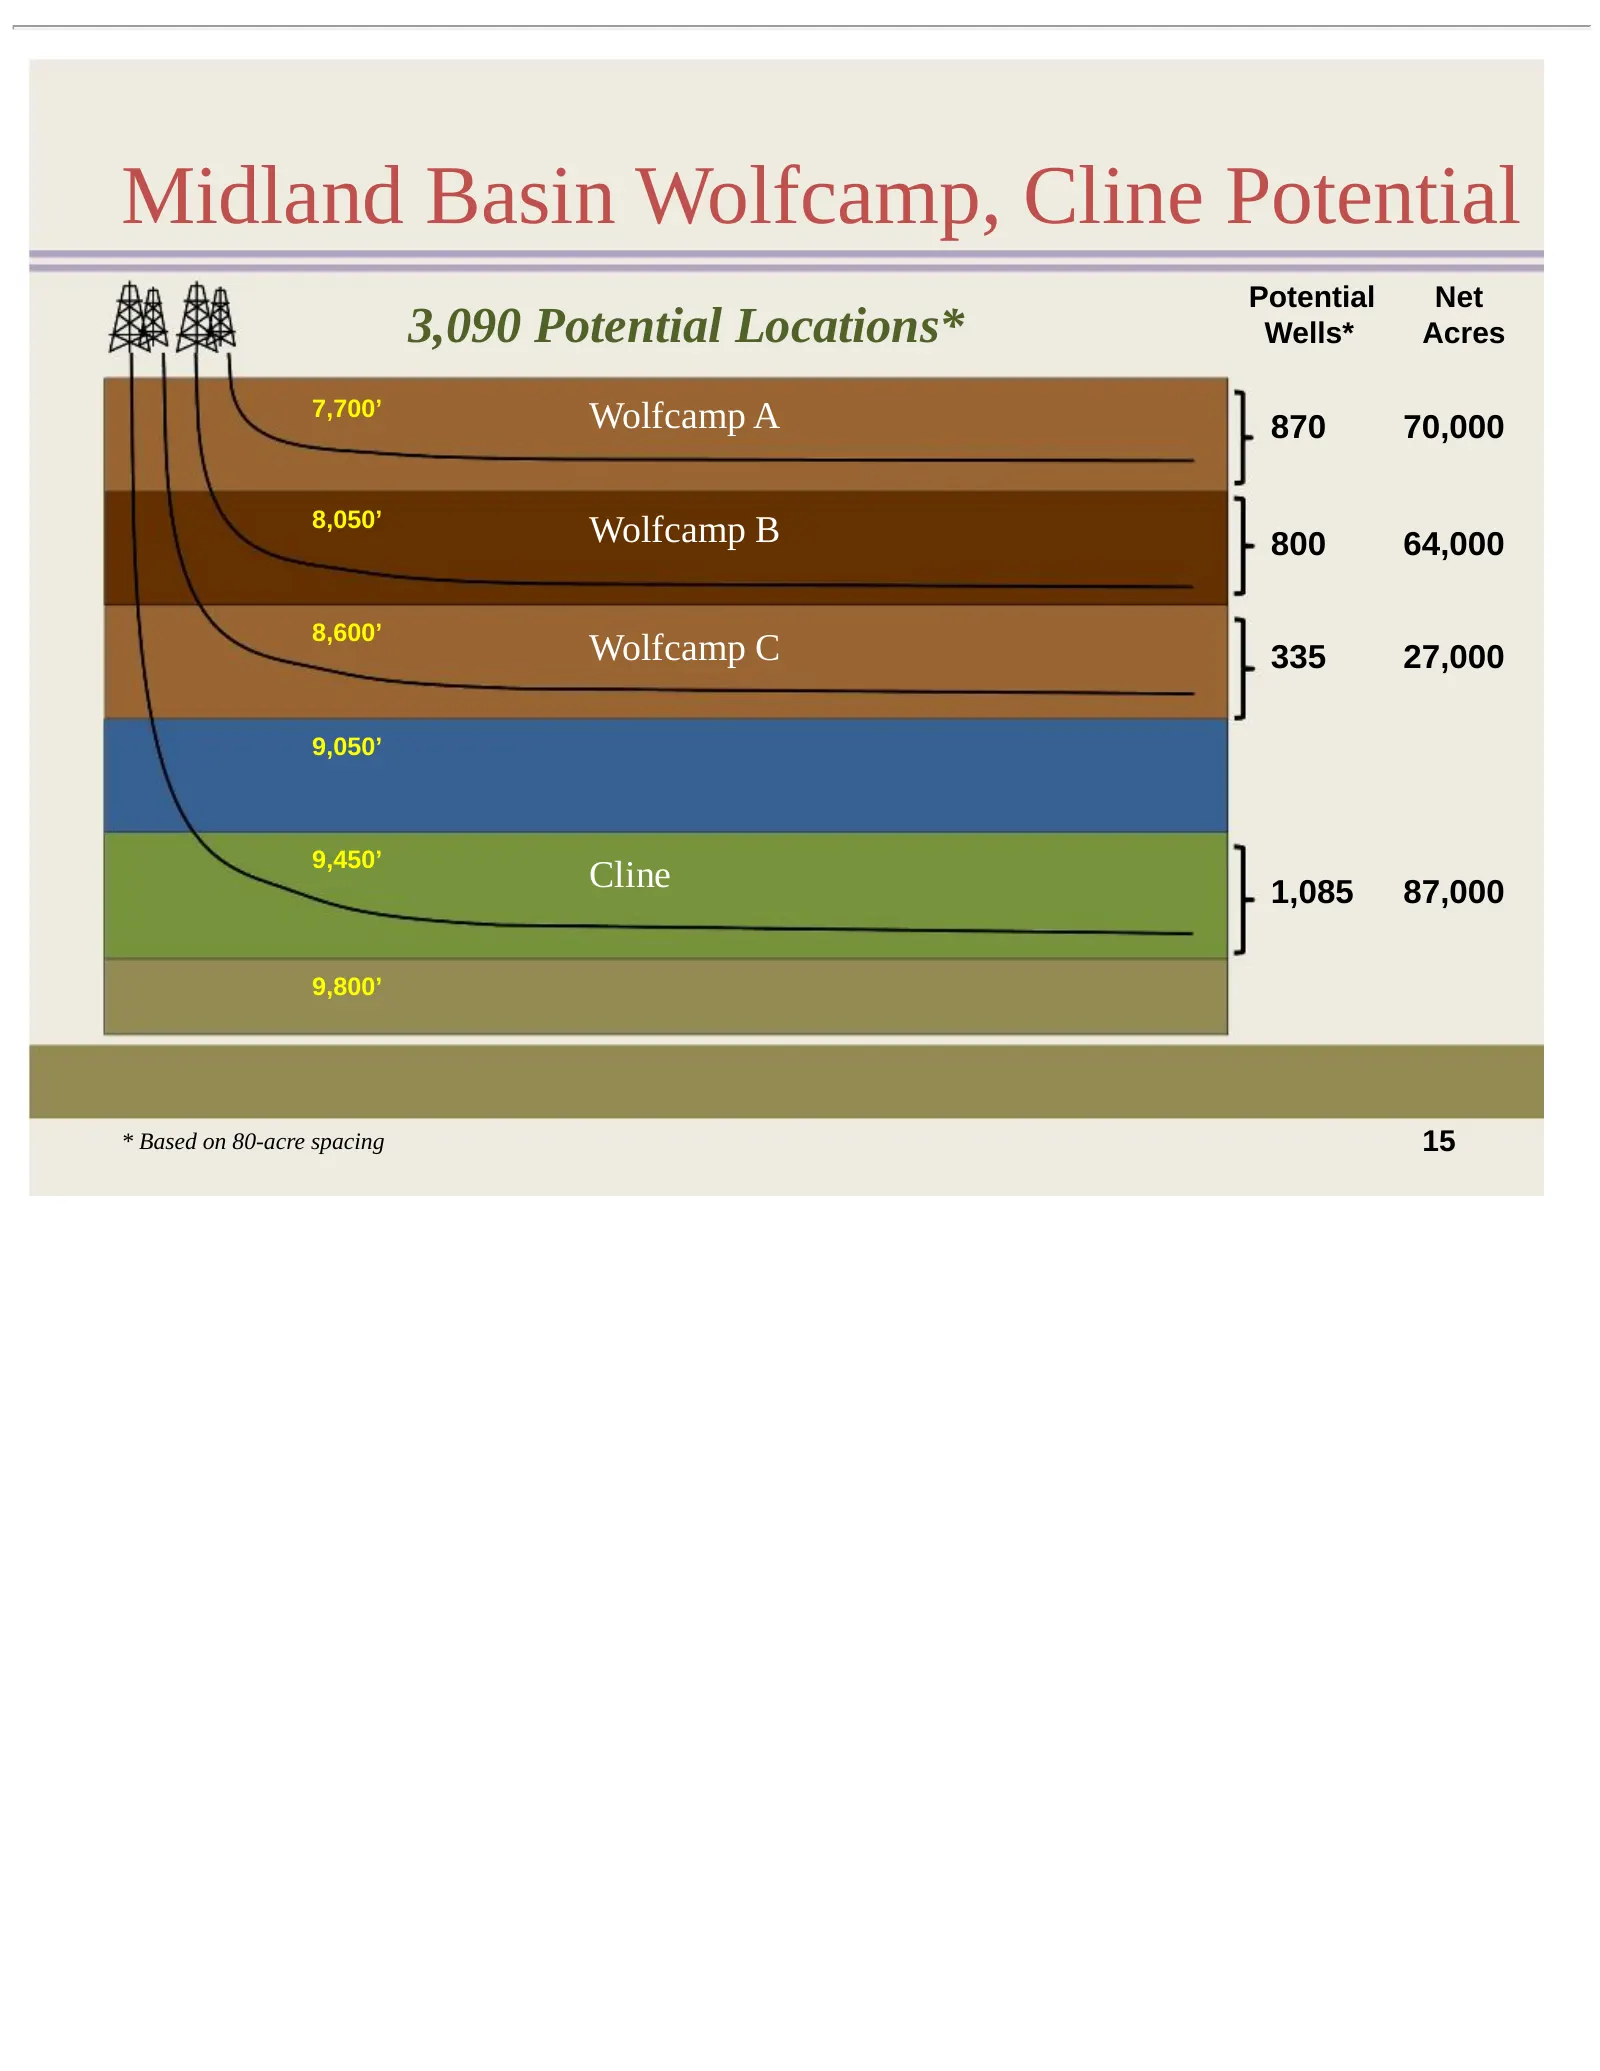
Midland Basin Wolfcamp, Cline Potential Potential Net 3,090 Potential Locations* Wells* Acres 7,700’ Wolfcamp A 870 70,000 8,050’ Wolfcamp B 800 64,000 8,600’ Wolfcamp C 335 27,000 9,050’ 9,450’ Cline 1,085 87,000 9,800’ * Based on 80-acre spacing 15
Slide 17: 3rd Bone Spring Type Curve
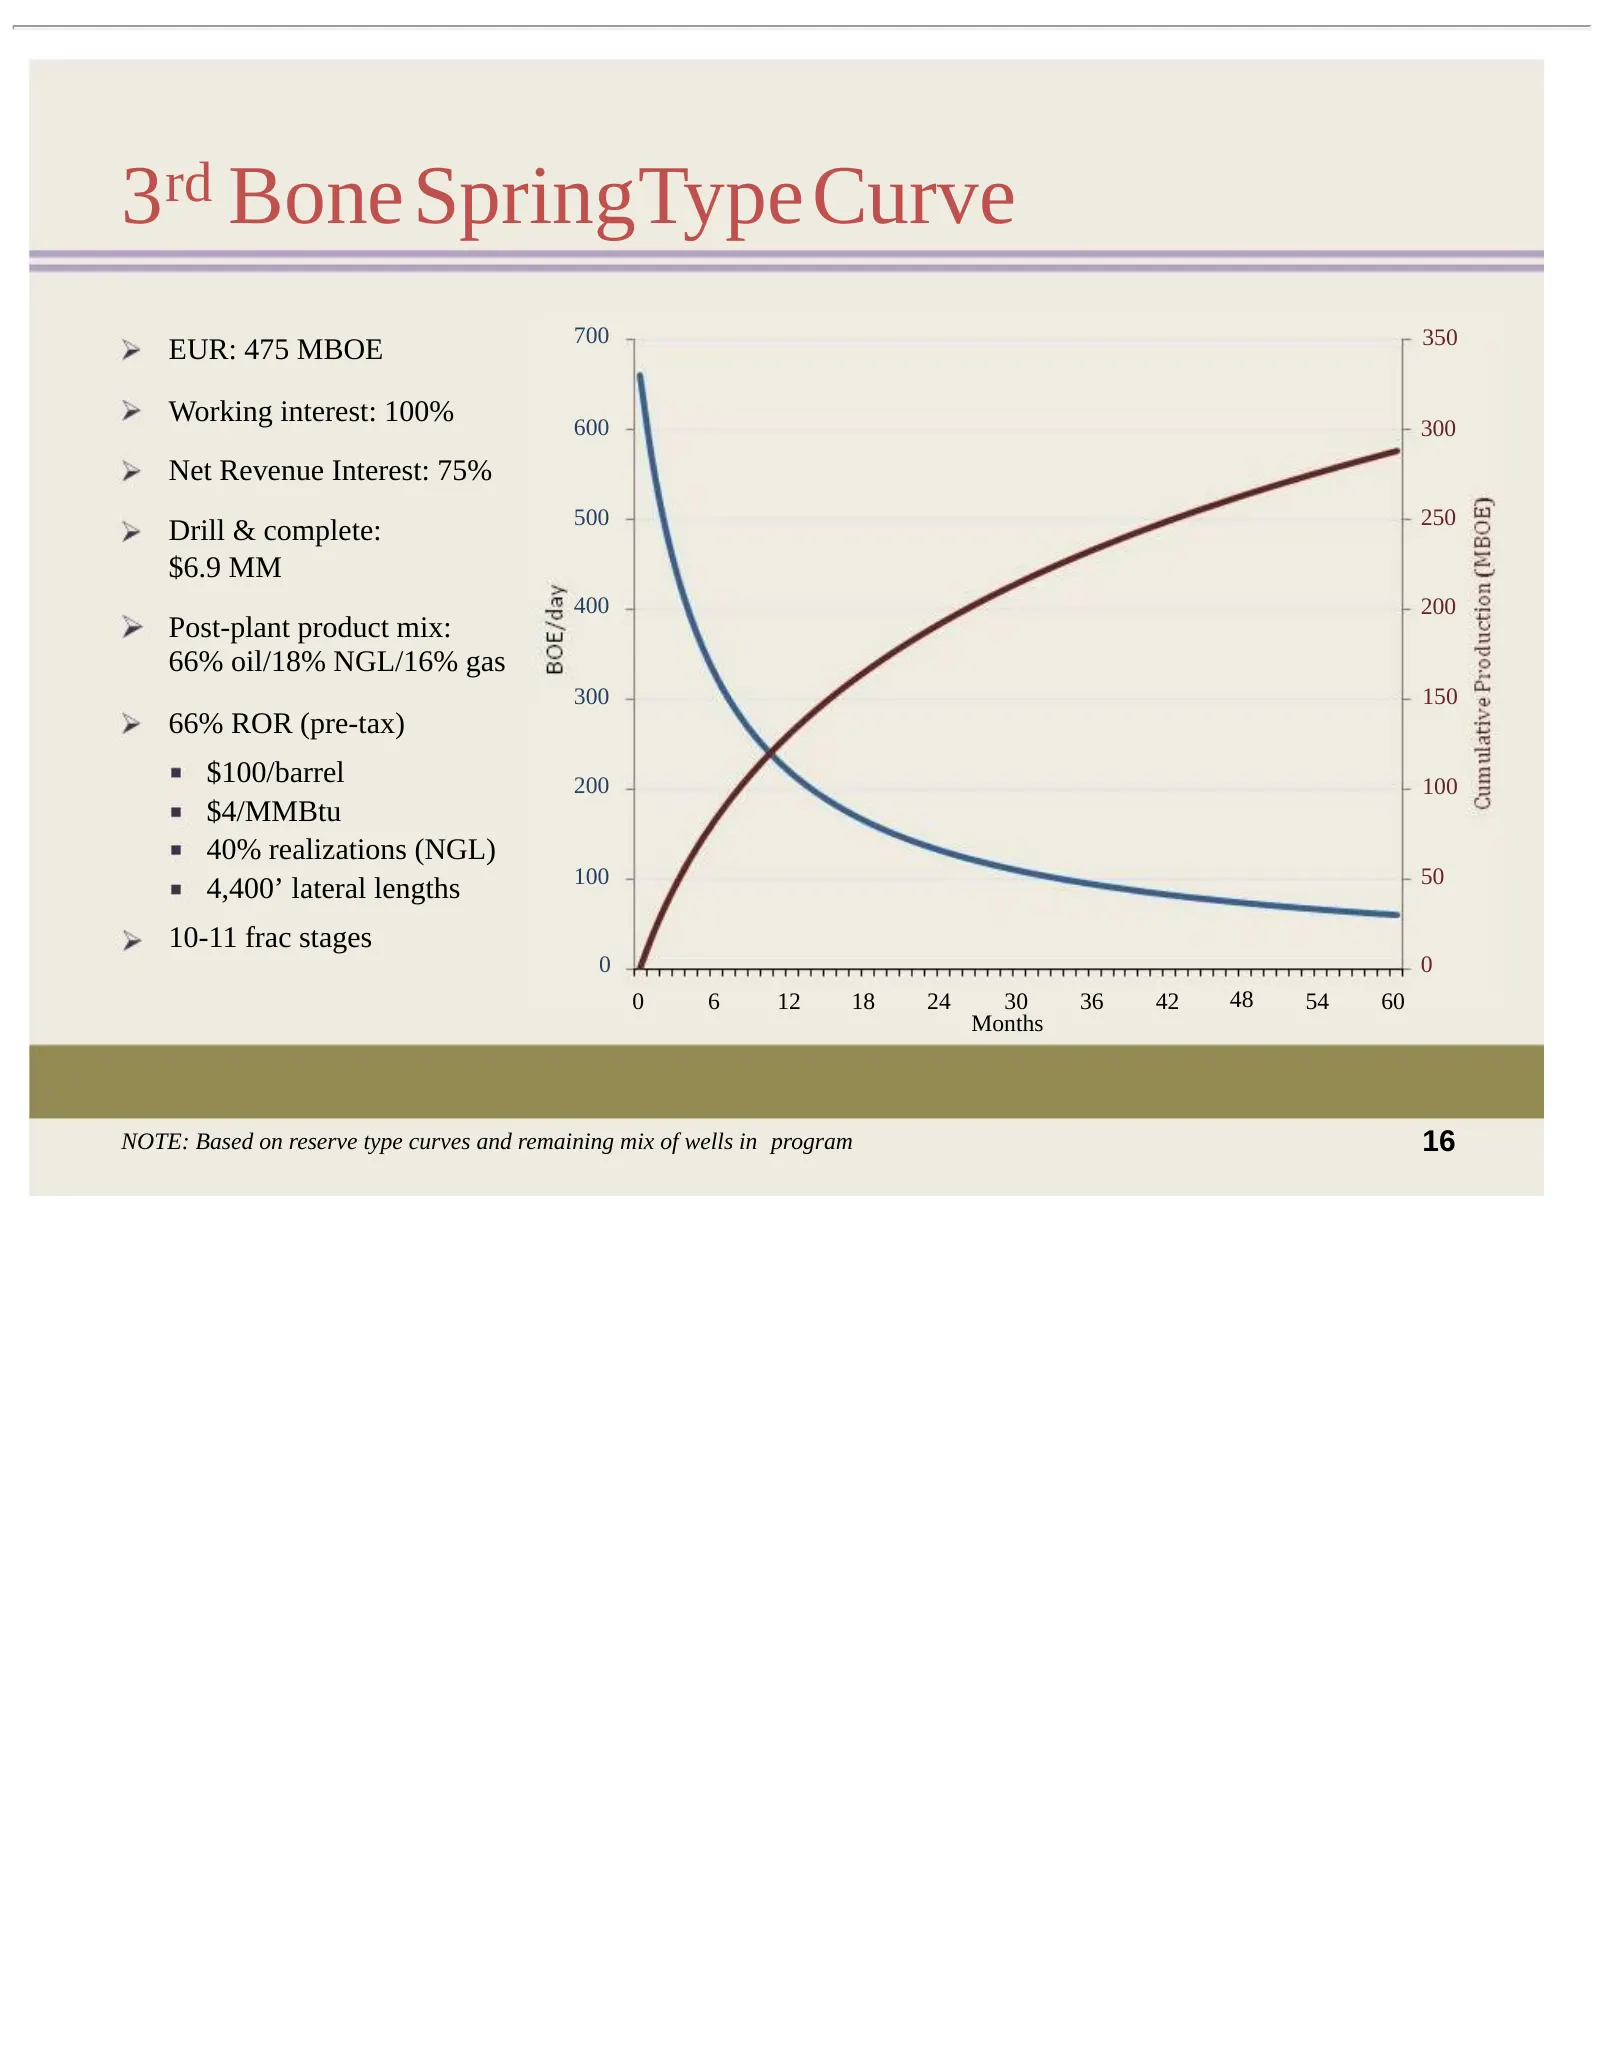
3rd BoneSpringTypeCurve 700 350 EUR: 475 MBOE Working interest: 100% 600 300 Net Revenue Interest: 75% 500 250 Drill & complete: $6.9 MM 400 200 Post-plant product mix: 66% oil/18% NGL/16% gas 300 150 66% ROR (pre-tax) $100/barrel 200 100 $4/MMBtu 40% realizations (NGL) 100 50 4,400’ lateral lengths
Slide 18: Delaware Basin
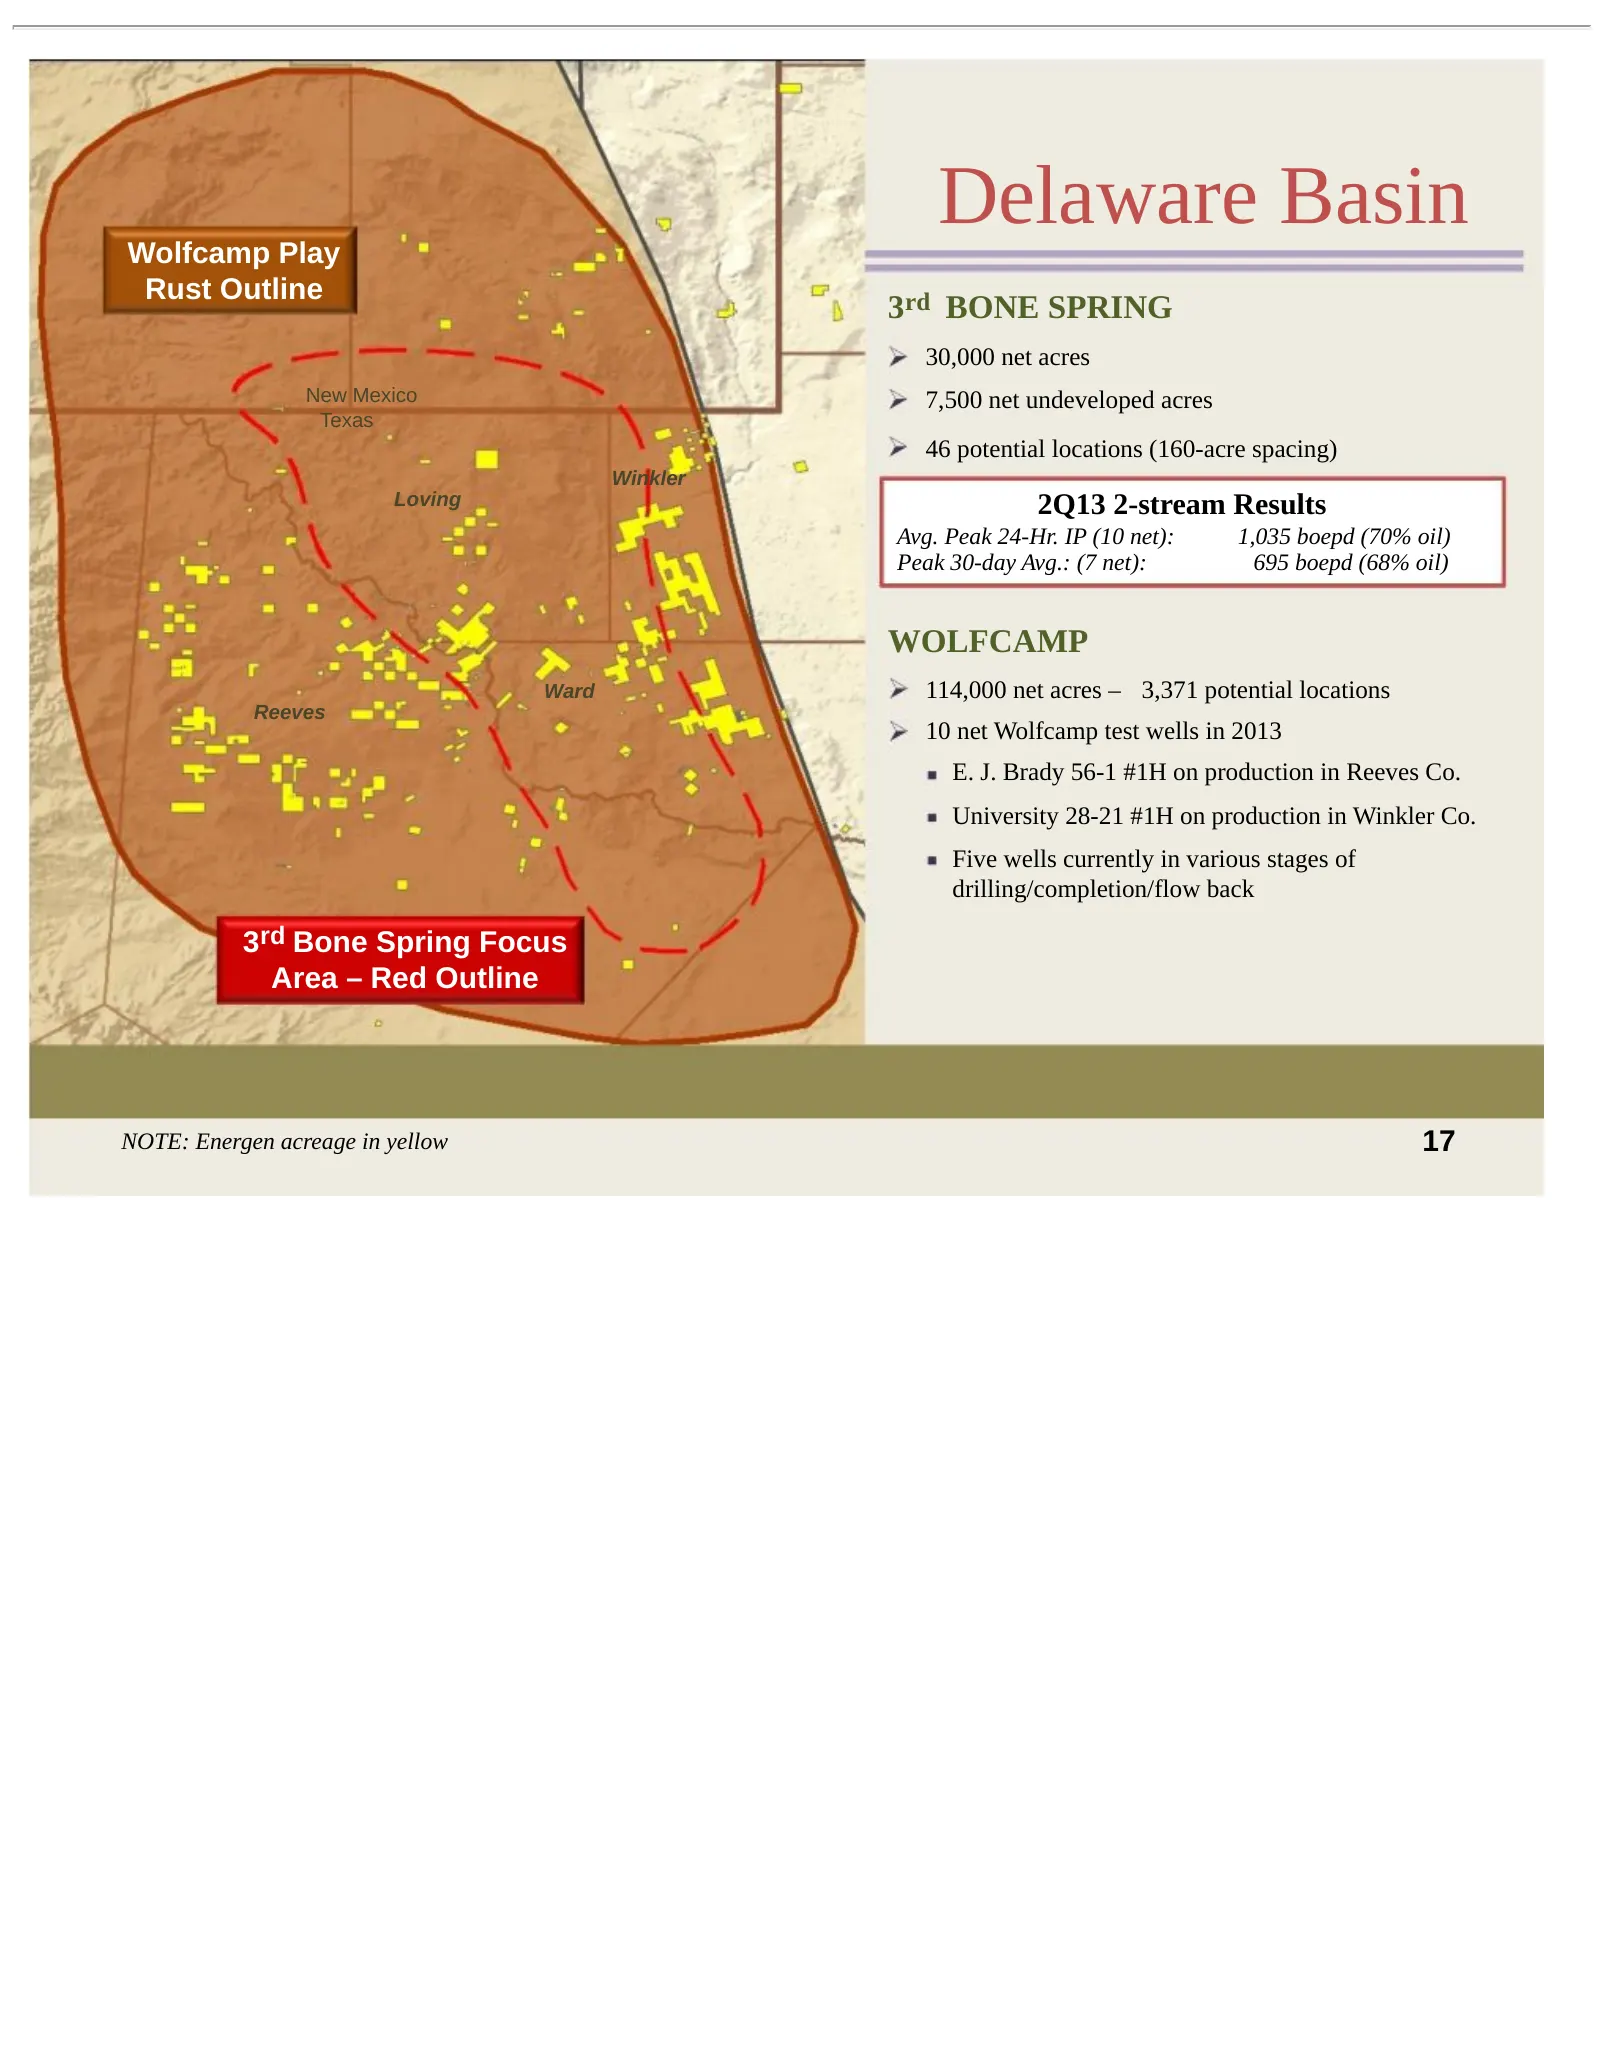
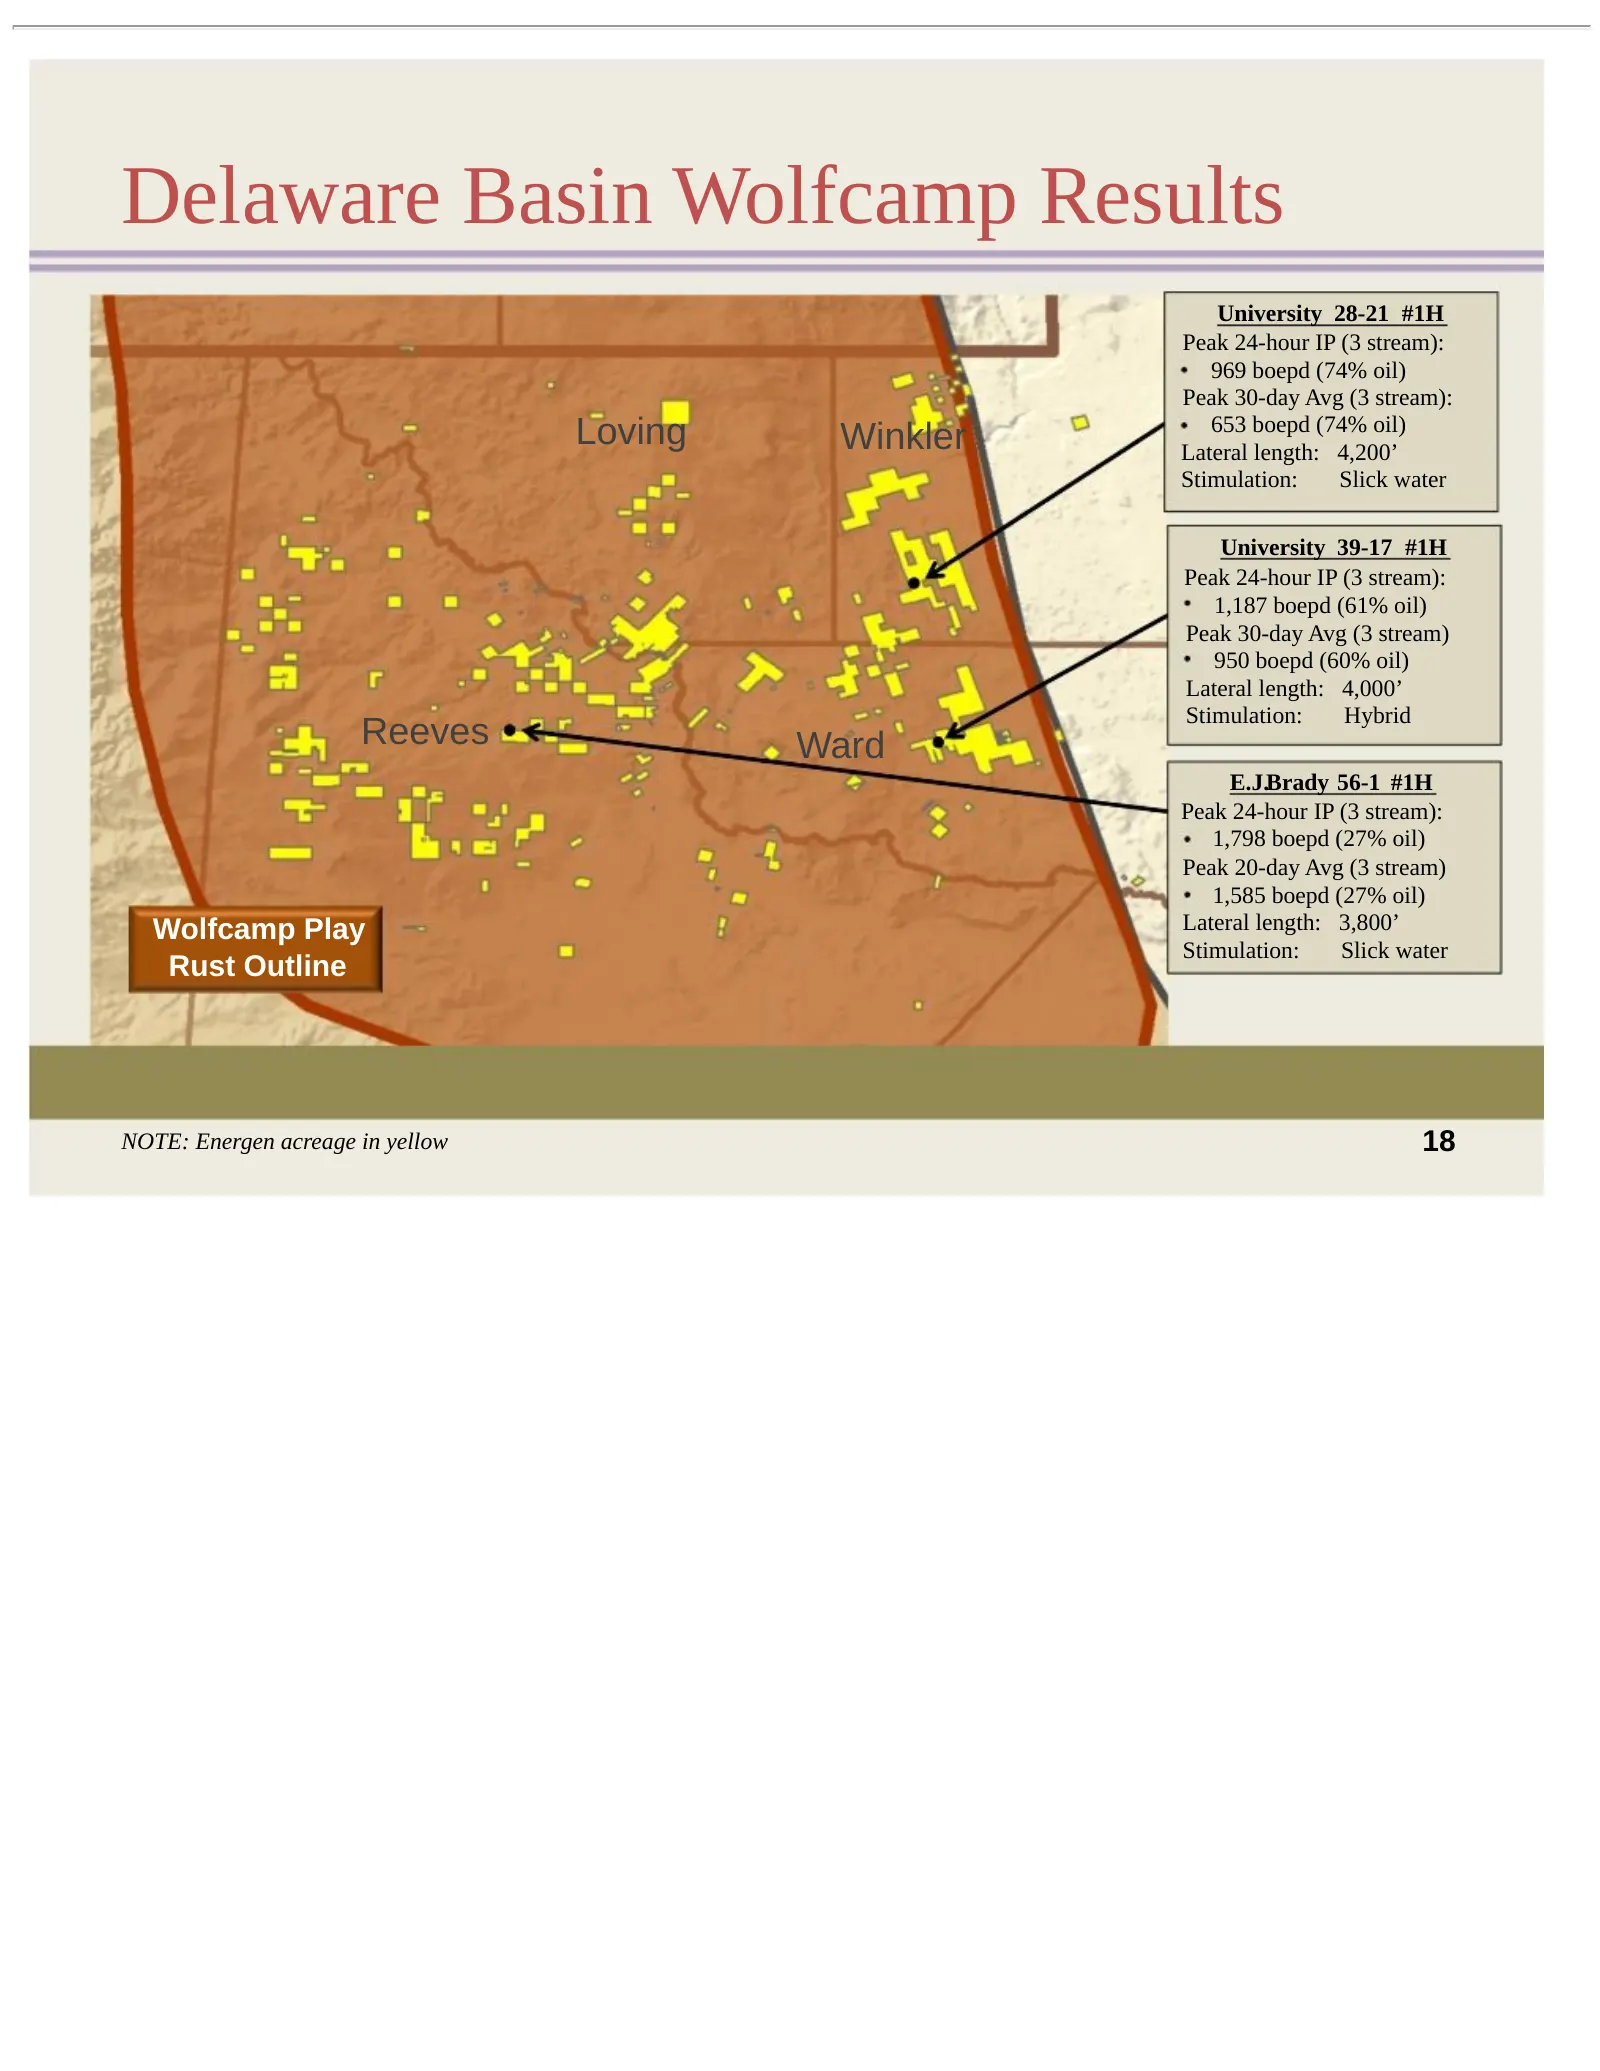
Wolfcamp Play Delaware Basin Rust Outline 3rd BONE SPRING 30,000 net acres New Mexico 7,500 net undeveloped acres Texas 46 potential locations (160-acre spacing) Winkler Loving 2Q13 2-stream Results Avg. Peak 24-Hr. IP (10 net): 1,035 boepd (70% oil) Peak 30-day Avg.: (7 net): 695 boepd (68% oil) WO
Slide 19: Delaware Basin Wolfcamp Results
Delaware Basin Wolfcamp Results University 28-21 #1H Peak 24-hour IP (3 stream): 969 boepd (74% oil) Peak 30-day Avg (3 stream): Loving Winkler 653 boepd (74% oil) Lateral length: 4,200’ Stimulation: Slick water University 39-17 #1H Peak 24-hour IP (3 stream): 1,187 boepd (61% oil) Peak 30-day Avg (
Slide 20: Delaware Wolfcamp Potential
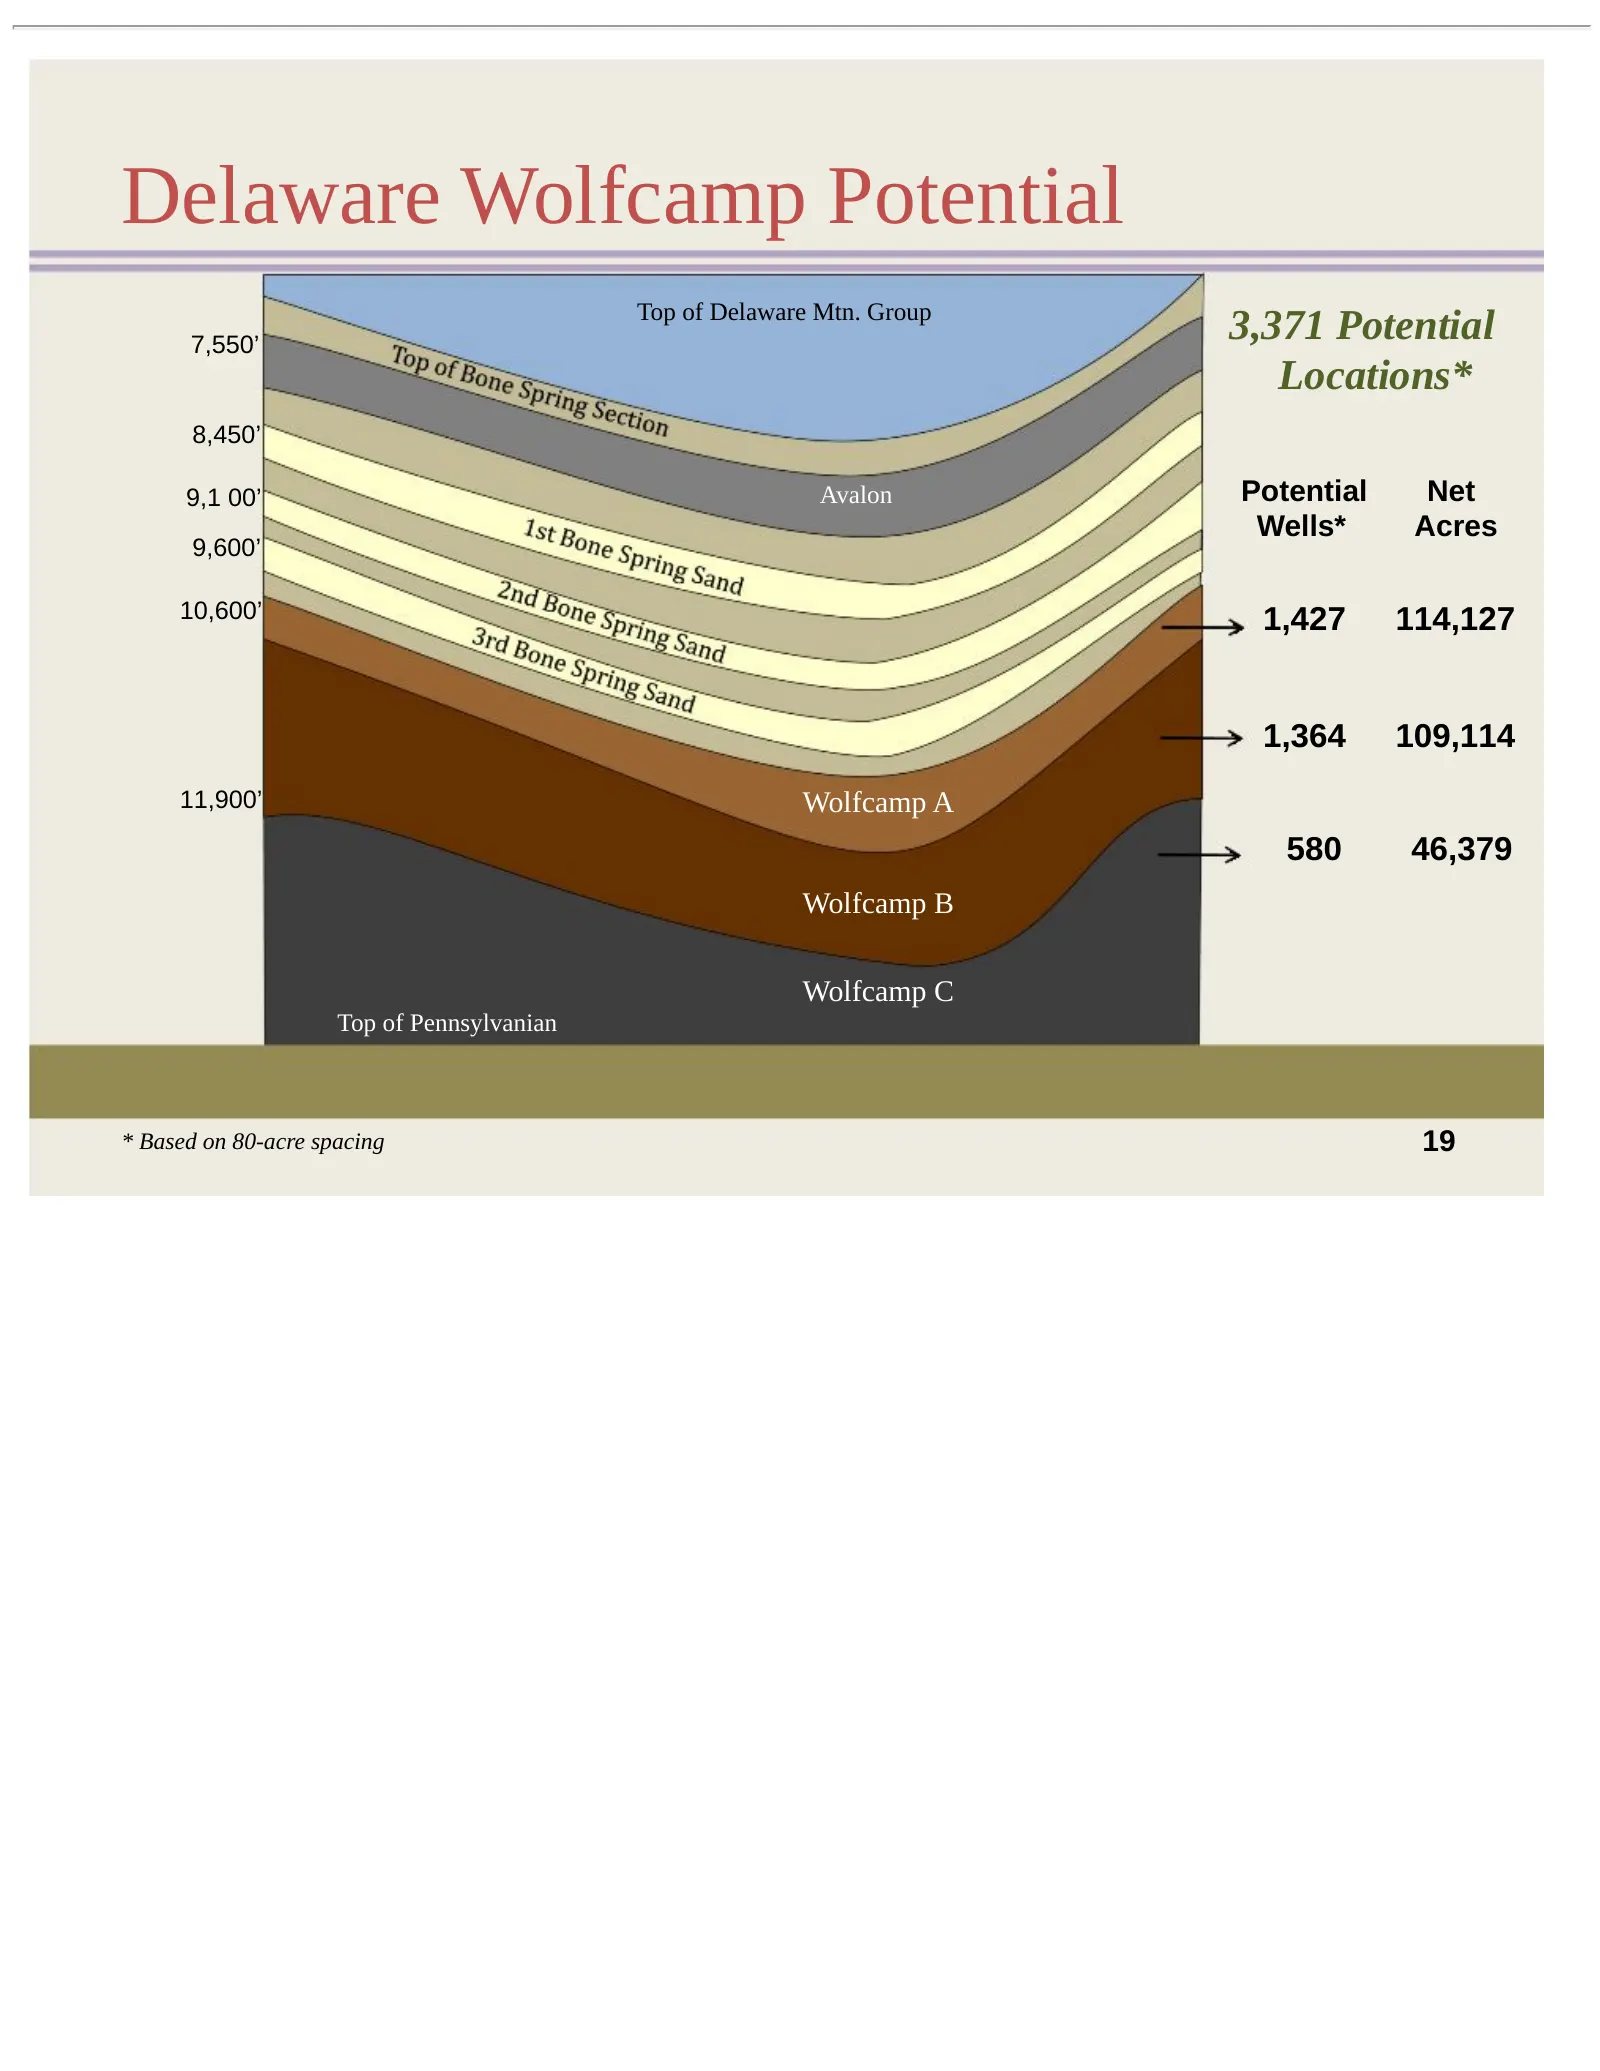
Delaware Wolfcamp Potential Top of Delaware Mtn. Group 7,550’ 3,371 Potential Locations* 8,450’ 9,1 00’ Avalon Potential Net Wells* Acres 9,600’ 10,600’ 1,427 114,127 1,364 109,114 11,900’ Wolfcamp A 580 46,379 Wolfcamp B Wolfcamp C Top of Pennsylvanian * Based on 80-acre spacing 19
Slide 21: Oil Price ROR Impact
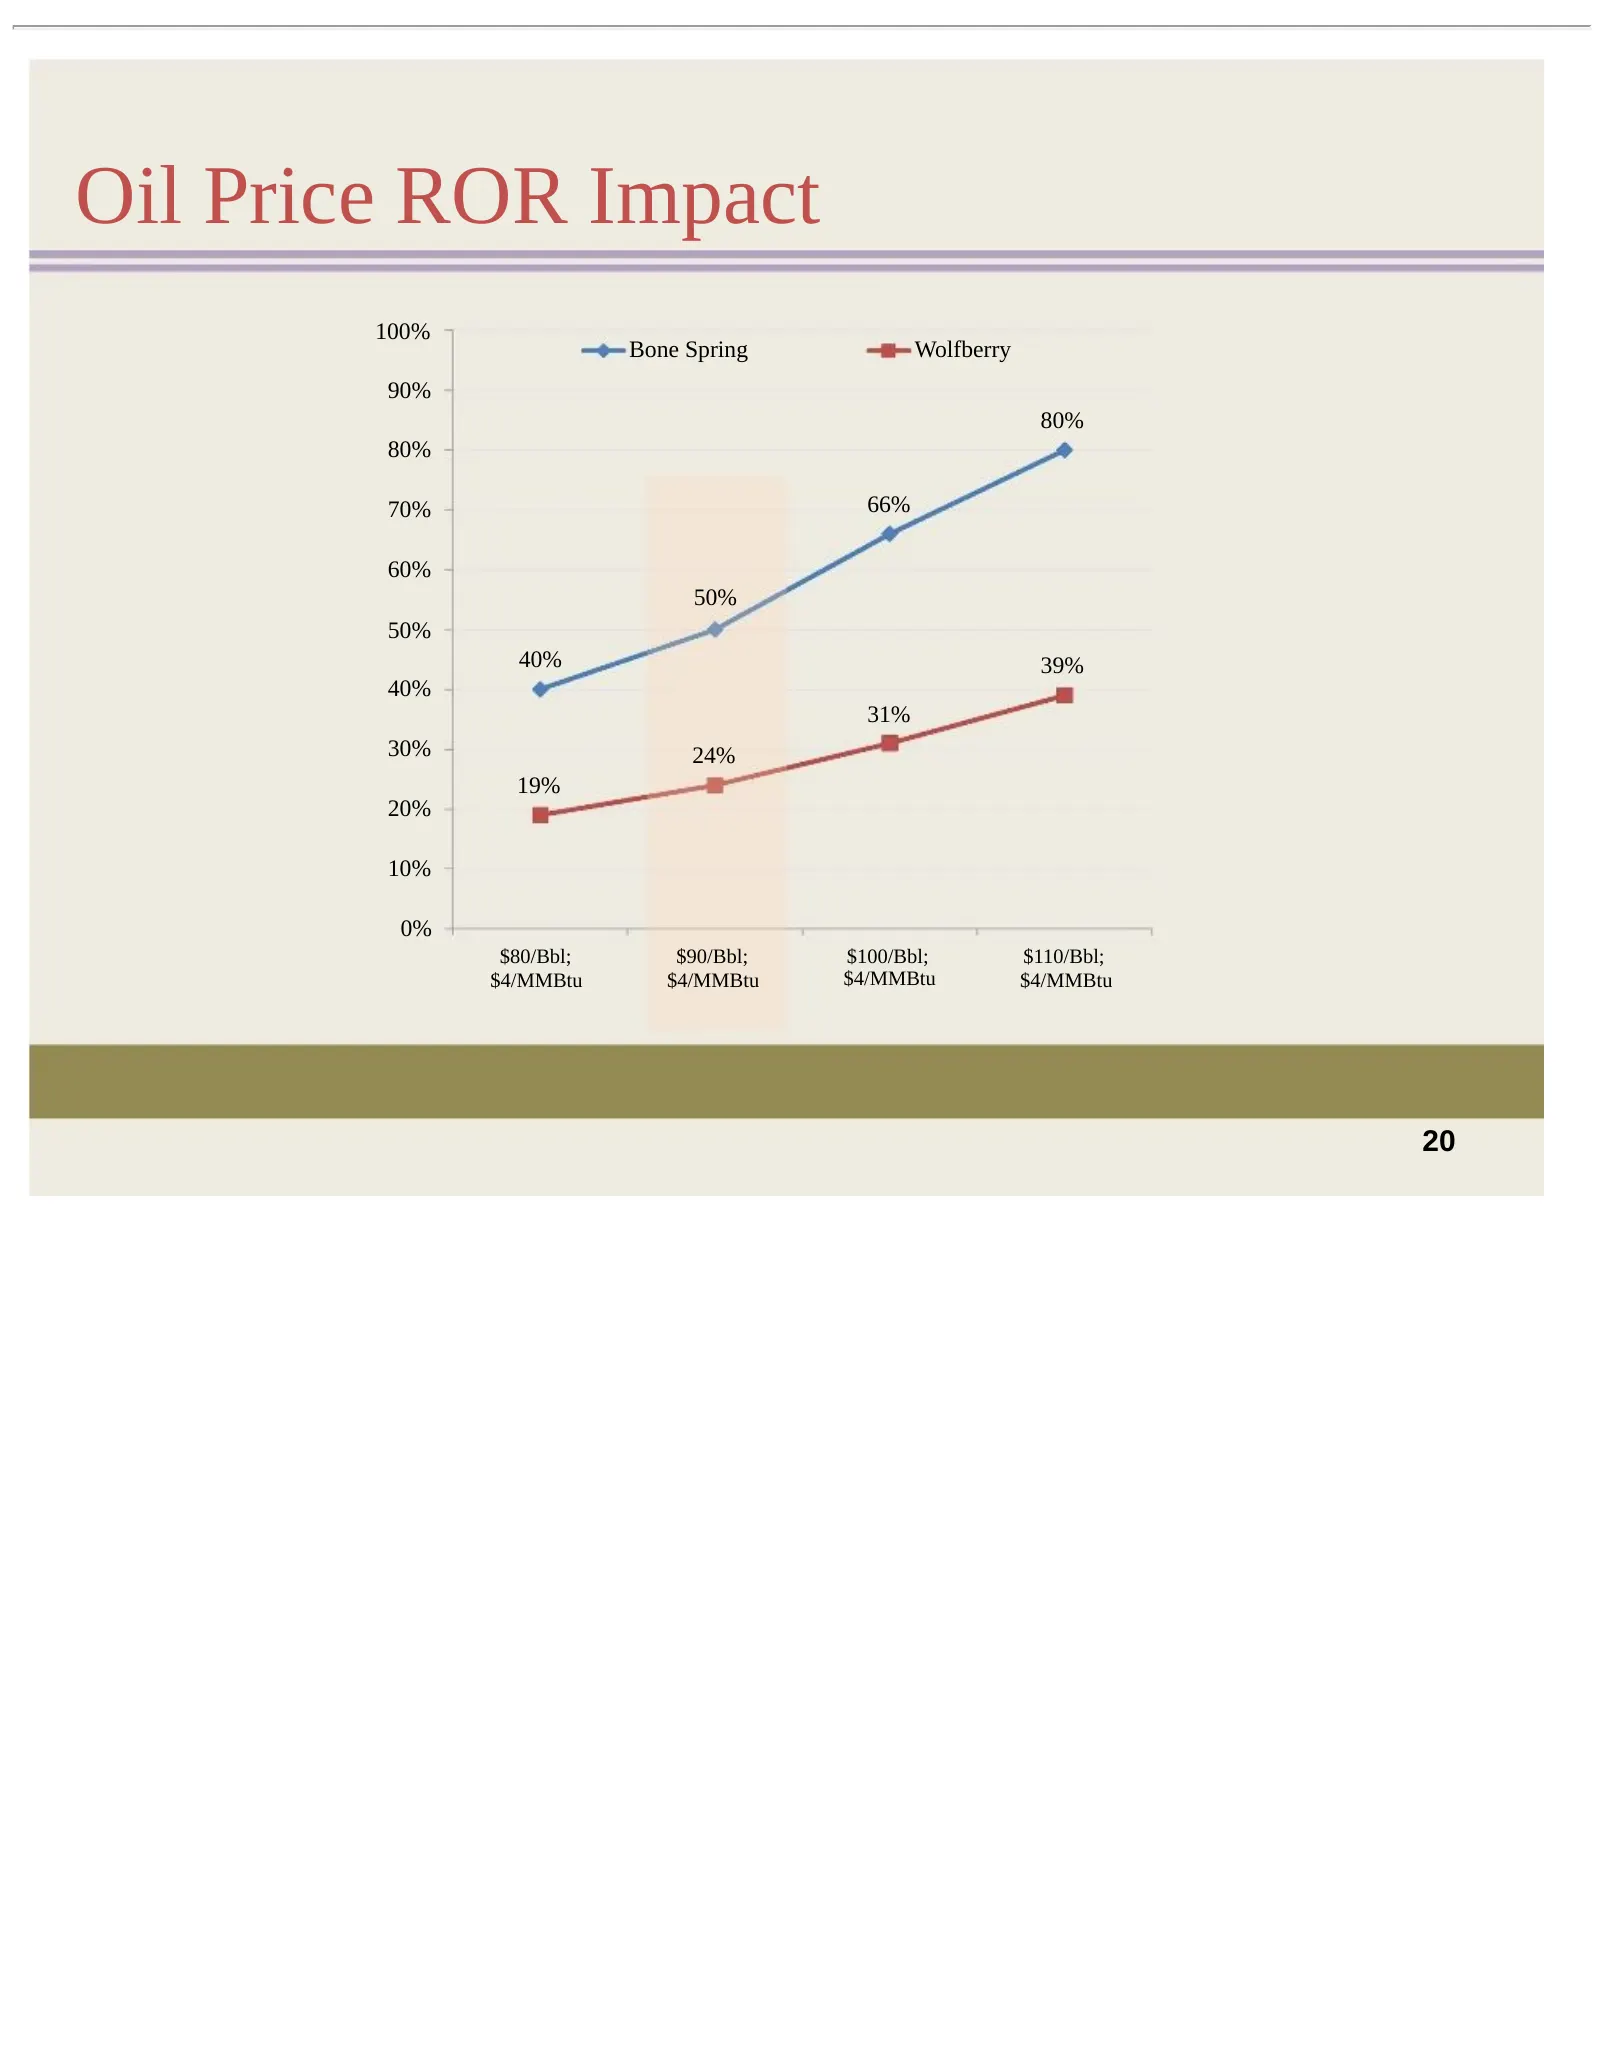
Oil Price ROR Impact 100% Bone Spring Wolfberry 90% 80% 80% 70% 66% 60% 50% 50% 40% 39% 40% 31% 30% 24% 19% 20% 10% 0% $80/Bbl; $90/Bbl; $100/Bbl; $110/Bbl; $4/MMBtu $4/MMBtu $4/MMBtu $4/MMBtu 20
Slide 22: San Juan Basin: Long-term Optionality
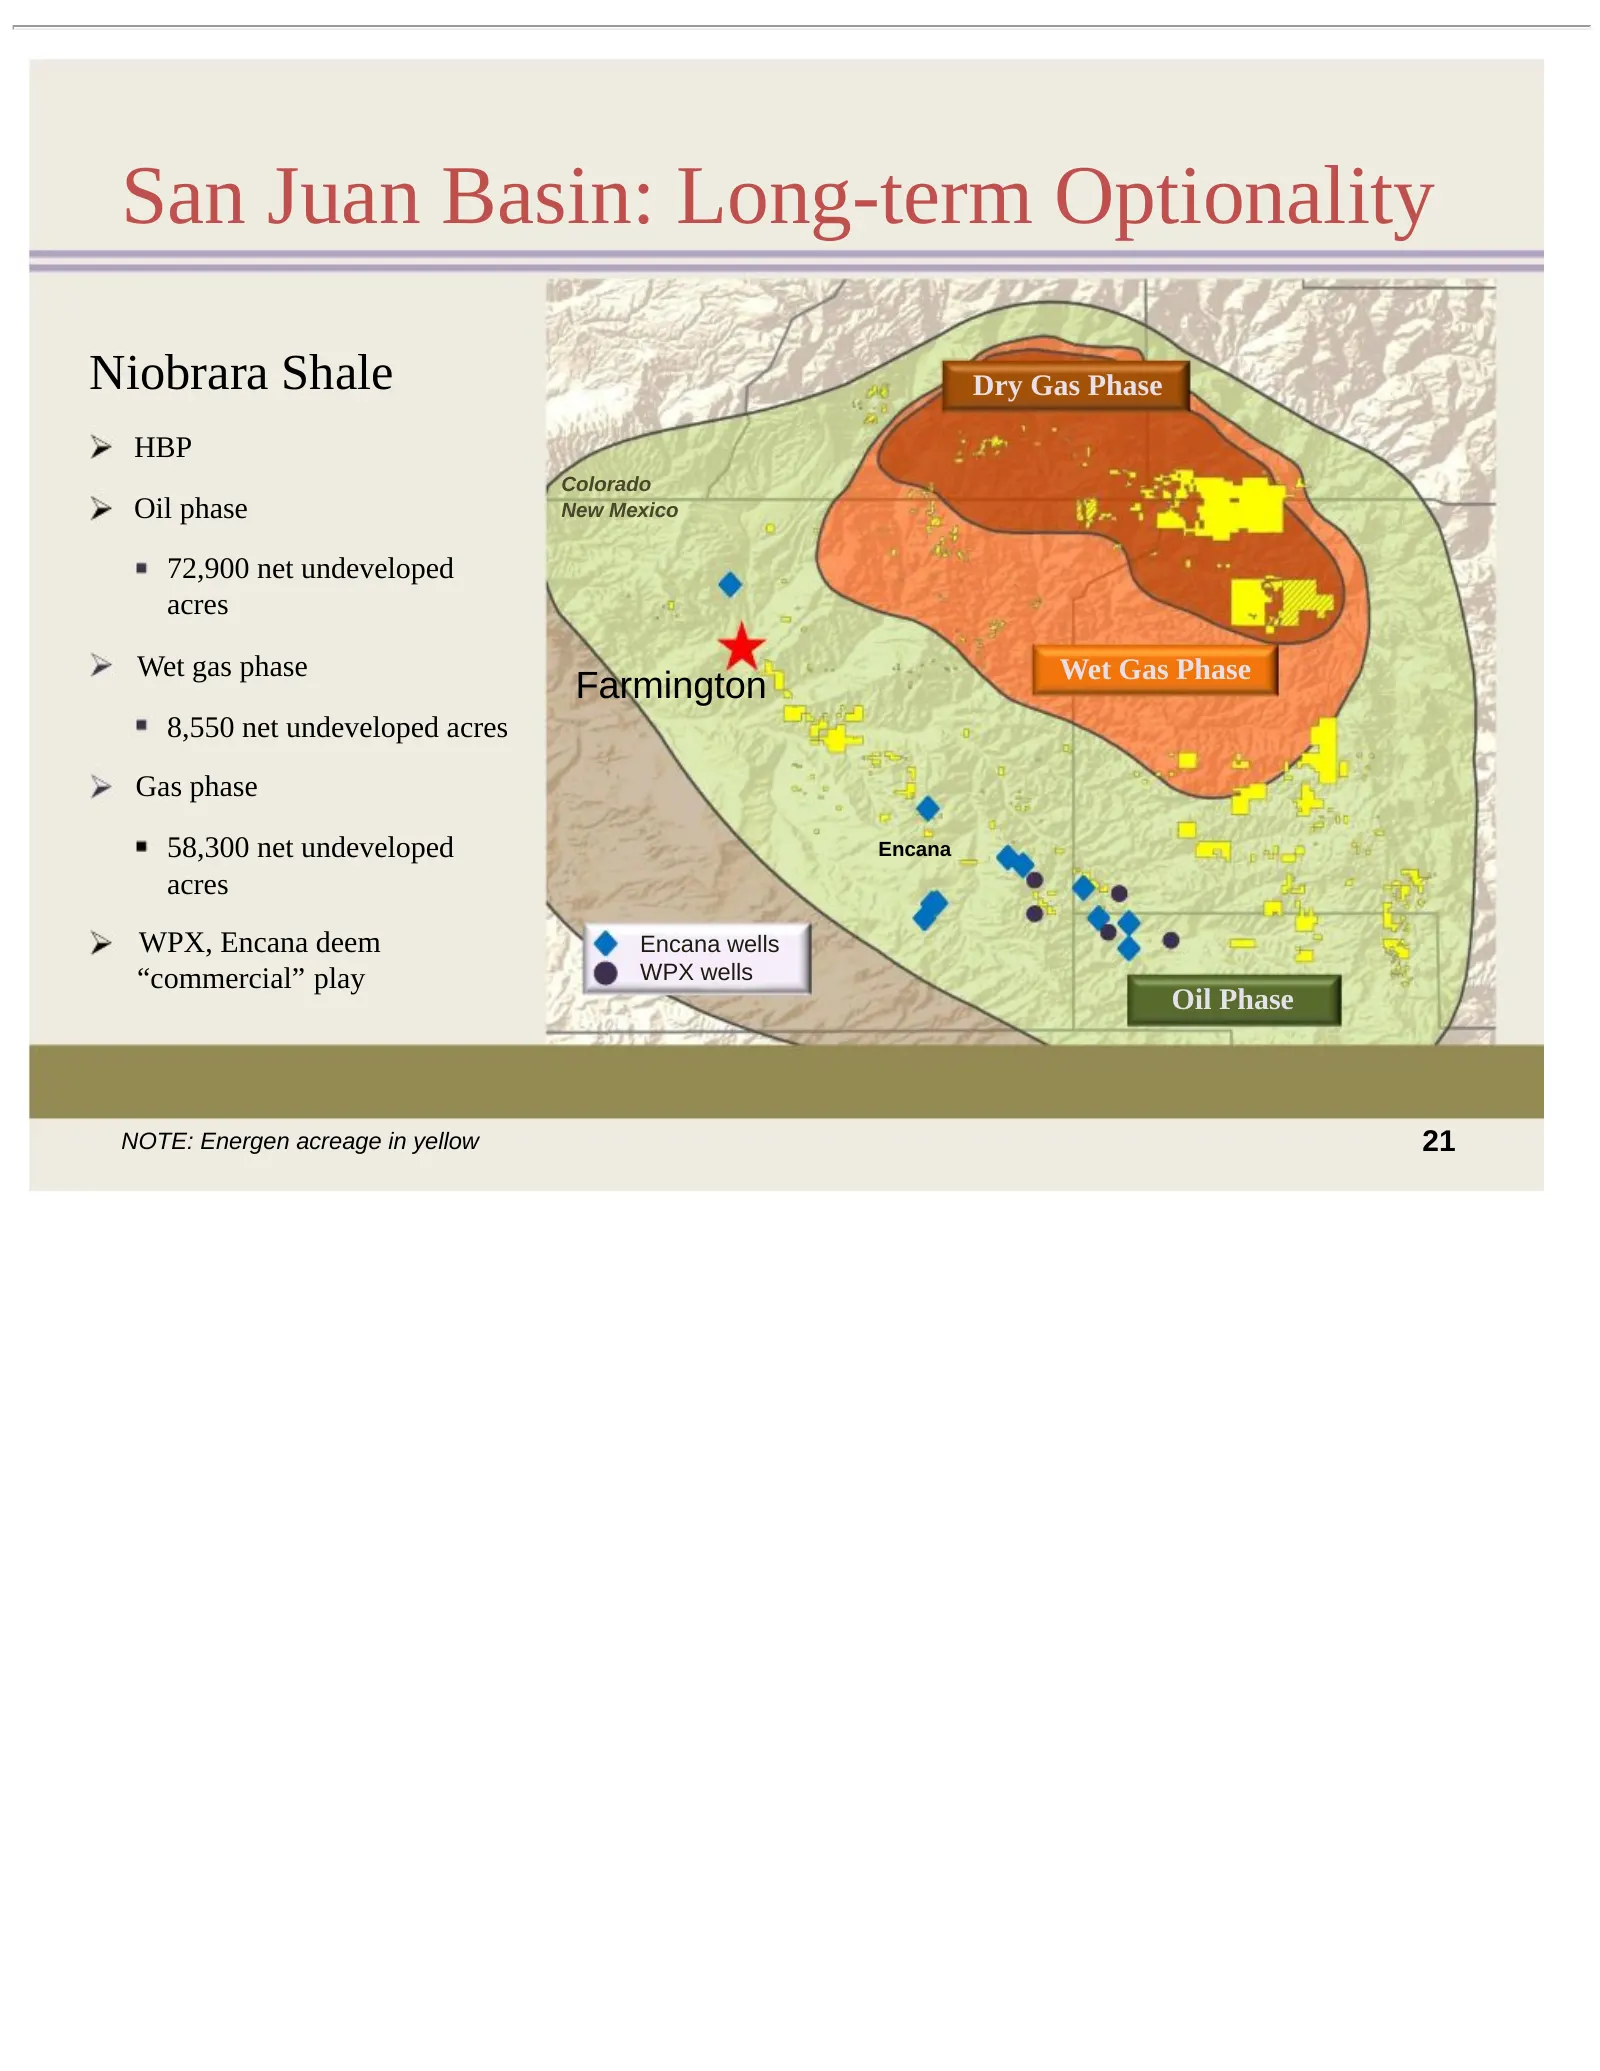
San Juan Basin: Long-term Optionality Niobrara Shale Dry Gas Phase HBP Colorado Oil phase New Mexico 72,900 net undeveloped acres Wet gas phase Wet Gas Phase Farmington 8,550 net undeveloped acres Gas phase 58,300 net undeveloped Encana acres WPX, Encana deem Encana wells “commercial” play WPX wells
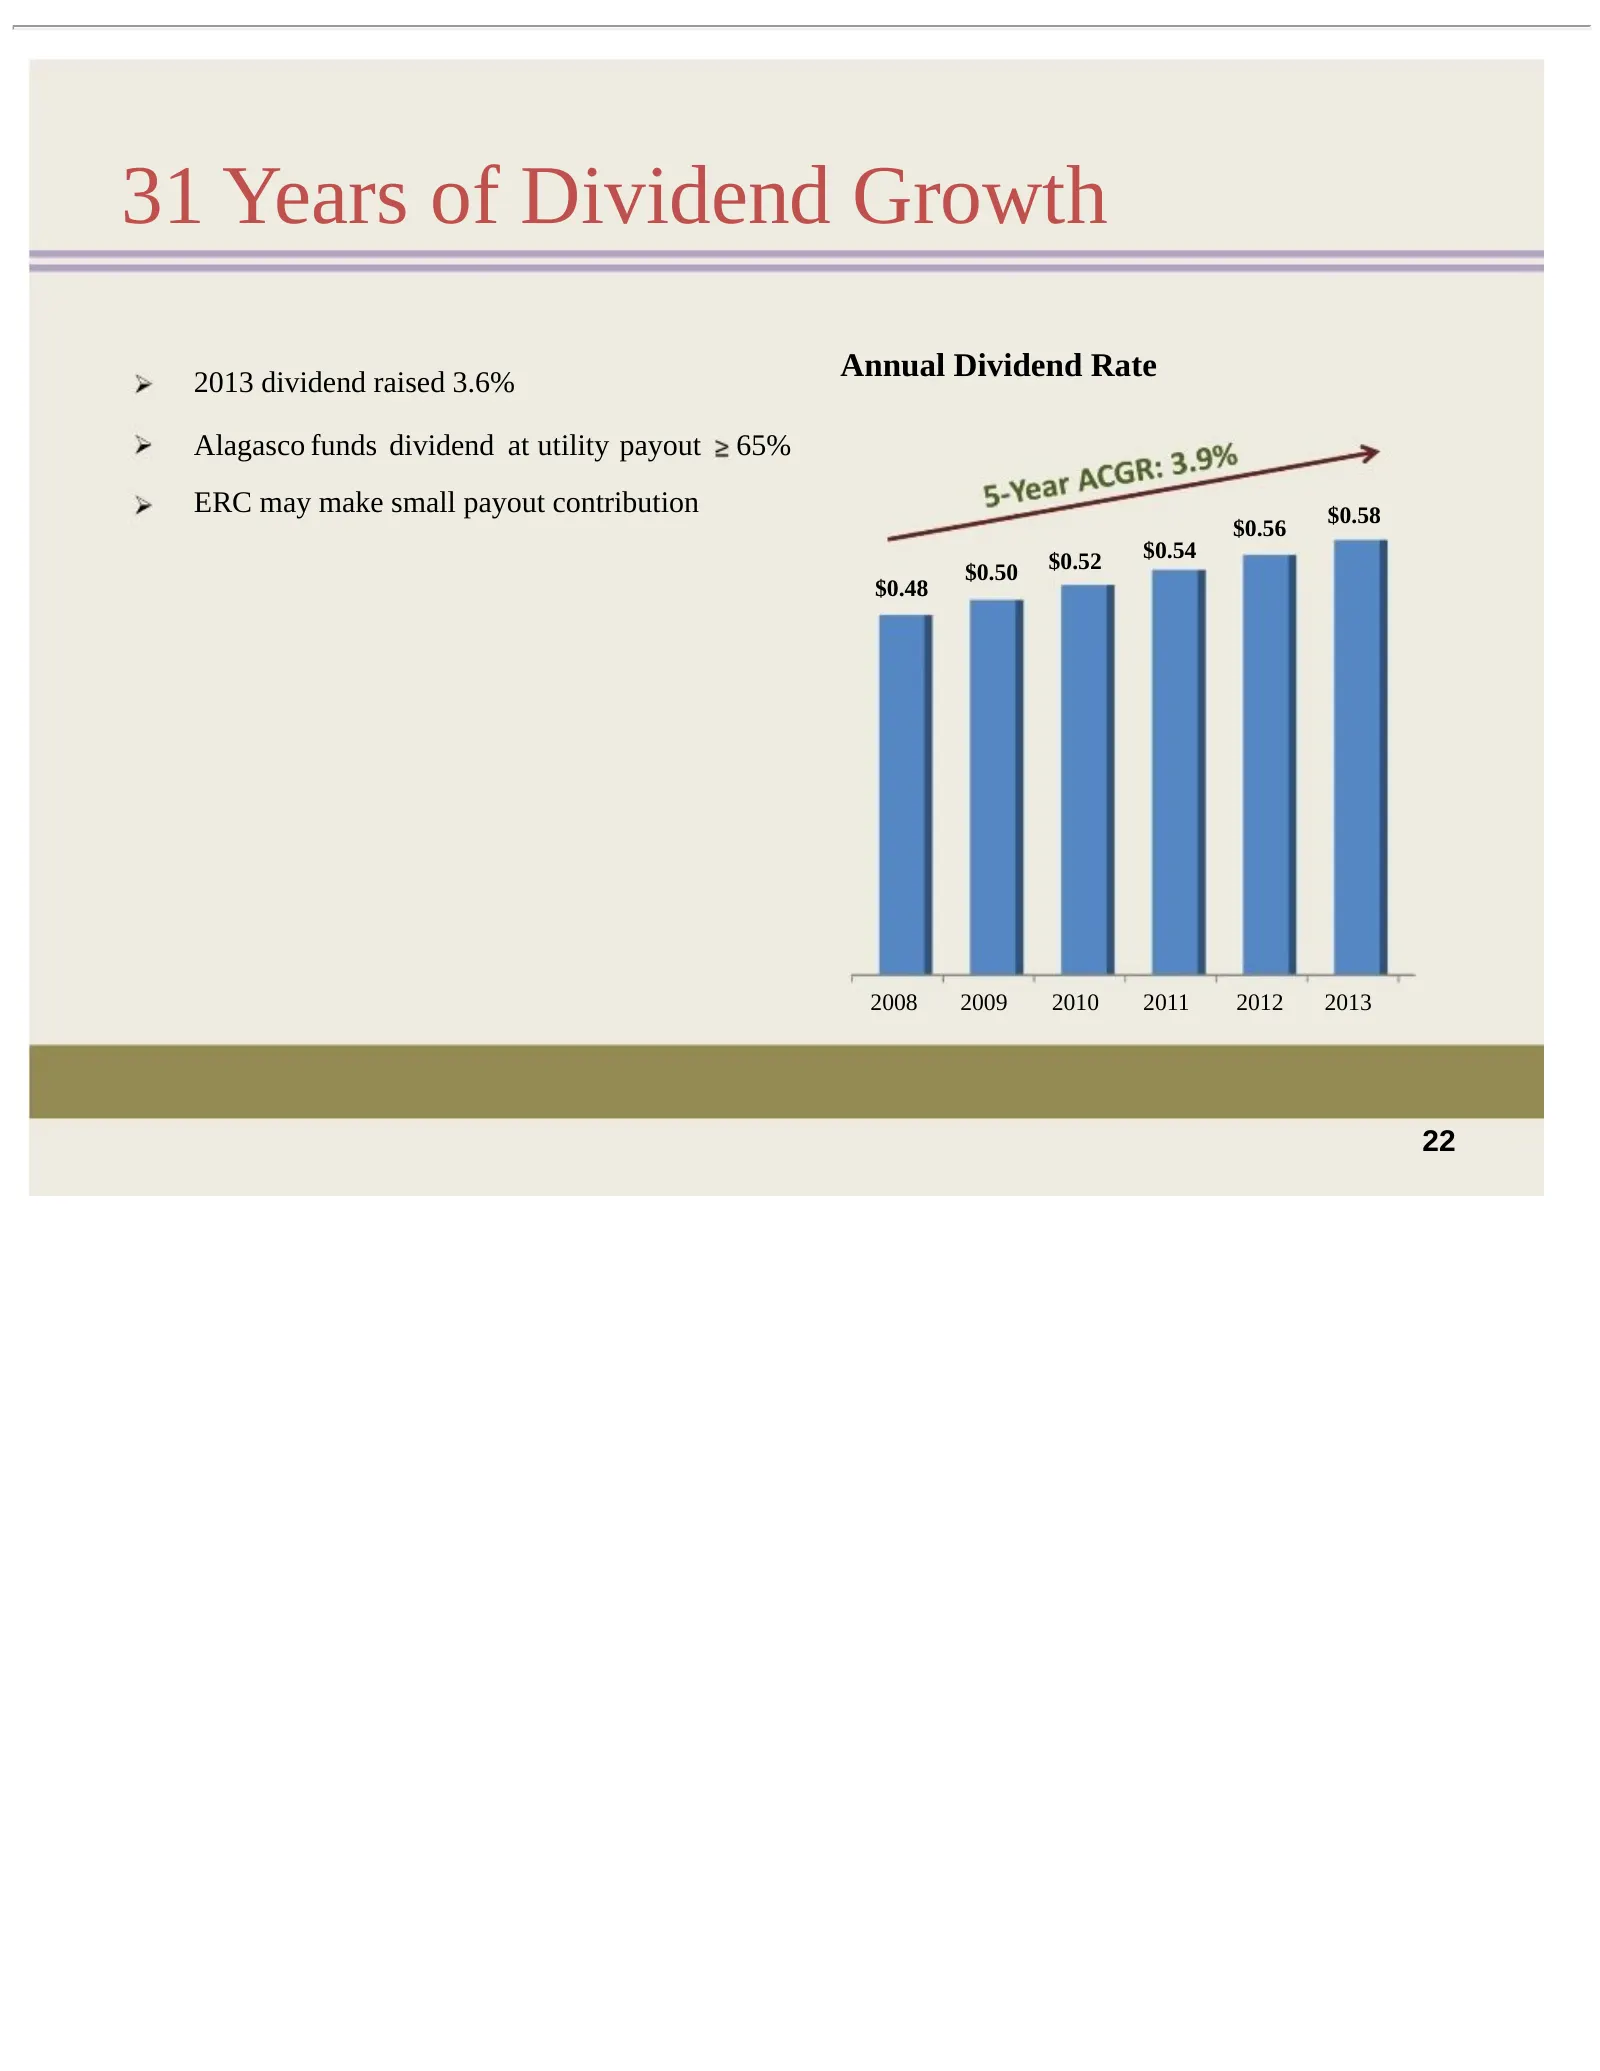
Slide 23: 31 Years of Dividend Growth
31 Years of Dividend Growth 2013 dividend raised 3.6% Annual Dividend Rate Alagasco funds dividend at utility payout 65% ERC may make small payout contribution $0.58 $0.56 $0.52 $0.54 $0.50 $0.48 2008 2009 2010 2011 2012 2013 22
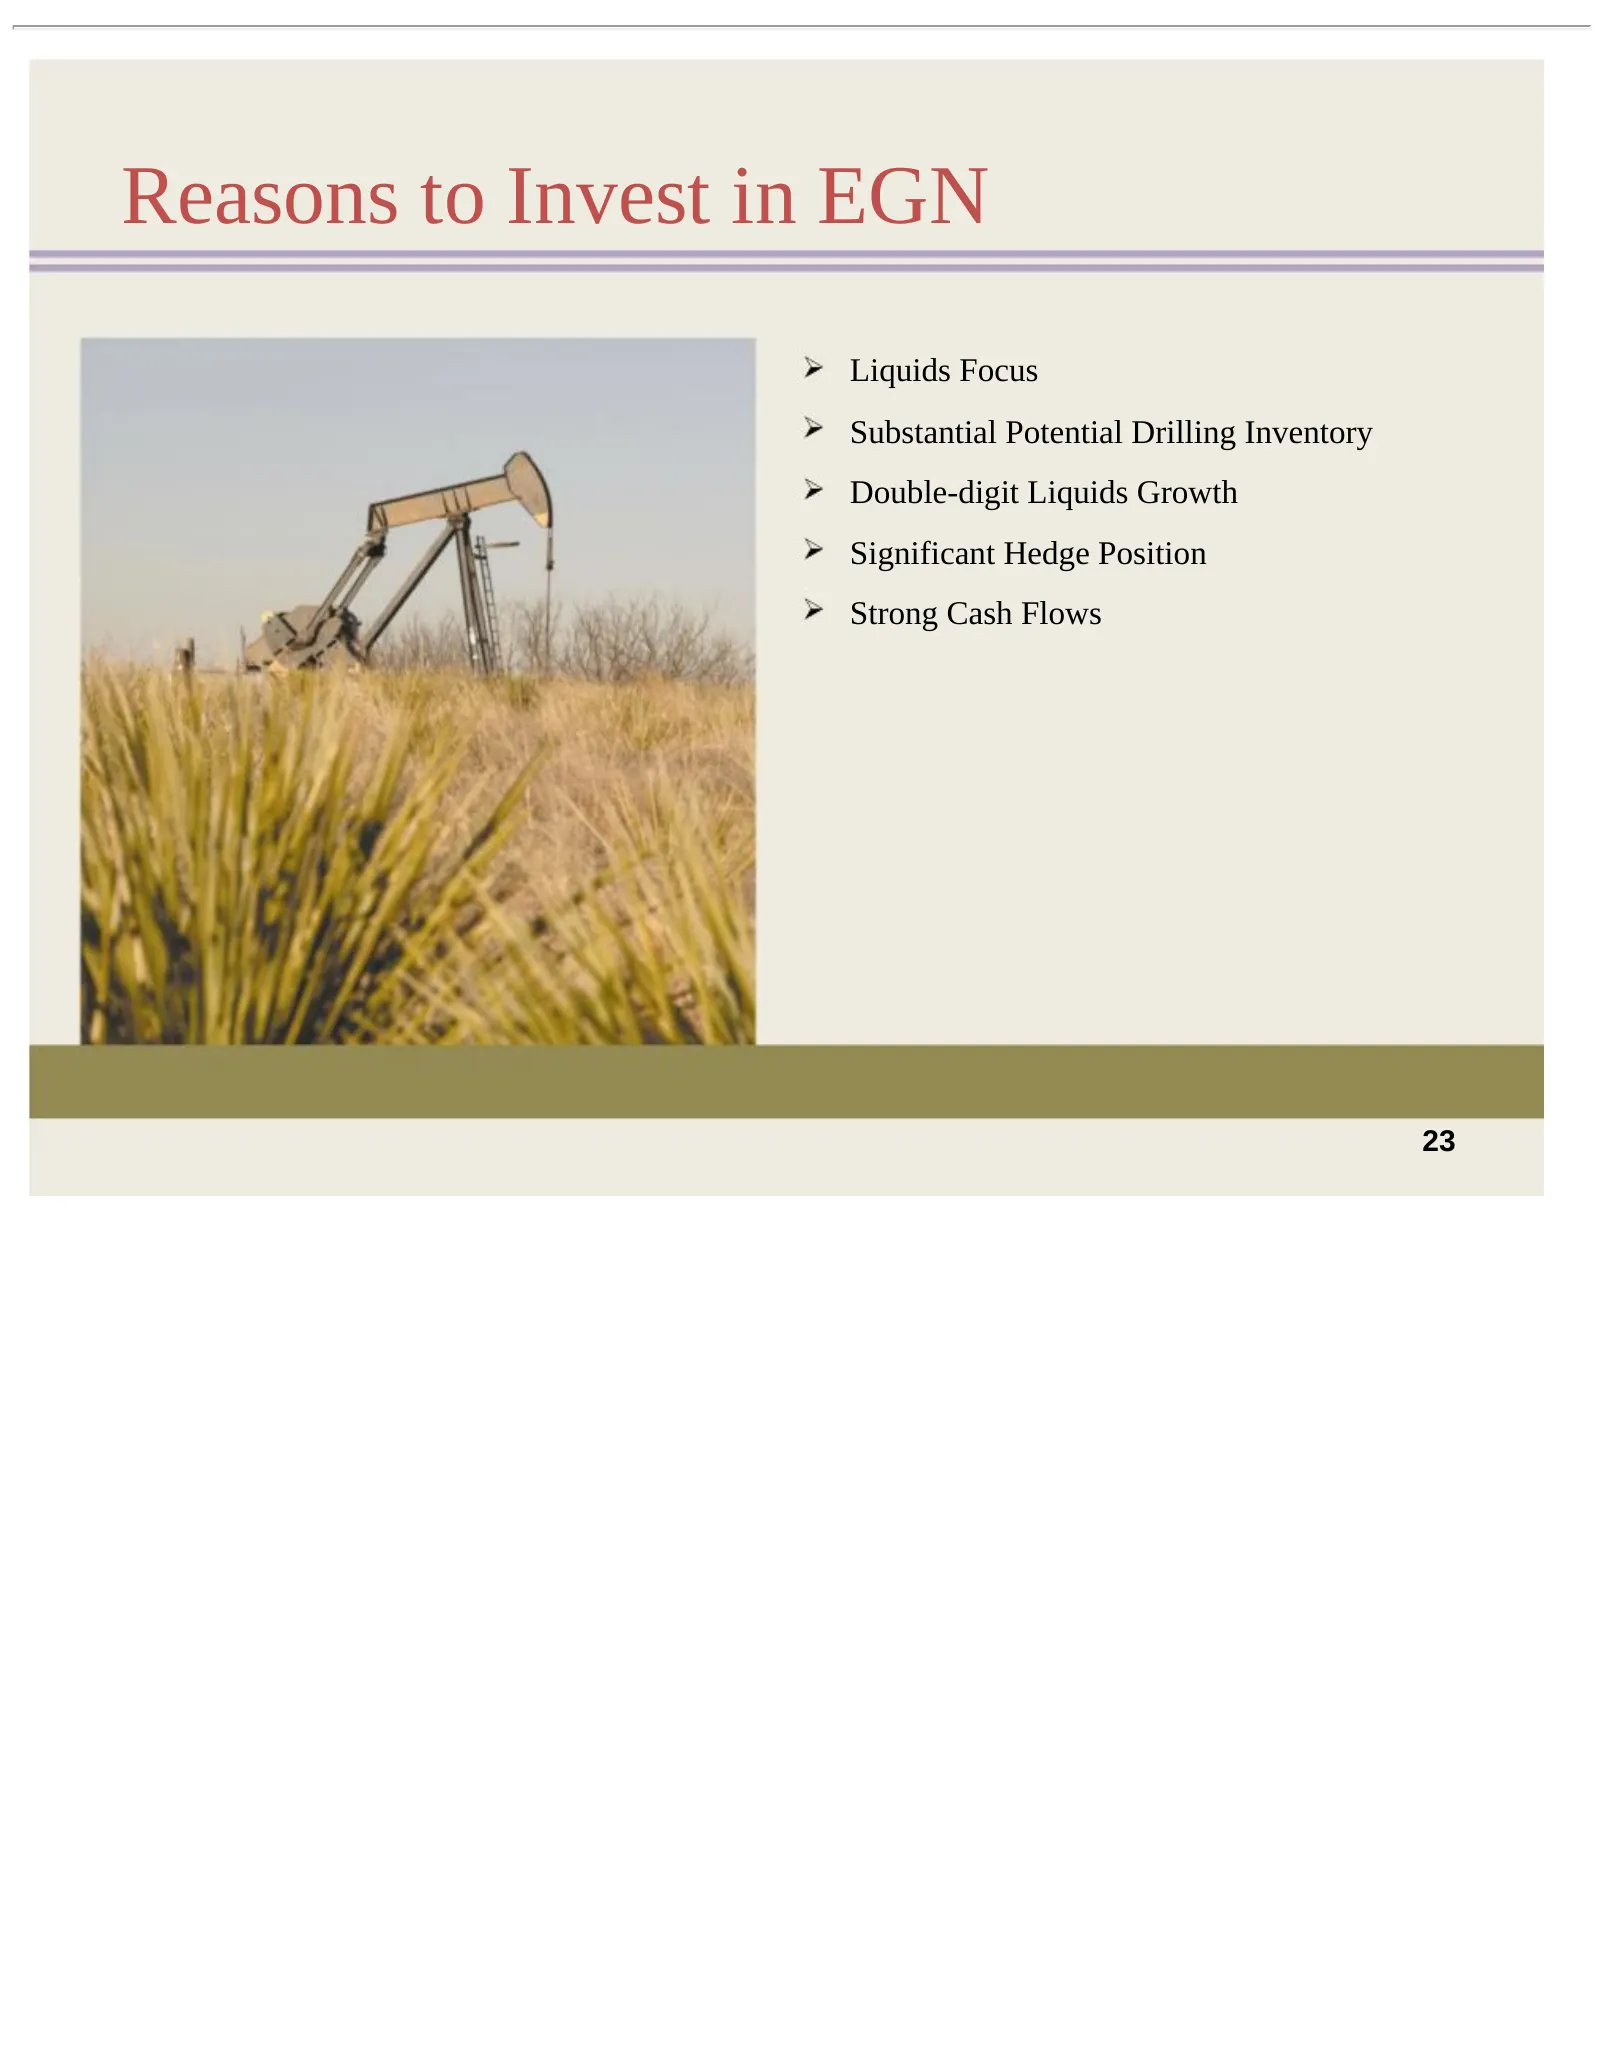
Slide 24: Reasons to Invest in EGN
Reasons to Invest in EGN Liquids Focus Substantial Potential Drilling Inventory Double-digit Liquids Growth Significant Hedge Position Strong Cash Flows 23
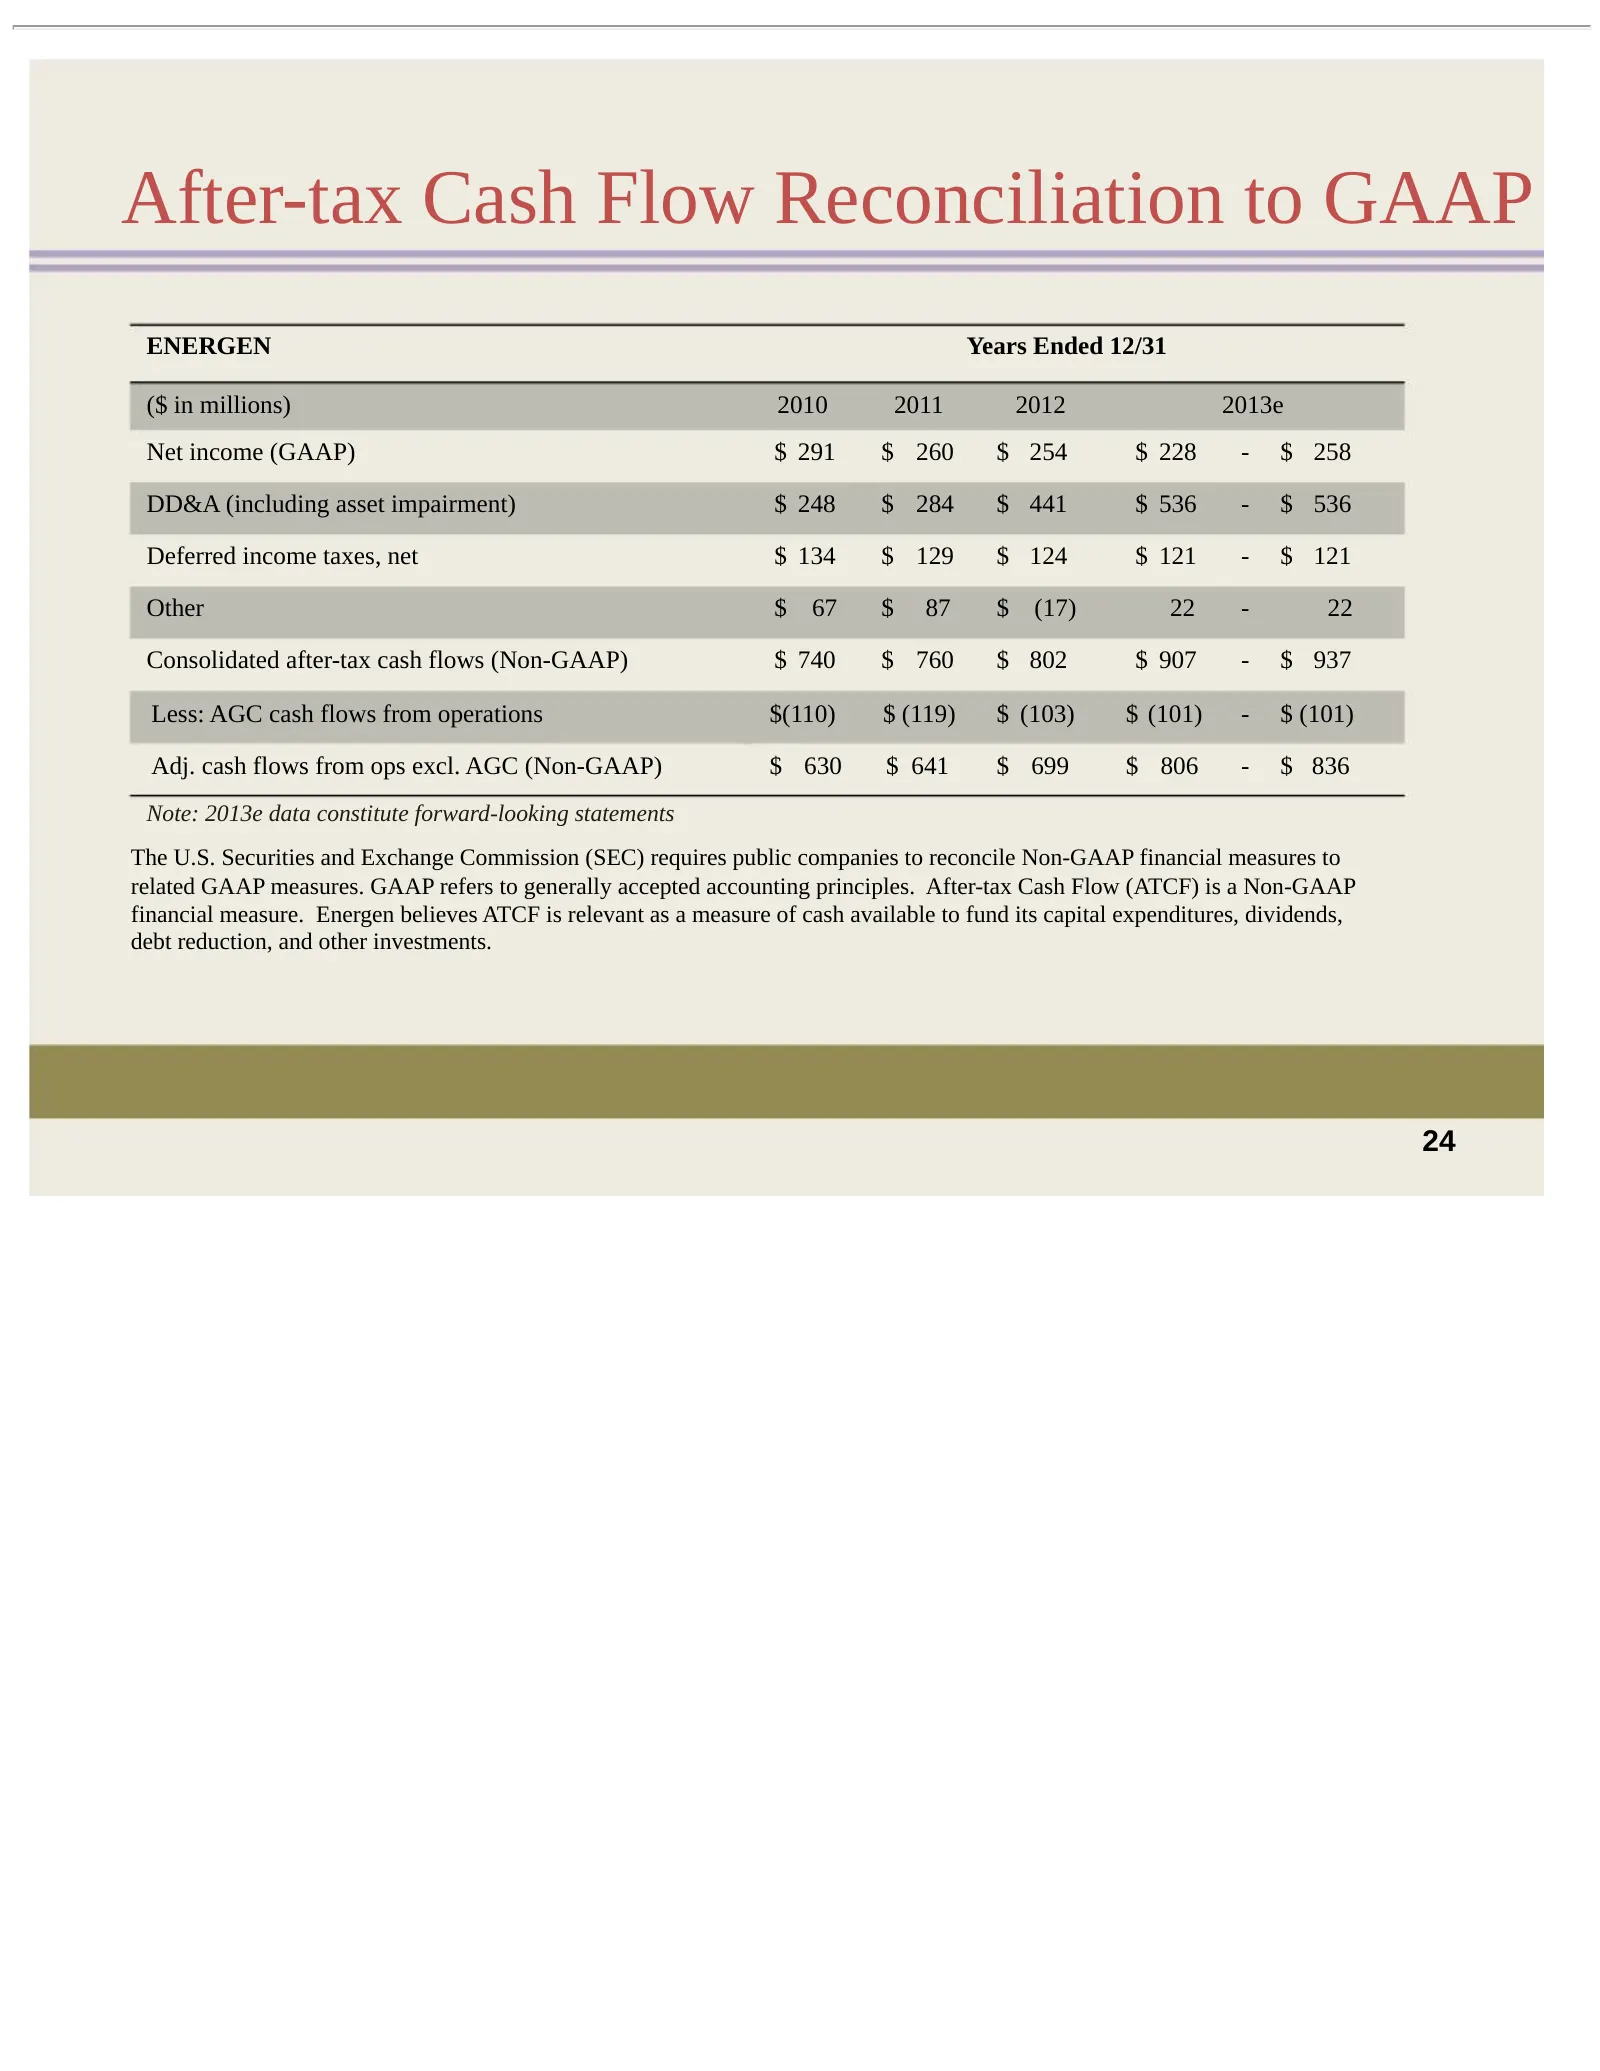
Slide 25: After-tax Cash Flow Reconciliation to GAAP
After-tax Cash Flow Reconciliation to GAAP ENERGEN Years Ended 12/31 ($ in millions) 2010 2011 2012 2013e Net income (GAAP) $ 291 $ 260 $ 254 $ 228 - $ 258 DD&A (including asset impairment) $ 248 $ 284 $ 441 $ 536 - $ 536 Deferred income taxes, net $ 134 $ 129 $ 124 $ 121 - $ 121 Other $ 67 $ 87 $ (
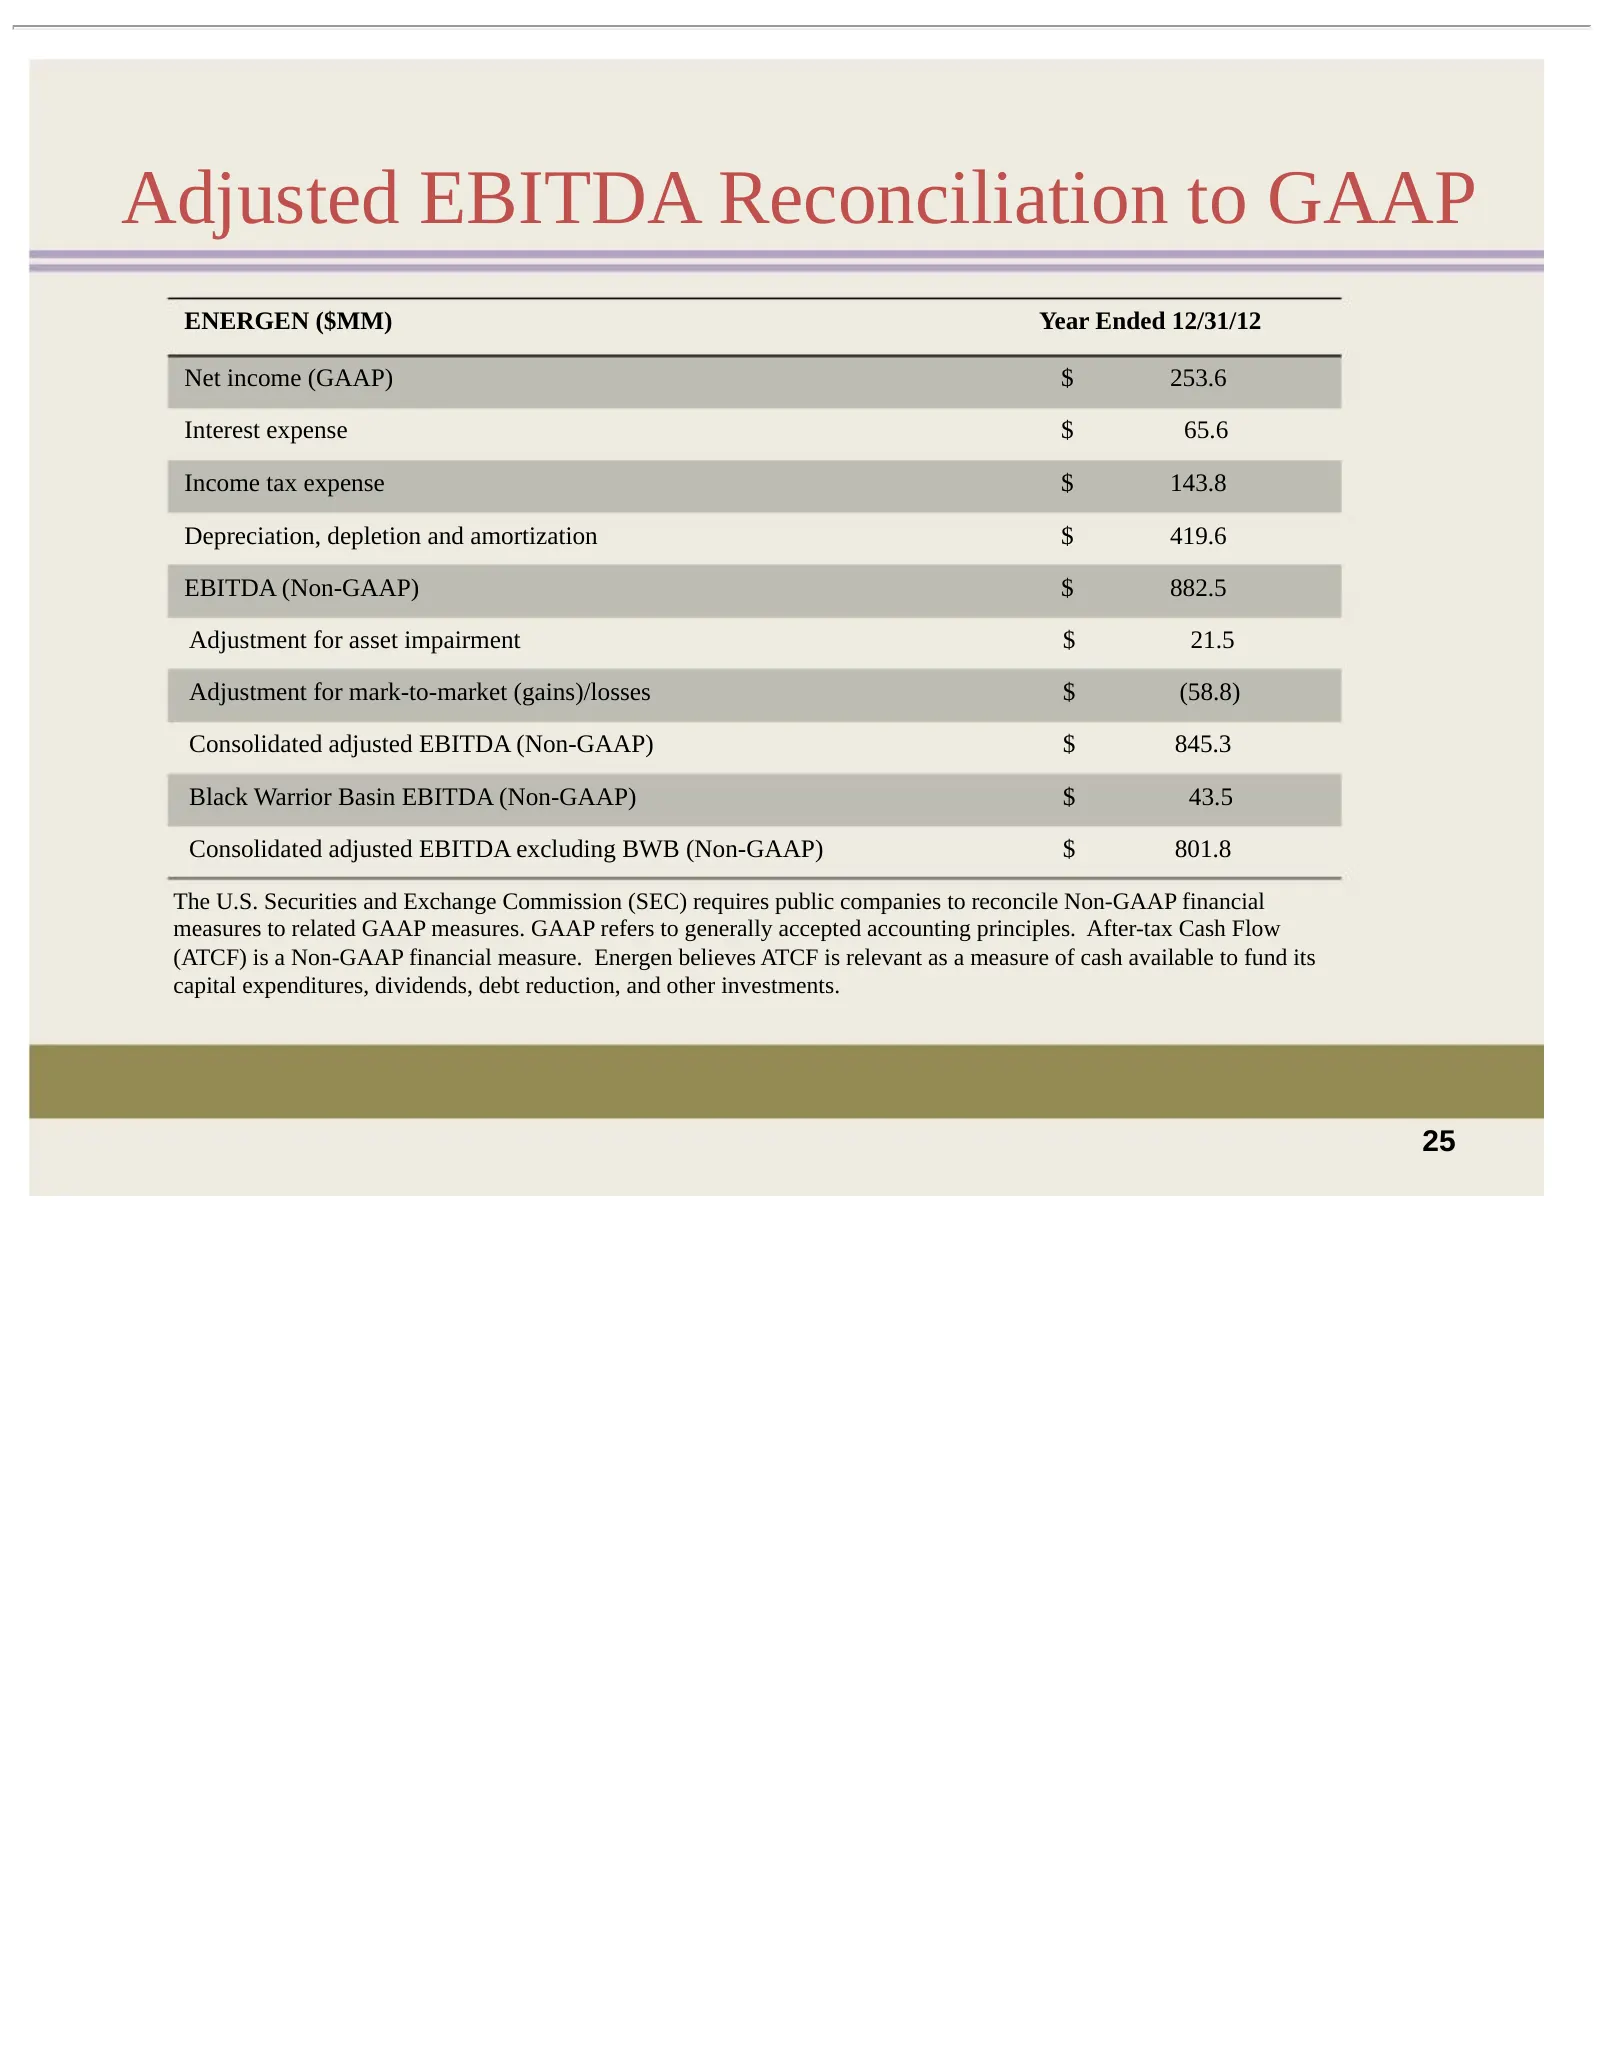
Slide 26: Adjusted EBITDA Reconciliation to GAAP
Adjusted EBITDA Reconciliation to GAAP ENERGEN ($MM) Year Ended 12/31/12 Net income (GAAP) $ 253.6 Interest expense $ 65.6 Income tax expense $ 143.8 Depreciation, depletion and amortization $ 419.6 EBITDA (Non-GAAP) $ 882.5 Adjustment for asset impairment $ 21.5 Adjustment for mark-to-market (gains
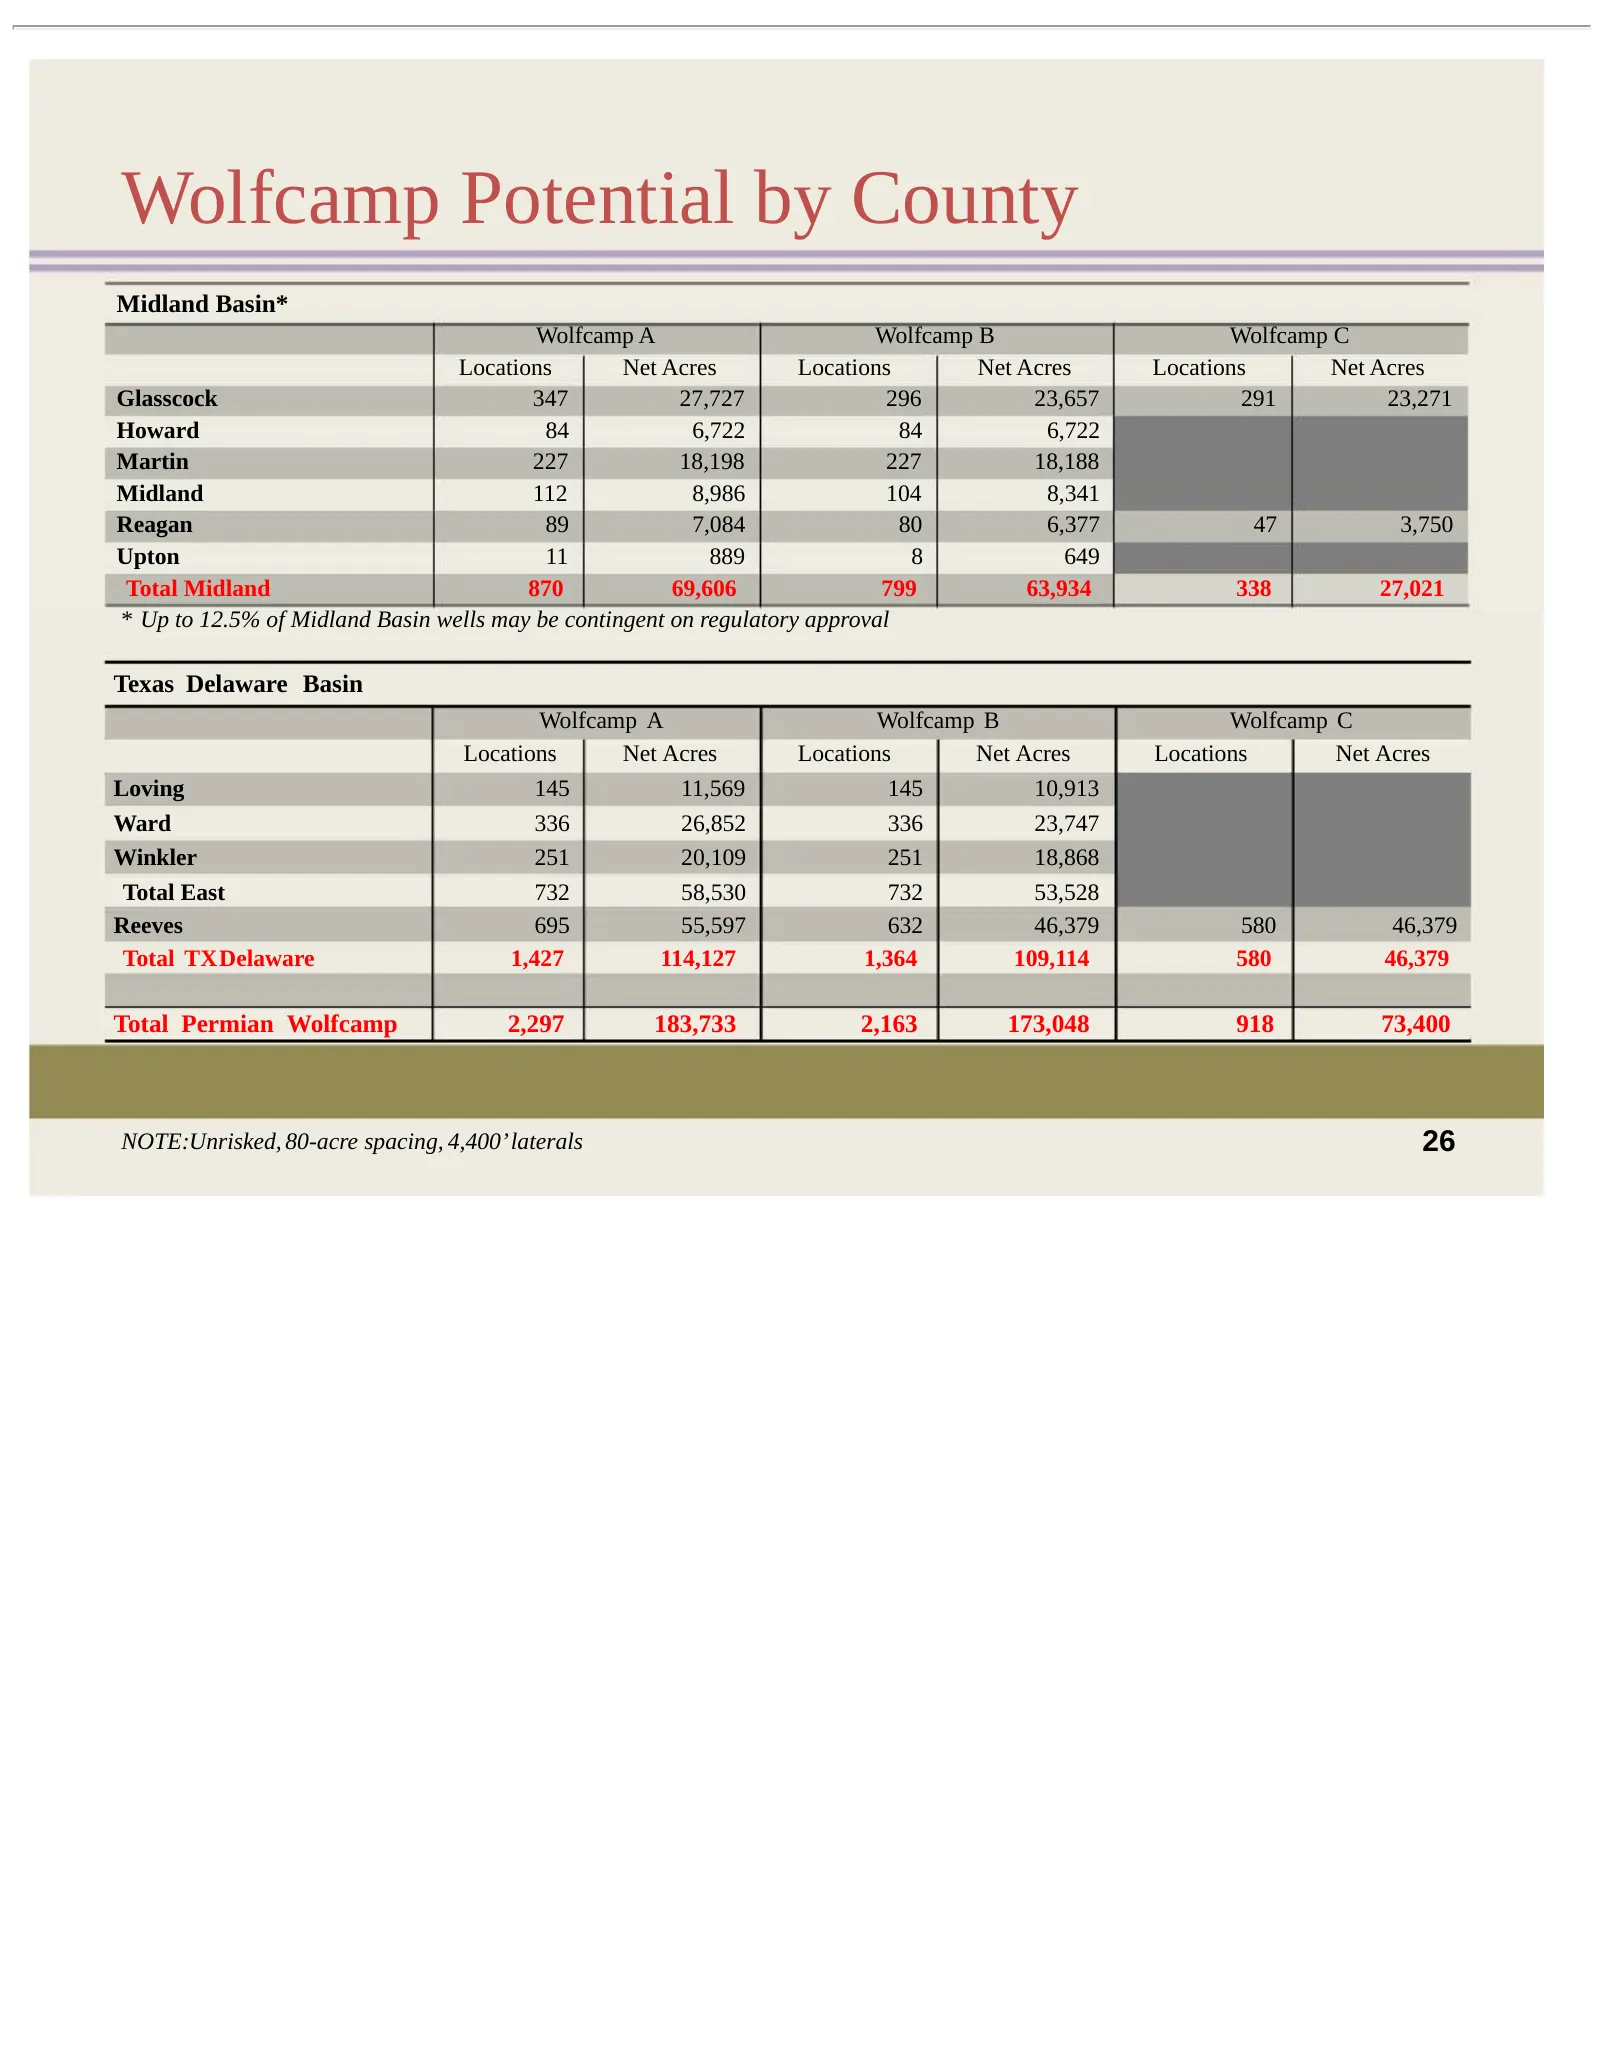
Slide 27: Wolfcamp Potential by County
Wolfcamp Potential by County Midland Basin* Wolfcamp A Wolfcamp B Wolfcamp C Locations Net Acres Locations Net Acres Locations Net Acres Glasscock 347 27,727 296 23,657 291 23,271 Howard 84 6,722 84 6,722 Martin 227 18,198 227 18,188 Midland 112 8,986 104 8,341 Reagan 89 7,084 80 6,377 47 3,750 Upto

Slide 28: For More Information
For More Information Julie S. Ryland Vice President – Investor Relations 205-326-8421 [email protected] www.energen.com 27
Source: SEC EDGAR · 8-K filed Sep 9, 2013