Duke Realty — Wells Fargo Real Estate Securities Conference 2020
51 slides from Duke Realty's conference presentation, Feb 25, 2020
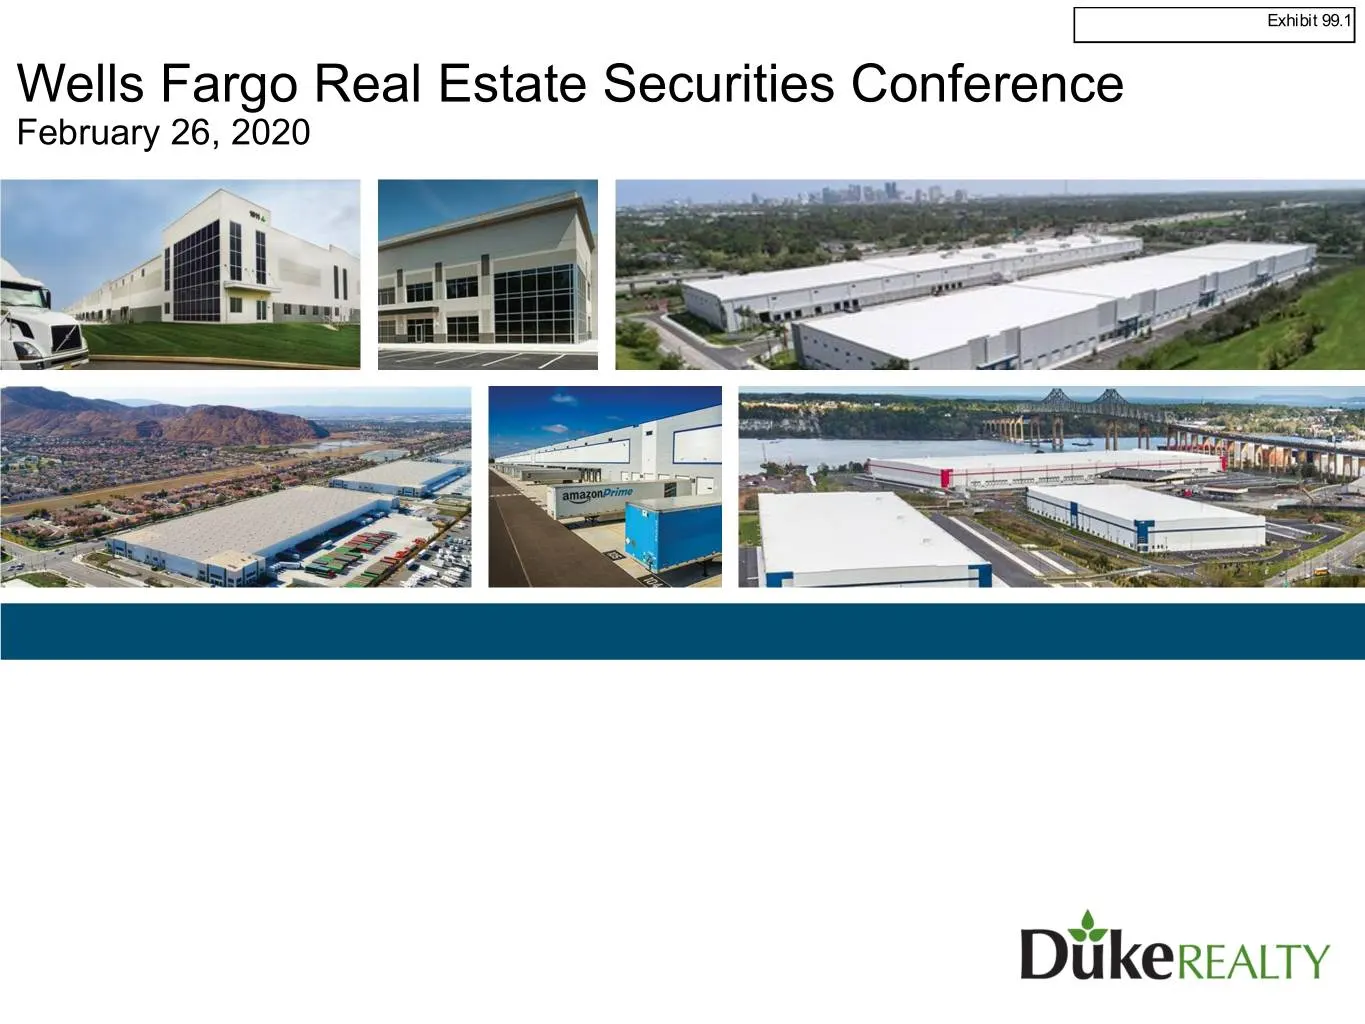
Slide 1: Wells Fargo Real Estate Securities Conference February 26, 2020
Wells Fargo Real Estate Securities Conference February 26, 2020
Slide 2: Forward-Looking Statement
Forward-Looking Statement This slide presentation contains statements that constitute “forward-looking statements” within the meaning of the Securities Act of 1933 and the Securities Exchange Act of 1934 as amended by the Private Securities Litigation Reform Act of 1995. These forward- looking state
Slide 3: Contents
Contents Who We Are | U.S. Logistics Strategy 4 Key Market Indicators / Drivers 6 Asset Strategy 10 Development Strategy 20 Operating Strategy 30 Capital Strategy, AFFO Growth 35 & Dividend Performance Corporate Responsibility 41 Why Duke Realty 45 3
Slide 4: The Leading Domestic-Only Logistics REIT
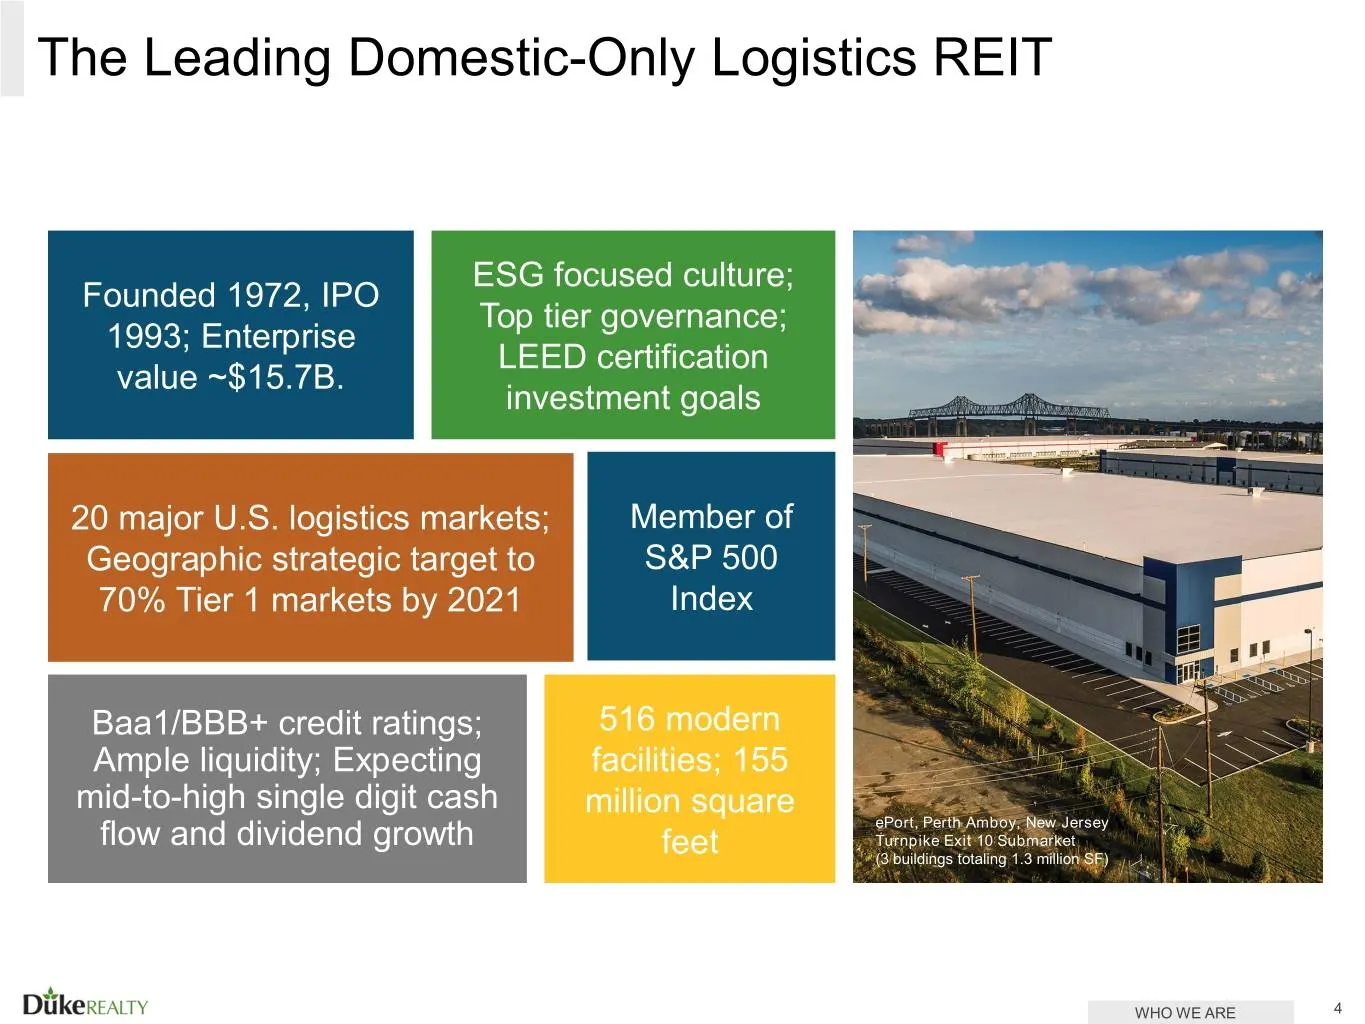
The Leading Domestic-Only Logistics REIT ESG focused culture; Founded 1972, IPO Top tier governance; 1993; Enterprise LEED certification value ~$15.7B. investment goals 20 major U.S. logistics markets; Member of Geographic strategic target to S&P 500 70% Tier 1 markets by 2021 Index Baa1/BBB+ credit
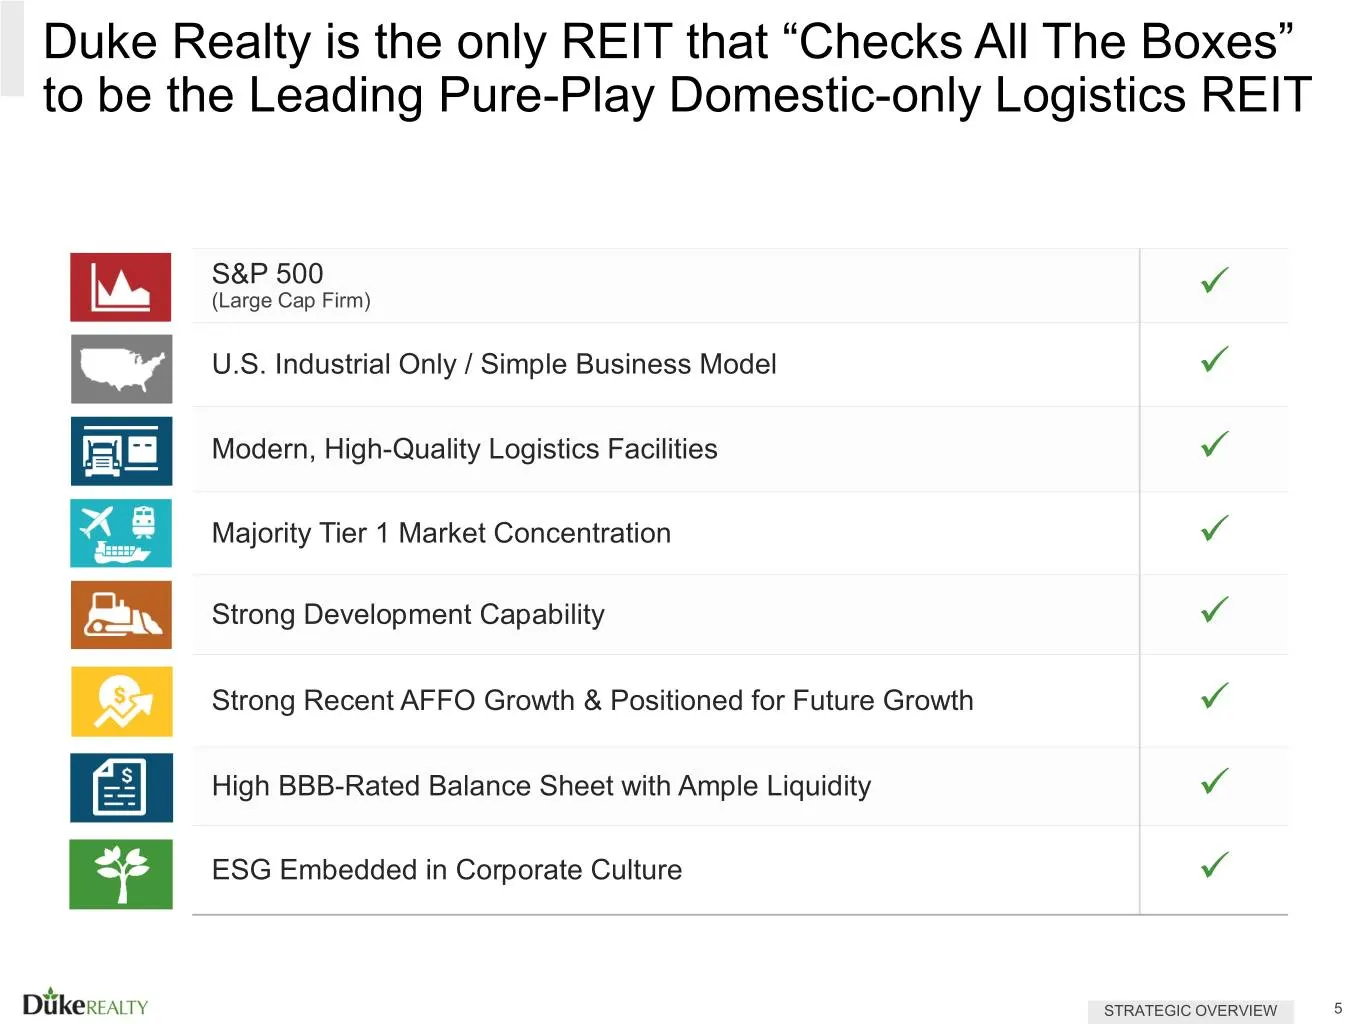
Slide 5: Duke Realty is the only REIT that Checks All The Boxes
Duke Realty is the only REIT that “Checks All The Boxes” to be the Leading Pure-Play Domestic-only Logistics REIT S&P 500 (Large Cap Firm) U.S. Industrial Only / Simple Business Model Modern, High-Quality Logistics Facilities Majority Tier 1 Market Concentration Strong Development Capability
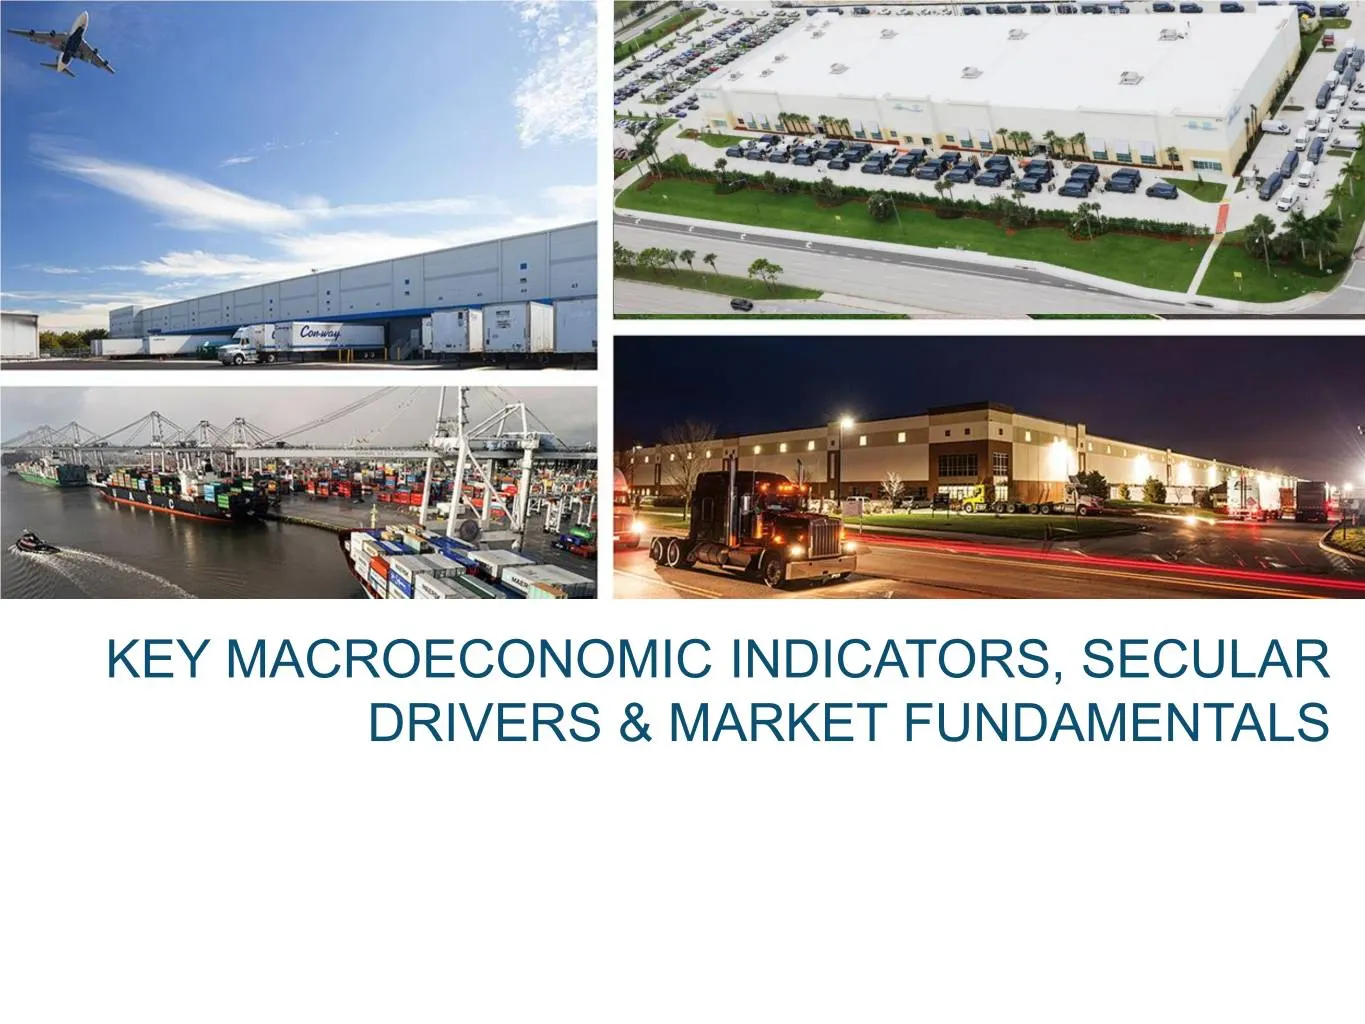
Slide 6: Key Macroeconomic Indicators, Secular Drivers & Market Fundamentals
KEY MACROECONOMIC INDICATORS, SECULAR DRIVERS & MARKET FUNDAMENTALS
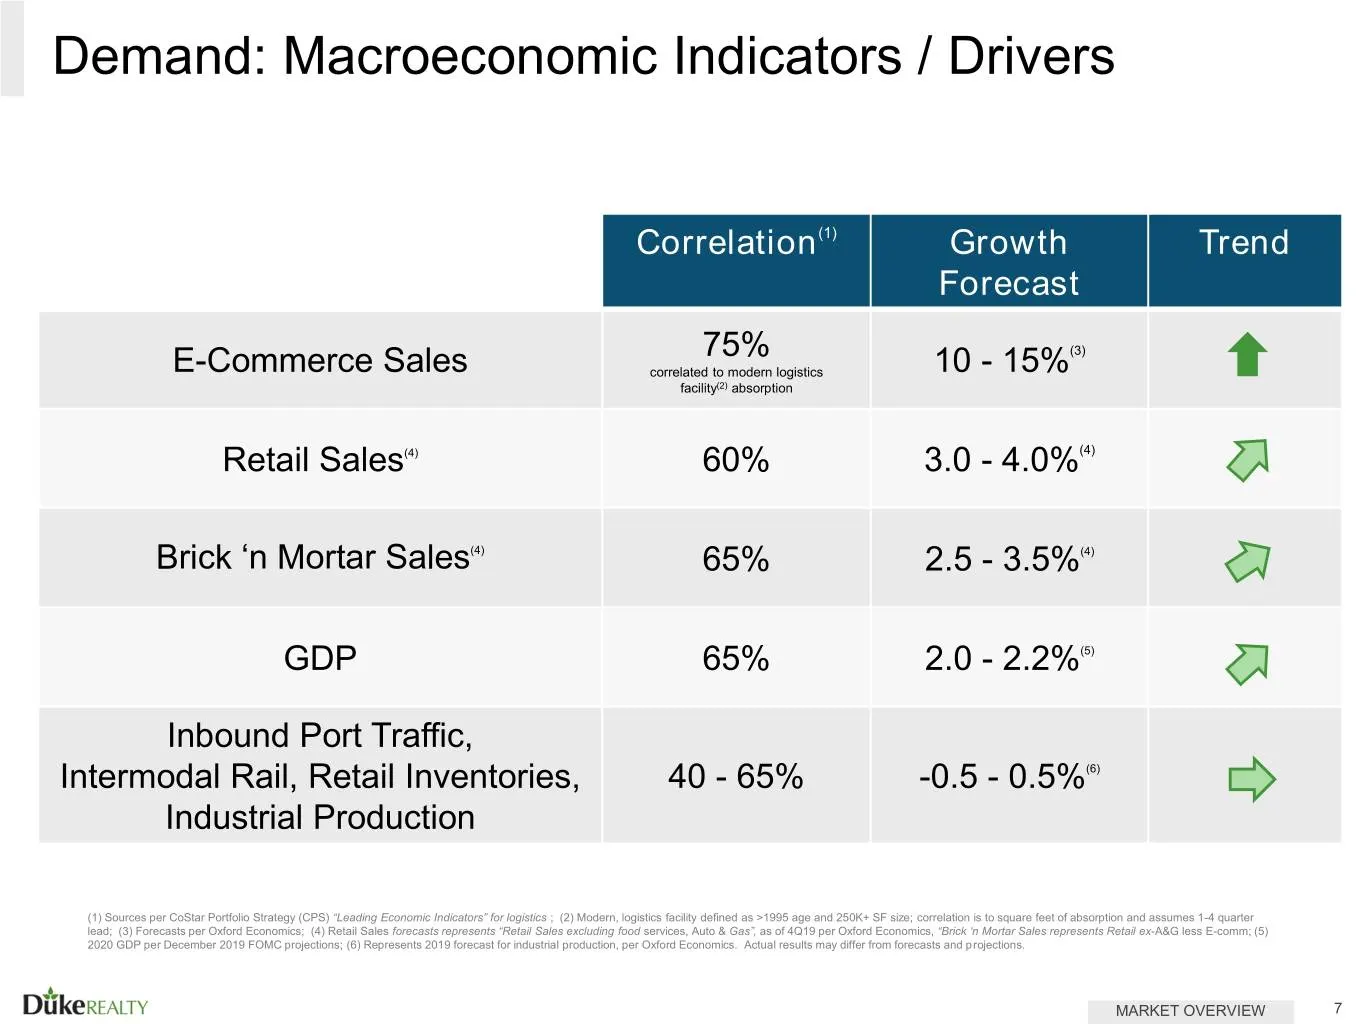
Slide 7: Demand: Macroeconomic Indicators / Drivers
Demand: Macroeconomic Indicators / Drivers Correlation(1) Growth Trend Forecast 75% (3) E-Commerce Sales correlated to modern logistics 10 - 15% facility(2) absorption Retail Sales(4) 60% 3.0 - 4.0%(4) Brick ‘n Mortar Sales(4) 65% 2.5 - 3.5%(4) GDP 65% 2.0 - 2.2%(5) Inbound Port Traffic, Intermodal
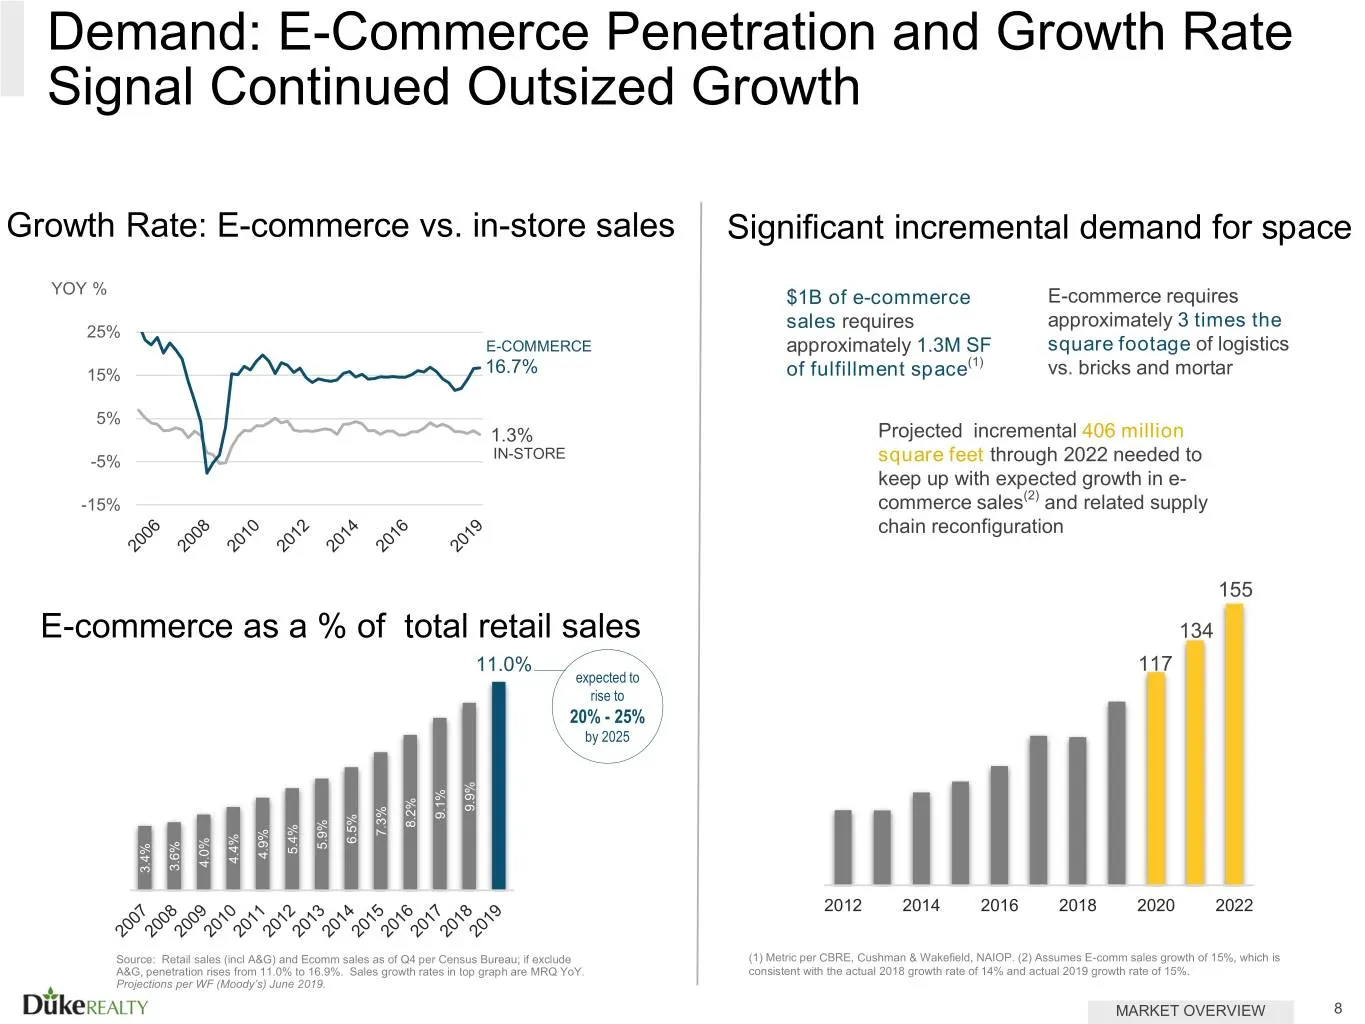
Slide 8: Demand: E-Commerce Penetration and Growth Rate
Demand: E-Commerce Penetration and Growth Rate Signal Continued Outsized Growth Growth Rate: E-commerce vs. in-store sales Significant incremental demand for space YOY % $1B of e-commerce E-commerce requires sales requires approximately 3 times the 25% E-COMMERCE approximately 1.3M SF square footage
Slide 9: Evolution of Amazon Distribution Network Growth
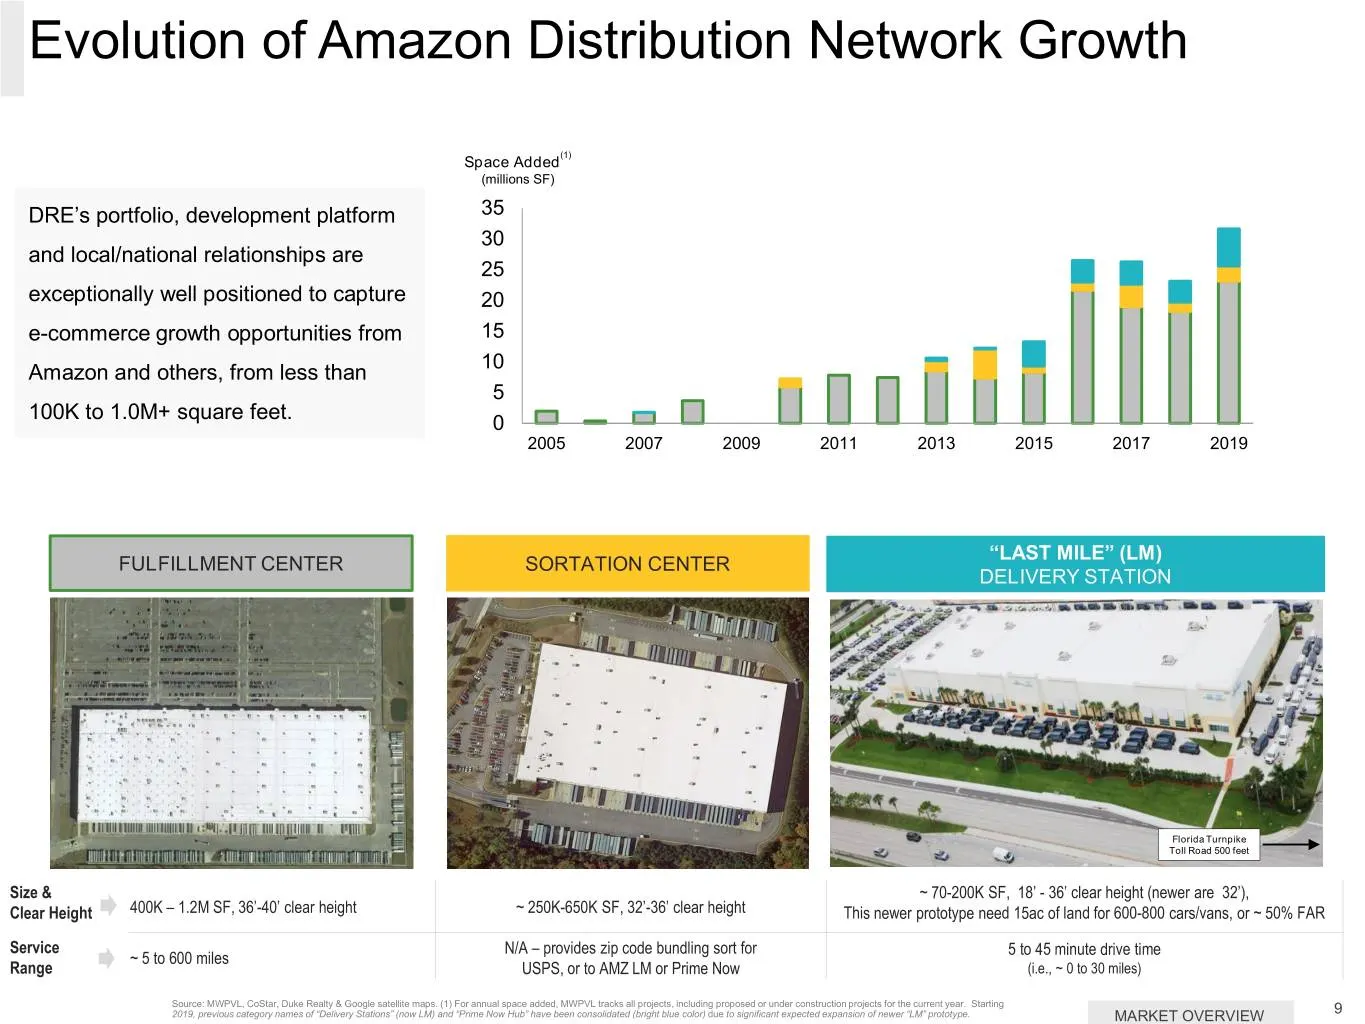
Evolution of Amazon Distribution Network Growth Space Added(1) (millions SF) DRE’s portfolio, development platform 35 30 and local/national relationships are 25 exceptionally well positioned to capture 20 e-commerce growth opportunities from 15 10 Amazon and others, from less than 5 100K to 1.0M+ sq
Slide 10: Logistics Asset Strategy
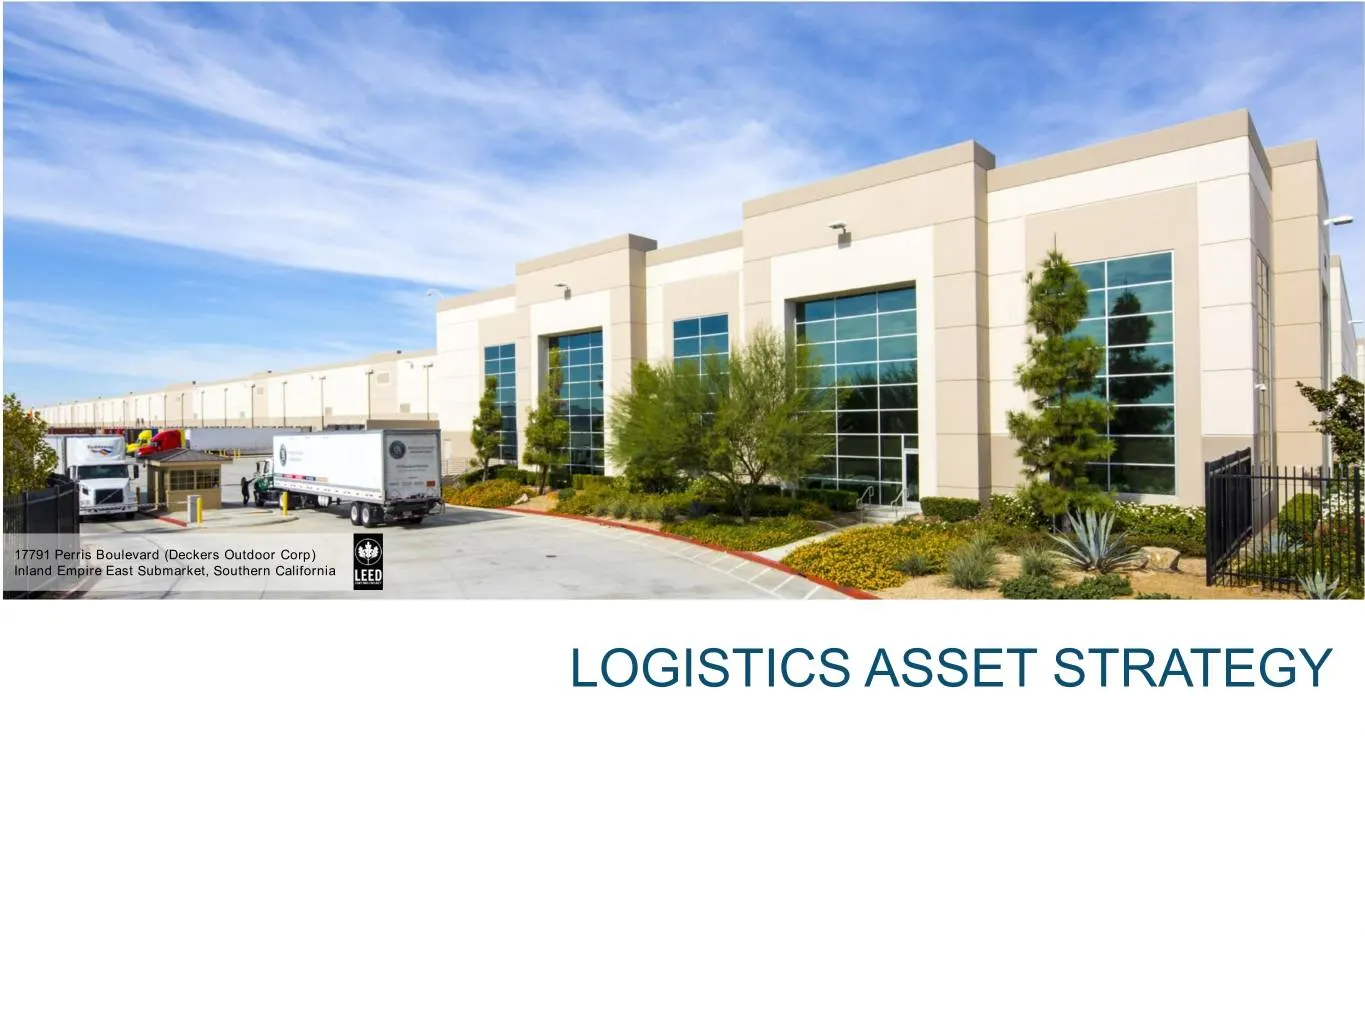
17791 Perris Boulevard (Deckers Outdoor Corp) Inland Empire East Submarket, Southern California LOGISTICS ASSET STRATEGY
Slide 11: Asset Strategy Drives Long Term Value
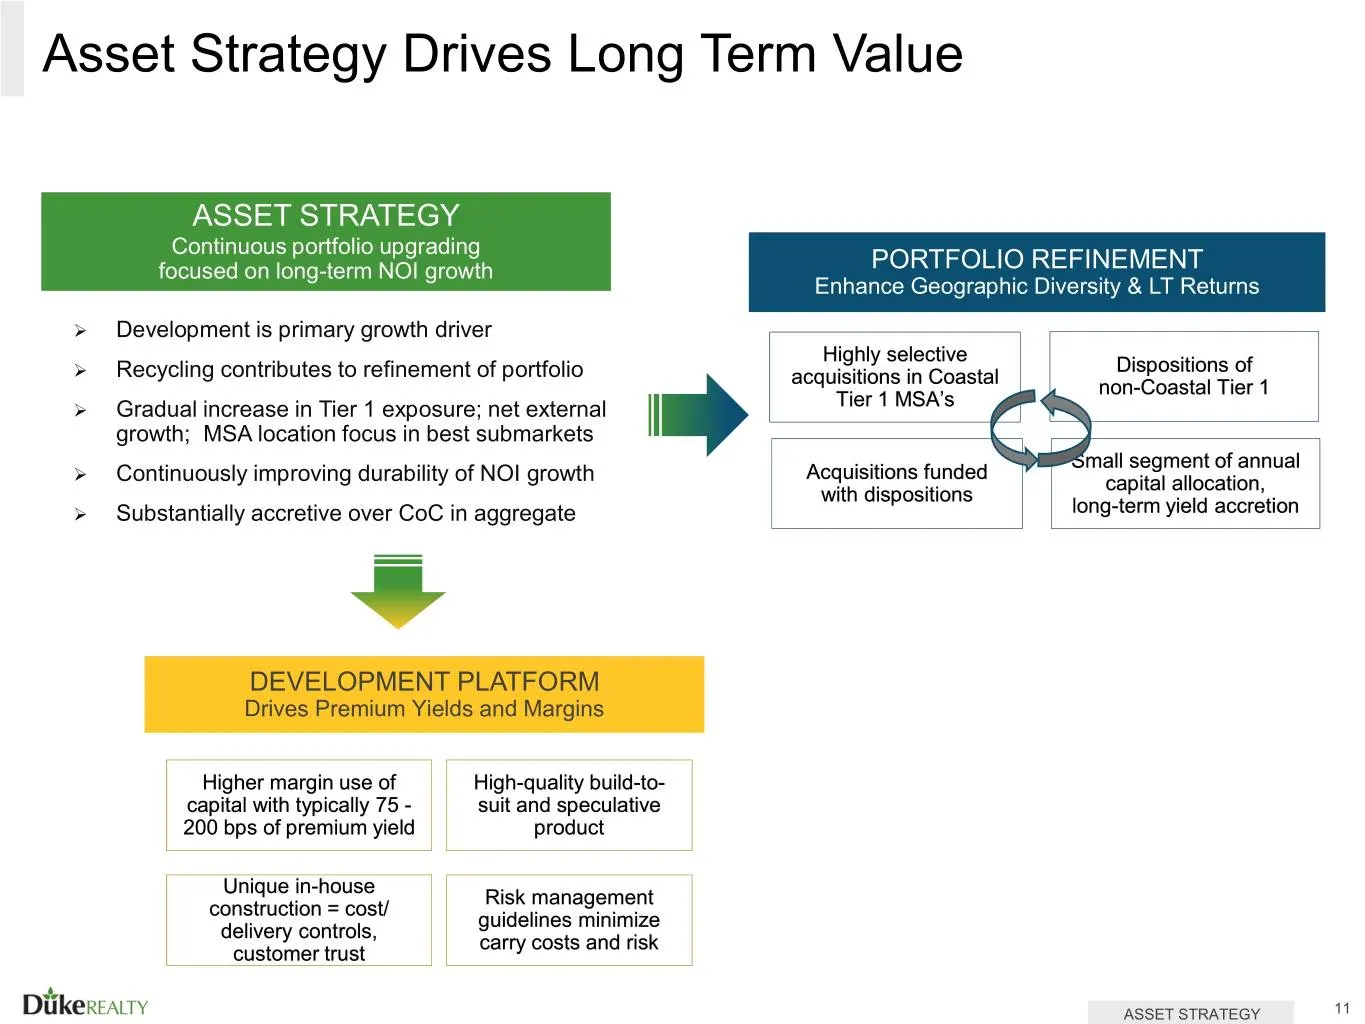
Asset Strategy Drives Long Term Value ASSET STRATEGY Continuous portfolio upgrading focused on long-term NOI growth PORTFOLIO REFINEMENT Enhance Geographic Diversity & LT Returns Development is primary growth driver Highly selective Dispositions of Recycling contributes to refinement of portfoli
Slide 12: National Platform with Growing Diversification into Tier Markets
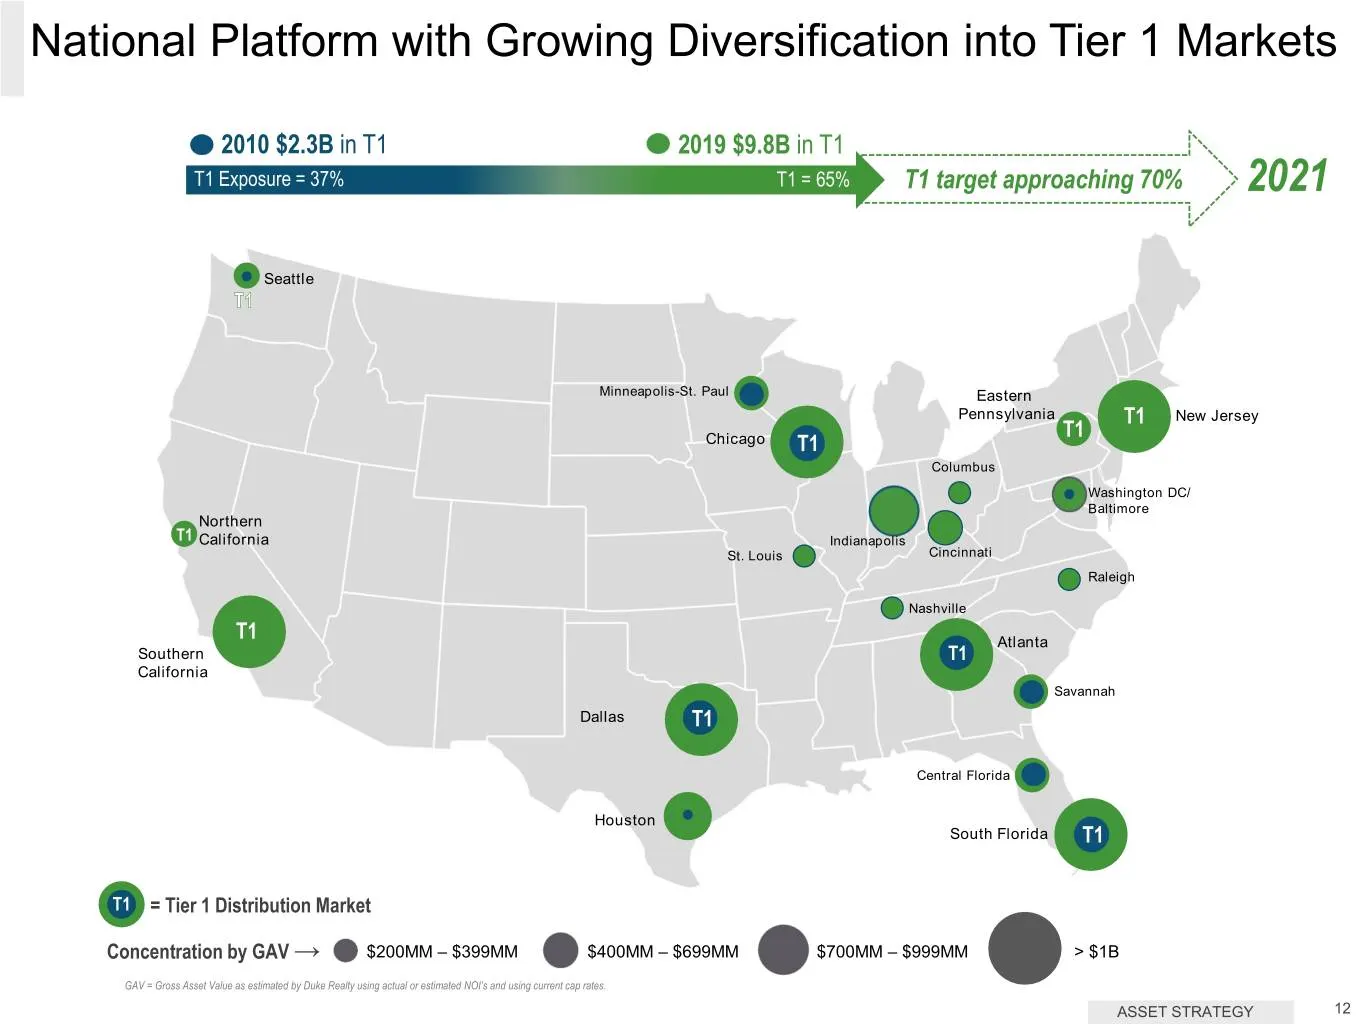
National Platform with Growing Diversification into Tier 1 Markets 2010 $2.3B in T1 2019 $9.8B in T1 T1 Exposure = 37% T1 = 65% T1 target approaching 70% 2021 Seattle Minneapolis-St. Paul Eastern Pennsylvania T1 New Jersey T1 Chicago T1 Columbus Washington DC/ Baltimore Northern T1 California Indian
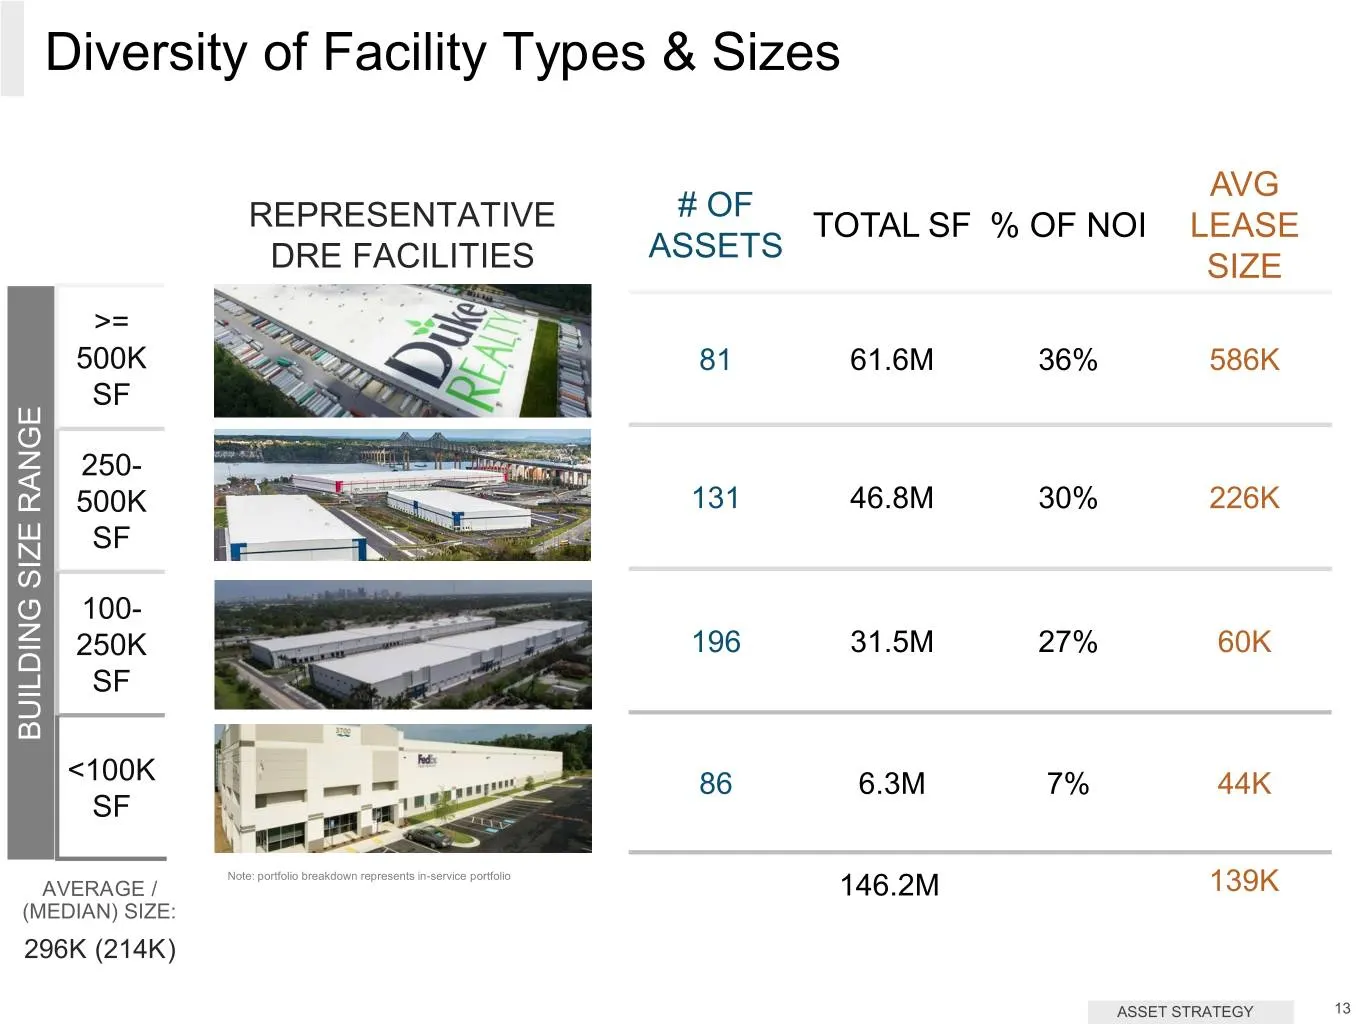
Slide 13: Diversity of Facility Types & Sizes
Diversity of Facility Types & Sizes AVG # OF REPRESENTATIVE TOTAL SF % OF NOI LEASE ASSETS DRE FACILITIES SIZE >= 500K 81 61.6M 36% 586K SF 250- 500K 131 46.8M 30% 226K SF 100- 250K 196 31.5M 27% 60K SF BUILDING BUILDING RANGE SIZE <100K 86 6.3M 7% 44K SF Note: portfolio breakdown represents in-serv
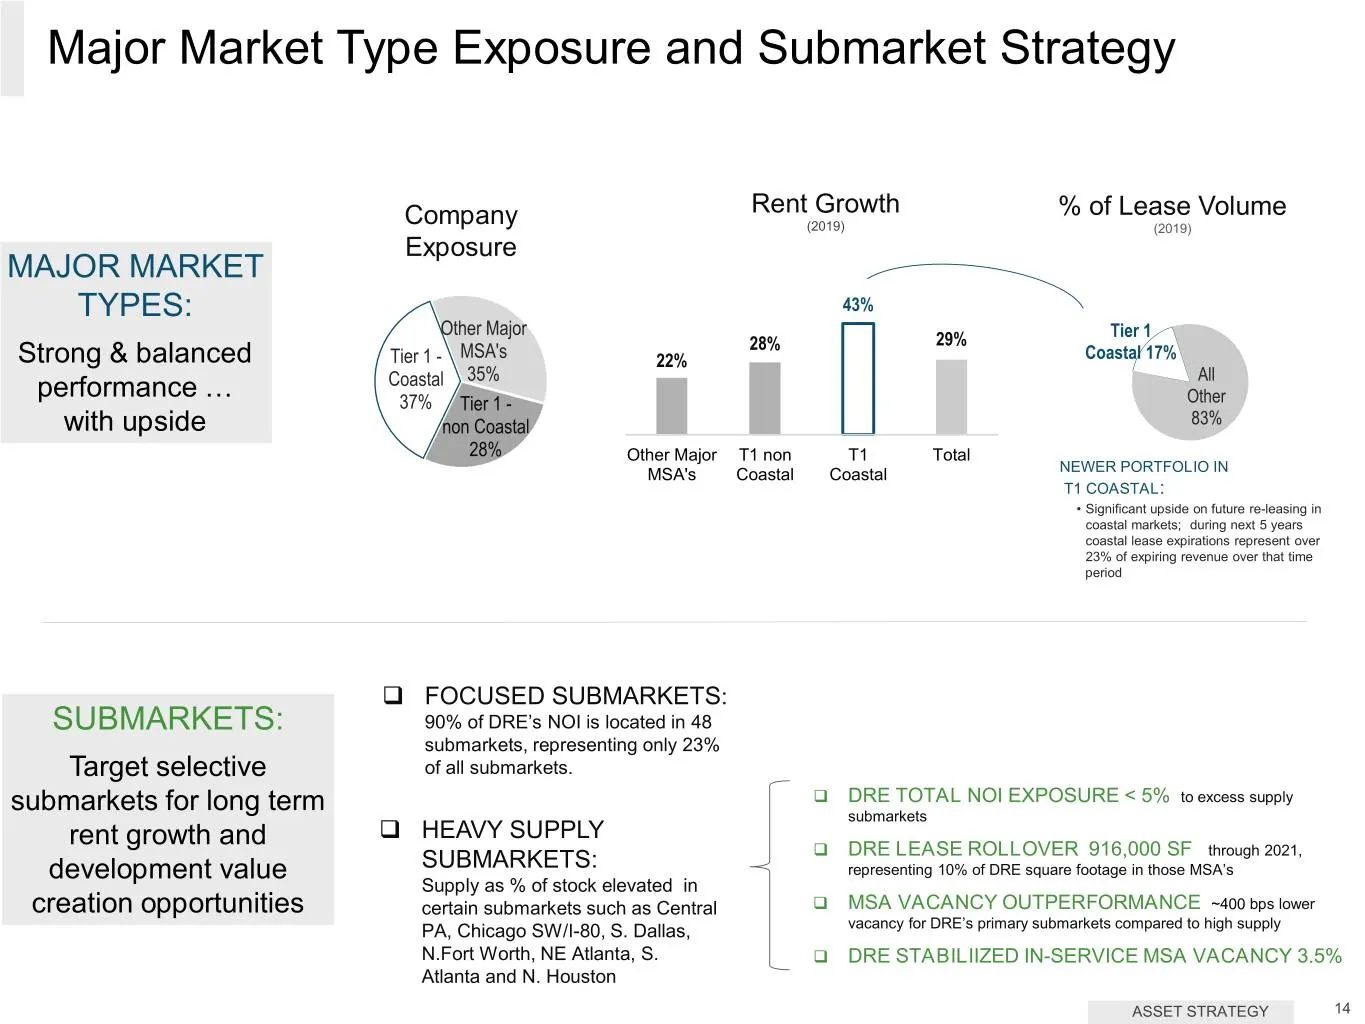
Slide 14: Major Market Type Exposure and Submarket Strategy
Major Market Type Exposure and Submarket Strategy Rent Growth % of Lease Volume Company (2019) (2019) Exposure MAJOR MARKET TYPES: 43% Other Major Tier 1 28% 29% Strong & balanced Tier 1 - MSA's 22% Coastal 17% performance … Coastal 35% All 37% Tier 1 - Other with upside non Coastal 83% 28% Other Ma
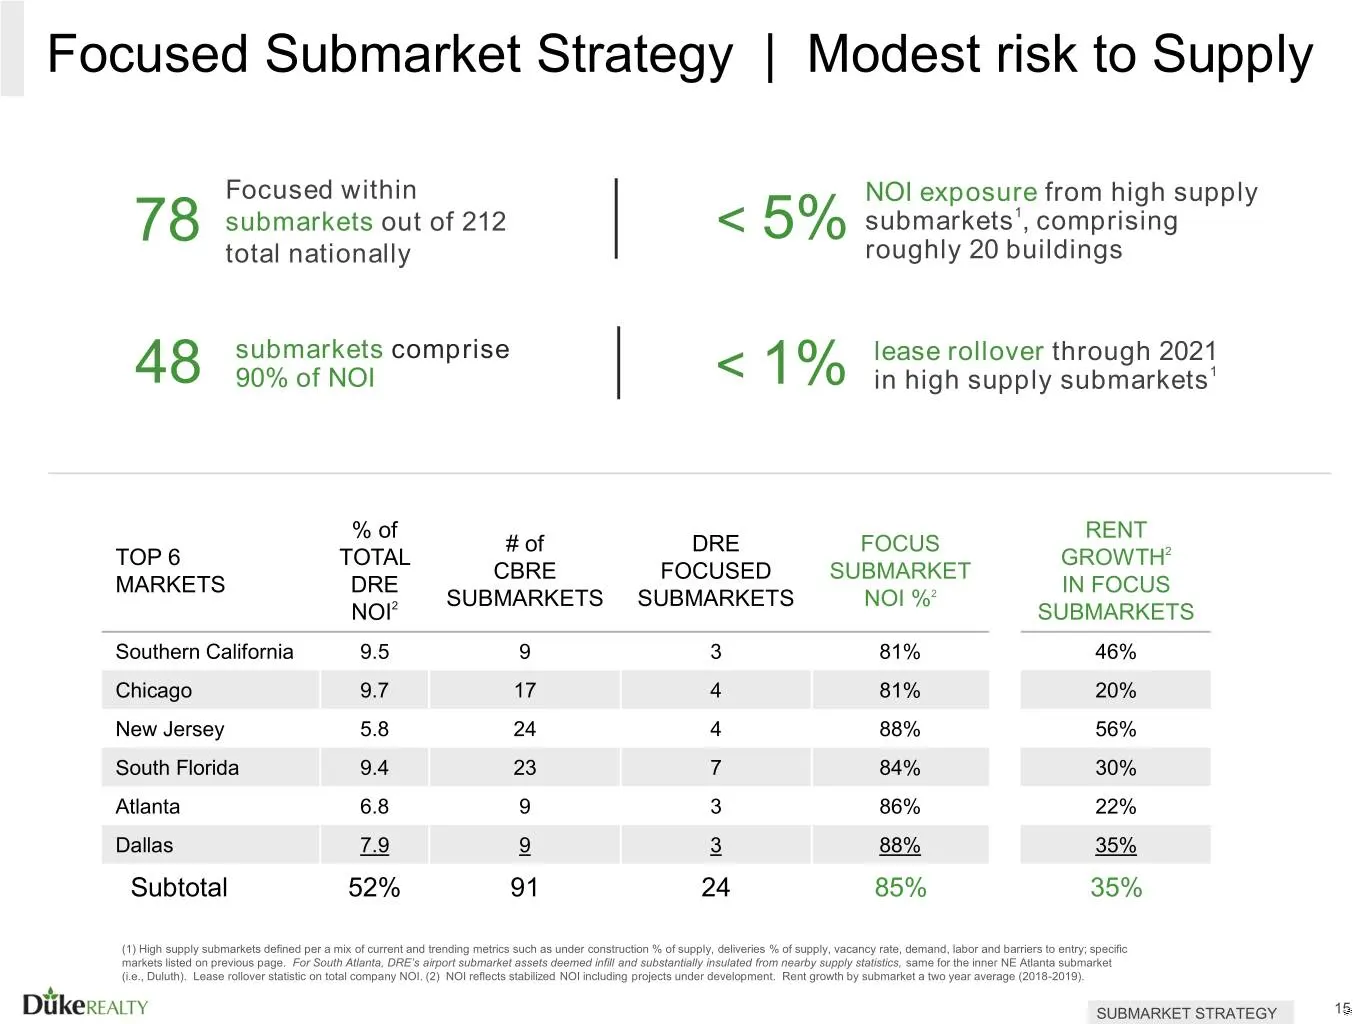
Slide 15: Focused Submarket Strategy
Focused Submarket Strategy | Modest risk to Supply Focused within NOI exposure from high supply 78 submarkets out of 212 < 5% submarkets1, comprising total nationally roughly 20 buildings submarkets comprise lease rollover through 2021 48 90% of NOI < 1% in high supply submarkets1 % of RENT # of DRE
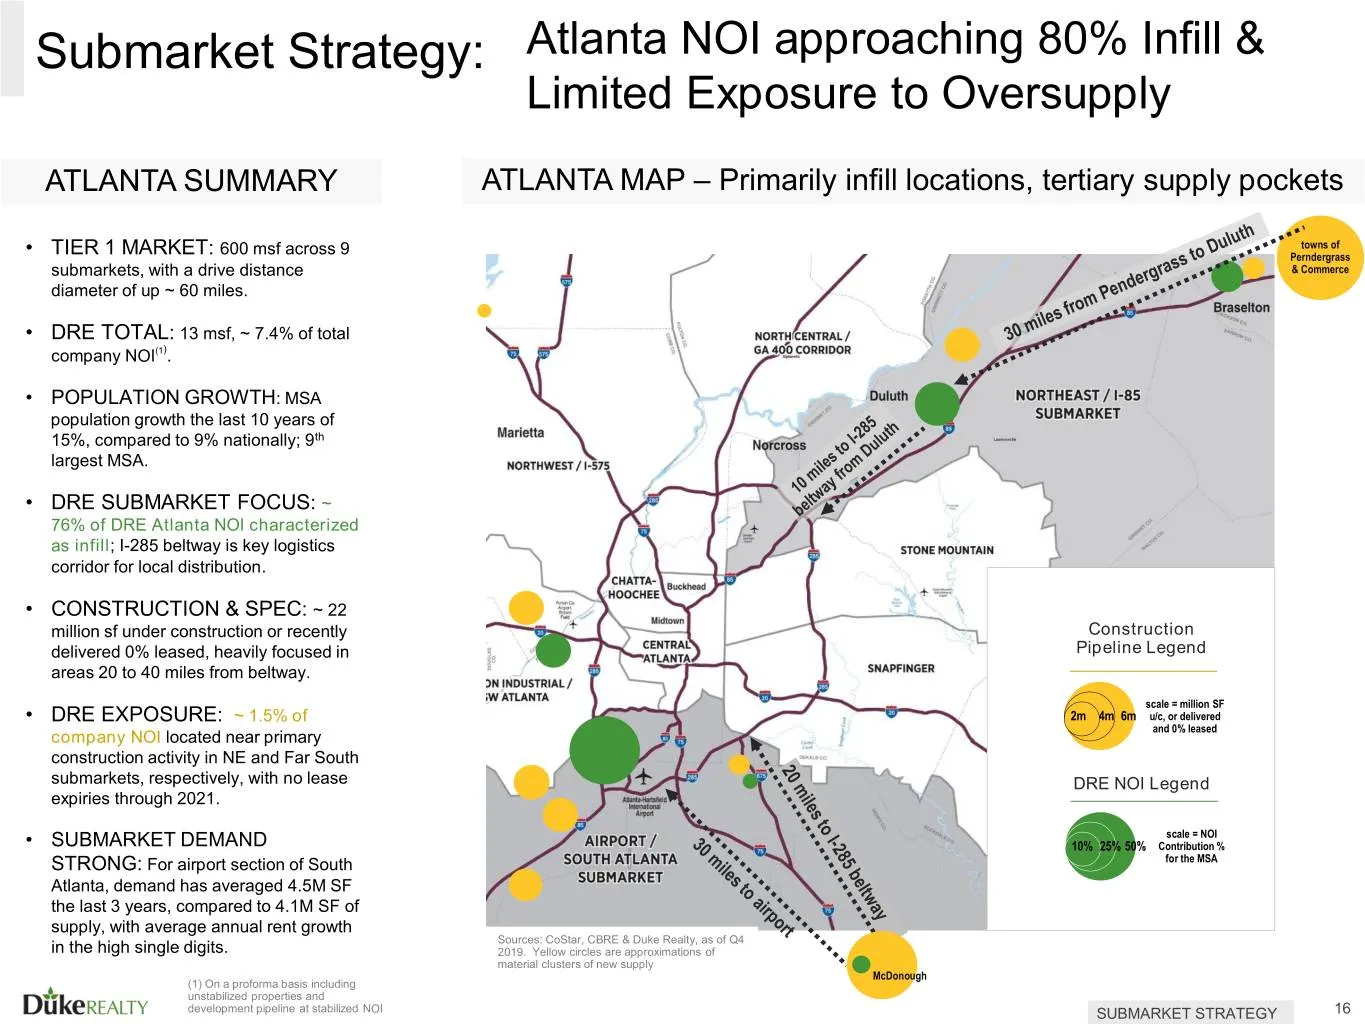
Slide 16: Submarket Strategy: Atlanta
Submarket Strategy: Atlanta NOI approaching 80% Infill & Limited Exposure to Oversupply ATLANTA SUMMARY ATLANTA MAP – Primarily infill locations, tertiary supply pockets towns of • TIER 1 MARKET: 600 msf across 9 Perndergrass submarkets, with a drive distance & Commerce diameter of up ~ 60 miles. •
Slide 17: Submarket Strategy: Dallas
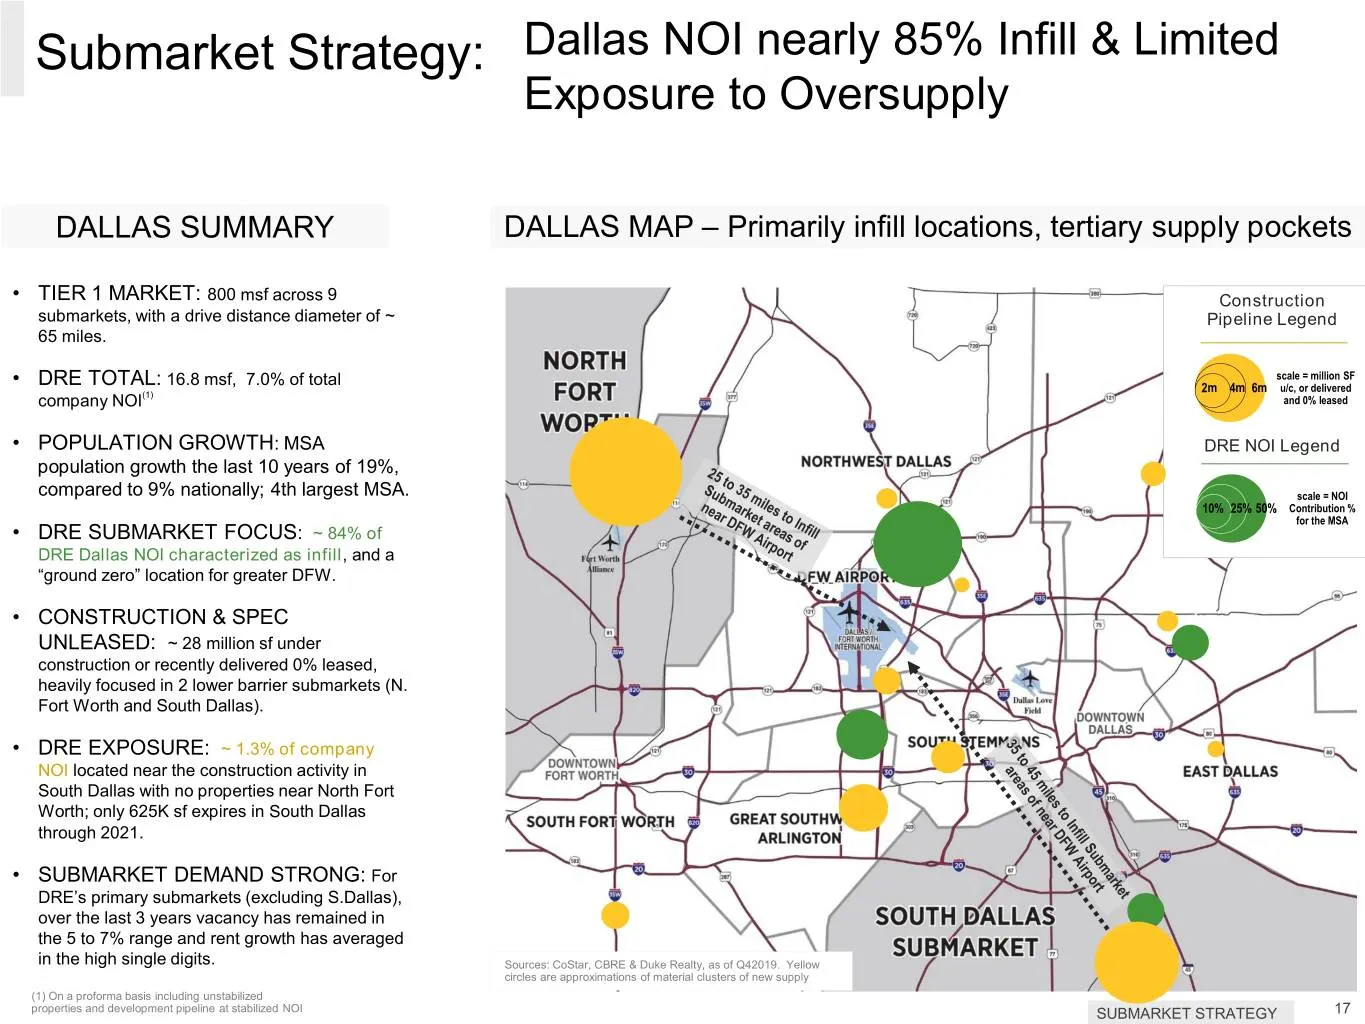
Submarket Strategy: Dallas NOI nearly 85% Infill & Limited Exposure to Oversupply DALLAS SUMMARY DALLAS MAP – Primarily infill locations, tertiary supply pockets • TIER 1 MARKET: 800 msf across 9 Construction submarkets, with a drive distance diameter of ~ Pipeline Legend 65 miles. 16.8 msf, 7.0% of
Slide 18: Modern Portfolio Performs Across All Sizes and Markets
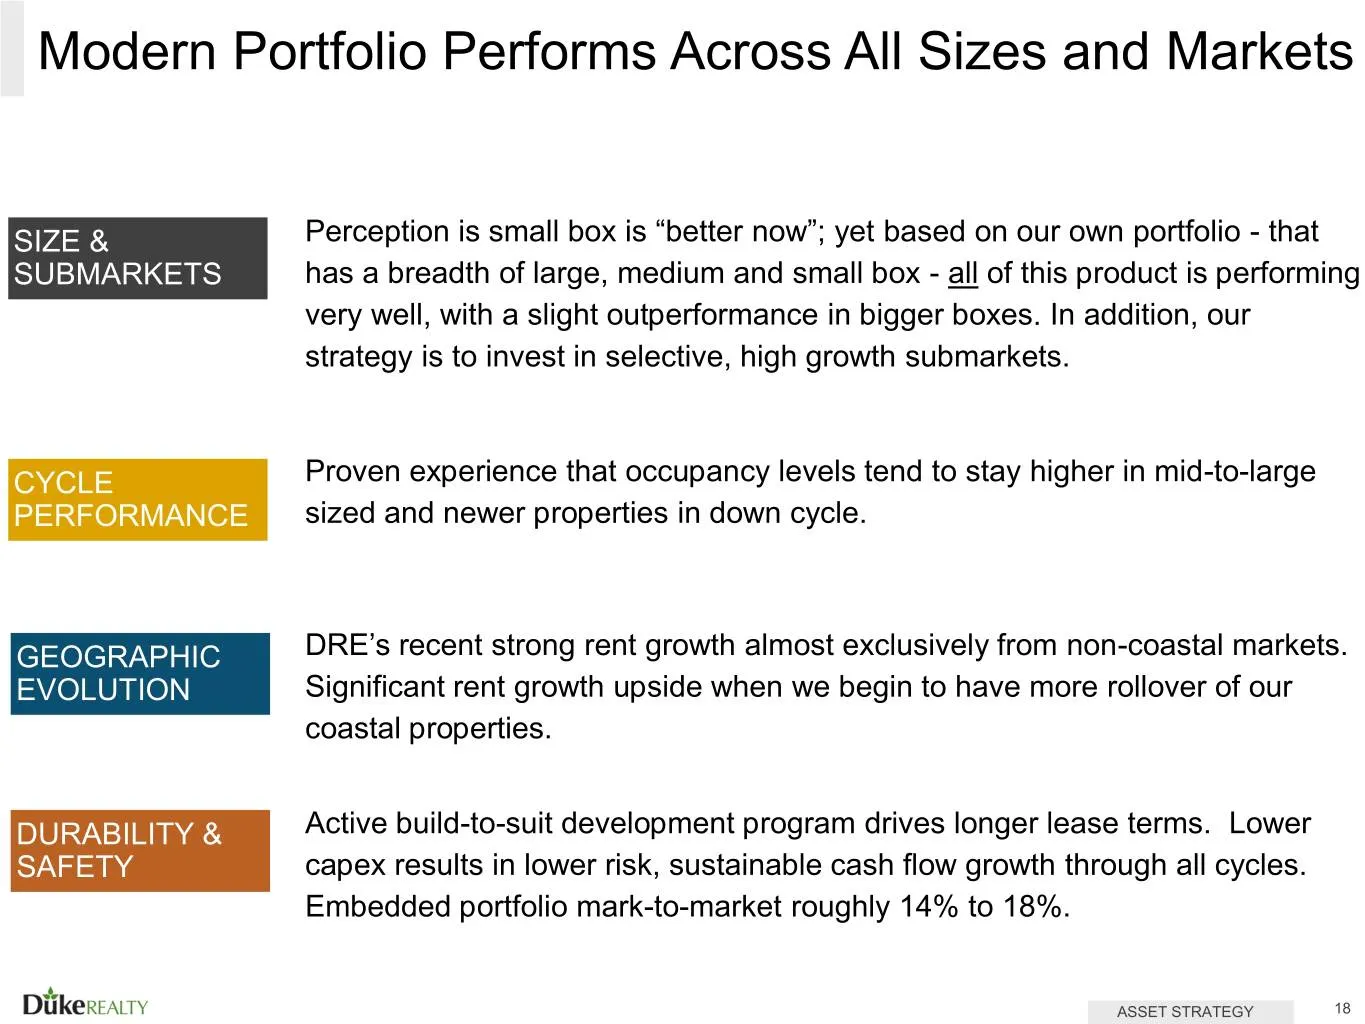
Modern Portfolio Performs Across All Sizes and Markets SIZE & Perception is small box is “better now”; yet based on our own portfolio - that SUBMARKETS has a breadth of large, medium and small box - all of this product is performing very well, with a slight outperformance in bigger boxes. In additio
Slide 19: Durable & Strong Performance across the Size Spectrum
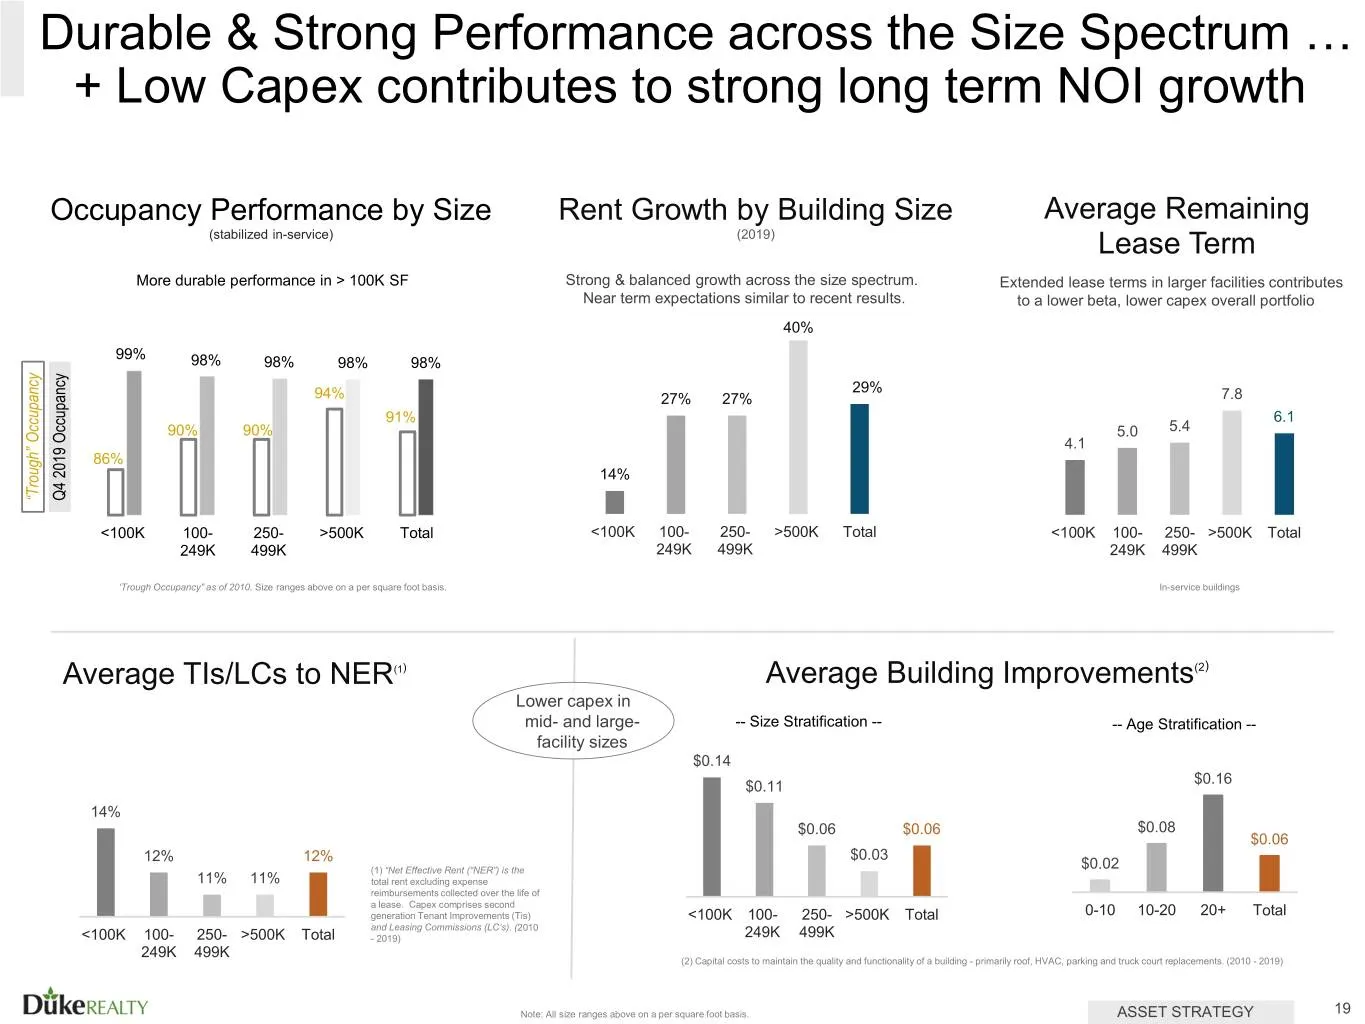
Durable & Strong Performance across the Size Spectrum … + Low Capex contributes to strong long term NOI growth Occupancy Performance by Size Rent Growth by Building Size Average Remaining (stabilized in-service) (2019) Lease Term More durable performance in > 100K SF Strong & balanced growth across
Slide 20: Development Strategy & Performance
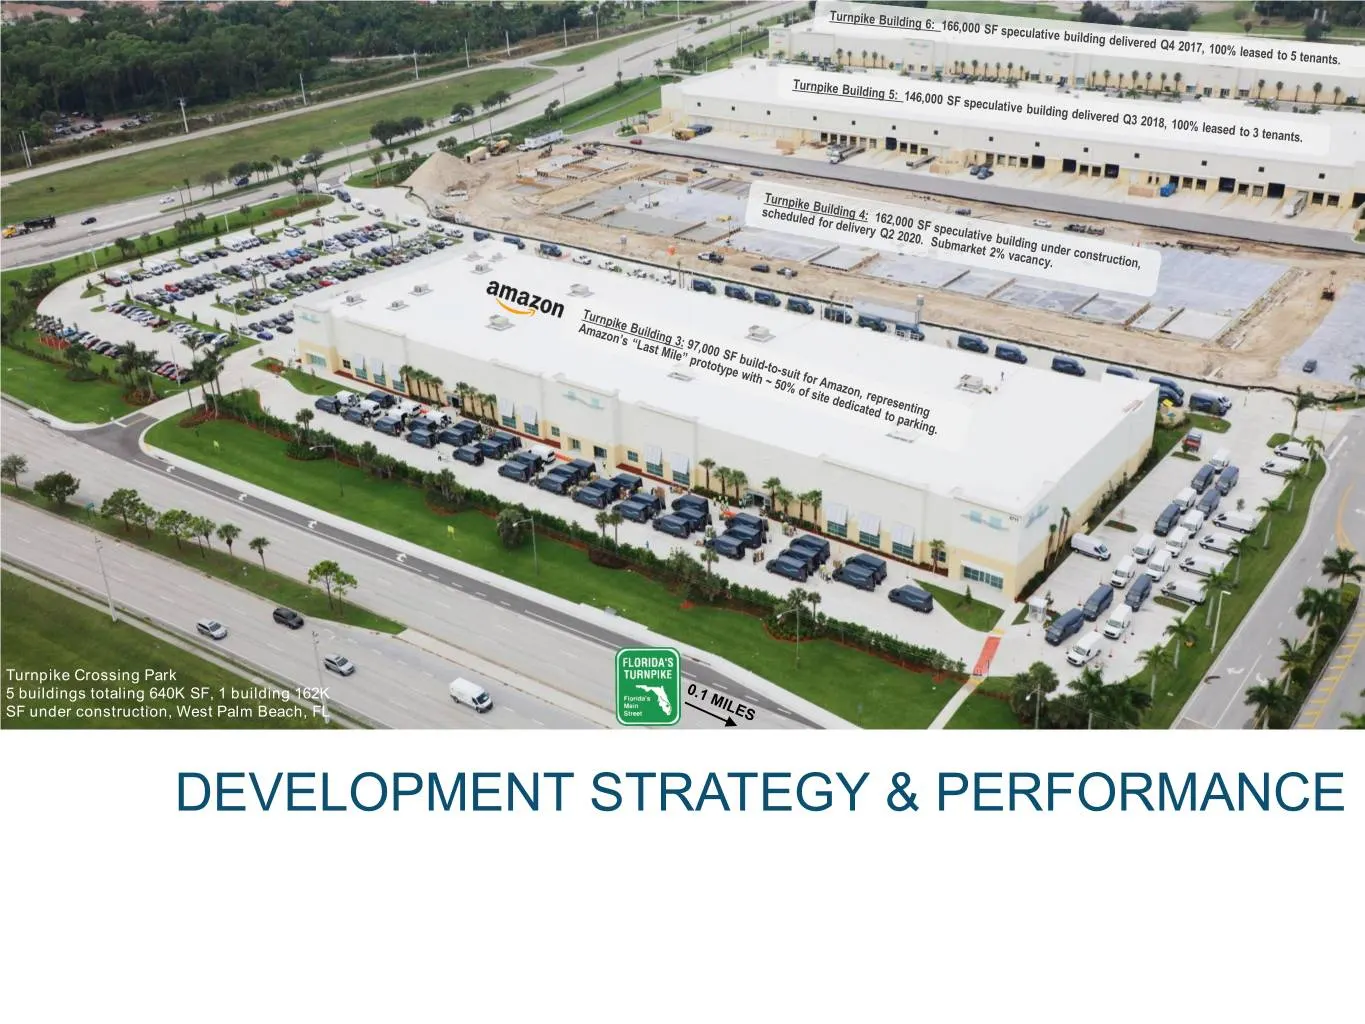
Turnpike Crossing Park 5 buildings totaling 640K SF, 1 building 162K SF under construction, West Palm Beach, FL DEVELOPMENT STRATEGY & PERFORMANCE
Slide 21: Development Strategic Advantages
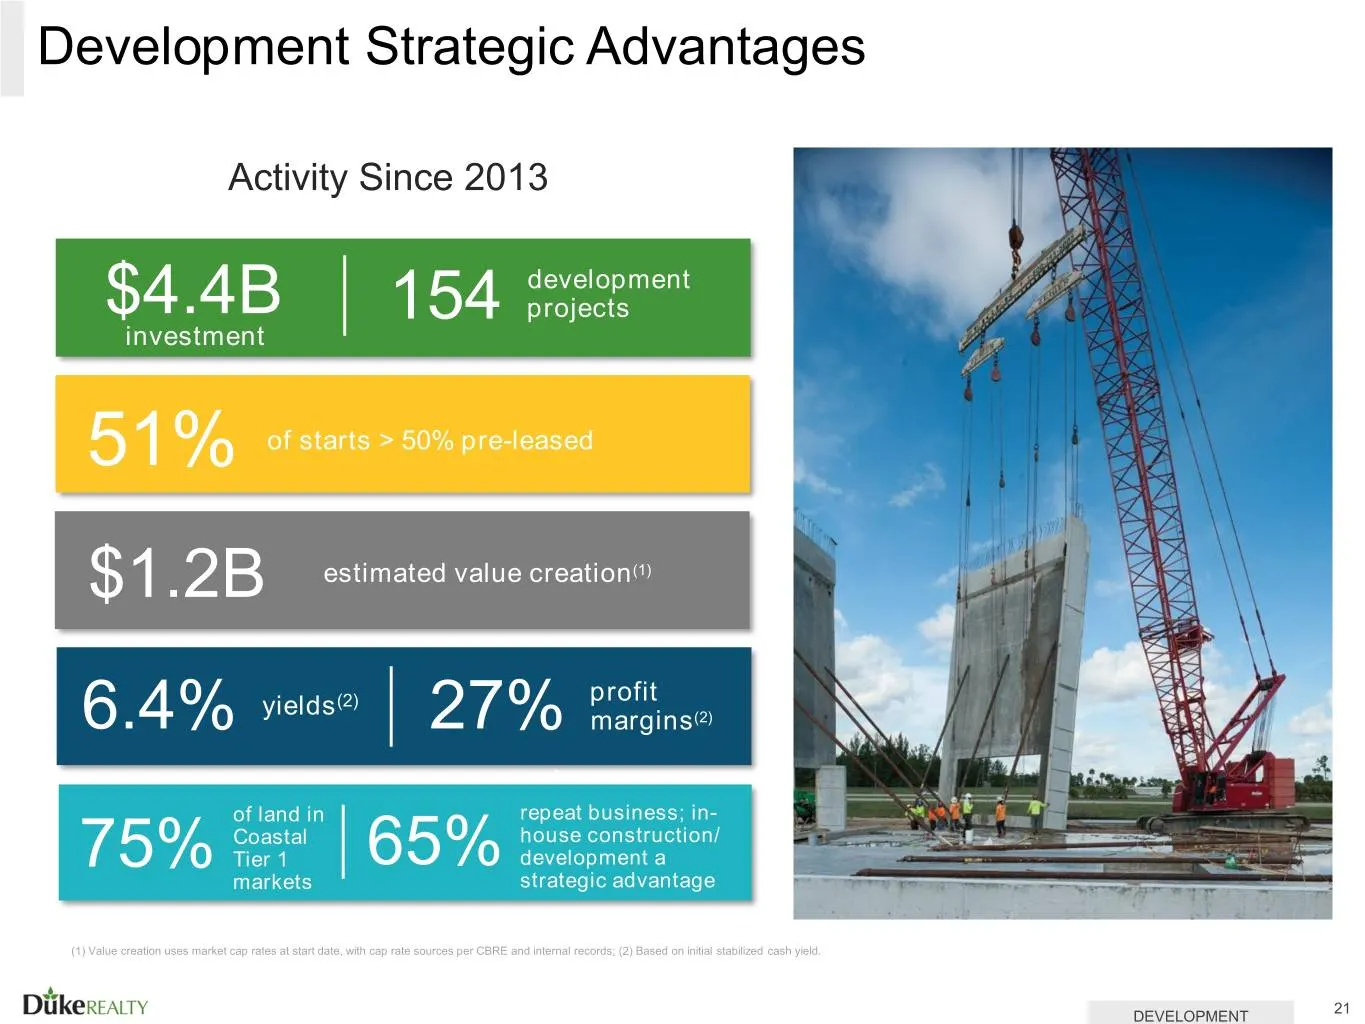
Development Strategic Advantages Activity Since 2013 development $4.4B 154 projects investment 51% of starts > 50% pre-leased $1.2B estimated value creation(1) profit yields(2) 6.4% 27% margins(2) of land in repeat business; in- Coastal house construction/ 75% Tier 1 65% development a markets strate
Slide 22: Speculative Development - Proven Execution
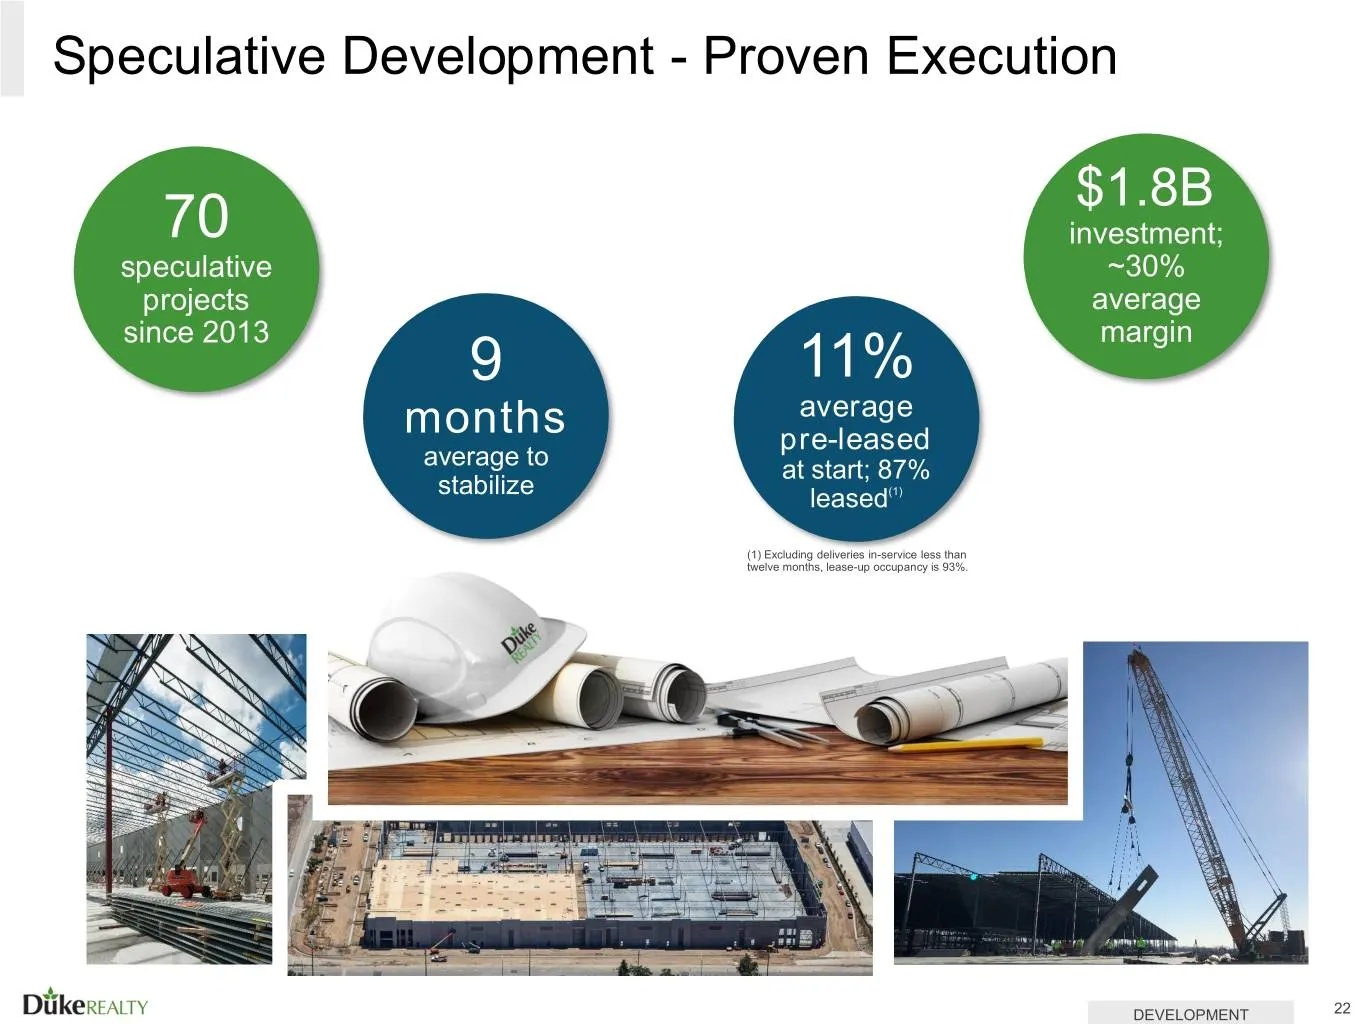
Speculative Development - Proven Execution $1.8B 70 investment; speculative ~30% projects average since 2013 9 11% margin average months pre-leased average to at start; 87% stabilize leased(1) (1) Excluding deliveries in-service less than twelve months, lease-up occupancy is 93%. DEVELOPMENT 22
Slide 23: Infill Redevelopment – Core Expertise
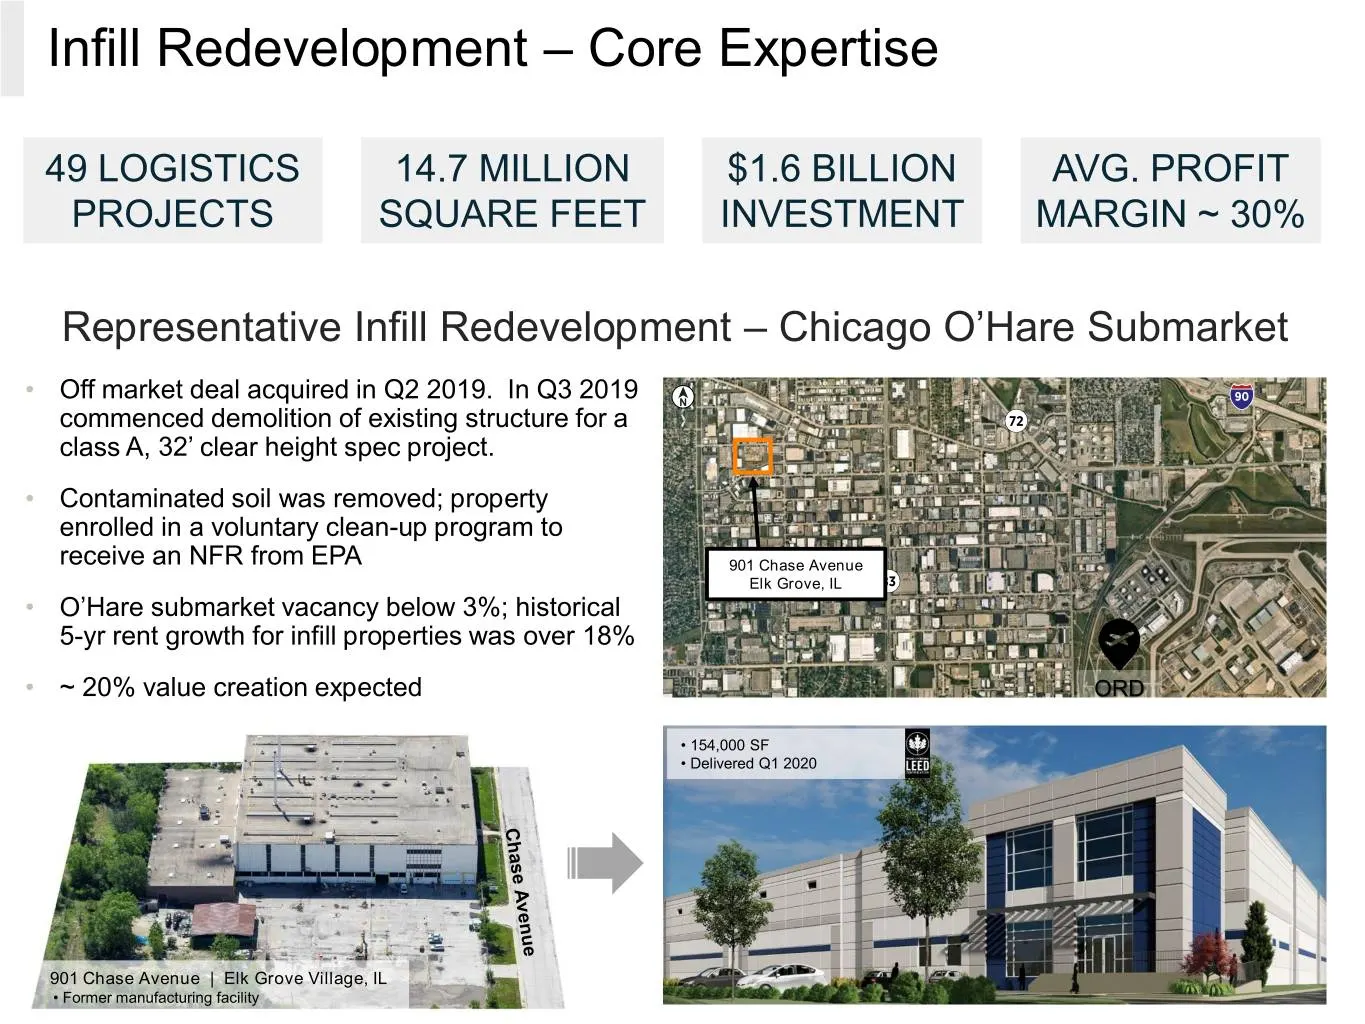
Infill Redevelopment – Core Expertise 49 LOGISTICS 14.7 MILLION $1.6 BILLION AVG. PROFIT PROJECTS SQUARE FEET INVESTMENT MARGIN ~ 30% Representative Infill Redevelopment – Chicago O’Hare Submarket • Off market deal acquired in Q2 2019. In Q3 2019 commenced demolition of existing structure for a clas
Slide 24: Infill Redevelopment – Northern New Jersey
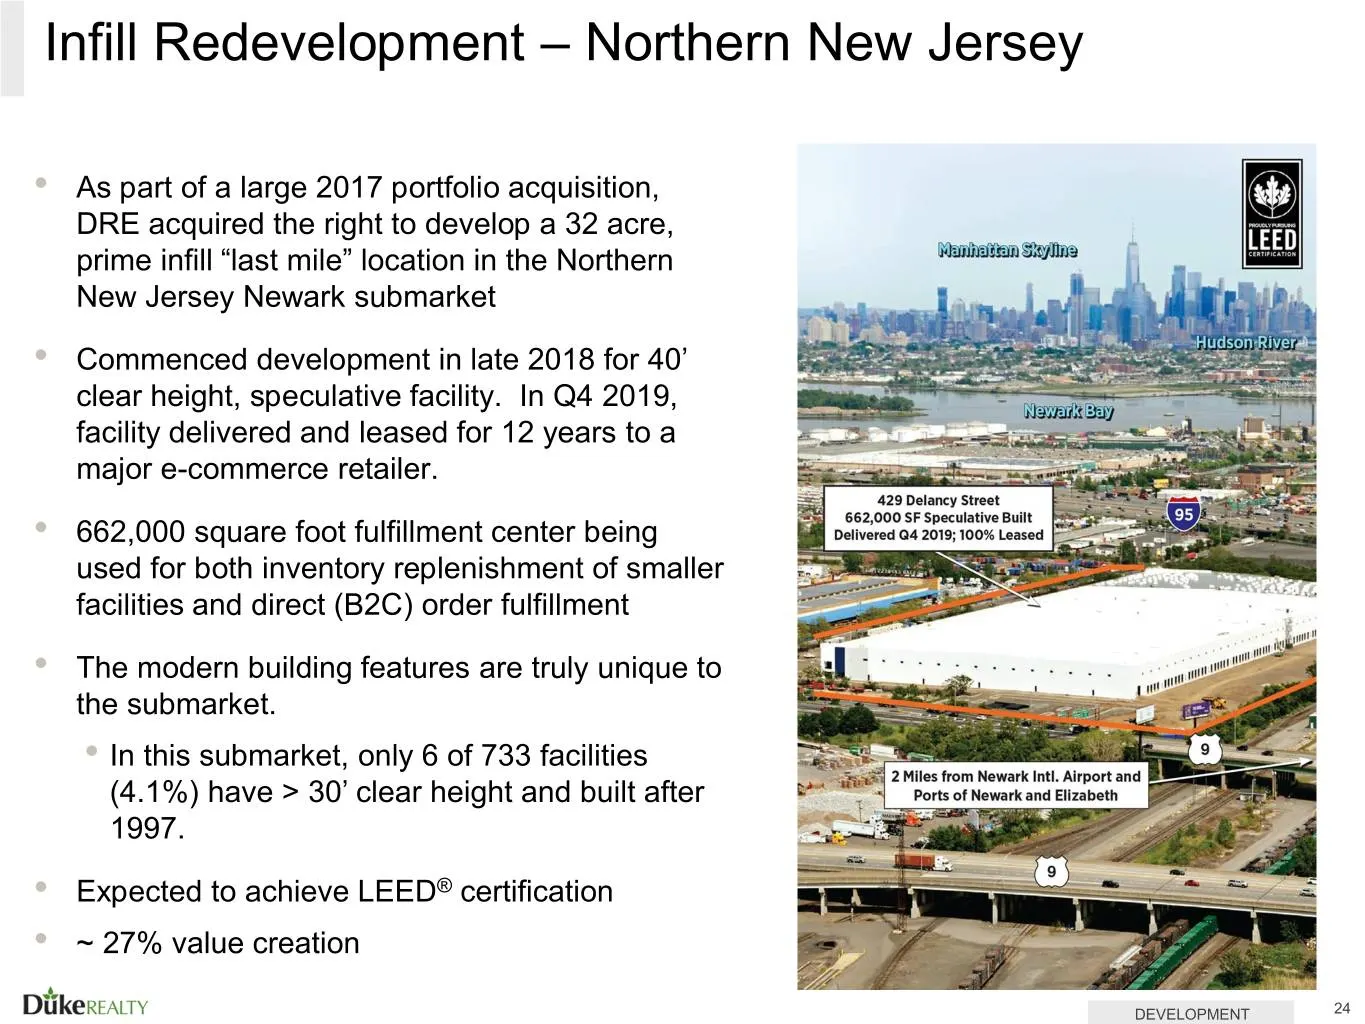
Infill Redevelopment – Northern New Jersey • As part of a large 2017 portfolio acquisition, DRE acquired the right to develop a 32 acre, prime infill “last mile” location in the Northern New Jersey Newark submarket • Commenced development in late 2018 for 40’ clear height, speculative facility. In Q
Slide 25: Infill Redevelopment – Southern California
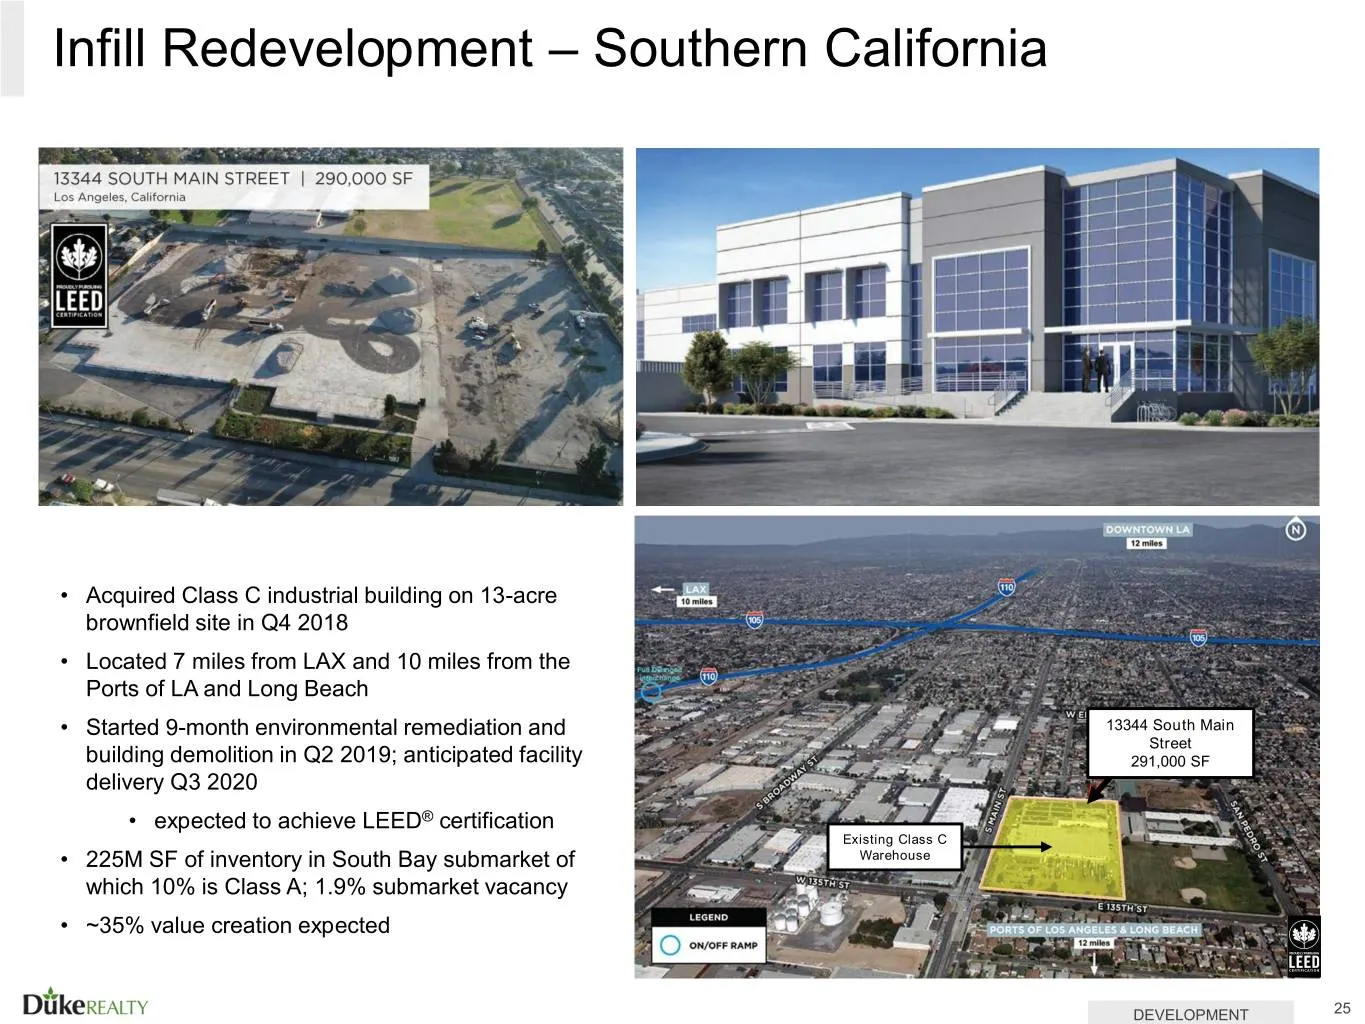
Infill Redevelopment – Southern California • Acquired Class C industrial building on 13-acre brownfield site in Q4 2018 • Located 7 miles from LAX and 10 miles from the Ports of LA and Long Beach • Started 9-month environmental remediation and 13344 South Main Street building demolition in Q2 2019;
Slide 26: Infill Redevelopment – South Florida
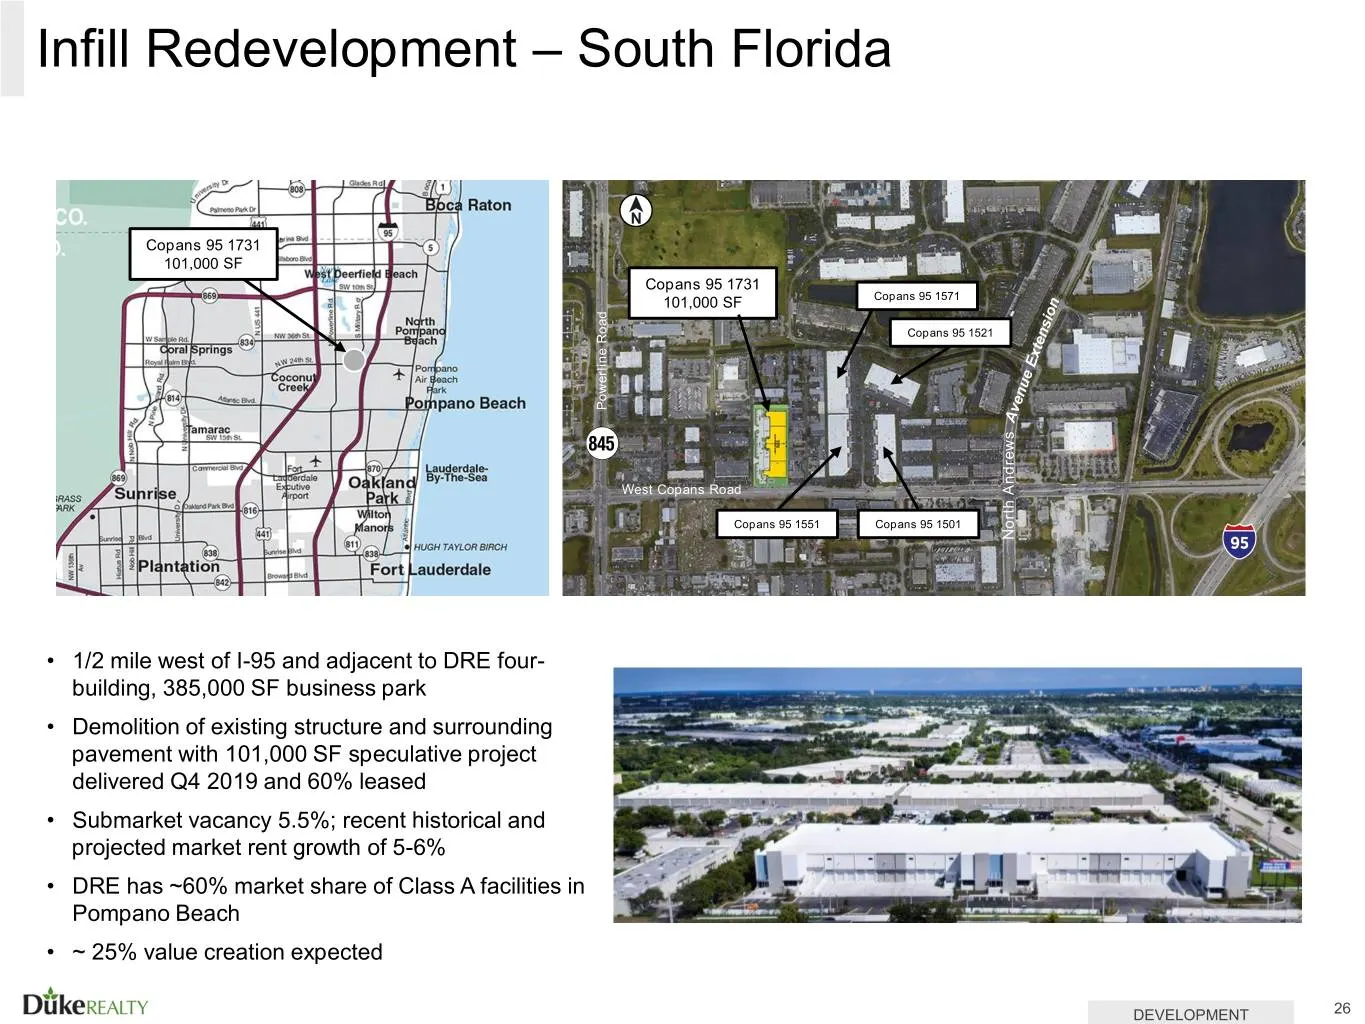
Infill Redevelopment – South Florida Copans 95 1731 101,000 SF Copans 95 1731 101,000 SF Copans 95 1571 Copans 95 1521 Powerline Powerline Road West Copans Road Copans 95 1551 Copans 95 1501 North Andrews North • 1/2 mile west of I-95 and adjacent to DRE four- building, 385,000 SF business park • De
Slide 27: Infill Build-to-Suit Developments - Atlanta
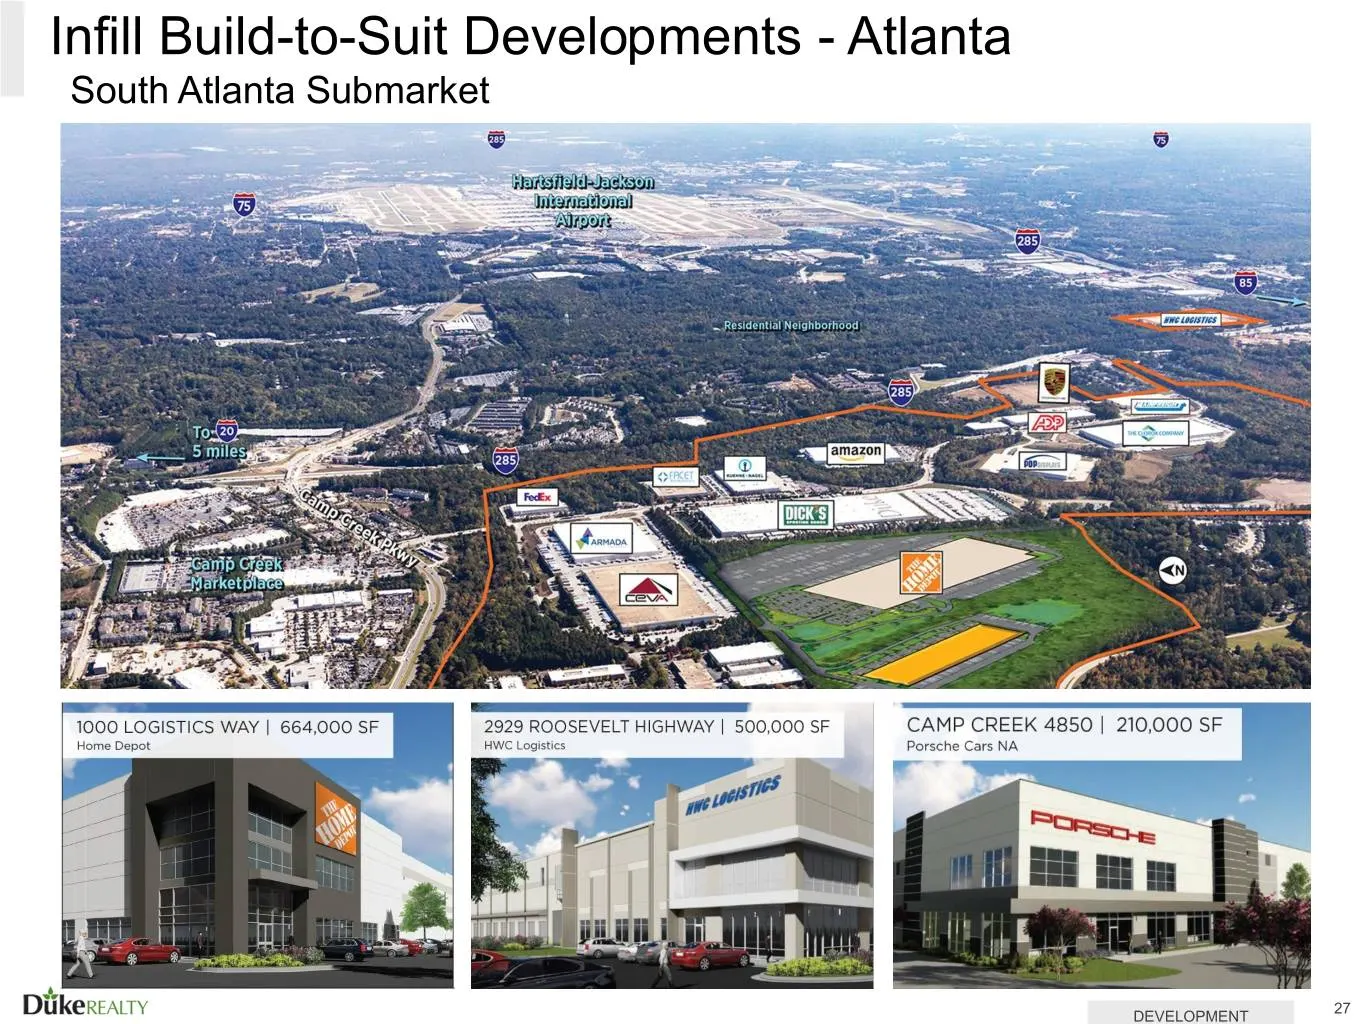
Infill Build-to-Suit Developments - Atlanta South Atlanta Submarket McDonough , GA Logistics Corridor 15 miles 27 DEVELOPMENT
Slide 28: Speculative Development - Inland Empire East Submarket
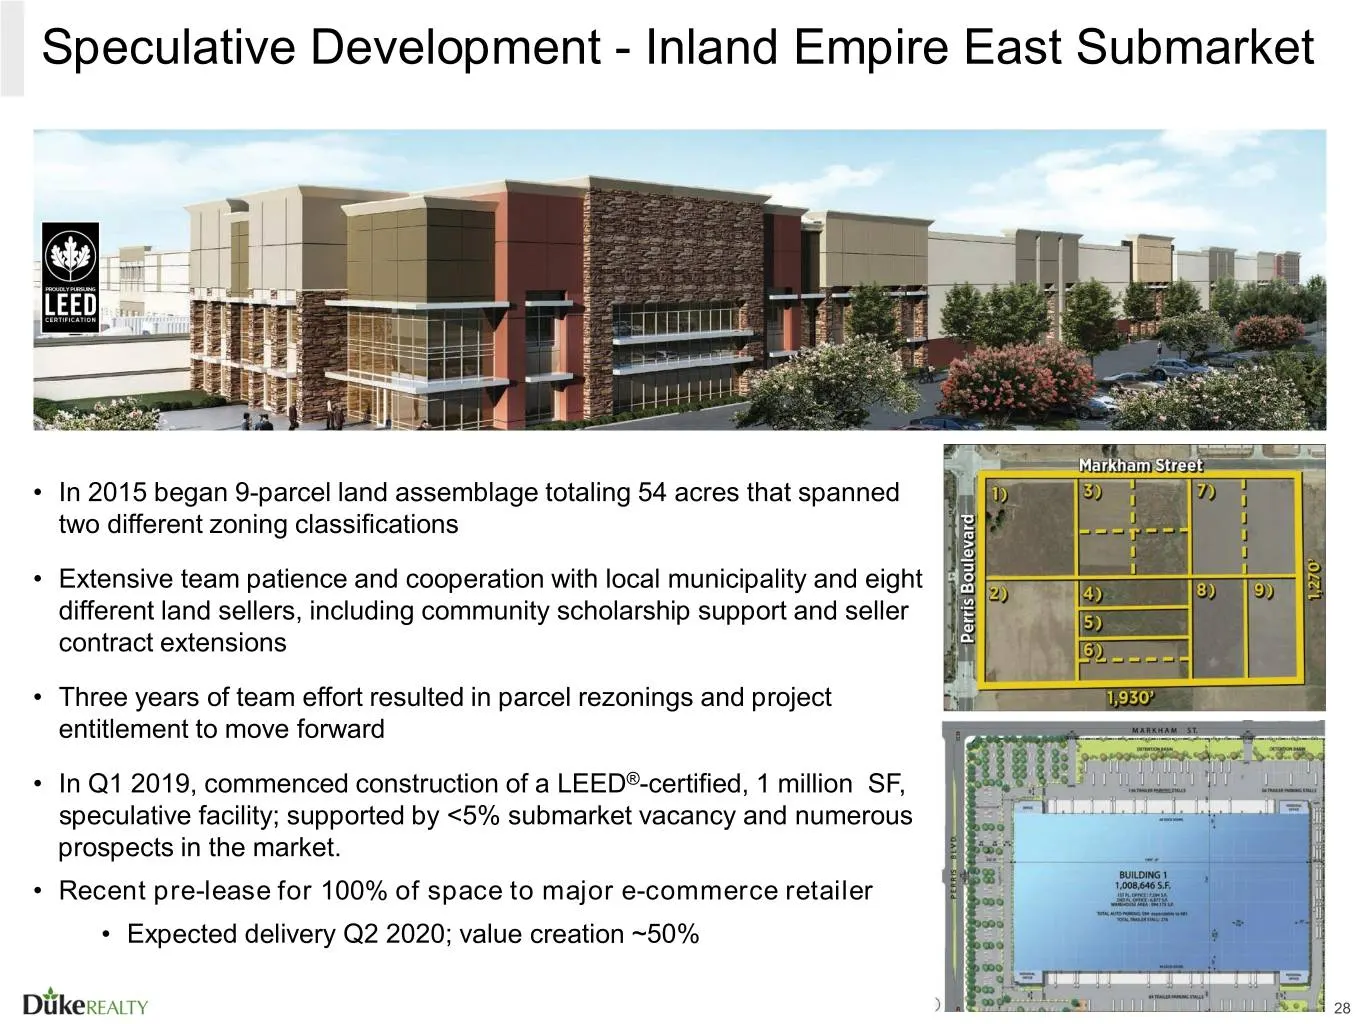
Speculative Development - Inland Empire East Submarket • In 2015 began 9-parcel land assemblage totaling 54 acres that spanned two different zoning classifications • Extensive team patience and cooperation with local municipality and eight different land sellers, including community scholarship supp
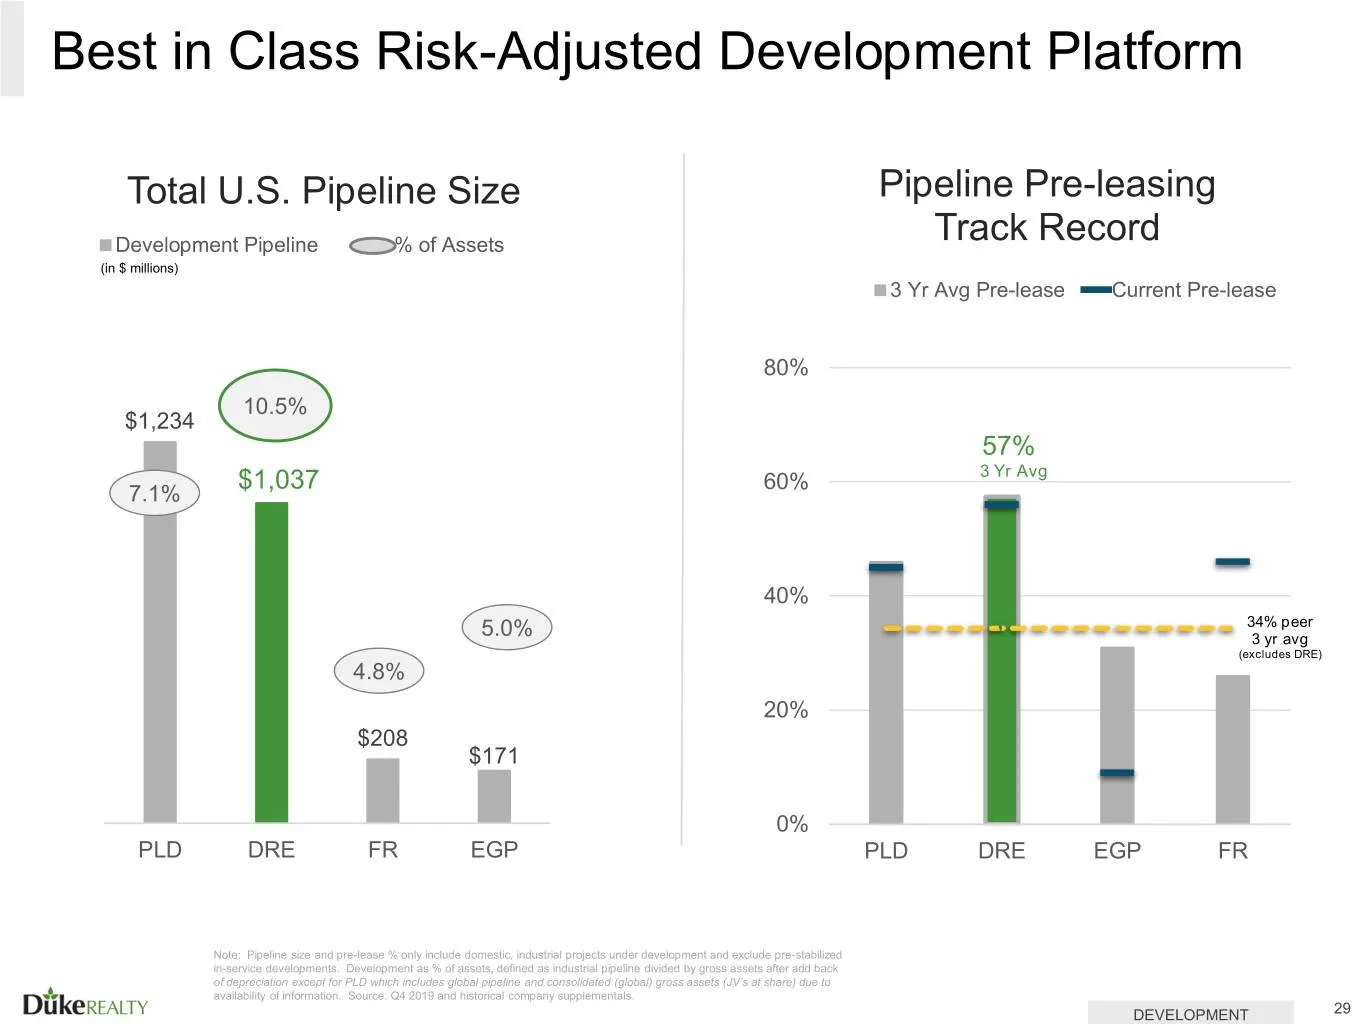
Slide 29: Best in Class Risk-Adjusted Development Platform
Best in Class Risk-Adjusted Development Platform Total U.S. Pipeline Size Pipeline Pre-leasing Development Pipeline % of Assets Track Record (in $ millions) 3 Yr Avg Pre-lease Current Pre-lease 80% 10.5% $1,234 57% $1,037 60% 3 Yr Avg 7.1% 40% 34% peer 5.0% 3 yr avg (excludes DRE) 4.8% 20% $208 $171
Slide 30: Operating Strategy
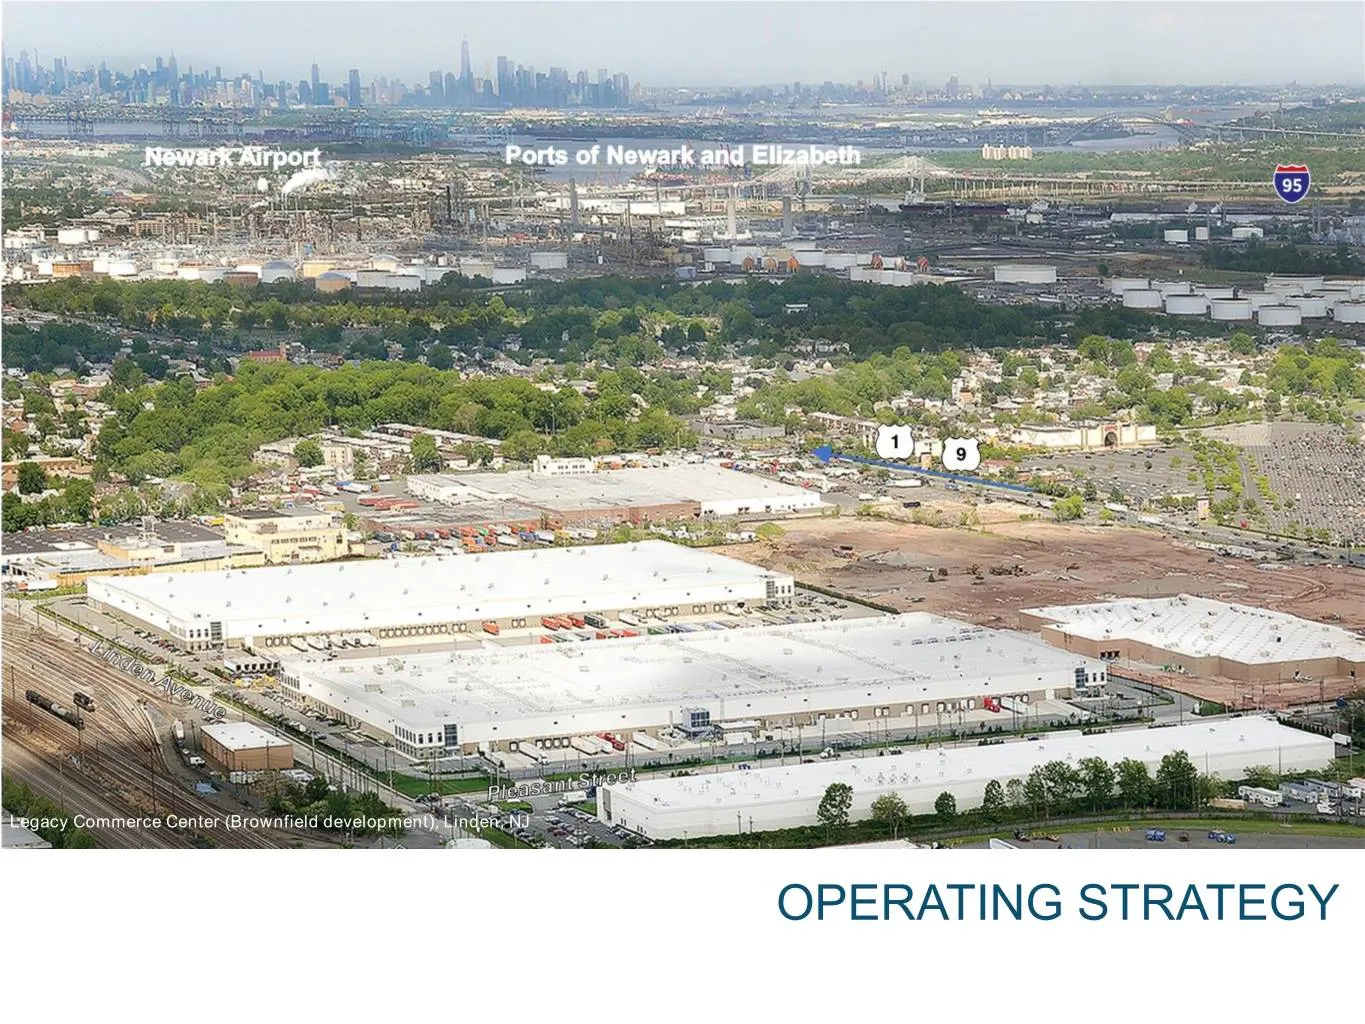
Legacy Commerce Center (Brownfield development), Linden, NJ OPERATING STRATEGY
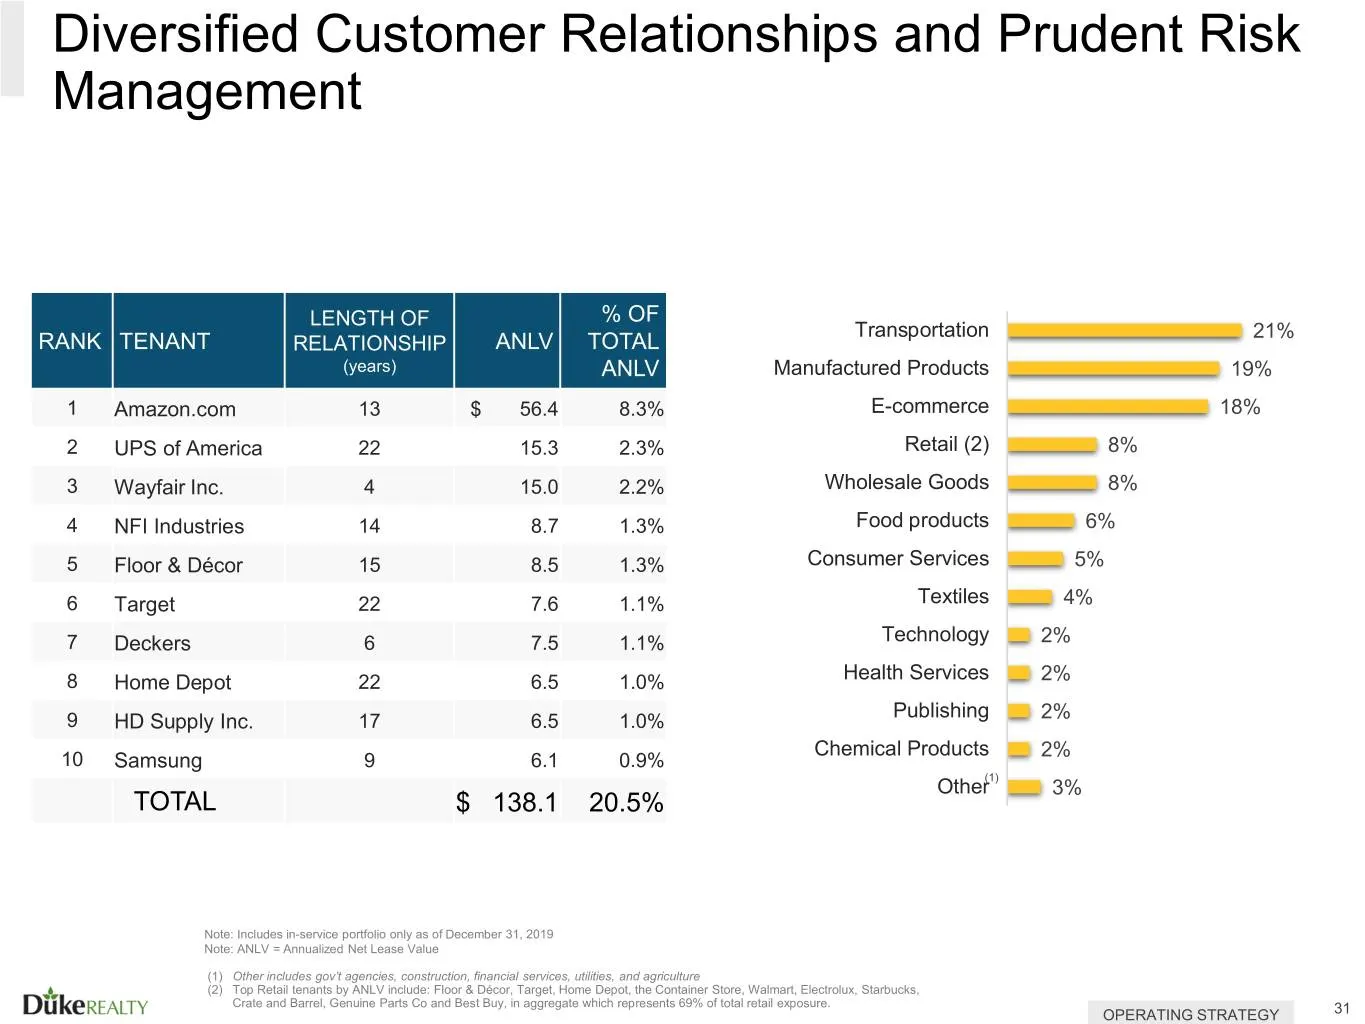
Slide 31: Diversified Customer Relationships and Prudent Risk Management
Diversified Customer Relationships and Prudent Risk Management LENGTH OF % OF Transportation 21% RANK TENANT RELATIONSHIP ANLV TOTAL (years) ANLV Manufactured Products 19% 1 Amazon.com 13 $ 56.4 8.3% E-commerce 18% 2 UPS of America 22 15.3 2.3% Retail (2) 8% 3 Wayfair Inc. 4 15.0 2.2% Wholesale Good
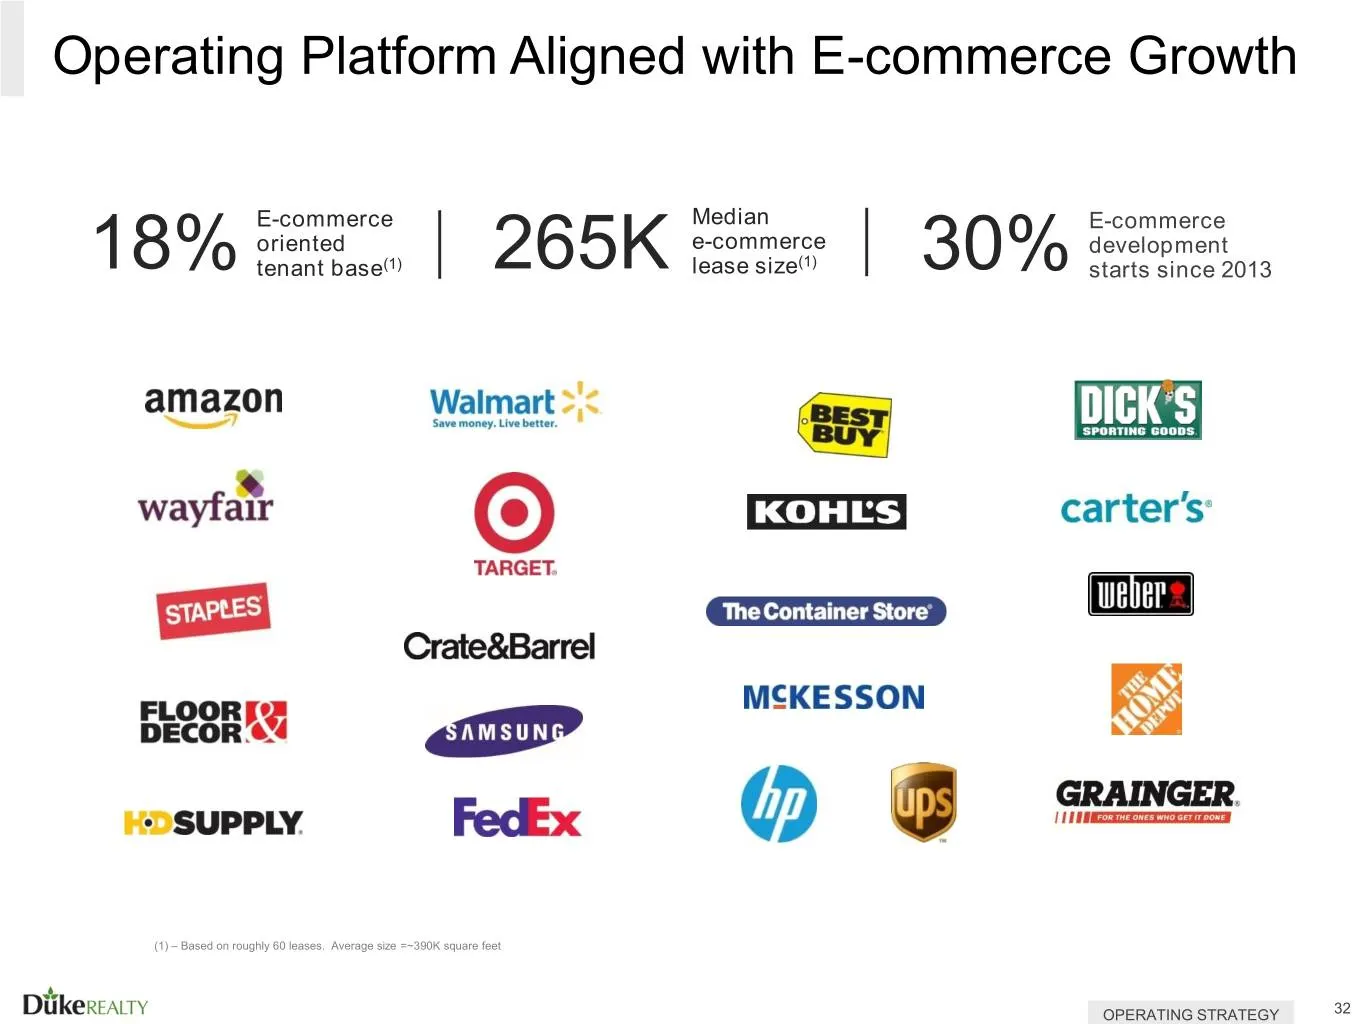
Slide 32: Operating Platform Aligned with E-commerce Growth
Operating Platform Aligned with E-commerce Growth E-commerce Median E-commerce oriented e-commerce development 18% tenant base(1) 265K lease size(1) 30% starts since 2013 (1) – Based on roughly 60 leases. Average size =~390K square feet OPERATING STRATEGY 32
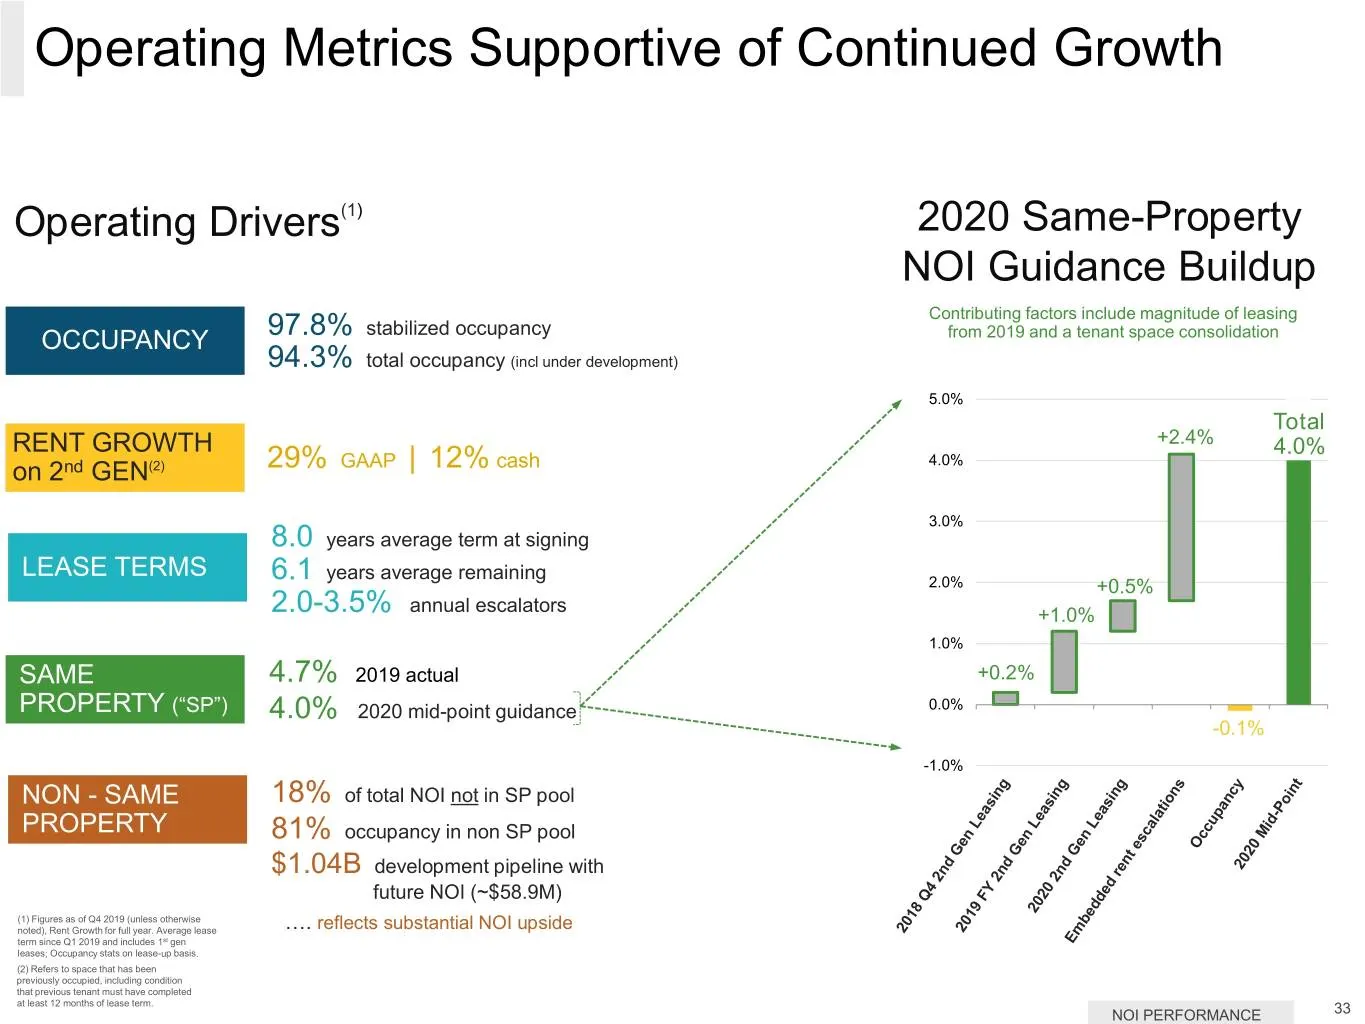
Slide 33: Operating Metrics Supportive of Continued Growth
Operating Metrics Supportive of Continued Growth Operating Drivers(1) 2020 Same-Property NOI Guidance Buildup Contributing factors include magnitude of leasing 97.8% stabilized occupancy from 2019 and a tenant space consolidation OCCUPANCY 94.3% total occupancy (incl under development) 5.0% Total RE
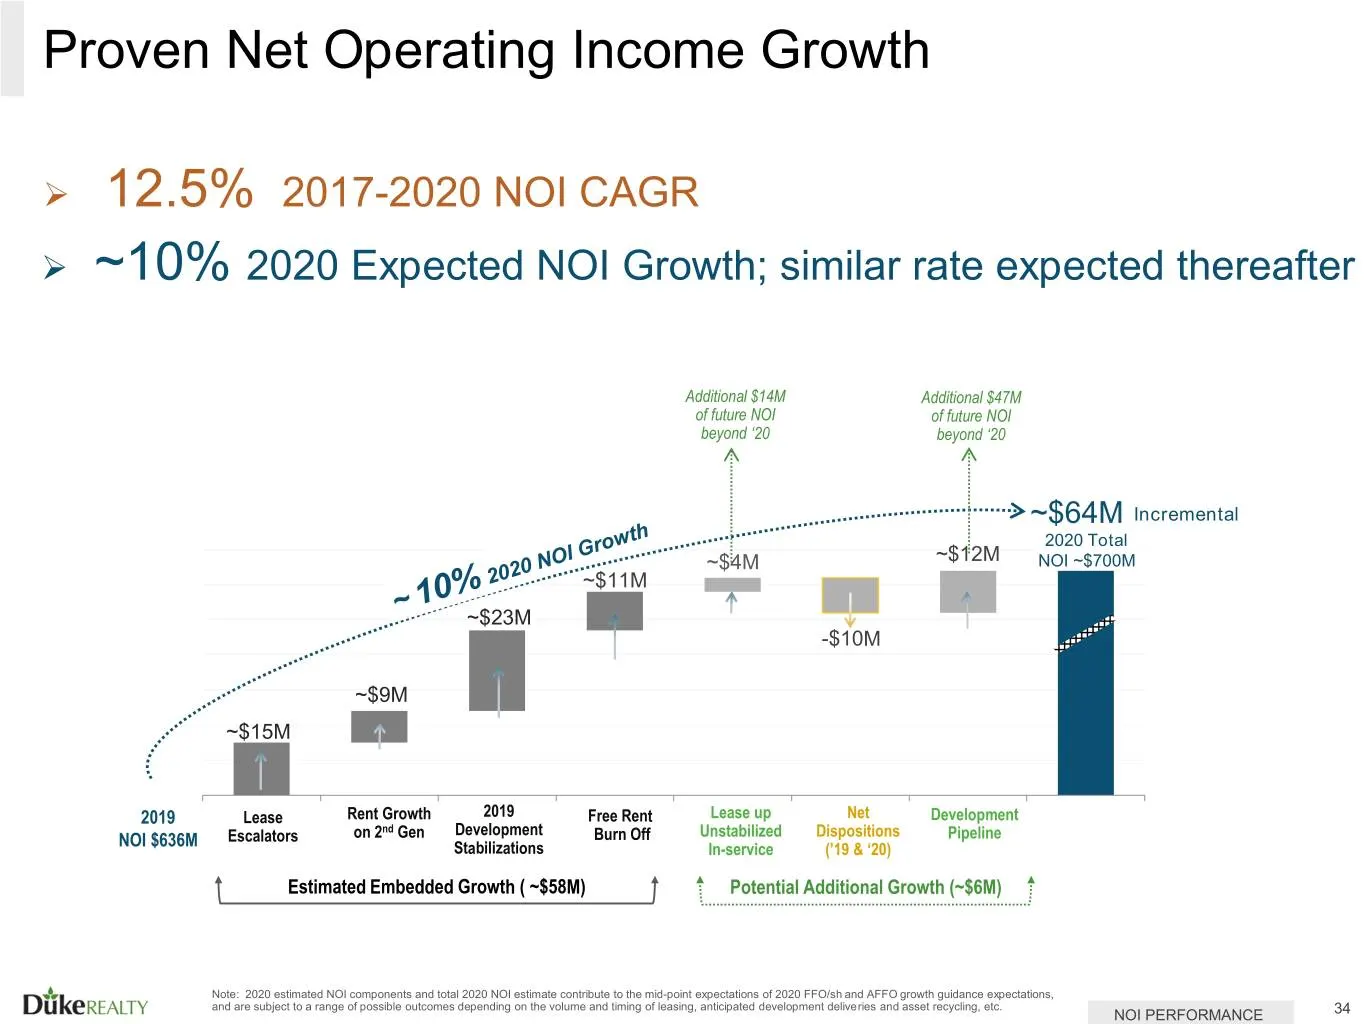
Slide 34: Proven Net Operating Income Growth
Proven Net Operating Income Growth 12.5% 2017-2020 NOI CAGR ~10% 2020 Expected NOI Growth; similar rate expected thereafter Additional $14M Additional $47M of future NOI of future NOI beyond ‘20 beyond ‘20 ~$64M Incremental 2020 Total ~$4M ~$12M NOI ~$700M ~$11M ~$23M -$10M ~$9M ~$15M 2019 Lease
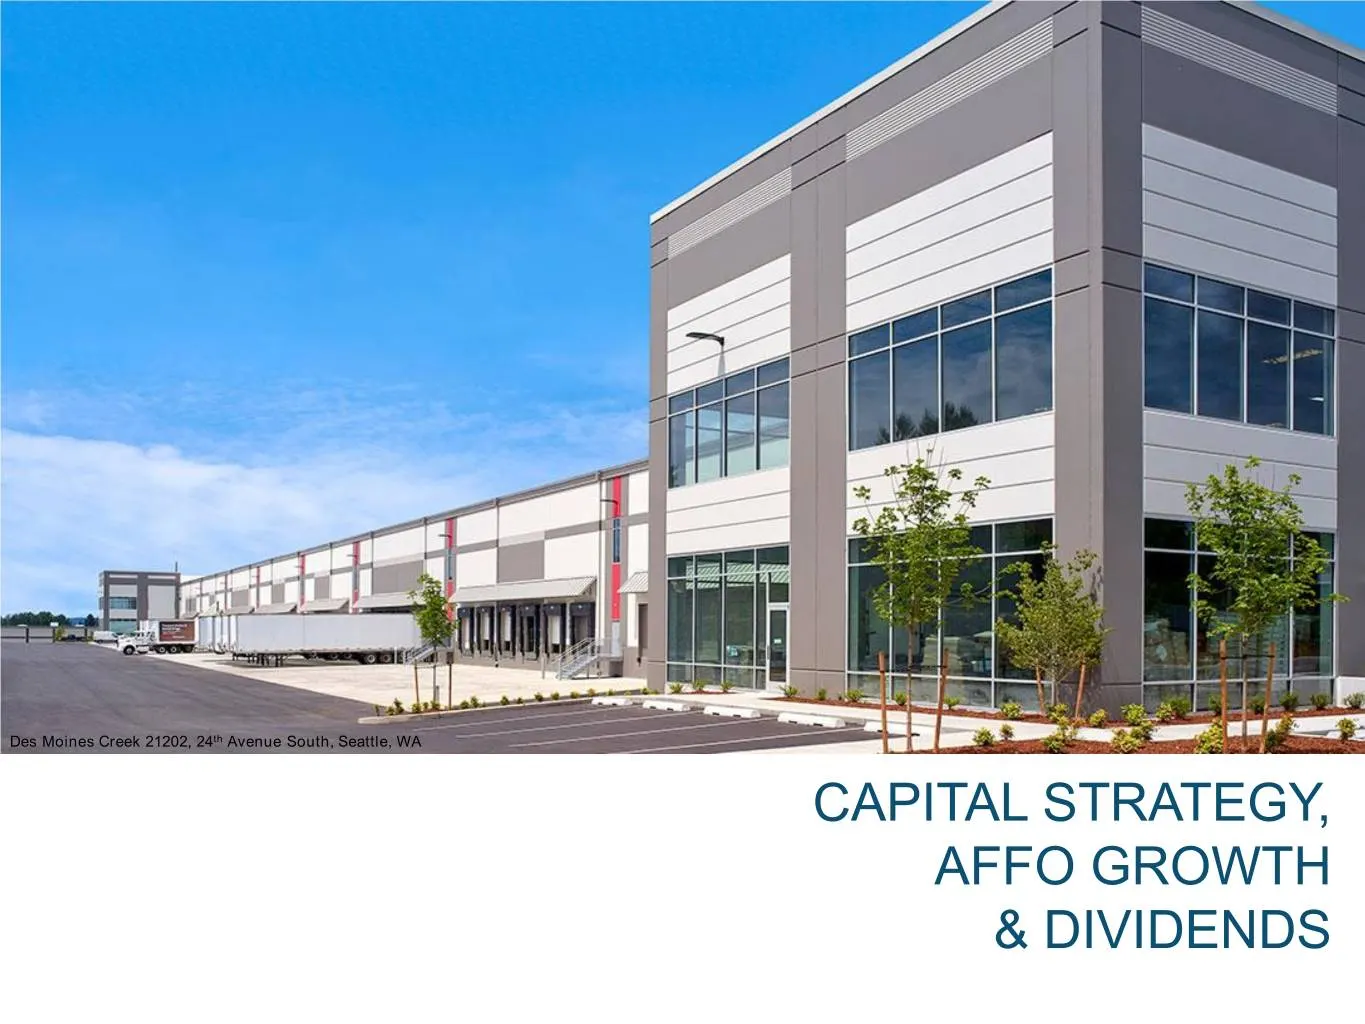
Slide 35: Capital Strategy, AFFO Growth & Dividends
Lockport 16328 / 16410 / 16508 (3 buildings, 803,000 SF), I-55 Submarket, Chicago, IL Des Moines Creek 21202, 24th Avenue South, Seattle, WA CAPITAL STRATEGY, AFFO GROWTH & DIVIDENDS
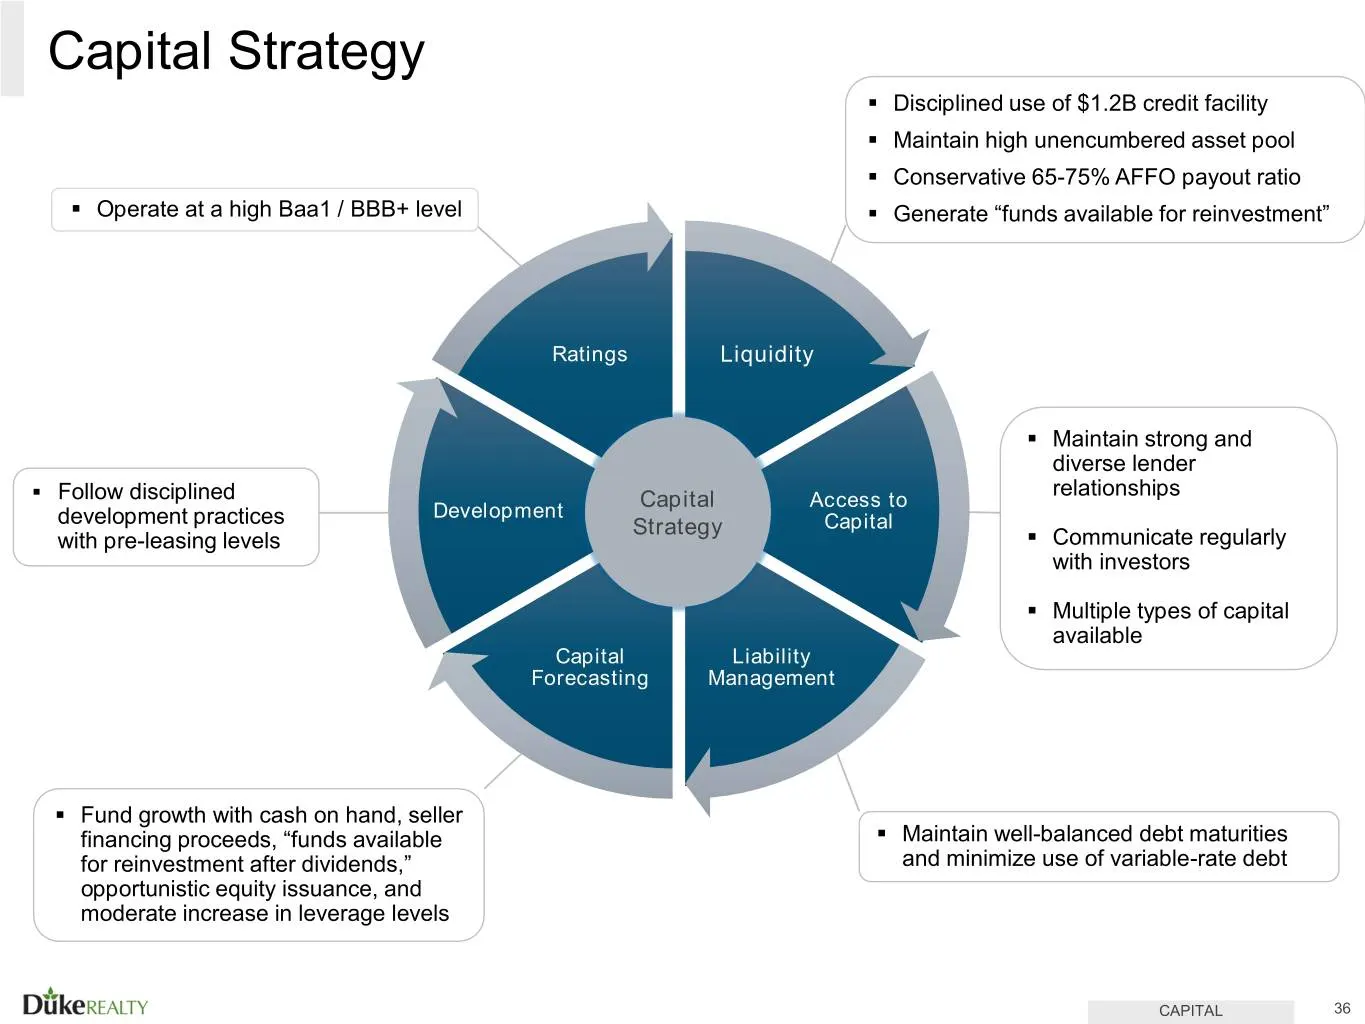
Slide 36: Capital Strategy
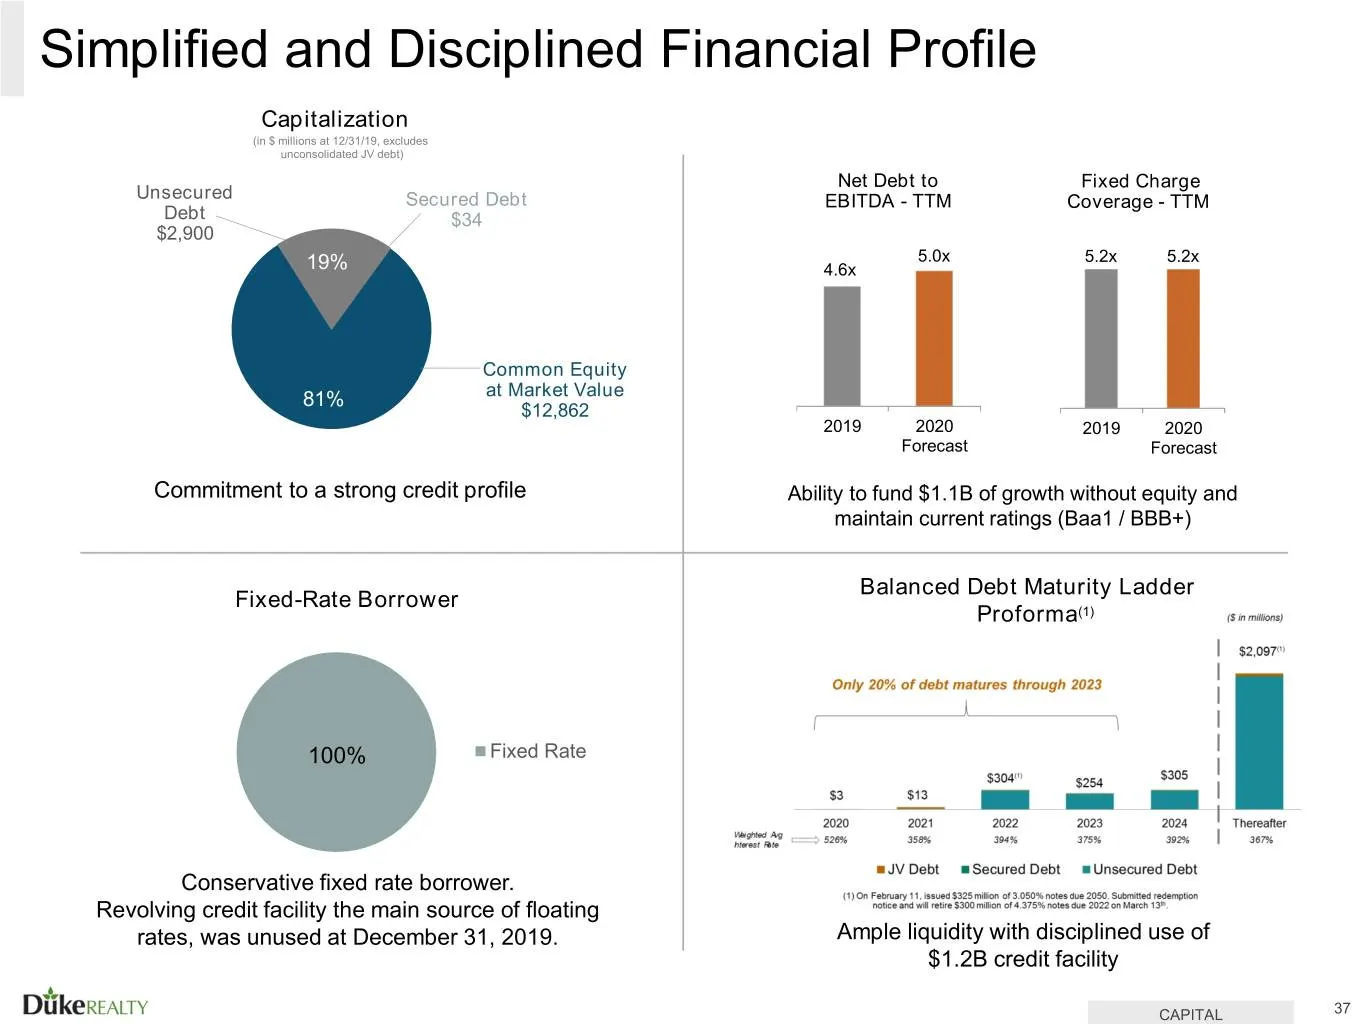
Capital Strategy . Disciplined use of $1.2B credit facility . Maintain high unencumbered asset pool . Conservative 65-75% AFFO payout ratio . Operate at a high Baa1 / BBB+ level . Generate “funds available for reinvestment” Ratings Liquidity . Maintain strong and diverse lender relationships . Follo
Slide 37: Simplified and Disciplined Financial Profile
Simplified and Disciplined Financial Profile Capitalization (in $ millions at 12/31/19, excludes unconsolidated JV debt) Net Debt to Fixed Charge Unsecured Secured Debt EBITDA - TTM Coverage - TTM Debt $34 $2,900 5.0x 5.2x 5.2x 19% 4.6x Common Equity 81% at Market Value $12,862 2019 2020 2019 2020 F
Slide 38: Funding Growth while Controlling Leverage
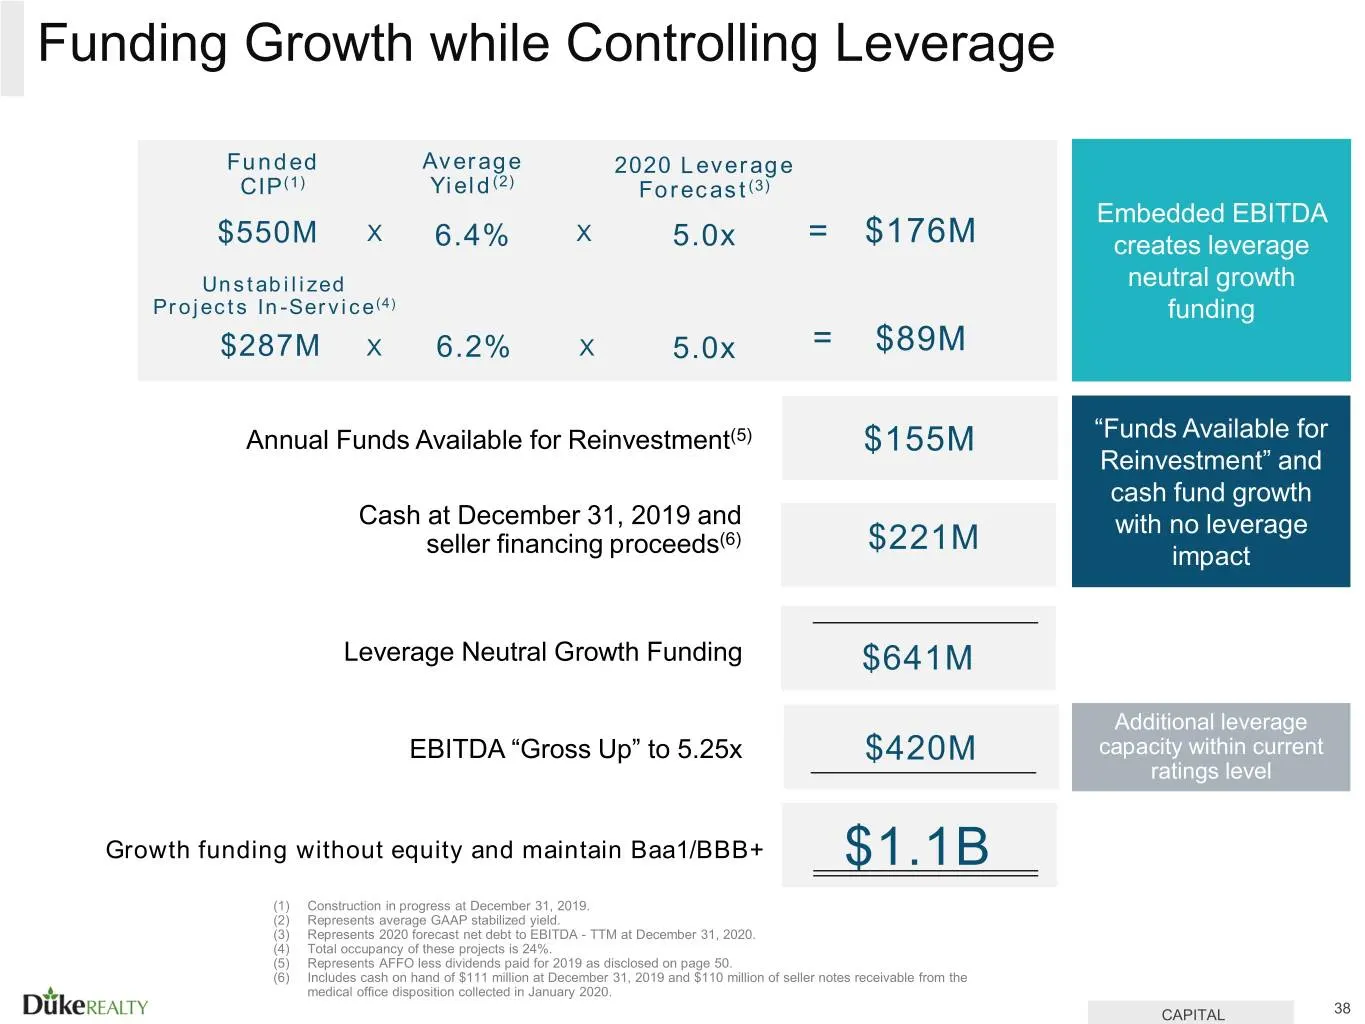
Funding Growth while Controlling Leverage Funded Average 2020 Leverage CIP(1) Yield(2) Forecast(3) Embedded EBITDA $550M X 6.4% X 5.0x = $176M creates leverage Unstabilized neutral growth Projects In-Service (4) funding $287M X 6.2% X 5.0x = $89M Annual Funds Available for Reinvestment(5) $155M “Fun
Slide 39: Baa1/BBB+ Rated but Credit Metrics at A Quality Levels
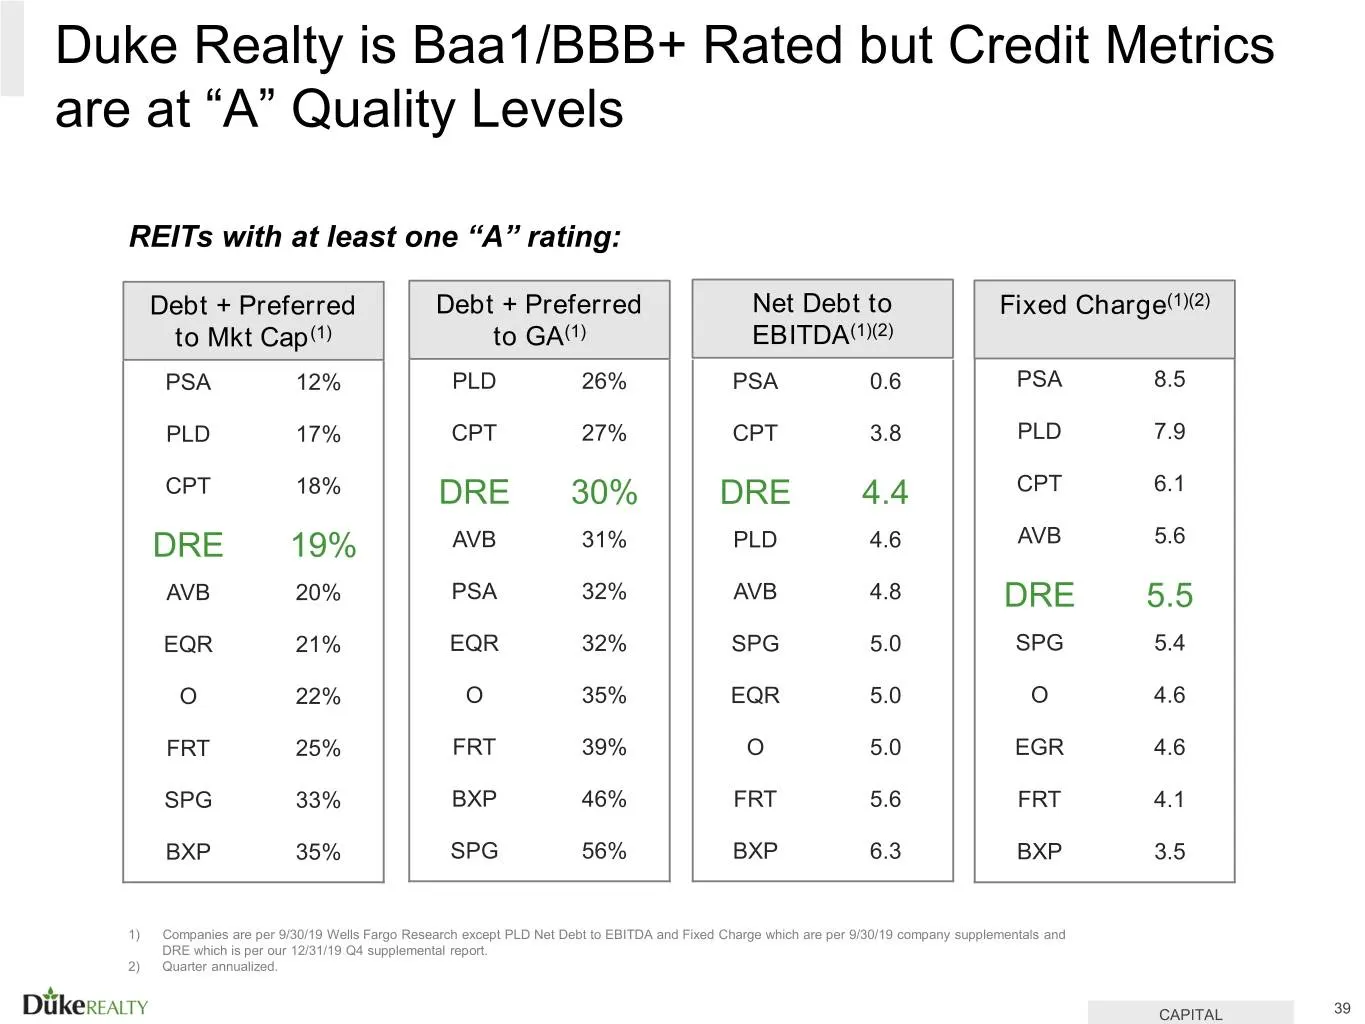
Duke Realty is Baa1/BBB+ Rated but Credit Metrics are at “A” Quality Levels REITs with at least one “A” rating: Debt + Preferred Debt + Preferred Net Debt to Fixed Charge(1)(2) to Mkt Cap(1) to GA(1) EBITDA(1)(2) PSA 12% PLD 26% PSA 0.6 PSA 8.5 PLD 17% CPT 27% CPT 3.8 PLD 7.9 CPT 18% DRE 30% DRE 4.4
Slide 40: Solid AFFO Growth throughout Major Repositioning
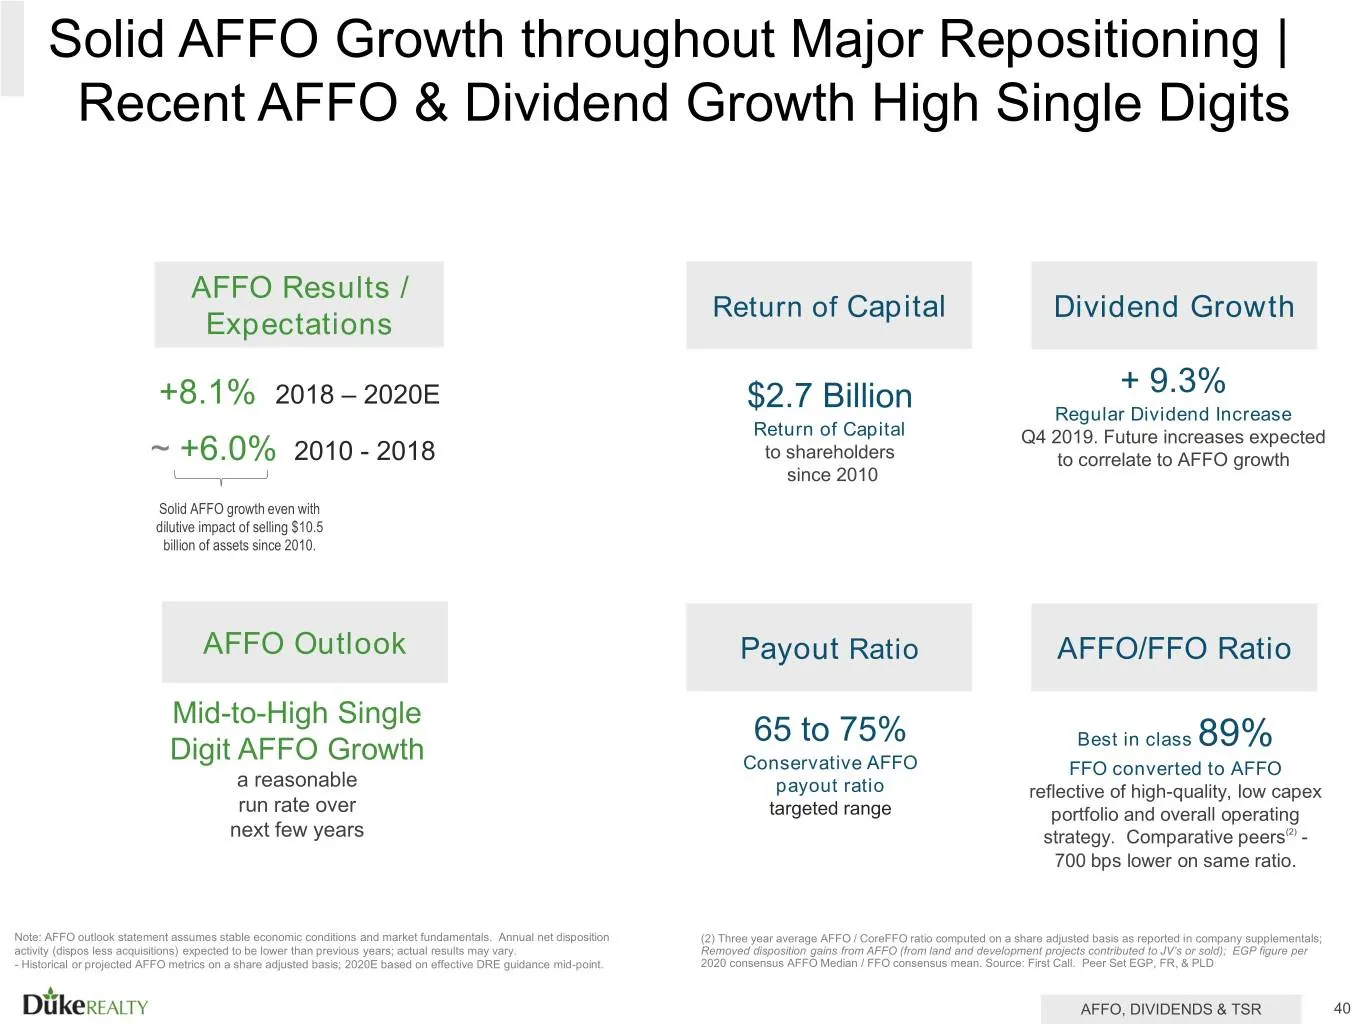
Solid AFFO Growth throughout Major Repositioning | Recent AFFO & Dividend Growth High Single Digits AFFO Results / Return of Capital Dividend Growth Expectations +8.1% 2018 – 2020E $2.7 Billion + 9.3% Regular Dividend Increase Return of Capital Q4 2019. Future increases expected ~ +6.0% 2010 - 2018
Slide 41: Corporate Responsibility
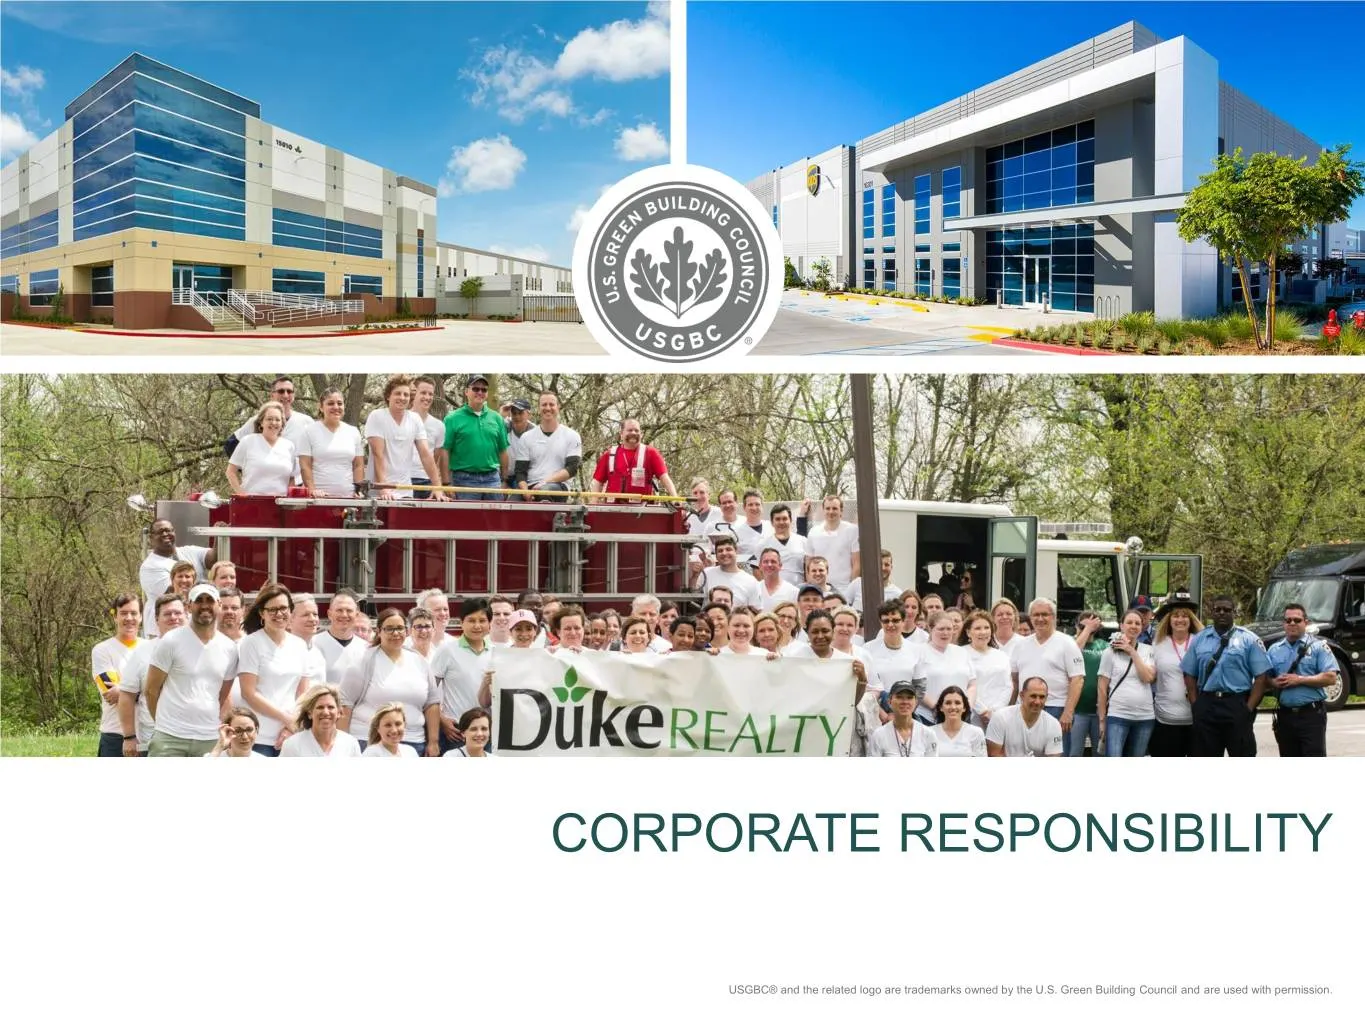
CORPORATE RESPONSIBILITY USGBC® and the related logo are trademarks owned by the U.S. Green Building Council and are used with permission.
Slide 42: Green Initiatives
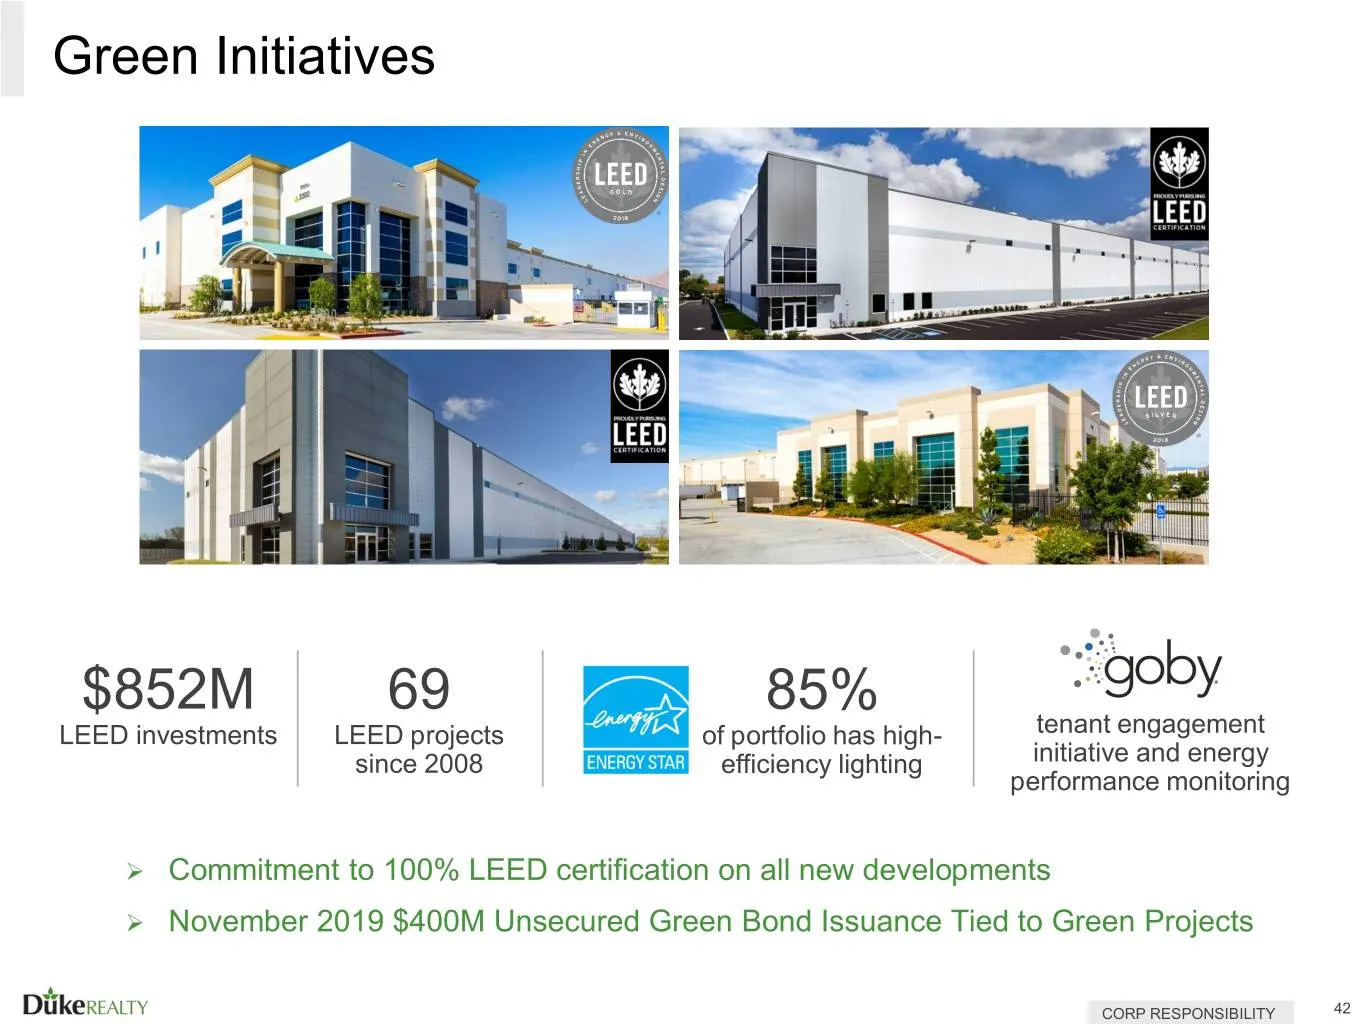
Green Initiatives $852M 69 85% LEED investments LEED projects of portfolio has high- tenant engagement since 2008 efficiency lighting initiative and energy performance monitoring Commitment to 100% LEED certification on all new developments November 2019 $400M Unsecured Green Bond Issuance Tied
Slide 43: Commitment to Social and Governance
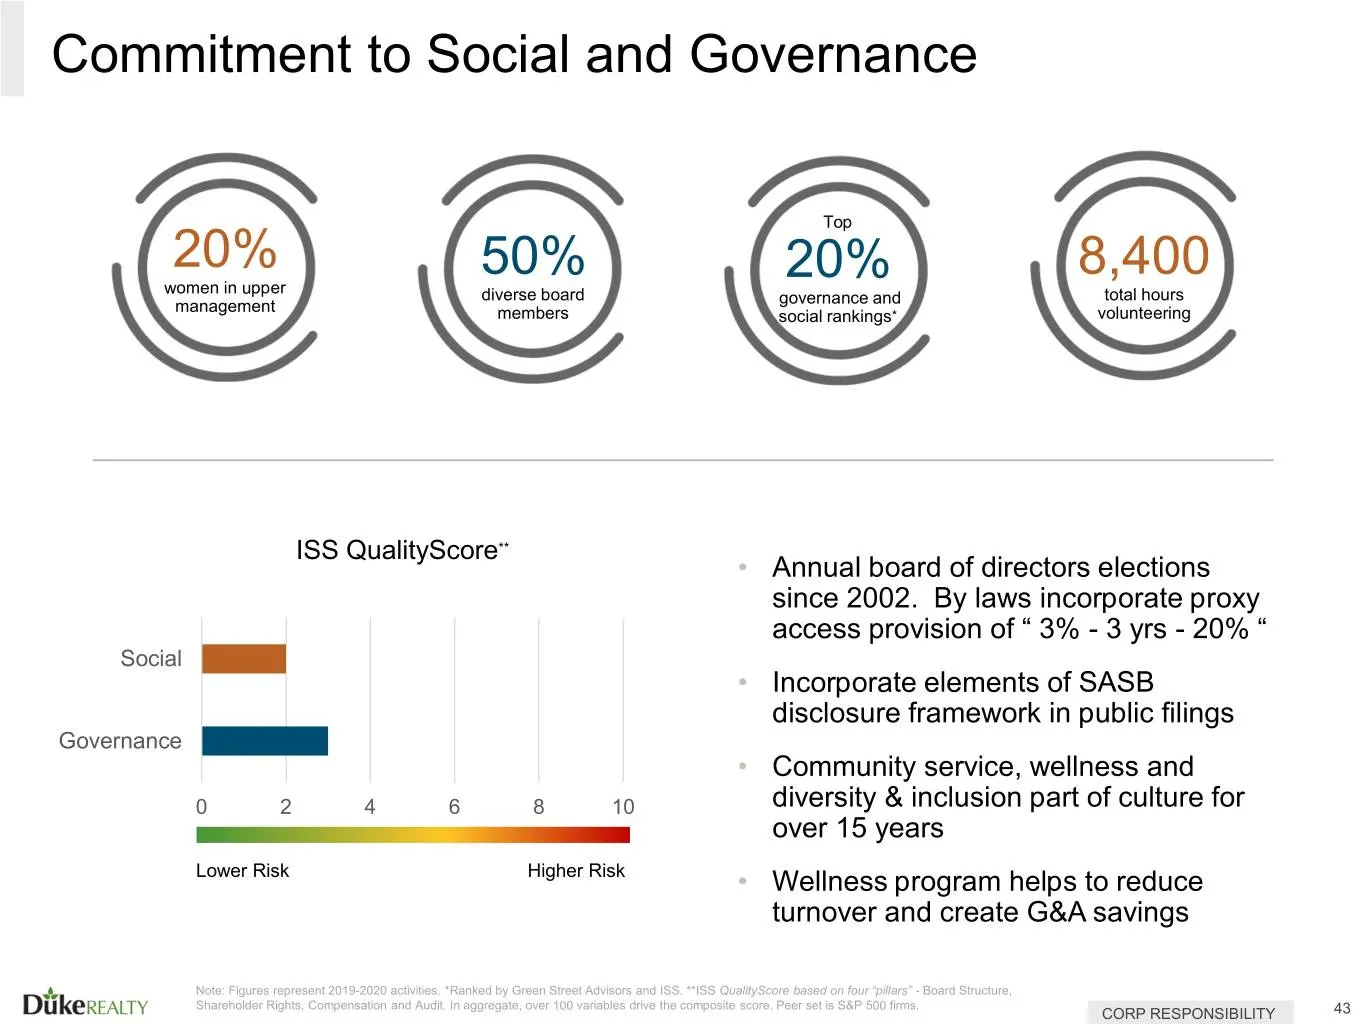
Commitment to Social and Governance Top 20% 50% 20% 8,400 women in upper diverse board total hours management governance and members social rankings* volunteering ISS QualityScore** • Annual board of directors elections since 2002. By laws incorporate proxy access provision of “ 3% - 3 yrs - 20% “ S
Slide 44: Industry Recognitions & Affiliations
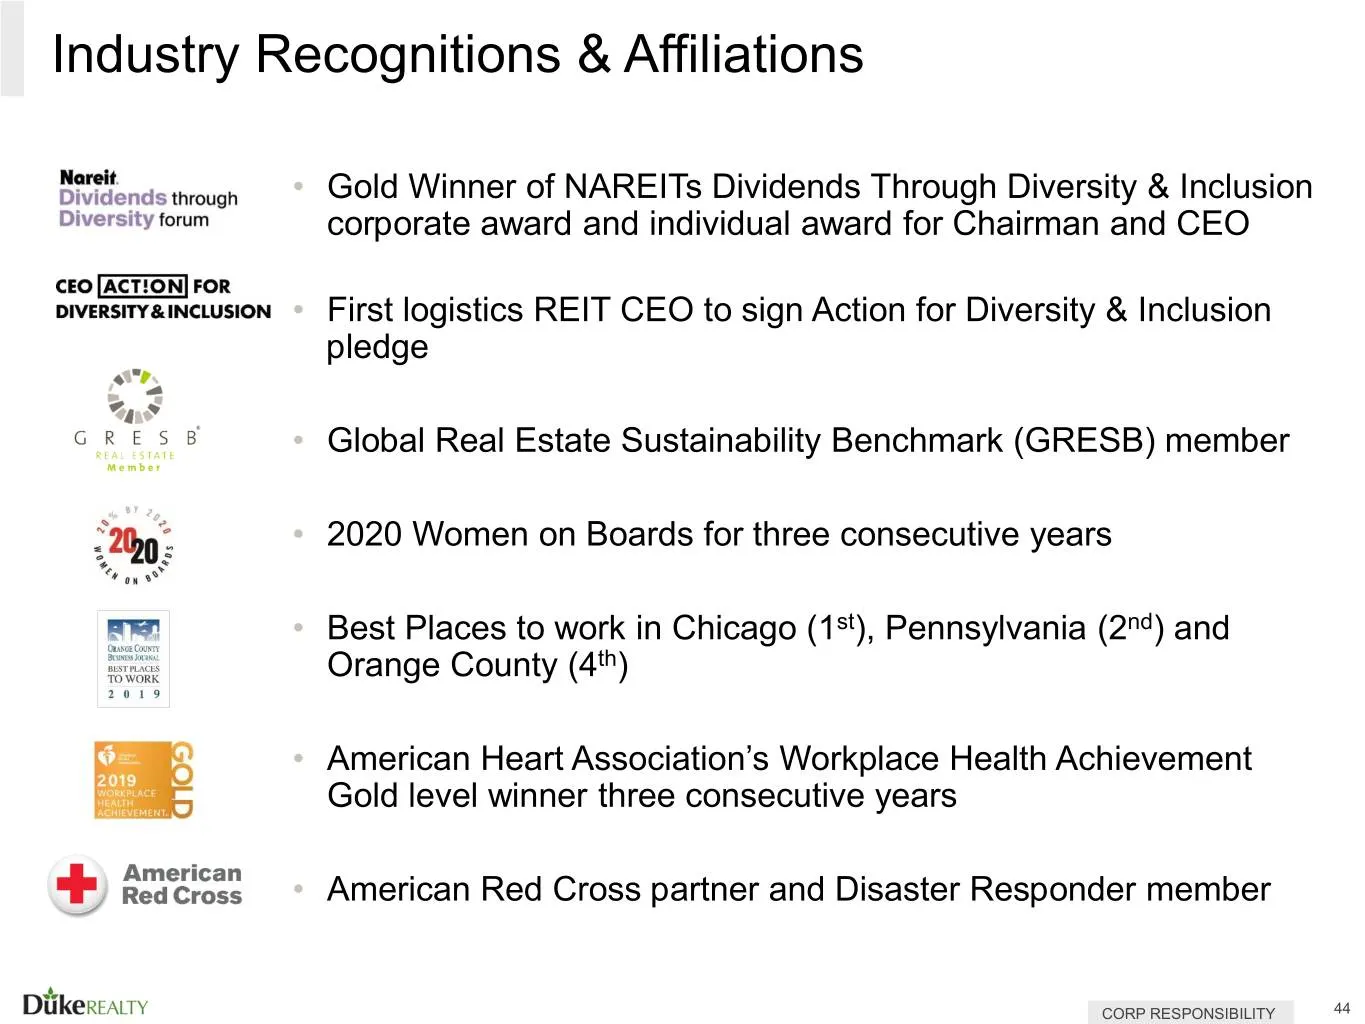
Industry Recognitions & Affiliations • Gold Winner of NAREITs Dividends Through Diversity & Inclusion corporate award and individual award for Chairman and CEO • First logistics REIT CEO to sign Action for Diversity & Inclusion pledge • Global Real Estate Sustainability Benchmark (GRESB) member • 20
Slide 45: Why Duke Realty?
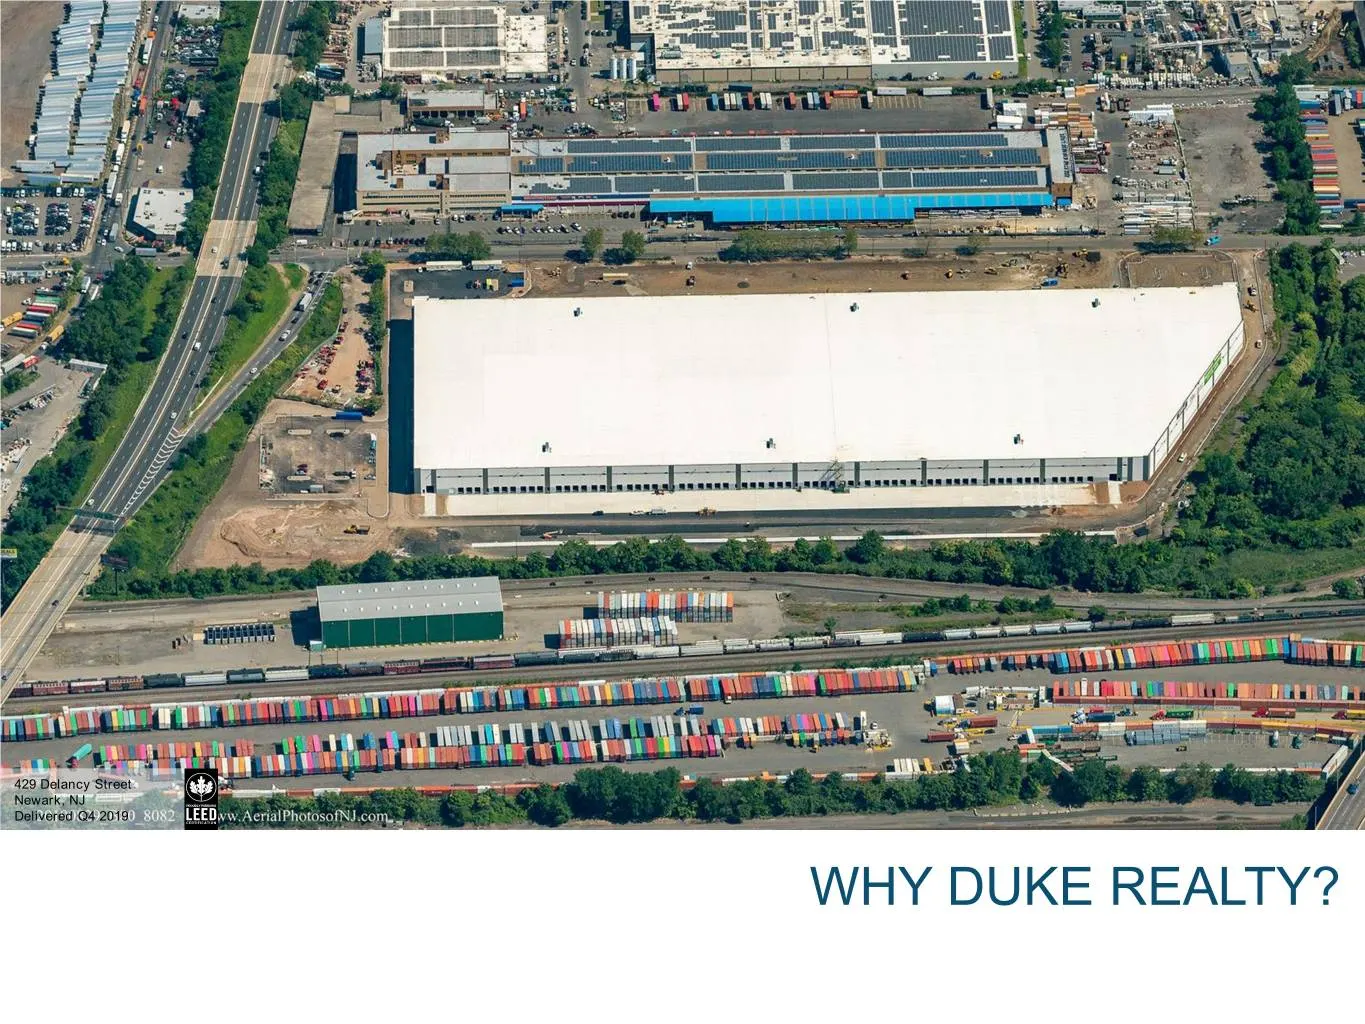
429 Delancy Street Newark, NJ Delivered Q4 2019 WHY DUKE REALTY?
Slide 46: Strong Relative Portfolio Performance and Upside Potential
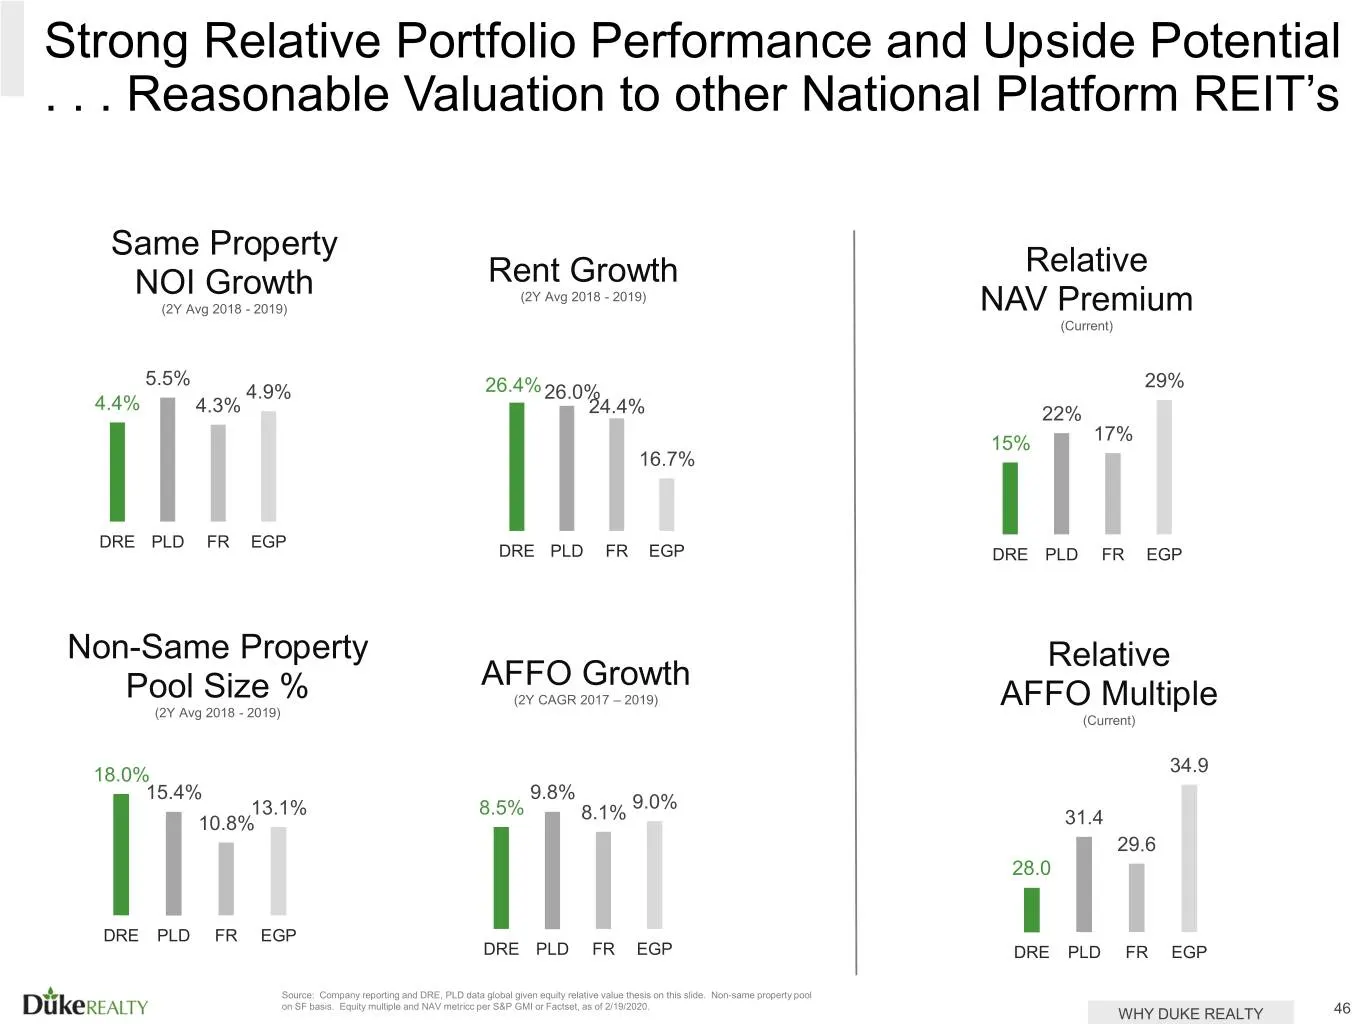
Strong Relative Portfolio Performance and Upside Potential . . . Reasonable Valuation to other National Platform REIT’s Same Property Rent Growth Relative NOI Growth (2Y Avg 2018 - 2019) (2Y Avg 2018 - 2019) NAV Premium (Current) 5.5% 29% 4.9% 26.4%26.0% 4.4% 4.3% 24.4% 22% 15% 17% 16.7% DRE PLD FR
Slide 47: The Leading Domestic-only Logistics REIT
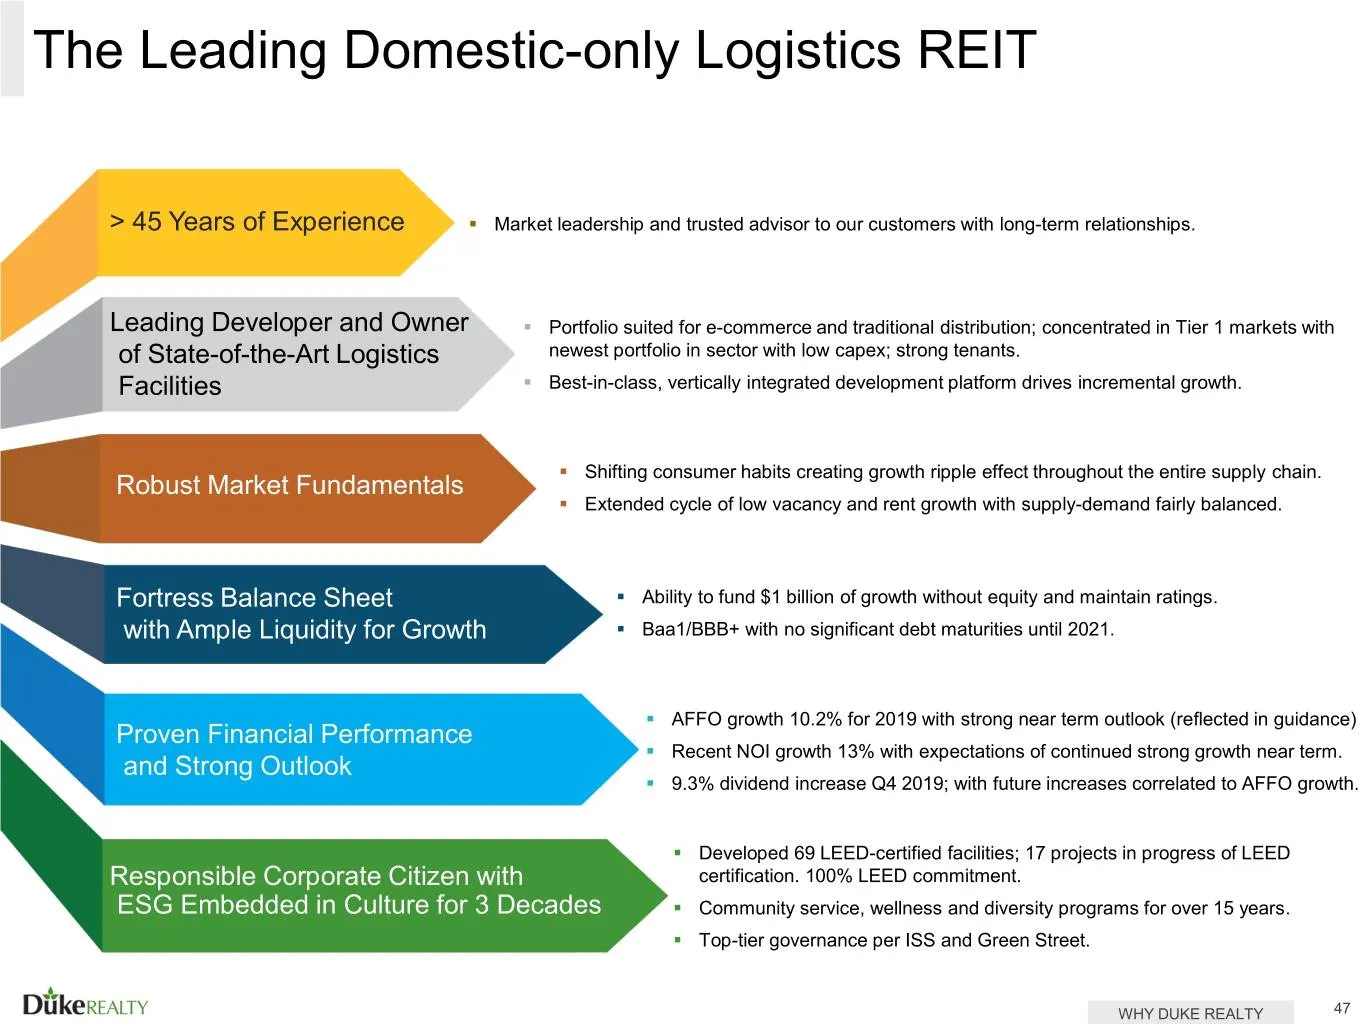
The Leading Domestic-only Logistics REIT > 45 Years of Experience . Market leadership and trusted advisor to our customers with long-term relationships. Leading Developer and Owner . Portfolio suited for e-commerce and traditional distribution; concentrated in Tier 1 markets with of State-of-the-Art
Slide 48: 2020 Range of Estimates
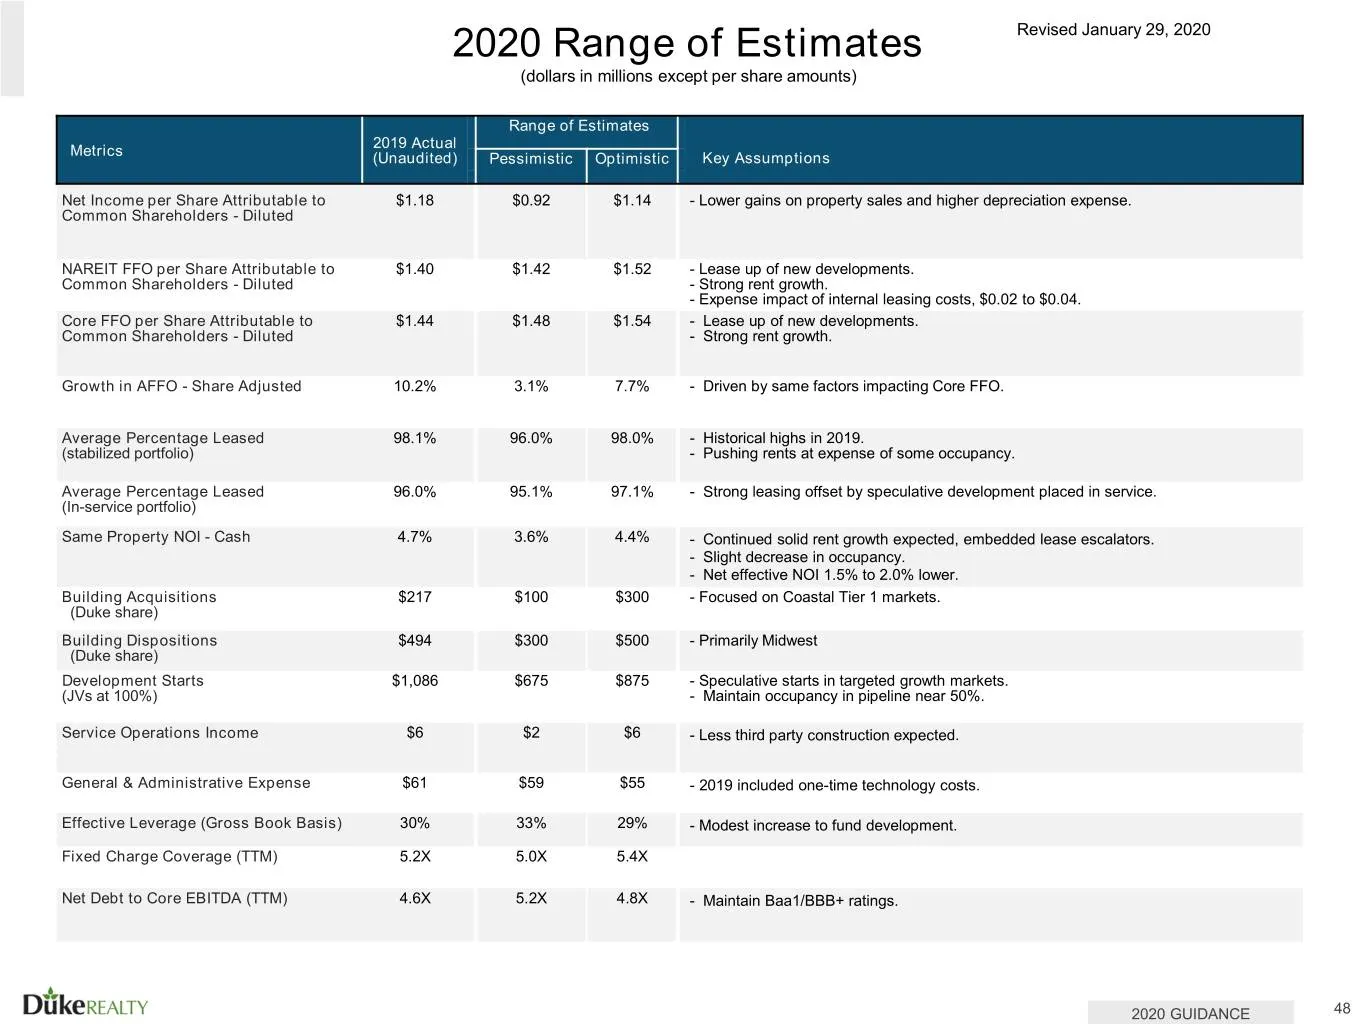
2020 Range of Estimates Revised January 29, 2020 (dollars in millions except per share amounts) Range of Estimates 2019 Actual Metrics (Unaudited) Pessimistic Optimistic Key Assumptions Net Income per Share Attributable to $1.18 $0.92 $1.14 - Lower gains on property sales and higher depreciation exp
Slide 49: Definitions
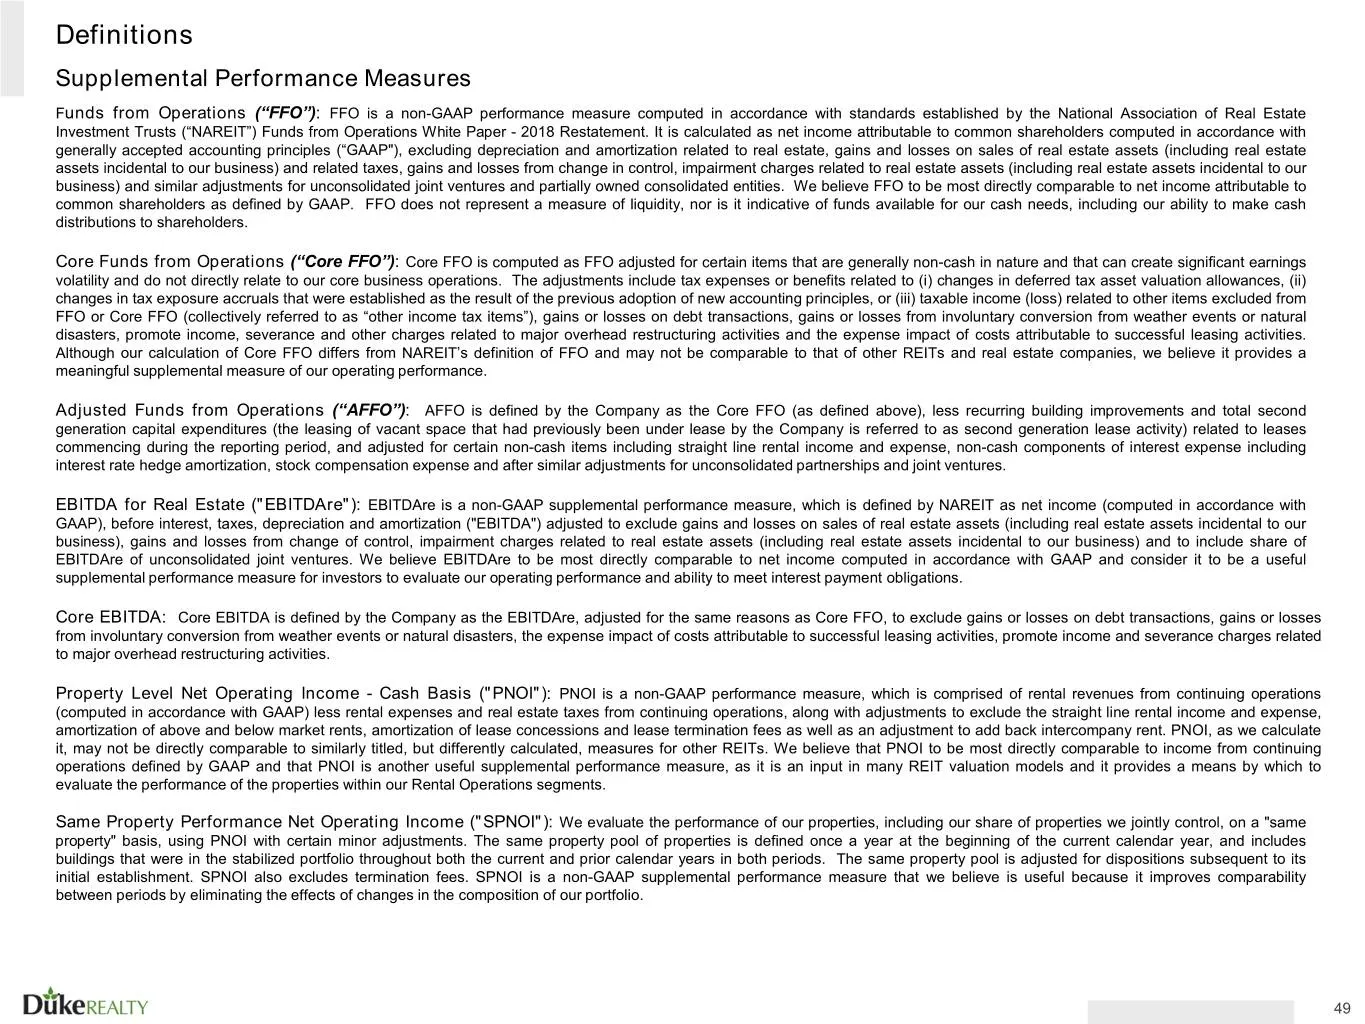
Definitions Supplemental Performance Measures Funds from Operations (“FFO”): FFO is a non-GAAP performance measure computed in accordance with standards established by the National Association of Real Estate Investment Trusts (“NAREIT”) Funds from Operations White Paper - 2018 Restatement. It is cal
Slide 50: FFO, Core FFO and AFFO
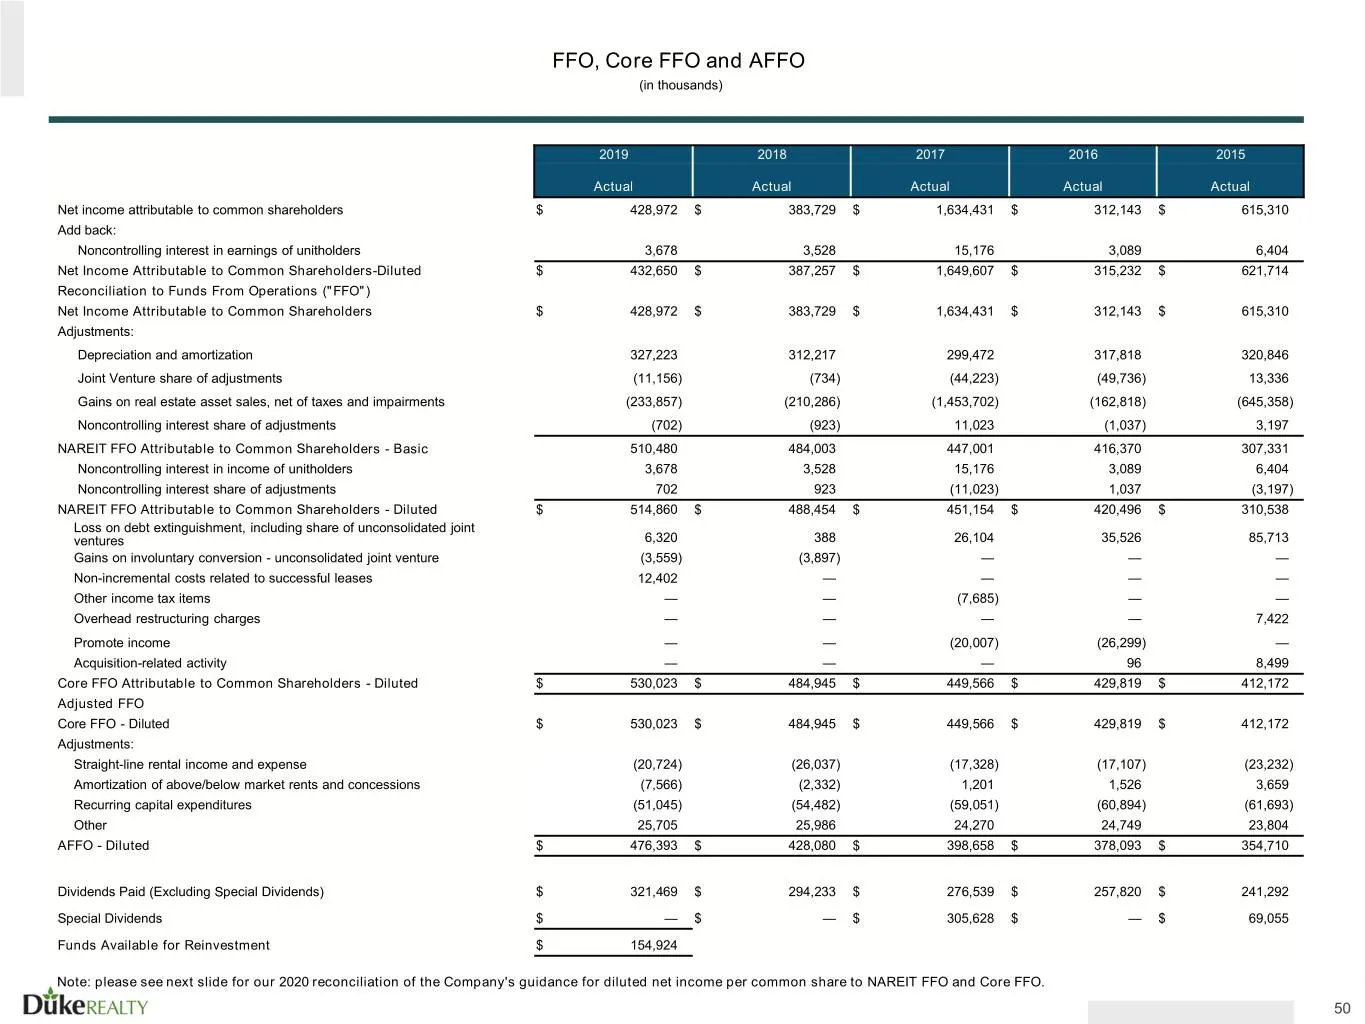
FFO, Core FFO and AFFO (in thousands) 2019 2018 2017 2016 2015 Actual Actual Actual Actual Actual Net income attributable to common shareholders $ 428,972 $ 383,729 $ 1,634,431 $ 312,143 $ 615,310 Add back: Noncontrolling interest in earnings of unitholders 3,678 3,528 15,176 3,089 6,404 Net Income
Slide 51: Reconciliation of 2020 FFO Per Diluted Share Guidance
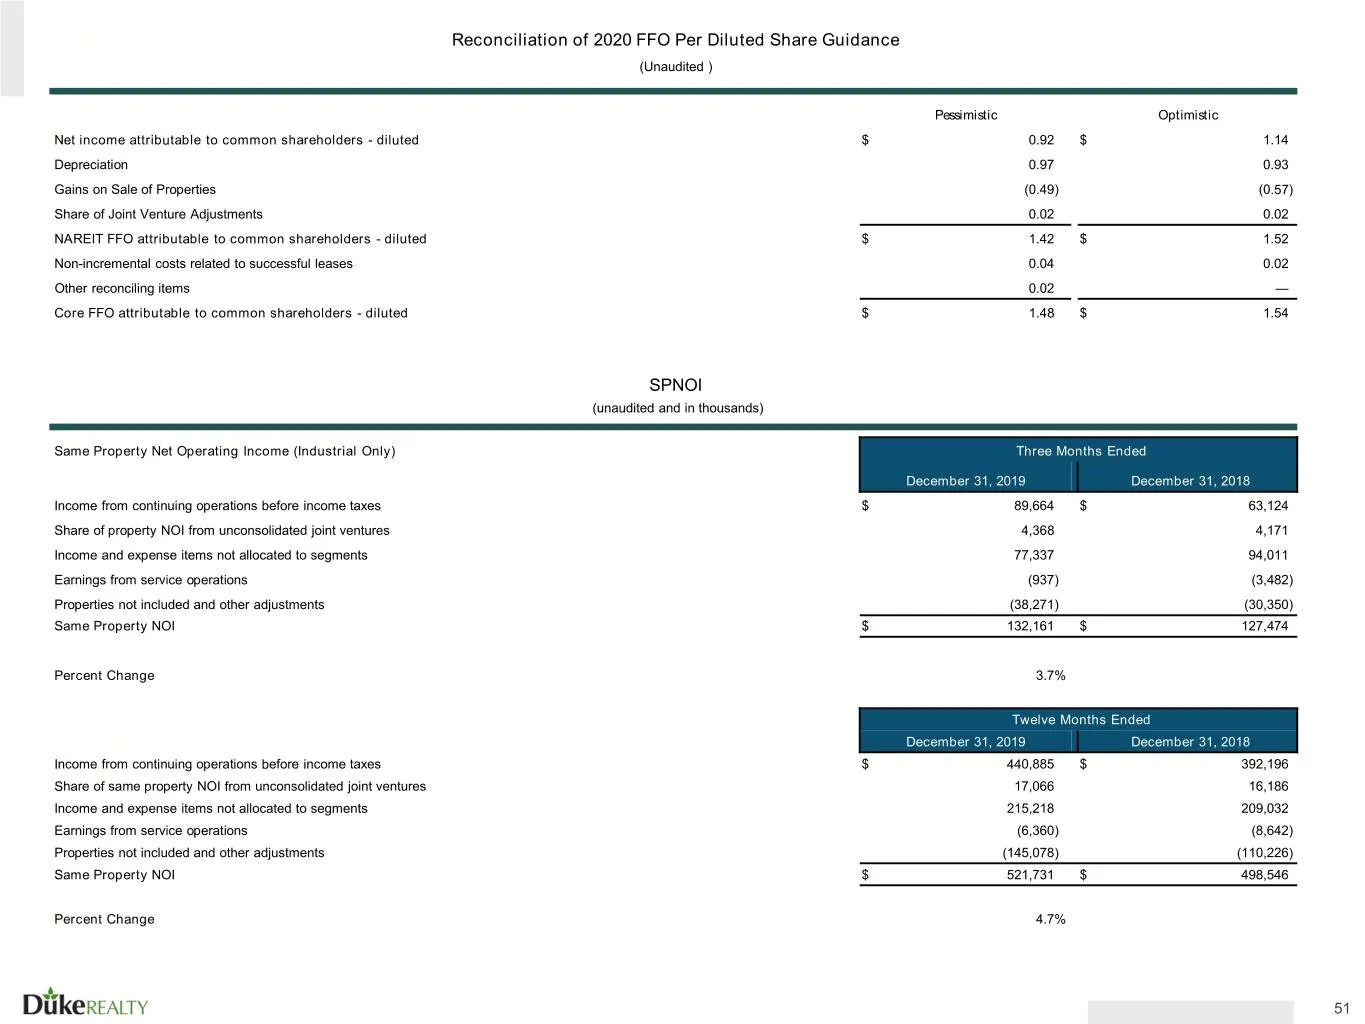
Reconciliation of 2020 FFO Per Diluted Share Guidance (Unaudited ) Pessimistic Optimistic Net income attributable to common shareholders - diluted $ 0.92 $ 1.14 Depreciation 0.97 0.93 Gains on Sale of Properties (0.49) (0.57) Share of Joint Venture Adjustments 0.02 0.02 NAREIT FFO attributable to co
Source: SEC EDGAR · 8-K filed Feb 25, 2020
More decks from Duke Realty Corporation
 Merger or Acquisition (June 2022)14 slides · Jun 13, 2022
 Investor Presentation (June 2021)58 slides · Jun 7, 2021
 Investor Presentation (May 2021)44 slides · May 10, 2021
 Investor Presentation (February 2021)58 slides · Feb 22, 2021
 NAREIT REITworld Virtual Investor Conference 202056 slides · Nov 16, 2020
 B of A Securities 2020 Global Real Estate Conference56 slides · Sep 15, 2020