Bridge Capital — Sandler O'Neill + Partners West Coast Financial Services Conference (March 2012)
15 slides from Bridge Capital's conference presentation, Mar 6, 2012

Slide 1: Investor Update – 4th Quarter 2011
Daniel P. Myers President Chief Executive Officer Director Thomas A. Sa Executive Vice President Chief Financial Officer Chief Strategy Officer NASDAQ: BBNK WWW.BRIDGECAPITALHOLDINGS.COM Bridge Capital Holdings Investor Update – 4 th Quarter 2011 SANDLER O'NEILL + PARTNERS L.P. WEST COAST FINANCIAL
Slide 2: Forward Looking Statements
Forward Looking Statements Certain matters discussed herein constitute forward - looking statements within the meaning of the Private Securities Litigation Reform Act of 1995 , and are subject to the safe harbors created by that Act . Forward - looking statements describe future plans, strategies, a
Slide 3: Financial Highlights
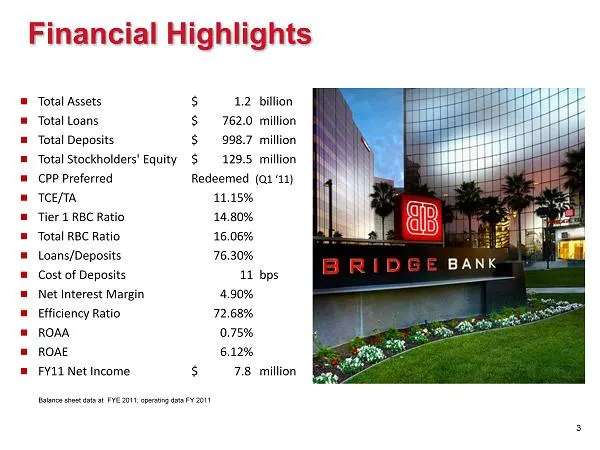
■ Total Assets $ 1.2 billion ■ Total Loans $ 762.0 million ■ Total Deposits $ 998.7 million ■ Total Stockholders' Equity $ 129.5 million ■ CPP Preferred Redeemed (Q1 ‘11) ■ TCE/TA 11.15% ■ Tier 1 RBC Ratio 14.80% ■ Total RBC Ratio 16.06% ■ Loans/Deposits 76.30% ■ Cost of Deposits 11 bps ■ Net Intere
Slide 4: Core Market: Silicon Valley
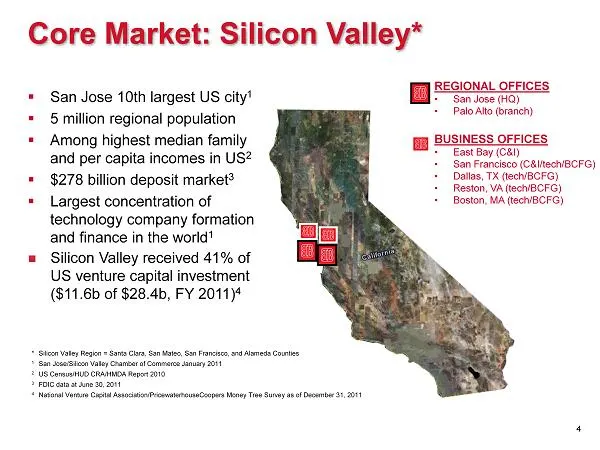
Core Market: Silicon Valley* ▪ San Jose 10th largest US city 1 ▪ 5 million regional population ▪ Among highest median family and per capita incomes in US 2 ▪ $278 billion deposit market 3 ▪ Largest concentration of technology company formation and finance in the world 1 Silicon Valley received 41%
Slide 5: Business Banking Focus
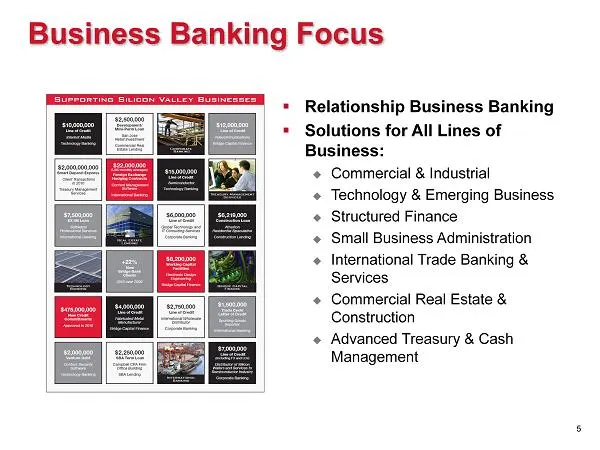
Business Banking Focus ▪ Relationship Business Banking ▪ Solutions for All Lines of Business: Commercial & Industrial Technology & Emerging Business Structured Finance Small Business Administration I nternational Trade Banking & Services Commercial Real Estate & Construction Advanced T
Slide 6: BBNK 2011 Summary
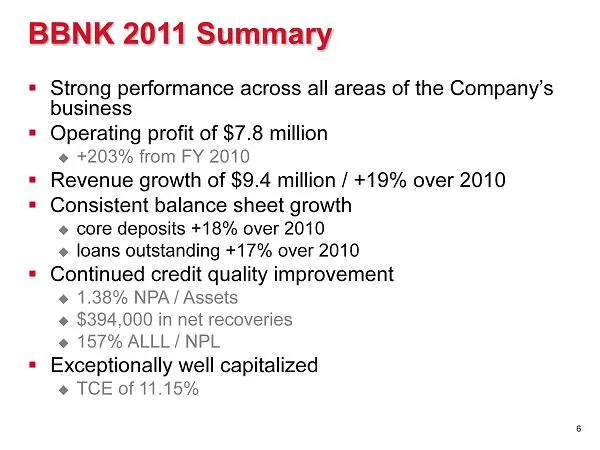
BBNK 2011 Summary ▪ Strong performance across all areas of the Company’s business ▪ Operating profit of $7.8 million +203% from FY 2010 ▪ Revenue growth of $9.4 million / +19% over 2010 ▪ Consistent balance sheet growth core deposits +18% over 2010 loans outstanding +17% over 2010 ▪ Continued
Slide 7: Expanding Market Presence
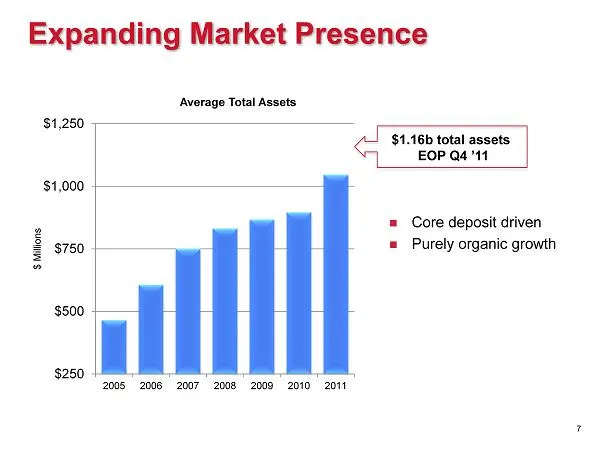
Expanding Market Presence $250 $500 $750 $1,000 $1,250 2005 2006 2007 2008 2009 2010 2011 $ Millions Average Total Assets Core deposit driven Purely organic growth $1.16b total assets EOP Q4 ’11 7
Slide 8: Focus on Core Deposits
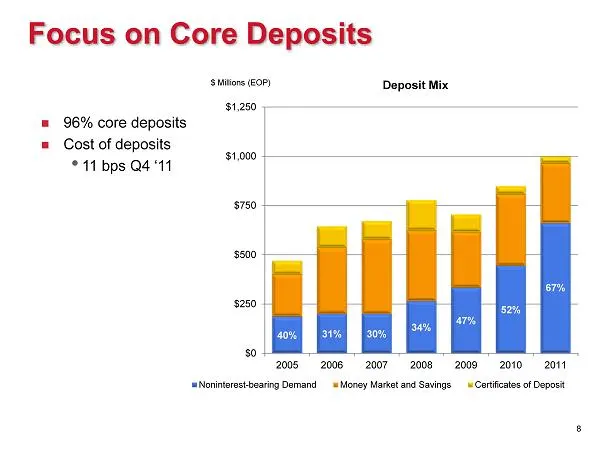
Focus on Core Deposits 40% 31% 30% 34% 47% 52% 67% $0 $250 $500 $750 $1,000 $1,250 2005 2006 2007 2008 2009 2010 2011 $ Millions (EOP) Deposit Mix Noninterest-bearing Demand Money Market and Savings Certificates of Deposit 96% core deposits Cost of deposits • 11 bps Q4 ‘11 8
Slide 9: True C&I Focus
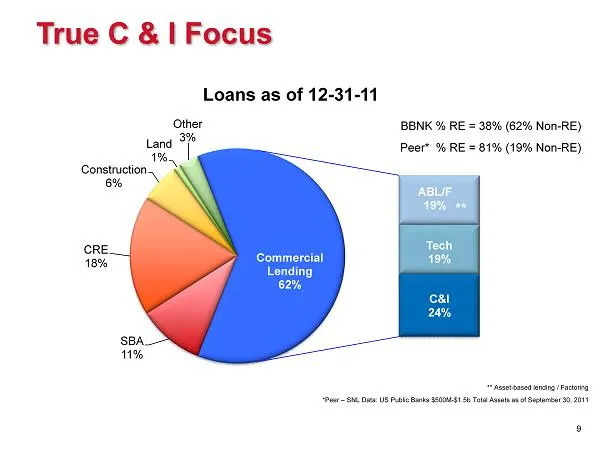
SBA 11% CRE 18% Construction 6% Land 1% Other 3% ABL/F 19% Tech 19% C&I 24% Commercial Lending 62% Loans as of 12 - 31 - 11 True C & I Focus BBNK % RE = 38% ( 62% Non - RE) Peer* % RE = 81% (19% Non - RE) * Peer – SNL Data: US Public Banks $500M - $1.5b Total Assets as of September 30, 2011 ** Asset
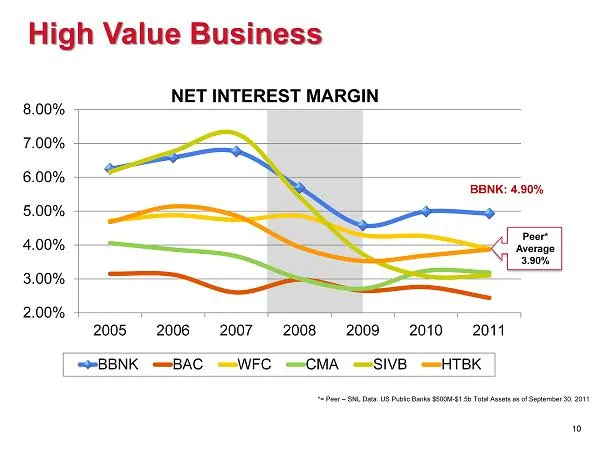
Slide 10: Net Interest Margin
2.00% 3.00% 4.00% 5.00% 6.00% 7.00% 8.00% 2005 2006 2007 2008 2009 2010 2011 NET INTEREST MARGIN BBNK BAC WFC CMA SIVB HTBK High Value Business Peer* Average 3.90% BBNK: 4.90% 10 *= Peer – SNL Data: US Public Banks $500M - $1.5b Total Assets as of September 30, 2011
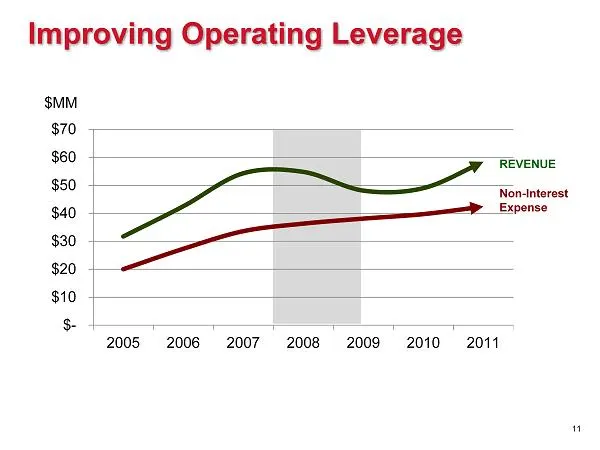
Slide 11: Improving Operating Leverage
$- $10 $20 $30 $40 $50 $60 $70 2005 2006 2007 2008 2009 2010 2011 $MM Improving Operating Leverage REVENUE Non - Interest Expense 11
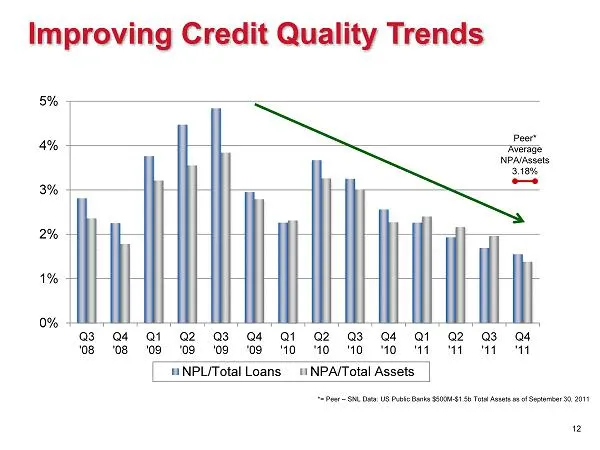
Slide 12: Improving Credit Quality Trends
Improving Credit Quality Trends 0% 1% 2% 3% 4% 5% Q3 '08 Q4 '08 Q1 '09 Q2 '09 Q3 '09 Q4 '09 Q1 '10 Q2 '10 Q3 '10 Q4 '10 Q1 '11 Q2 '11 Q3 '11 Q4 '11 NPL/Total Loans NPA/Total Assets Peer* Average NPA/Assets 3.18% *= Peer – SNL Data: US Public Banks $500M - $1.5b Total Assets as of September 30, 2011
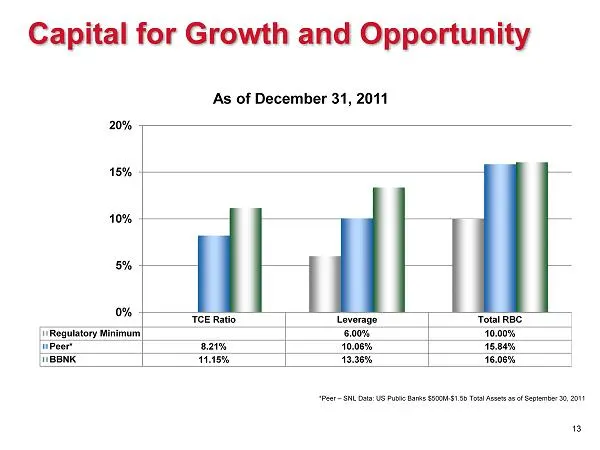
Slide 13: Capital for Growth and Opportunity
Capital for Growth and Opportunity * Peer – SNL Data: US Public Banks $500M - $1.5b Total Assets as of September 30, 2011 TCE Ratio Leverage Total RBC Regulatory Minimum 6.00% 10.00% Peer* 8.21% 10.06% 15.84% BBNK 11.15% 13.36% 16.06% 0% 5% 10% 15% 20% As of December 31, 2011 13
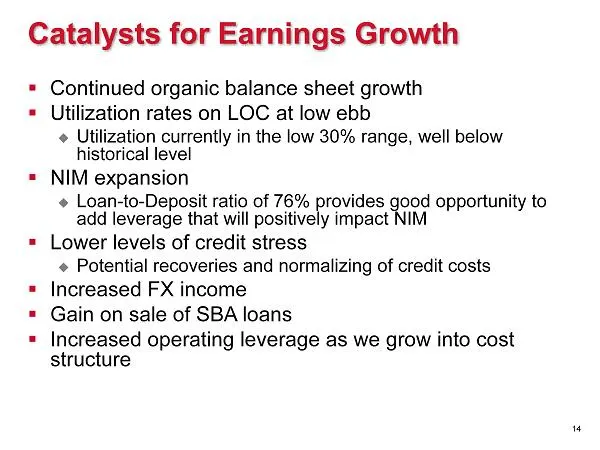
Slide 14: Catalysts for Earnings Growth
Catalysts for Earnings Growth ▪ Continued organic balance sheet growth ▪ Utilization rates on LOC at low ebb Utilization currently in the low 30% range, well below historical level ▪ NIM expansion Loan - to - Deposit ratio of 76% provides good opportunity to add leverage that will positively imp

Slide 15: Celebrating Years
Celebrating [I{0) Years icon Valley Grow!
Source: SEC EDGAR · 8-K filed Mar 6, 2012
More decks from Bridge Capital Holdings
 Merger or Acquisition (March 2015)11 slides · Mar 9, 2015
 Q4 2014 Earnings Presentation22 slides · Feb 4, 2015
 Q2 2014 Earnings Presentation23 slides · Jul 29, 2014
 Shareholder Meeting (May 2014)19 slides · May 28, 2014
 Q1 2014 Earnings Presentation23 slides · May 13, 2014
 Q4 2013 Earnings Presentation24 slides · Feb 5, 2014