Denbury — Denbury Resources — Investor Day (November 2009)
103 slides from Denbury's investor day presentation, Nov 13, 2009
Slide 1: Fall Analyst Meeting Presentation - November 2009
Denbury Resources Inc. Fall Analyst Meeting Presentation - November 2009
Slide 2: Corporate Information and Forward-Looking Statements
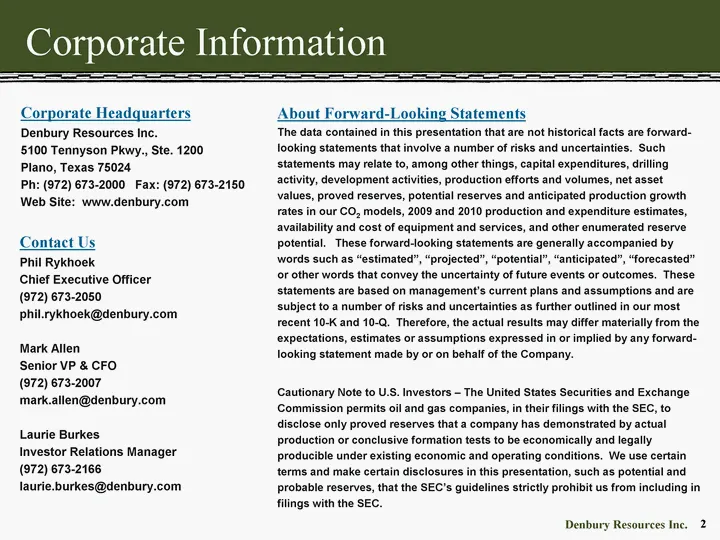
Corporate Headquarters Denbury Resources Inc. 5100 Tennyson Pkwy., Ste. 1200 Plano, Texas 75024 Ph: (972) 673-2000 Fax: (972) 673-2150 Web Site: www.denbury.com Corporate Information About Forward-Looking Statements The data contained in this presentation that are not historical facts are forward- l
Slide 3: Additional Information
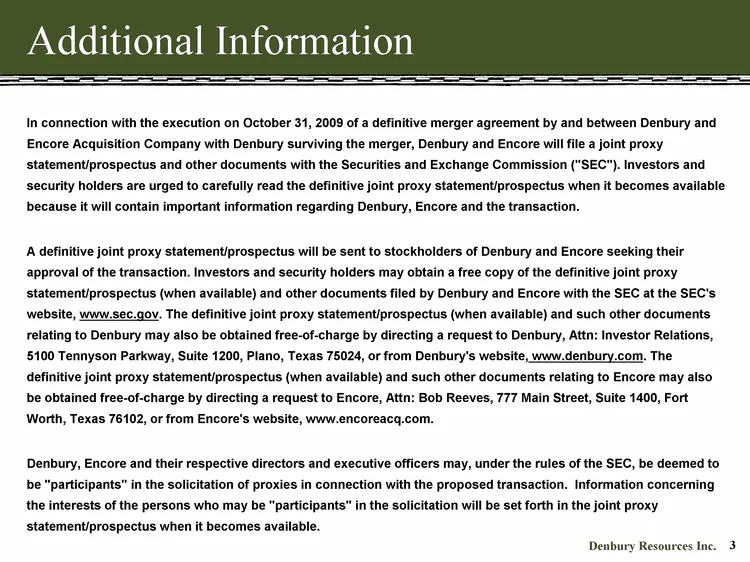
3 Additional Information In connection with the execution on October 31, 2009 of a definitive merger agreement by and between Denbury and Encore Acquisition Company with Denbury surviving the merger, Denbury and Encore will file a joint proxy statement/prospectus and other documents with the Securit
Slide 4: Table of Contents
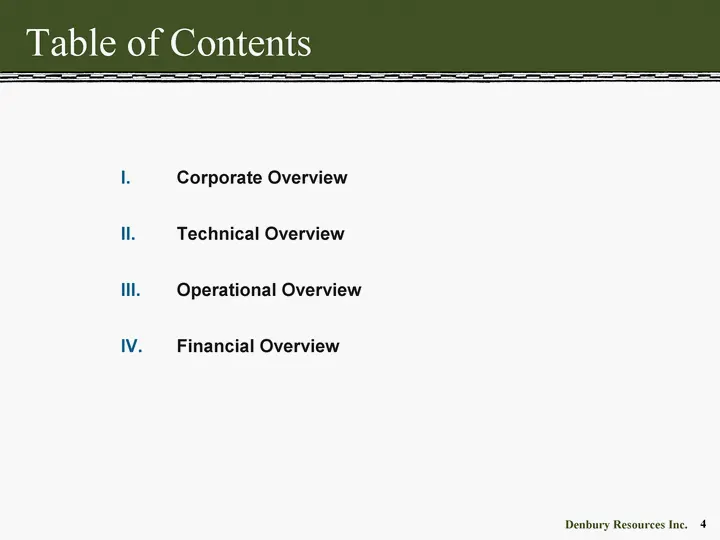
Corporate Overview Technical Overview Operational Overview Financial Overview Table of Contents
Slide 5: Corporate Overview
Corporate Overview Denbury Resour
Slide 6: What Does Denbury Do?
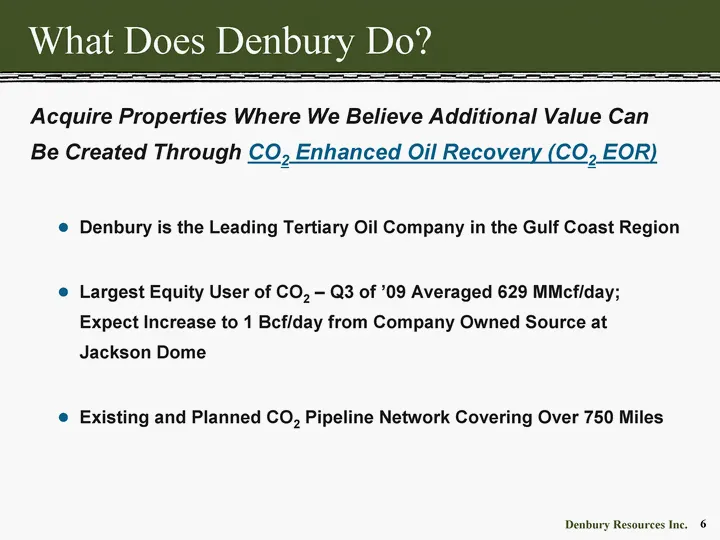
What Does Denbury Do? Acquire Properties Where We Believe Additional Value Can Be Created Through CO2 Enhanced Oil Recovery (CO2 EOR) Denbury is the Leading Tertiary Oil Company in the Gulf Coast Region Largest Equity User of CO2 - Q3 of '09 Averaged 629 MMcf/day; Expect Increase to 1 Bcf/day from C
Slide 7: Company Snapshot
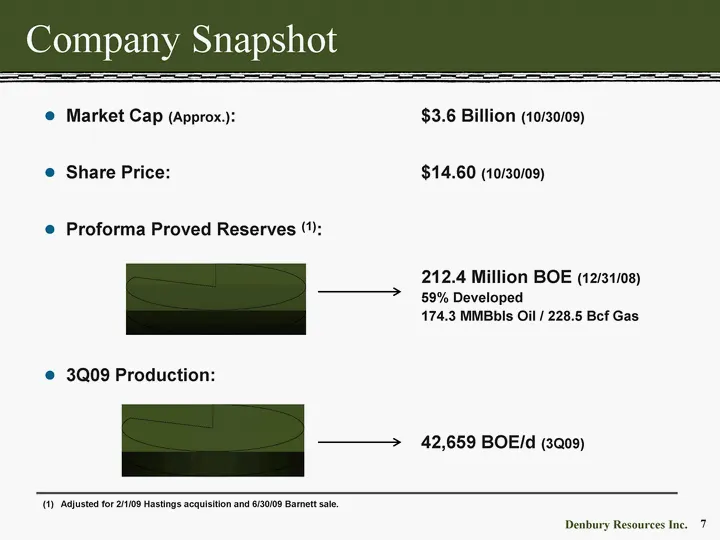
Company Snapshot Market Cap (Approx.): $3.6 Billion (10/30/09) Share Price: $14.60 (10/30/09) Proforma Proved Reserves (1): 212.4 Million BOE (12/31/08) 59% Developed 174.3 MMBbls Oil / 228.5 Bcf Gas 3Q09 Production: 42,659 BOE/d (3Q09) Adjusted for 2/1/09 Hastings acquisition and 6/30/09 Barnett sa
Slide 8: Why Invest in Denbury?
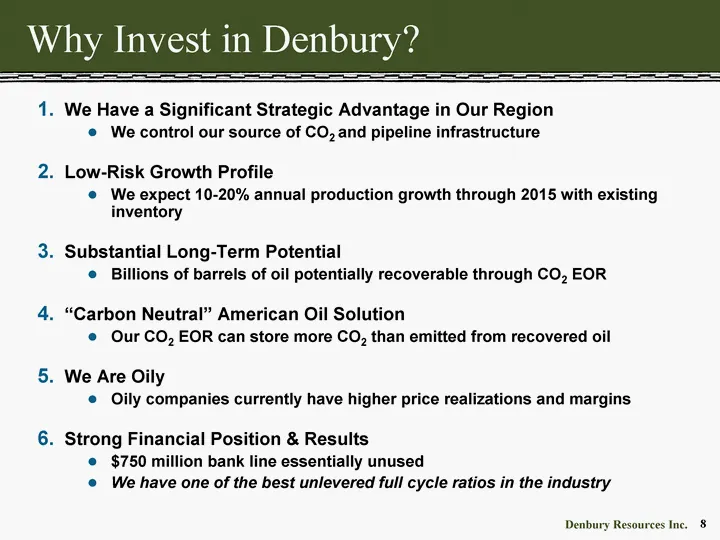
Why Invest in Denbury? We Have a Significant Strategic Advantage in Our Region We control our source of CO2 and pipeline infrastructure Low-Risk Growth Profile We expect 10-20% annual production growth through 2015 with existing inventory Substantial Long-Term Potential Billions of barrels of oil po
Slide 9: Encore Transaction Summary
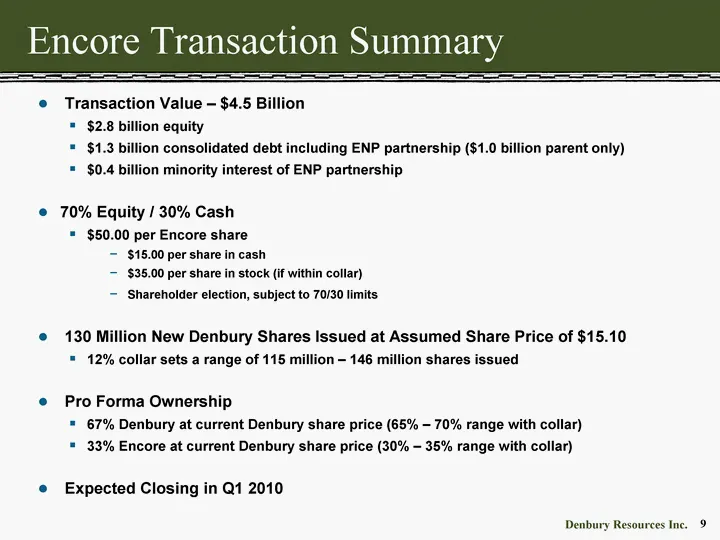
9 Encore Transaction Summary Transaction Value - $4.5 Billion $2.8 billion equity $1.3 billion consolidated debt including ENP partnership ($1.0 billion parent only) $0.4 billion minority interest of ENP partnership 70% Equity / 30% Cash $50.00 per Encore share $15.00 per share in cash $35.00 per sh
Slide 10: Transaction Rationale - EOR
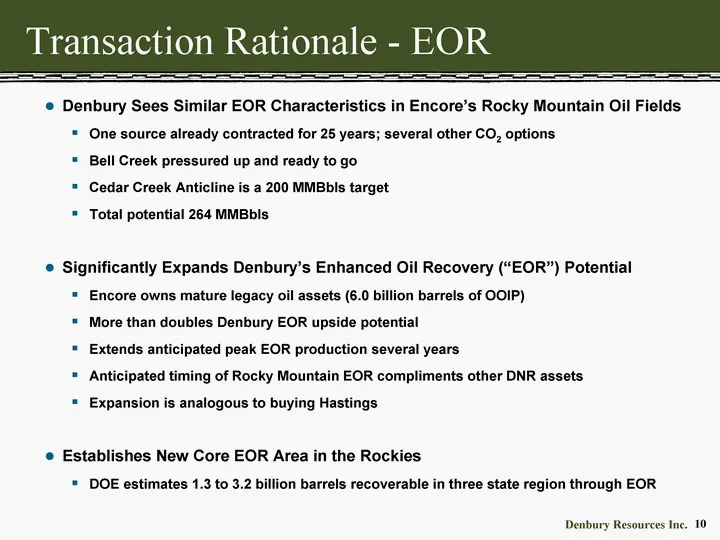
10 Transaction Rationale - EOR Denbury Sees Similar EOR Characteristics in Encore's Rocky Mountain Oil Fields One source already contracted for 25 years; several other CO2 options Bell Creek pressured up and ready to go Cedar Creek Anticline is a 200 MMBbls target Total potential 264 MMBbls Signific
Slide 11: Transferring Gulf Coast CO2 Success To Rockies
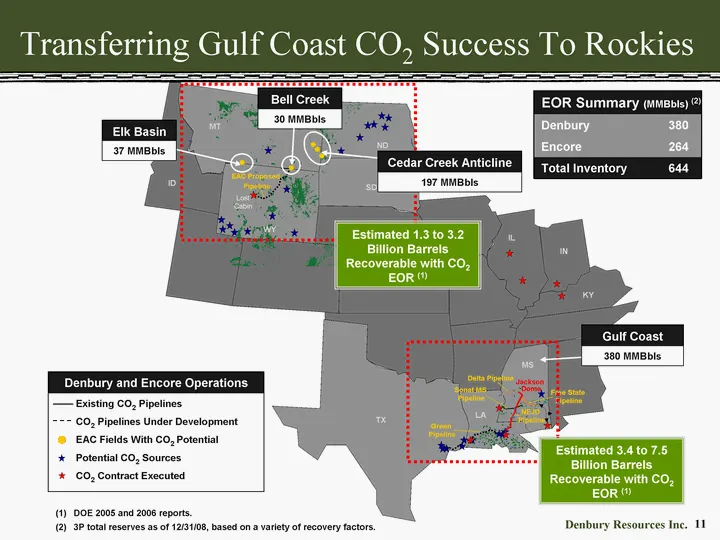
Green Pipeline Jackson Dome Free State Pipeline Delta Pipeline NEJD Pipeline Sonat MS Pipeline ND SD Lost Cabin ID MT WY TX LA MS IL IN KY 11 Transferring Gulf Coast CO2 Success To Rockies CO2 Pipelines Under Development CO2 Contract Executed Denbury and Encore Operations Existing CO2 Pipelines EAC
Slide 12: Transaction Rationale - con't
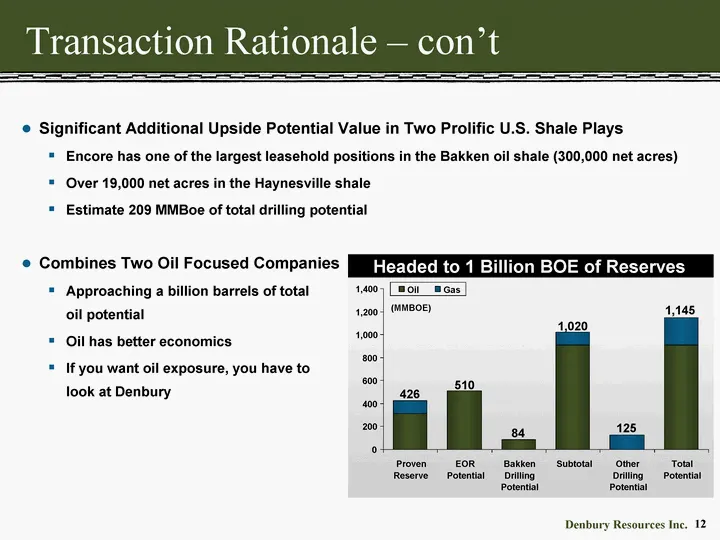
12 Transaction Rationale - con't Significant Additional Upside Potential Value in Two Prolific U.S. Shale Plays Encore has one of the largest leasehold positions in the Bakken oil shale (300,000 net acres) Over 19,000 net acres in the Haynesville shale Estimate 209 MMBoe of total drilling potential
Slide 13: Transaction Rationale - con't
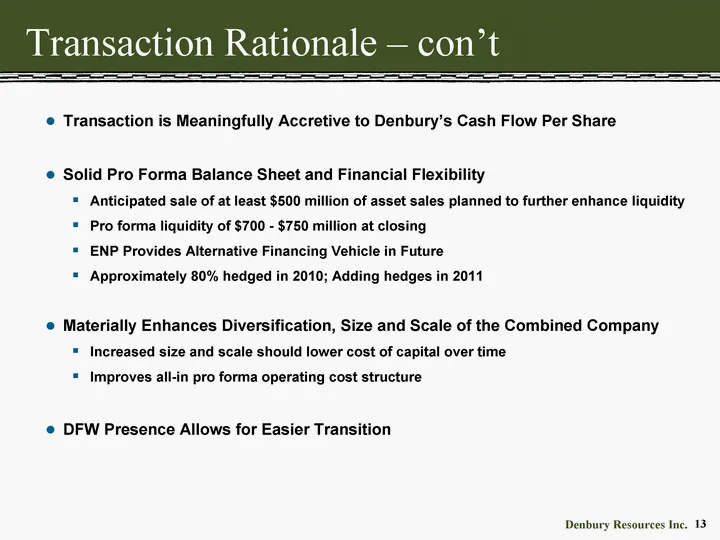
13 Transaction Rationale - con't Transaction is Meaningfully Accretive to Denbury's Cash Flow Per Share Solid Pro Forma Balance Sheet and Financial Flexibility Anticipated sale of at least $500 million of asset sales planned to further enhance liquidity Pro forma liquidity of $700 - $750 million at
Slide 14: Increase in Size & Scale
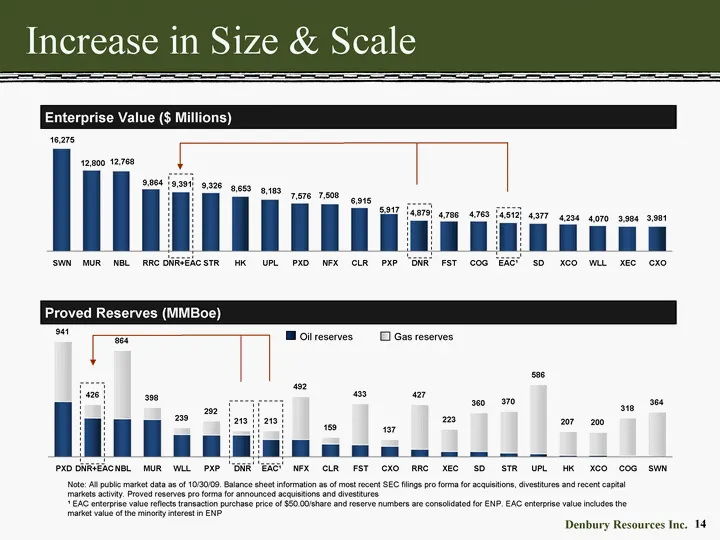
14 Increase in Size & Scale Enterprise Value ($ Millions) Proved Reserves (MMBoe) Oil reserves Gas reserves Note: All public market data as of 10/30/09. Balance sheet information as of most recent SEC filings pro forma for acquisitions, divestitures and recent capital markets activity. Proved reserv
Slide 15: 15 CO2 Projects - Total Potential Tertiary Oil Reserves
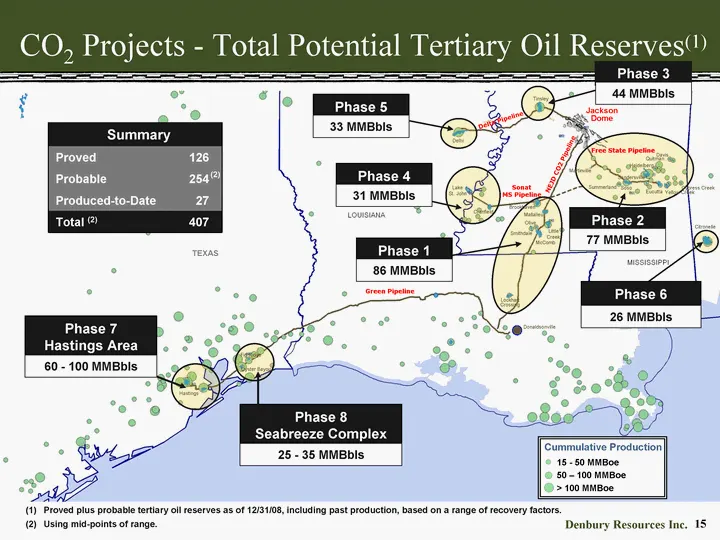
Jackson Dome NEJD CO2 Pipeline Sonat MS Pipeline Delta Pipeline Green Pipeline Citronelle Phase 6 26 MMBbls Phase 2 77 MMBbls Phase 3 44 MMBbls Phase 5 33 MMBbls Phase 4 31 MMBbls Phase 1 86 MMBbls Phase 8 Seabreeze Complex 25 - 35 MMBbls Phase 7 Hastings Area 60 - 100 MMBbls Summary Summary Proved
Slide 16: Encore Rockies CO2 Projects
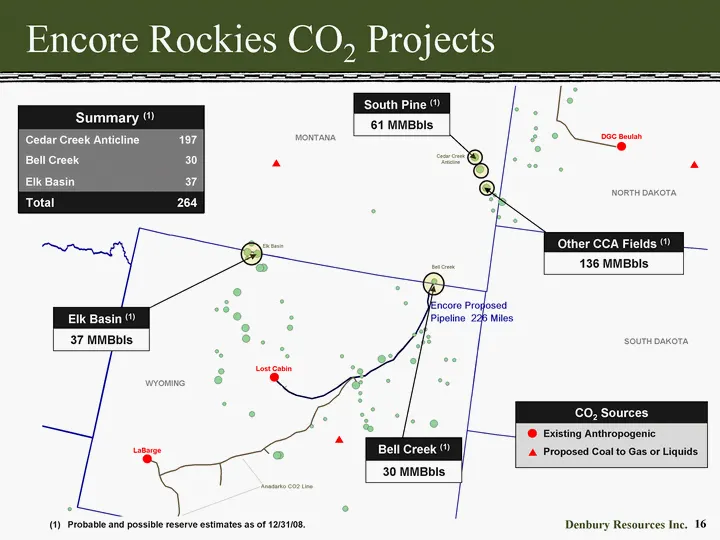
Encore Rockies CO2 Projects MONTANA NORTH DAKOTA SOUTH DAKOTA WYOMING Elk Basin (1) 37 MMBbls South Pine (1) 61 MMBbls Cedar Creek Anticline Elk Basin Bell Creek (1) 30 MMBbls Summary (1) Summary (1) Cedar Creek Anticline 197 Bell Creek 30 Elk Basin 37 Total 264 LaBarge Lost Cabin DGC Beulah Propose
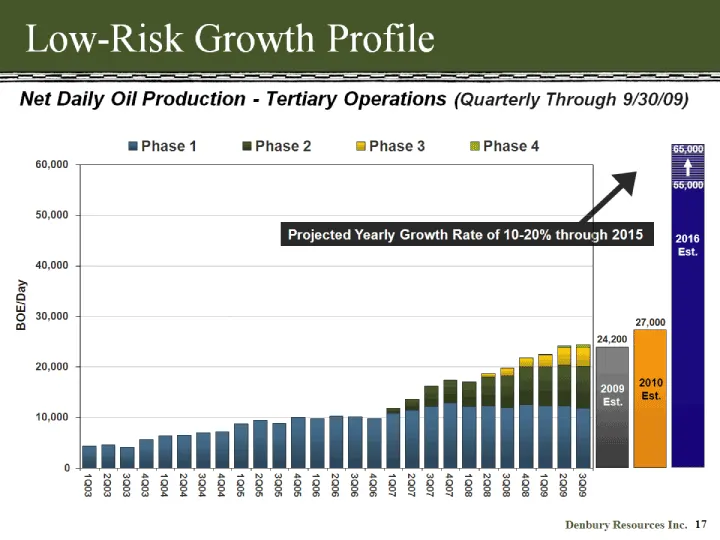
Slide 17: Low-Risk Growth Profile
BOE/Day 24,200 2009 Est. Net Daily Oil Production - Tertiary Operations (Quarterly Through 9/30/09) Low-Risk Growth Profile Projected Yearly Growth Rate of 10-20% through 2015 55,000 65,000 2016 Est. 27,000 2010 Est. 0 10,000 20,000 30,000 40,000 50,000 60,000 1Q03 2Q03 3Q03 4Q03 1Q04 2Q04 3Q04 4Q04
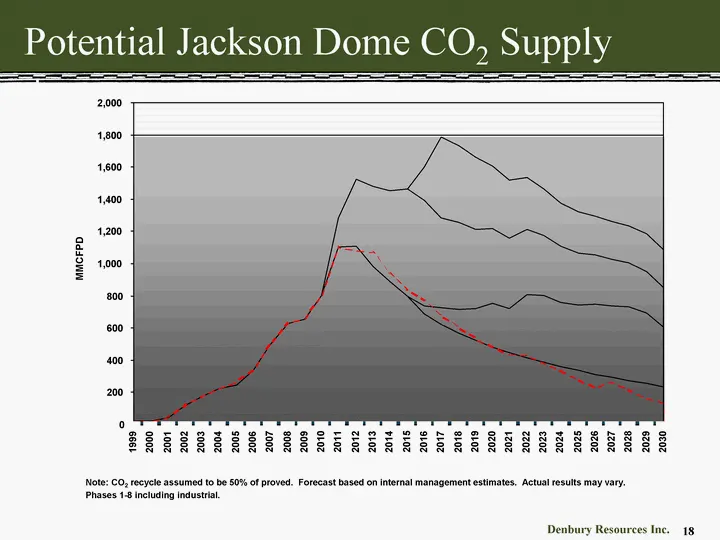
Slide 18: Potential Jackson Dome CO2 Supply
Note: CO2 recycle assumed to be 50% of proved. Forecast based on internal management estimates. Actual results may vary. Phases 1-8 including industrial. Potential Jackson Dome CO2 Supply Jackson Dome Proved 5.6 TCF (as of 1/1/09) CO2 Recycle 2.8 TCF (Proved Only) Phases 1-8 Probable 3 TCF Possible
Slide 19: Potential Sources of Additional CO2
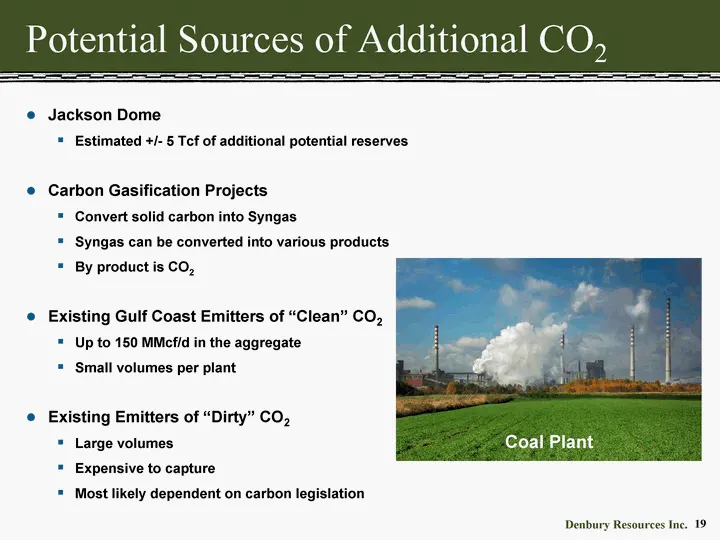
Potential Sources of Additional CO2 Jackson Dome Estimated +/- 5 Tcf of additional potential reserves Carbon Gasification Projects Convert solid carbon into Syngas Syngas can be converted into various products By product is CO2 Existing Gulf Coast Emitters of "Clean" CO2 Up to 150 MMcf/d in the aggr
Slide 20: Denbury Preliminary 2010 Capital Budget
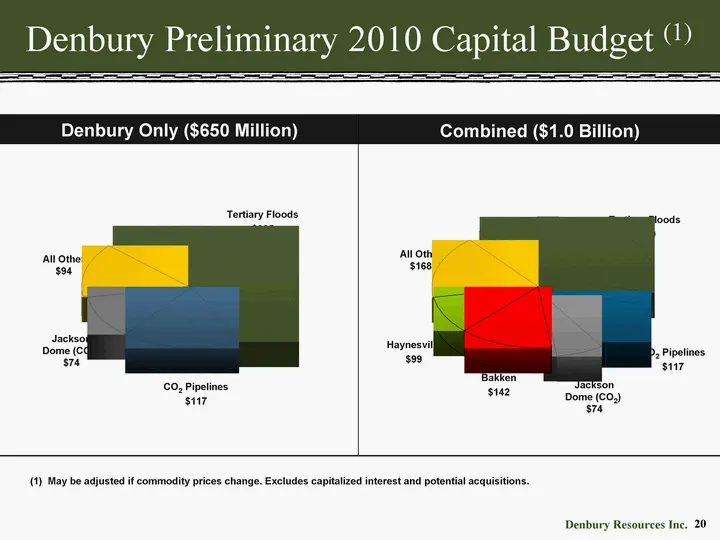
20 Denbury Preliminary 2010 Capital Budget (1) Denbury Only ($650 Million) Combined ($1.0 Billion) CO2 Pipelines $117 Tertiary Floods $365 All Other $94 Jackson Dome (CO2) $74 CO2 Pipelines $117 Tertiary Floods $400 All Other $168 Jackson Dome (CO2) $74 (1) May be adjusted if commodity prices change
Slide 21: Technical Overview
Technical Overview Denbury Resources Inc. 21
Slide 22: CO2 Operations
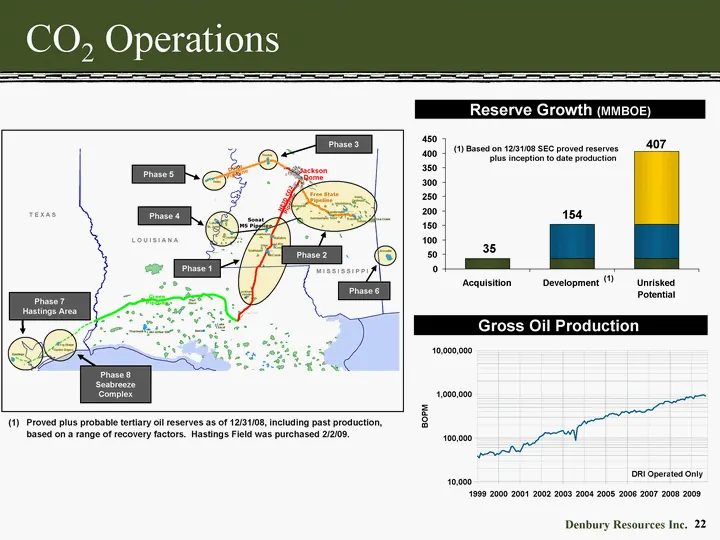
CO2 Operations Gross Oil Production Proved plus probable tertiary oil reserves as of 12/31/08, including past production, based on a range of recovery factors. Hastings Field was purchased 2/2/09. (1) Based on 12/31/08 SEC proved reserves plus inception to date production Reserve Growth (MMBOE) (1)
Slide 23: Phase 1 CO2 Area Gross Oil Production
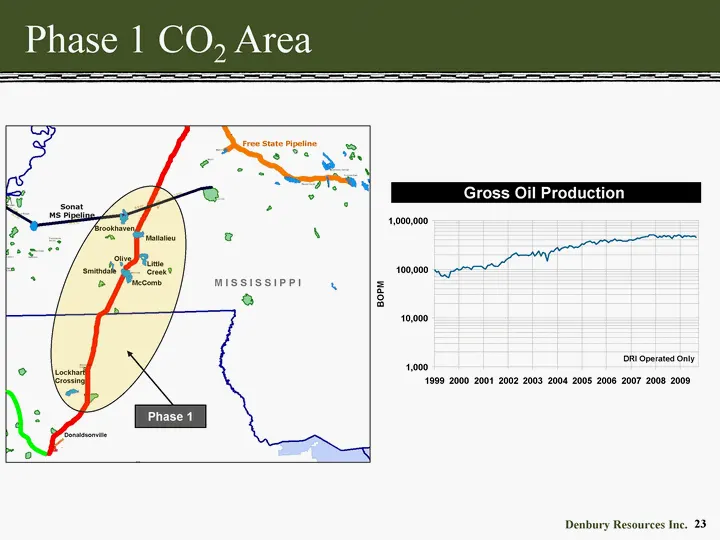
Phase 1 CO2 Area Gross Oil Production Free State Pipeline Sonat MS Pipeline Brookhaven Mallalieu Little Creek Olive Smithdale McComb Lockhart Crossing M I S S I S S I P P I Phase 1 Donaldsonville DRI Operated Only 1,000 10,000 100,000 1,000,000 1999 2000 2001 2002 2003 2004 2005 2006 2007 2008 2009
Slide 24: Phase 1 Net Daily Production by Field
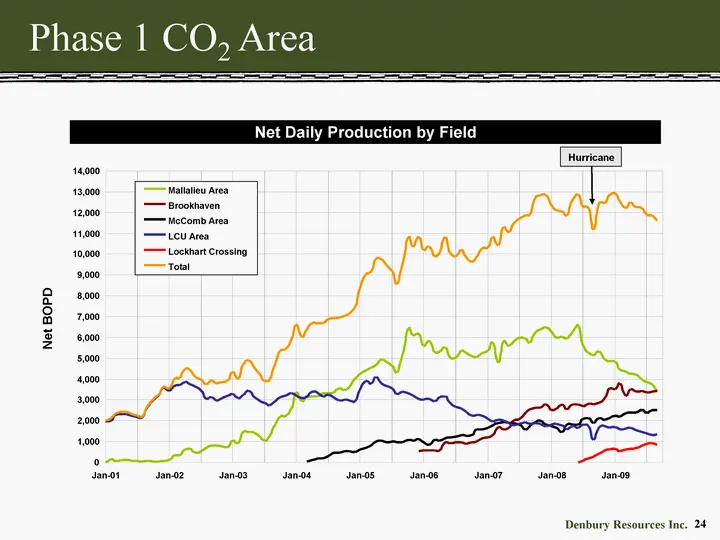
Phase 1 CO2 Area Net Daily Production by Field Hurricane 0 1,000 2,000 3,000 4,000 5,000 6,000 7,000 8,000 9,000 10,000 11,000 12,000 13,000 14,000 Jan-01 Jan-02 Jan-03 Jan-04 Jan-05 Jan-06 Jan-07 Jan-08 Jan-09 Net BOPD Mallalieu Area Brookhaven McComb Area LCU Area Lockhart Crossing Total
Slide 25: Phase 1 CO2 Area - 2010 Planned Activity
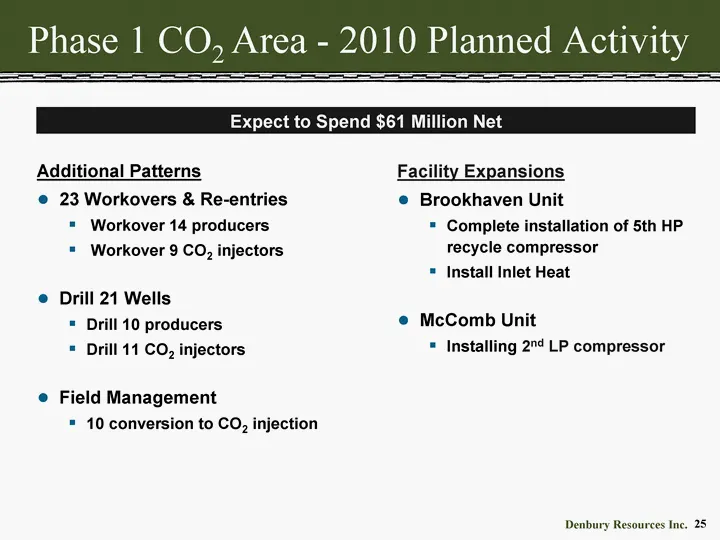
Phase 1 CO2 Area - 2010 Planned Activity Additional Patterns 23 Workovers & Re-entries Workover 14 producers Workover 9 CO2 injectors Drill 21 Wells Drill 10 producers Drill 11 CO2 injectors Field Management 10 conversion to CO2 injection Facility Expansions Brookhaven Unit Complete installation of
Slide 26: Phase 2 CO2 Area Gross Oil Production
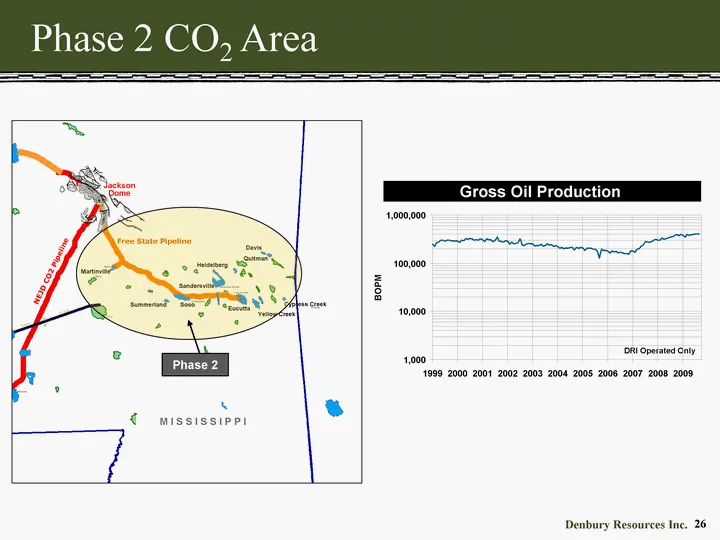
Gross Oil Production Jackson Dome NEJD CO2 Pipeline Free State Pipeline Martinville Davis Quitman Heidelberg Summerland Soso Sandersville Eucutta Yellow Creek Cypress Creek M I S S I S S I P P I Phase 2 DRI Operated Only Phase 2 CO2 Area 1,000 10,000 100,000 1,000,000 1999 2000 2001 2002 2003 2004 2
Slide 27: Phase 2 Net Daily Production by Field
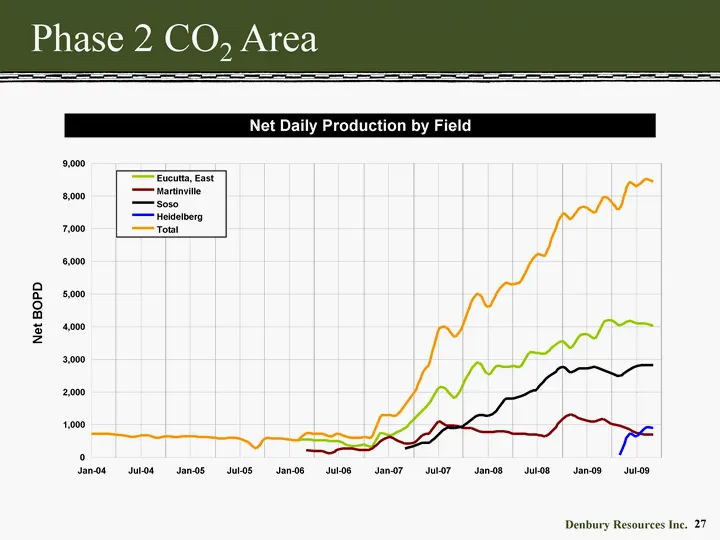
Phase 2 CO2 Area Net Daily Production by Field 0 1,000 2,000 3,000 4,000 5,000 6,000 7,000 8,000 9,000 Jan-04 Jul-04 Jan-05 Jul-05 Jan-06 Jul-06 Jan-07 Jul-07 Jan-08 Jul-08 Jan-09 Jul-09 Net BOPD Eucutta, East Martinville Soso Heidelberg Total
Slide 28: Phase 2 CO2 Area - 2010 Planned Activity
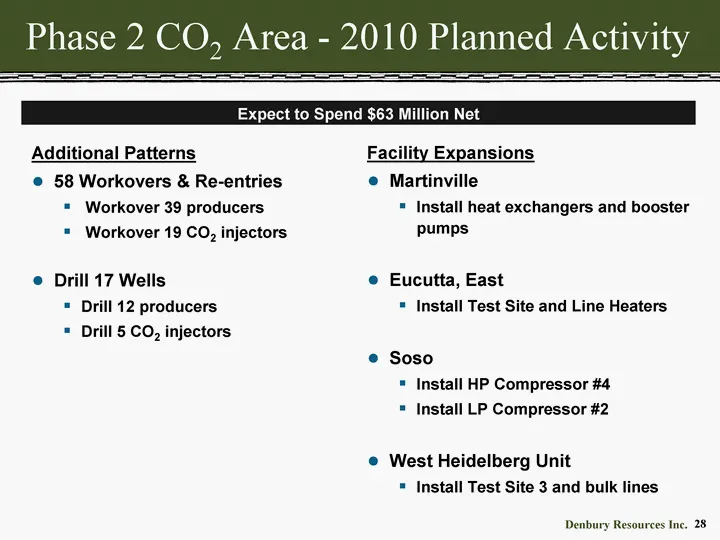
Phase 2 CO2 Area - 2010 Planned Activity Additional Patterns 58 Workovers & Re-entries Workover 39 producers Workover 19 CO2 injectors Drill 17 Wells Drill 12 producers Drill 5 CO2 injectors Facility Expansions Martinville Install heat exchangers and booster pumps Eucutta, East Install Test Site and
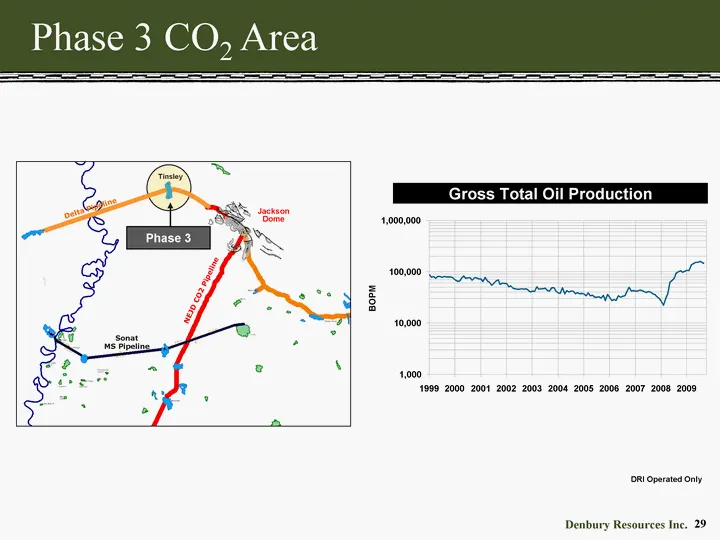
Slide 29: Phase 3 CO2 Area Gross Oil Production
Phase 3 CO2 Area Gross Total Oil Production Tinsley Jackson Dome NEJD CO2 Pipeline Sonat MS Pipeline Delta Pipeline Phase 3 DRI Operated Only 1,000 10,000 100,000 1,000,000 1999 2000 2001 2002 2003 2004 2005 2006 2007 2008 2009 BOPM
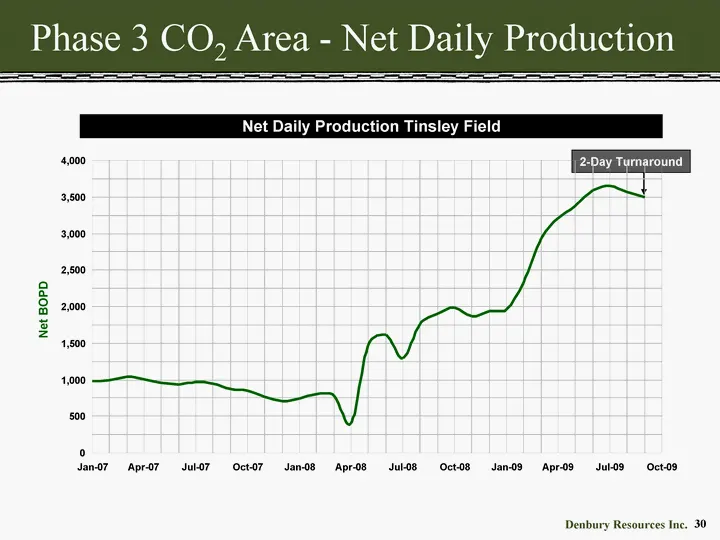
Slide 30: Tinsley Field Net Daily Production
Net Daily Production Tinsley Field Phase 3 CO2 Area - Net Daily Production 2-Day Turnaround 0 500 1,000 1,500 2,000 2,500 3,000 3,500 4,000 Jan-07 Apr-07 Jul-07 Oct-07 Jan-08 Apr-08 Jul-08 Oct-08 Jan-09 Apr-09 Jul-09 Oct-09 Net BOPD
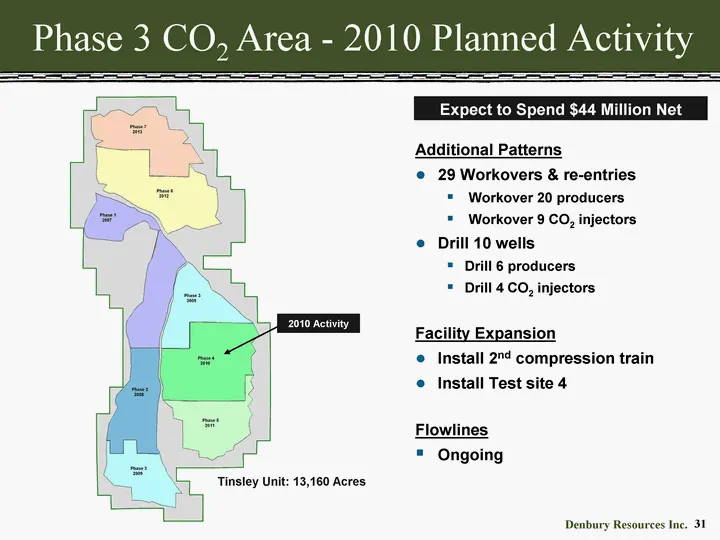
Slide 31: Phase 3 CO2 Area - 2010 Planned Activity
Phase 3 CO2 Area - 2010 Planned Activity 2010 Activity Tinsley Unit: 13,160 Acres Additional Patterns 29 Workovers & re-entries Workover 20 producers Workover 9 CO2 injectors Drill 10 wells Drill 6 producers Drill 4 CO2 injectors Facility Expansion Install 2nd compression train Install Test site 4 F
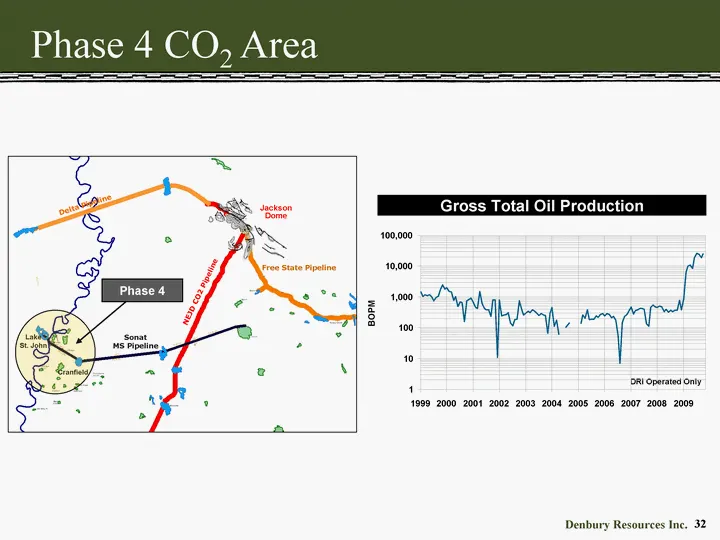
Slide 32: Phase 4 CO2 Area Gross Oil Production
Phase 4 CO2 Area Gross Total Oil Production Jackson Dome NEJD CO2 Pipeline Free State Pipeline Sonat MS Pipeline Cranfield Lake St. John Delta Pipeline DRI Operated Only Phase 4 1 10 100 1,000 10,000 100,000 1999 2000 2001 2002 2003 2004 2005 2006 2007 2008 2009 BOPM
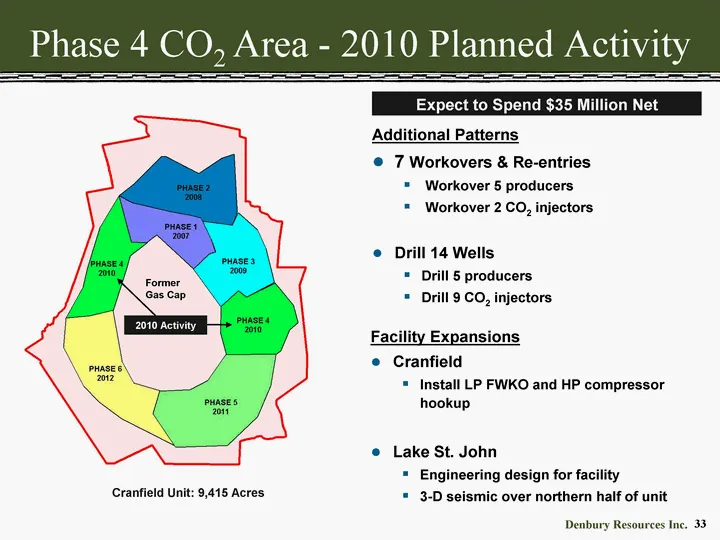
Slide 33: Phase 4 CO2 Area - 2010 Planned Activity
Phase 4 CO2 Area - 2010 Planned Activity Additional Patterns 7 Workovers & Re-entries Workover 5 producers Workover 2 CO2 injectors Drill 14 Wells Drill 5 producers Drill 9 CO2 injectors Facility Expansions Cranfield Install LP FWKO and HP compressor hookup Lake St. John Engineering design for facil
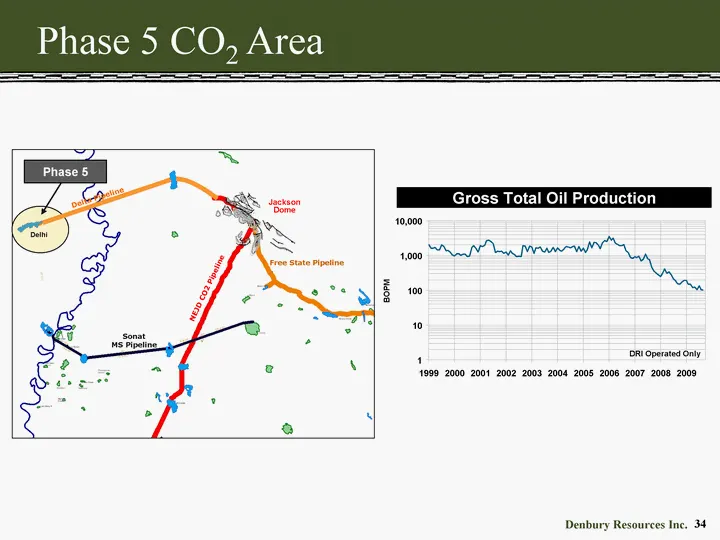
Slide 34: Phase 5 CO2 Area Gross Oil Production
Phase 5 CO2 Area Gross Total Oil Production Jackson Dome NEJD CO2 Pipeline Free State Pipeline Sonat MS Pipeline Delta Pipeline DRI Operated Only Phase 5 Delhi 1 10 100 1,000 10,000 1999 2000 2001 2002 2003 2004 2005 2006 2007 2008 2009 BOPM
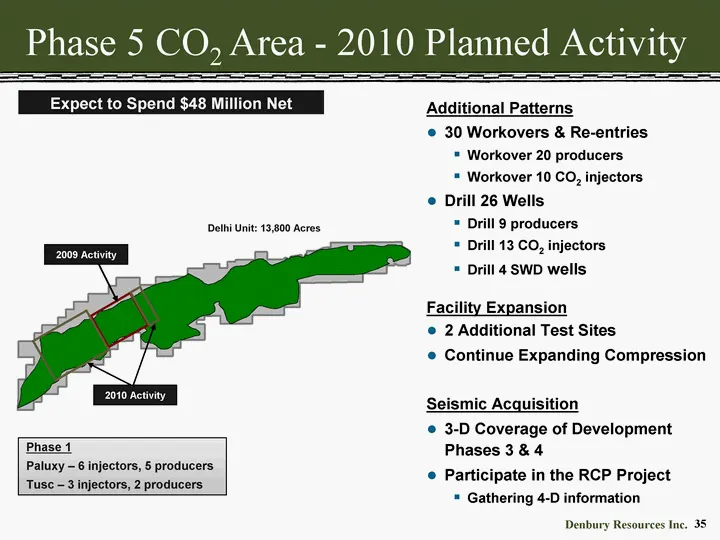
Slide 35: Phase 5 CO2 Area - 2010 Planned Activity
Phase 5 CO2 Area - 2010 Planned Activity Additional Patterns 30 Workovers & Re-entries Workover 20 producers Workover 10 CO2 injectors Drill 26 Wells Drill 9 producers Drill 13 CO2 injectors Drill 4 SWD wells Phase 1 Paluxy - 6 injectors, 5 producers Tusc - 3 injectors, 2 producers Delhi Unit: 13,80
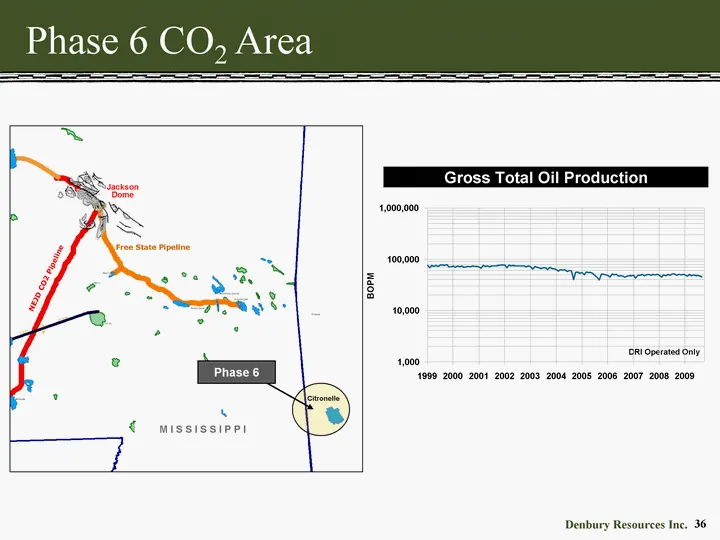
Slide 36: Phase 6 CO2 Area Gross Oil Production
Phase 6 CO2 Area Gross Total Oil Production Jackson Dome NEJD CO2 Pipeline Free State Pipeline M I S S I S S I P P I Phase 6 DRI Operated Only Citronelle 1,000 10,000 100,000 1,000,000 1999 2000 2001 2002 2003 2004 2005 2006 2007 2008 2009 BOPM
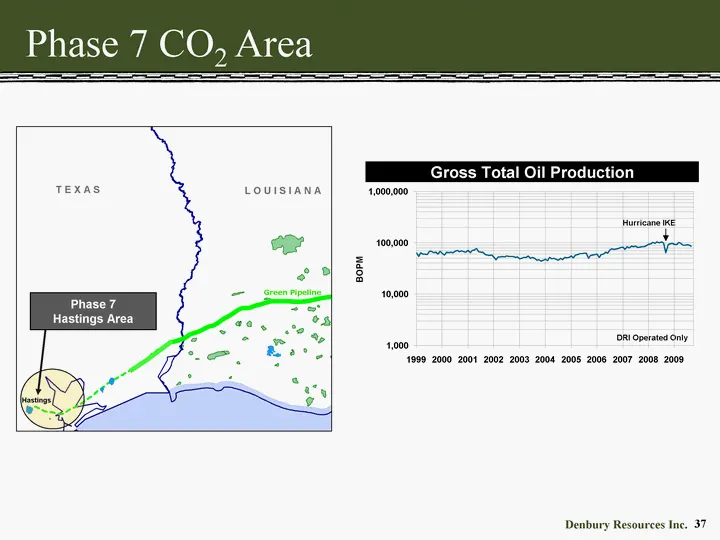
Slide 37: Phase 7 CO2 Area Gross Oil Production
Phase 7 CO2 Area Gross Total Oil Production DRI Operated Only Hurricane IKE T E X A S L O U I S I A N A Green Pipeline Phase 7 Hastings Area Hastings 1,000 10,000 100,000 1,000,000 1999 2000 2001 2002 2003 2004 2005 2006 2007 2008 2009 BOPM
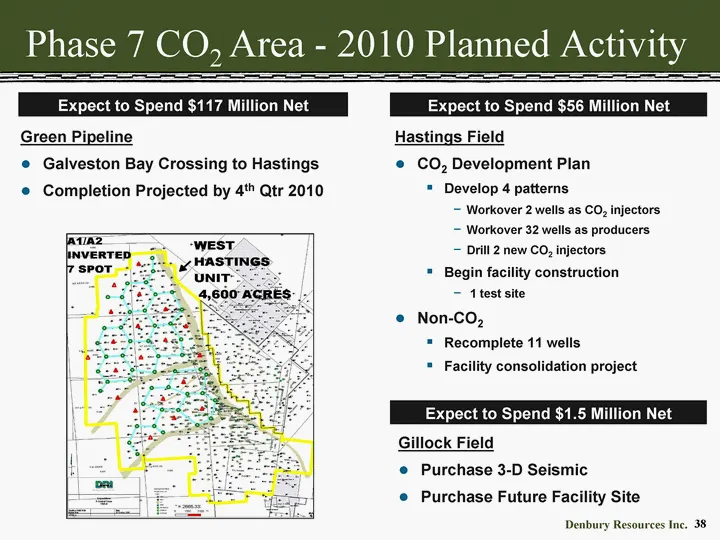
Slide 38: Phase 7 CO2 Area - 2010 Planned Activity
Phase 7 CO2 Area - 2010 Planned Activity Green Pipeline Galveston Bay Crossing to Hastings Completion Projected by 4th Qtr 2010 Hastings Field CO2 Development Plan Develop 4 patterns Workover 2 wells as CO2 injectors Workover 32 wells as producers Drill 2 new CO2 injectors Begin facility constructio
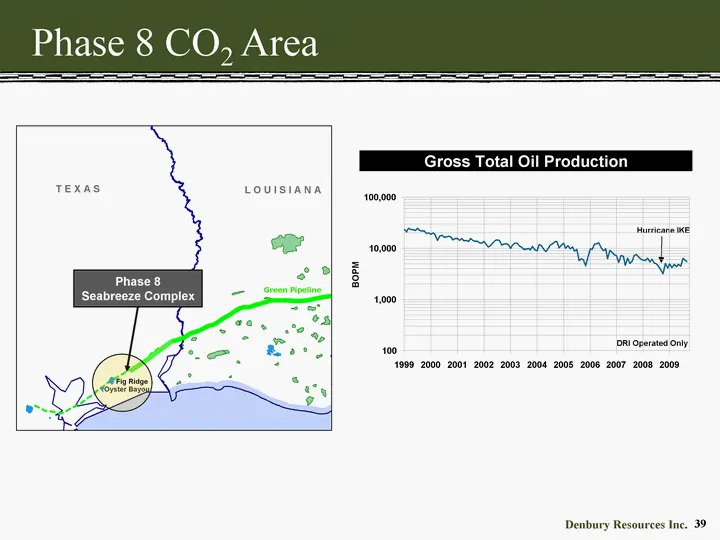
Slide 39: Phase 8 CO2 Area Gross Oil Production
Phase 8 CO2 Area Gross Total Oil Production Hurricane IKE DRI Operated Only T E X A S L O U I S I A N A Green Pipeline Oyster Bayou Fig Ridge Phase 8 Seabreeze Complex 100 1,000 10,000 100,000 1999 2000 2001 2002 2003 2004 2005 2006 2007 2008 2009 BOPM
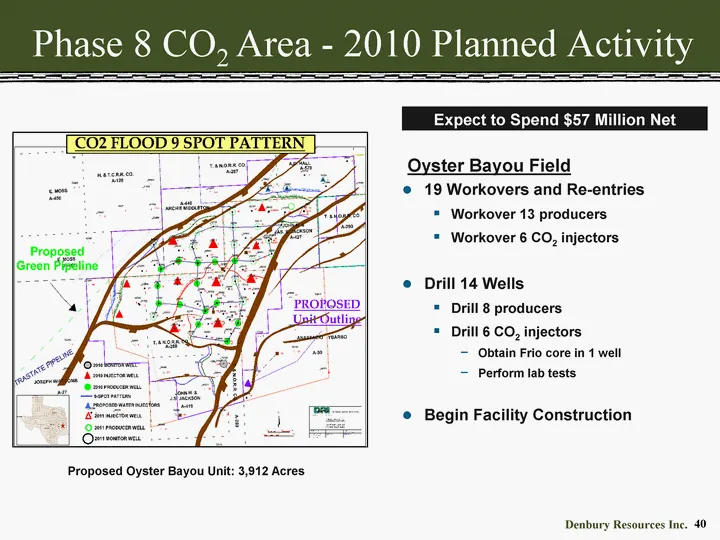
Slide 40: Phase 8 CO2 Area - 2010 Planned Activity
Phase 8 CO2 Area - 2010 Planned Activity 19 Workovers and Re-entries Workover 13 producers Workover 6 CO2 injectors Drill 14 Wells Drill 8 producers Drill 6 CO2 injectors Obtain Frio core in 1 well Perform lab tests Begin Facility Construction Oyster Bayou Field Proposed Oyster Bayou Unit: 3,912 Acr
Slide 41: CO2 Sources
CO2 Sources
Slide 42: Potential Sources of Additional CO2
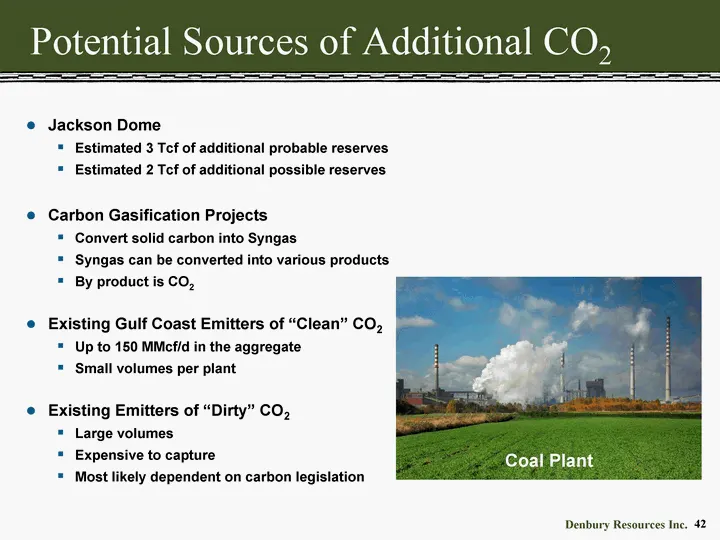
Potential Sources of Additional CO2 Jackson Dome Estimated 3 Tcf of additional probable reserves Estimated 2 Tcf of additional possible reserves Carbon Gasification Projects Convert solid carbon into Syngas Syngas can be converted into various products By product is CO2 Existing Gulf Coast Emitters
Slide 43: Jackson Dome Area
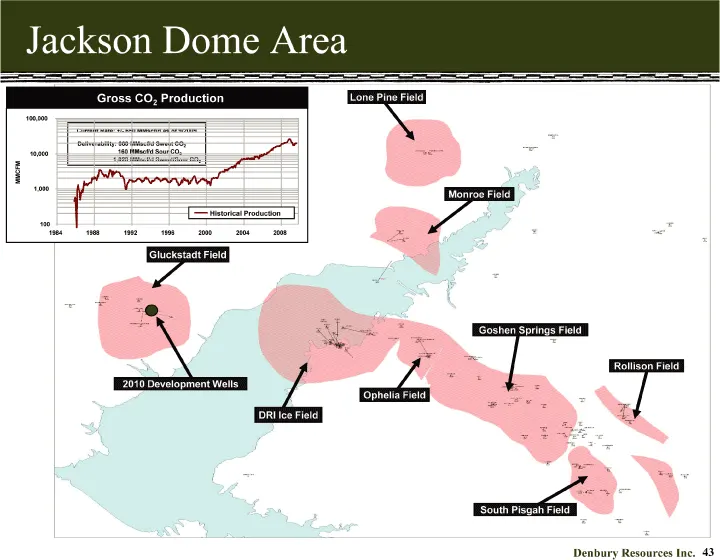
Jackson Dome Area Gluckstadt Field DRI Ice Field Lone Pine Field Monroe Field Goshen Springs Field South Pisgah Field Rollison Field Ophelia Field Gross CO2 Production Current Rate: +/- 650 MMscf/d as of 9/2009 Deliverability: 860 MMscf/d Sweet CO2 160 MMscf/d Sour CO2 1,020 MMscf/d Sweet/Sour CO2 2
Slide 44: Jackson Dome Area - 2010 Planned Activity
Jackson Dome Area - 2010 Planned Activity Wellwork Drill 3 Wells DRI Dock Prospect 1.5 - 2.0 TCF potential Gluckstadt Field development well Second DRI Dock well, additional Gluckstadt well or Hawkeye Prospect (200 - 350 BCF potential) 3-D Seismic Over DRI Dock Facilities & Pipelines Install 300 MMC
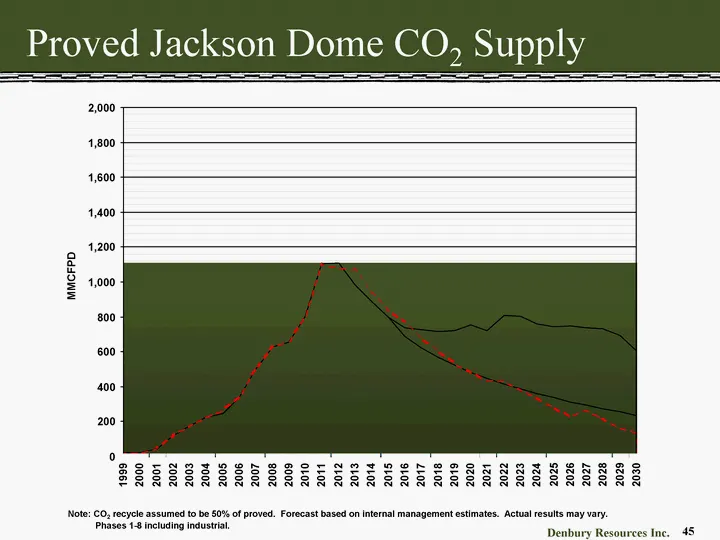
Slide 45: Jackson Dome CO2 Supply - Proved
CO2 Recycle 2.8 TCF (Proved Only) Phases 1-8 Proved Jackson Dome CO2 Supply Note: CO2 recycle assumed to be 50% of proved. Forecast based on internal management estimates. Actual results may vary. Phases 1-8 including industrial. Jackson Dome Proved 5.6 TCF (as of 1/1/09) 0 200 400 600 800 1,000 1,2
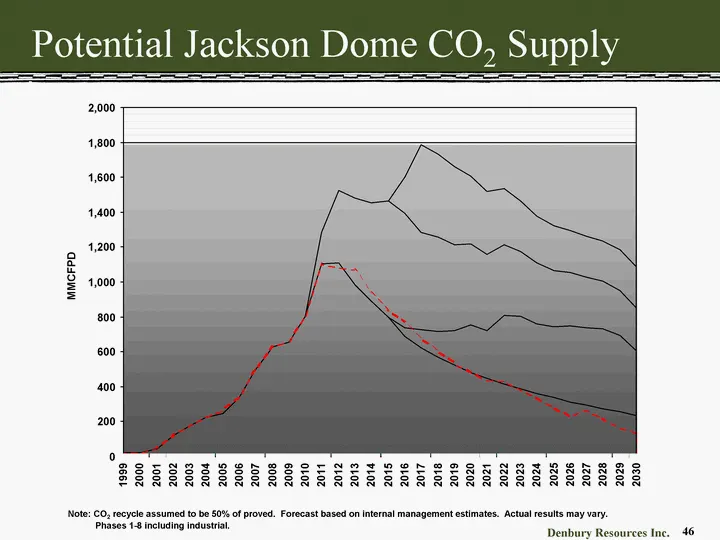
Slide 46: Potential Jackson Dome CO2 Supply
Jackson Dome Proved 5.6 TCF (as of 1/1/09) CO2 Recycle 2.8 TCF (Proved Only) Phases 1-8 Probable 3 TCF Possible 2 TCF Potential Jackson Dome CO2 Supply Note: CO2 recycle assumed to be 50% of proved. Forecast based on internal management estimates. Actual results may vary. Phases 1-8 including indust
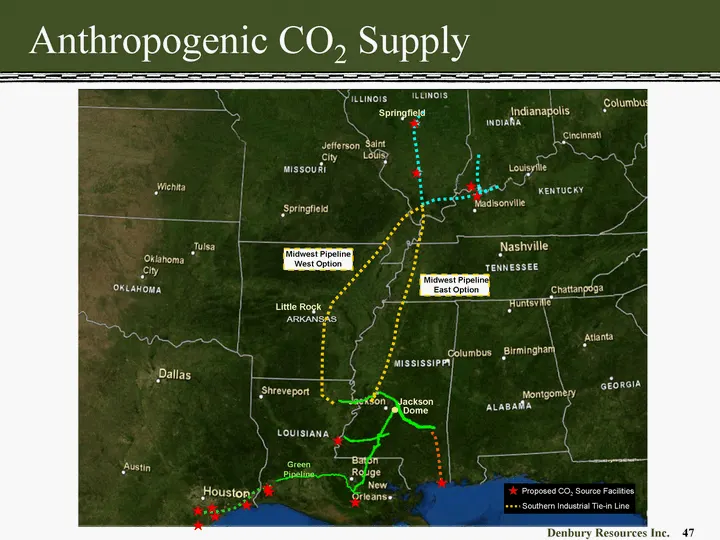
Slide 47: Anthropogenic CO2 Supply
Green Pipeline Little Rock Jackson Dome Springfield Anthropogenic CO2 Supply Midwest Pipeline West Option Midwest Pipeline East Option Southern Industrial Tie-in Line Proposed CO2 Source Facilities
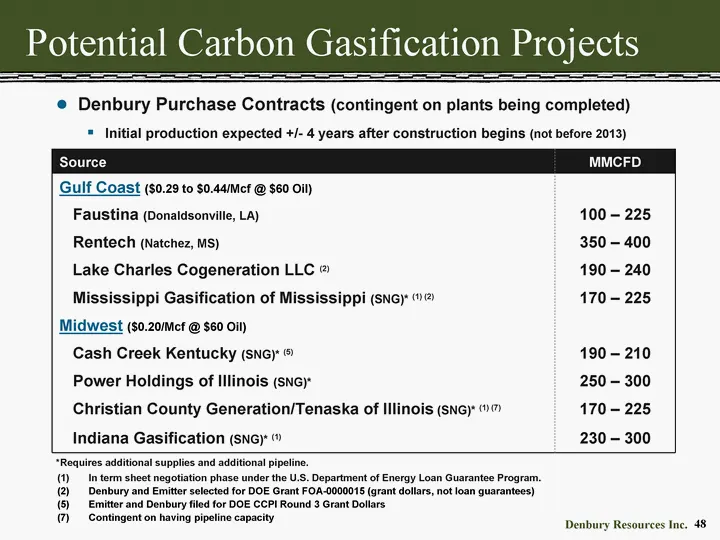
Slide 48: Potential Carbon Gasification Projects
Potential Carbon Gasification Projects Denbury Purchase Contracts (contingent on plants being completed) Initial production expected +/- 4 years after construction begins (not before 2013) Source MMCFD Gulf Coast ($0.29 to $0.44/Mcf @ $60 Oil) Faustina (Donaldsonville, LA) 100 - 225 Rentech (Natchez
Slide 49: Anthropogenic CO2 - Current Emitters
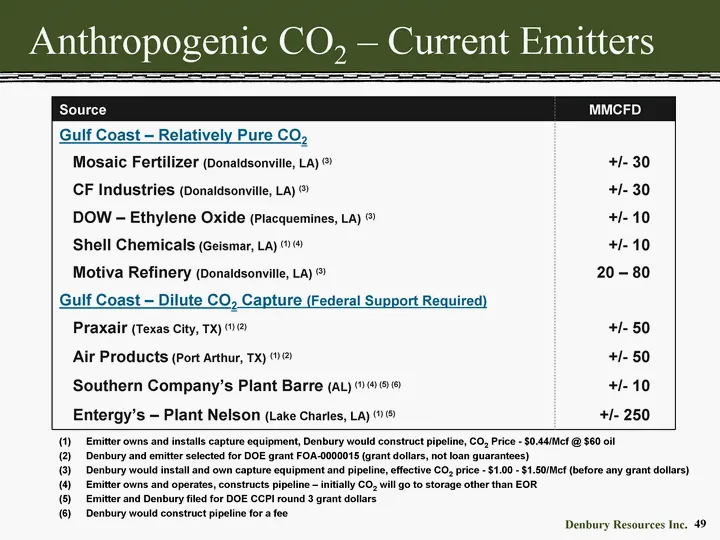
Source MMCFD Gulf Coast - Relatively Pure CO2 Mosaic Fertilizer (Donaldsonville, LA) (3) +/- 30 CF Industries (Donaldsonville, LA) (3) +/- 30 DOW - Ethylene Oxide (Placquemines, LA) (3) +/- 10 Shell Chemicals (Geismar, LA) (1) (4) +/- 10 Motiva Refinery (Donaldsonville, LA) (3) 20 - 80 Gulf Coast -
Slide 50: ENCO2RE + Merger
ENCO2RE + Merger
Slide 51: Encore Rockies CO2 Projects
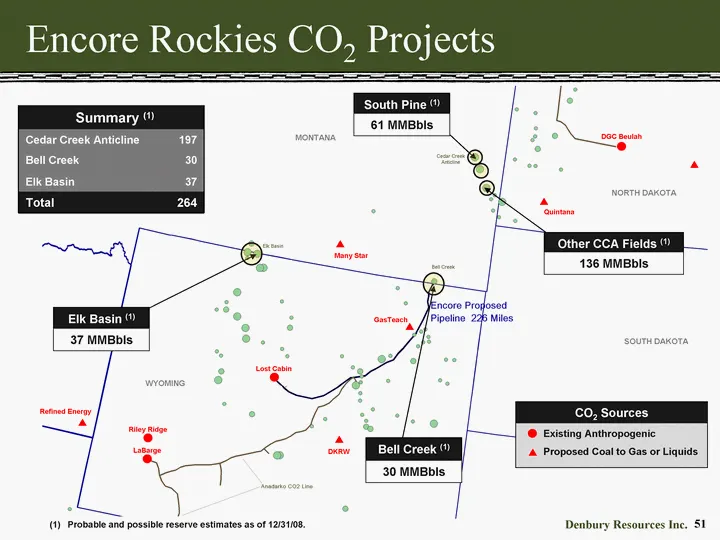
Encore Rockies CO2 Projects MONTANA NORTH DAKOTA SOUTH DAKOTA WYOMING Elk Basin (1) 37 MMBbls South Pine (1) 61 MMBbls Cedar Creek Anticline Elk Basin Bell Creek (1) 30 MMBbls Summary (1) Summary (1) Cedar Creek Anticline 197 Bell Creek 30 Elk Basin 37 Total 264 LaBarge Lost Cabin DGC Beulah Propose
Slide 52: Rocky Mountain CO2 Sources
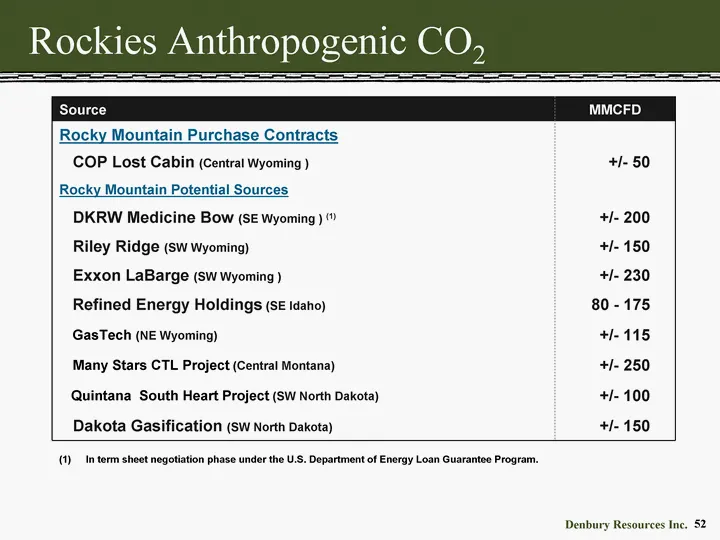
Source MMCFD Rocky Mountain Purchase Contracts COP Lost Cabin (Central Wyoming ) +/- 50 Rocky Mountain Potential Sources DKRW Medicine Bow (SE Wyoming ) (1) +/- 200 Riley Ridge (SW Wyoming) +/- 150 Exxon LaBarge (SW Wyoming ) +/- 230 Refined Energy Holdings (SE Idaho) 80 - 175 GasTech (NE Wyoming) +
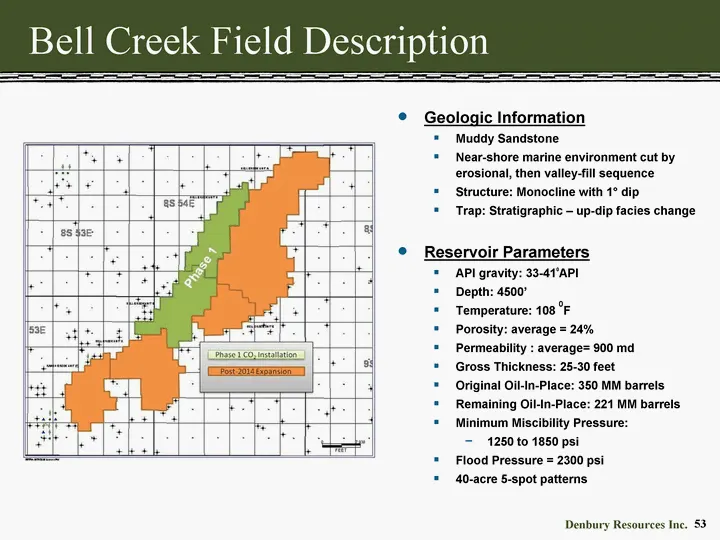
Slide 53: Bell Creek Field Description
Bell Creek Field Description Geologic Information Muddy Sandstone Near-shore marine environment cut by erosional, then valley-fill sequence Structure: Monocline with 1° dip Trap: Stratigraphic - up-dip facies change Reservoir Parameters API gravity: 33-410API Depth: 4500' Temperature: 108 0F Porosit
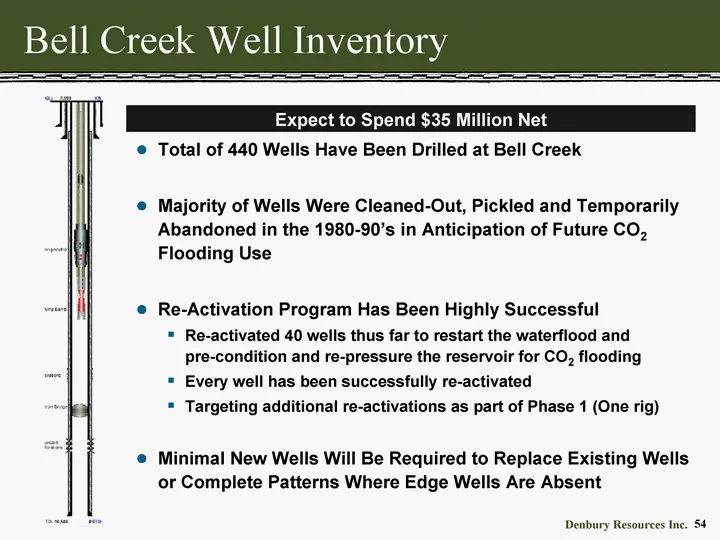
Slide 54: Bell Creek Well Inventory
Bell Creek Well Inventory Total of 440 Wells Have Been Drilled at Bell Creek Majority of Wells Were Cleaned-Out, Pickled and Temporarily Abandoned in the 1980-90's in Anticipation of Future CO2 Flooding Use Re-Activation Program Has Been Highly Successful Re-activated 40 wells thus far to restart th
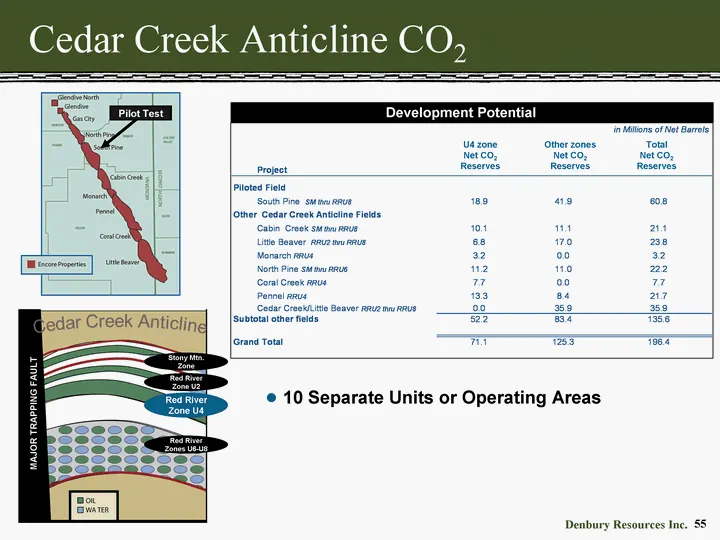
Slide 55: Cedar Creek Anticline CO2 Development Potential
Cedar Creek Anticline CO2 Development Potential Stony Mtn. Zone Red River Zone U2 Red River Zone U4 Red River Zones U6-U8 MAJOR TRAPPING FAULT U4 zone Net CO2 Reserves Other zones Net CO2 Reserves Total Net CO2 Reserves 10 Separate Units or Operating Areas Pilot Test
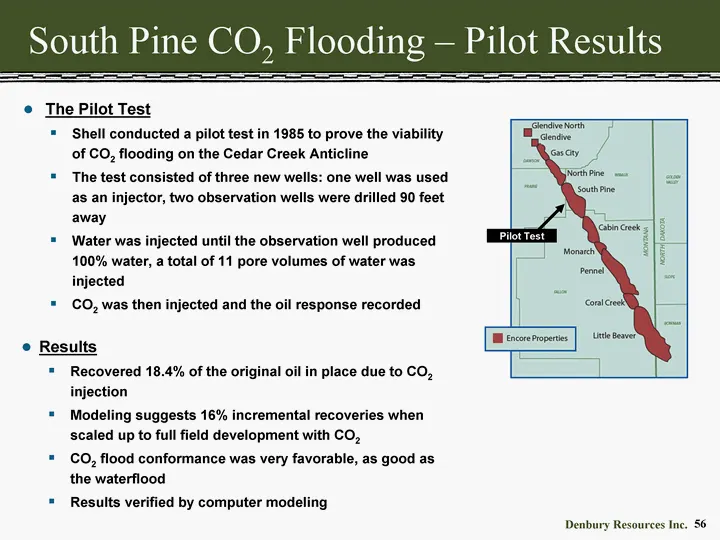
Slide 56: South Pine CO2 Flooding - Pilot Results
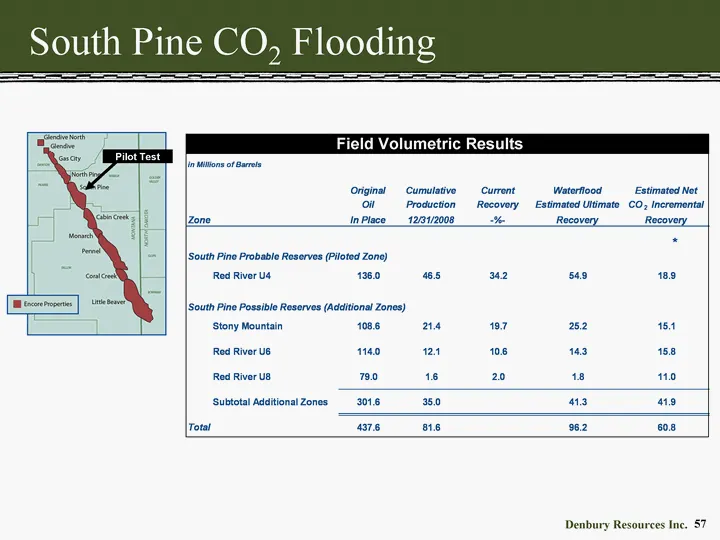
South Pine CO2 Flooding - Pilot Results The Pilot Test Shell conducted a pilot test in 1985 to prove the viability of CO2 flooding on the Cedar Creek Anticline The test consisted of three new wells: one well was used as an injector, two observation wells were drilled 90 feet away Water was injected
Slide 57: South Pine CO2 Flooding Field Volumetric Results
South Pine CO2 Flooding * Field Volumetric Results Pilot Test
Slide 58: Bakken Area
Bakken Area
Slide 59: Significant Position in ND Bakken
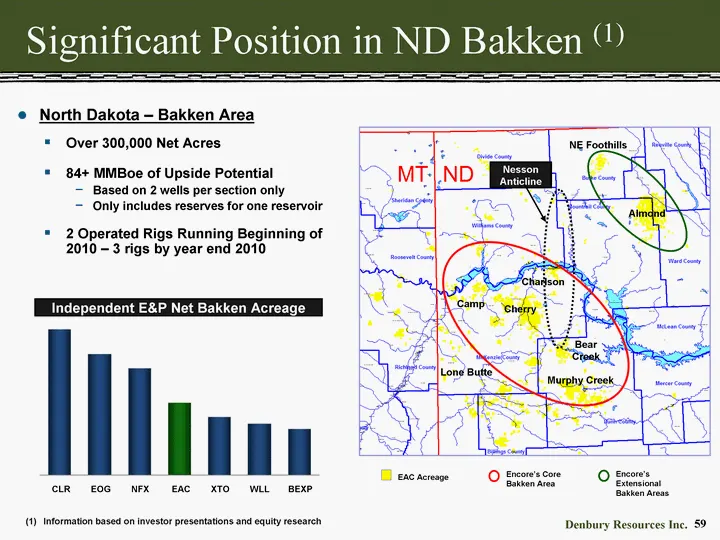
59 Significant Position in ND Bakken (1) Coal Plant EAC Acreage Encore's Core Bakken Area Cherry Charlson Bear Creek Murphy Creek NE Foothills Lone Butte Almond Encore's Extensional Bakken Areas Nesson Anticline Camp Independent E&P Net Bakken Acreage 605,000 500,000 444,000 300,000 241,120 213,422
Slide 60: ND Bakken - Charlson Area
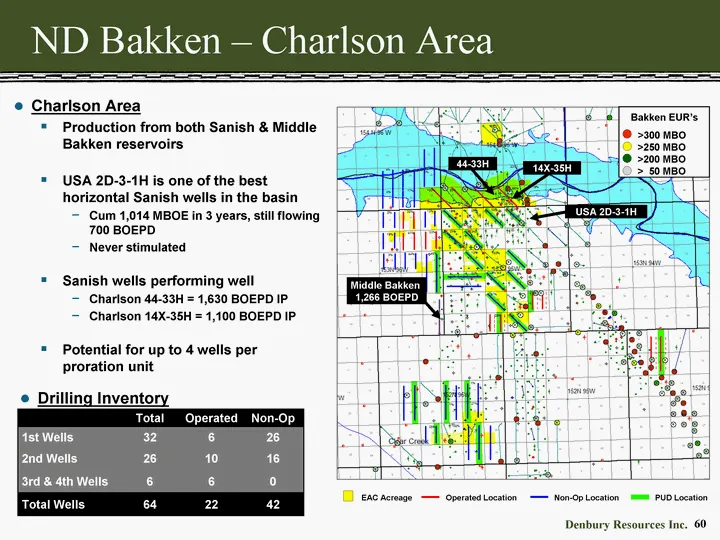
ND Bakken - Charlson Area EAC Acreage Operated Location Non-Op Location Total Operated Non-Op 1st Wells 32 6 26 2nd Wells 26 10 16 3rd & 4th Wells 6 6 0 Total Wells 64 22 42 PUD Location Bakken EUR's >300 MBO >250 MBO >200 MBO > 50 MBO Middle Bakken 1,266 BOEPD 44-33H 14X-35H USA 2D-3-1H Charlson Ar
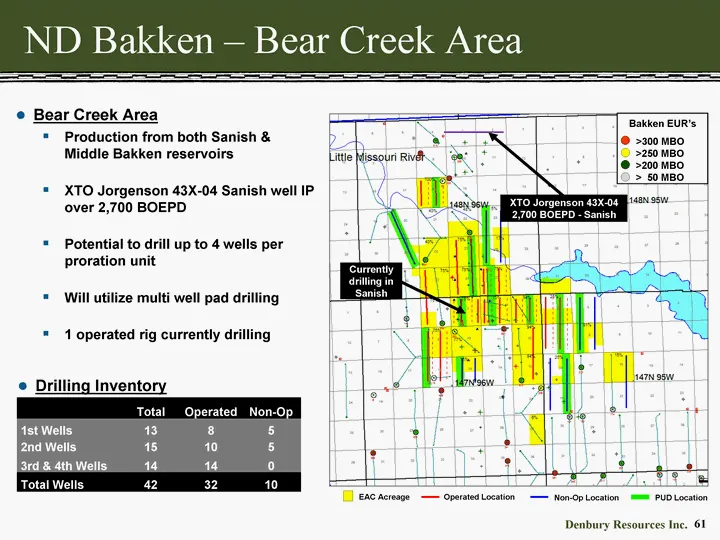
Slide 61: ND Bakken - Bear Creek Area
ND Bakken - Bear Creek Area Total Operated Non-Op 1st Wells 13 8 5 2nd Wells 15 10 5 3rd & 4th Wells 14 14 0 Total Wells 42 32 10 Drilling Inventory EAC Acreage Operated Location Non-Op Location PUD Location Bakken EUR's >300 MBO >250 MBO >200 MBO > 50 MBO XTO Jorgenson 43X-04 2,700 BOEPD - Sanish C
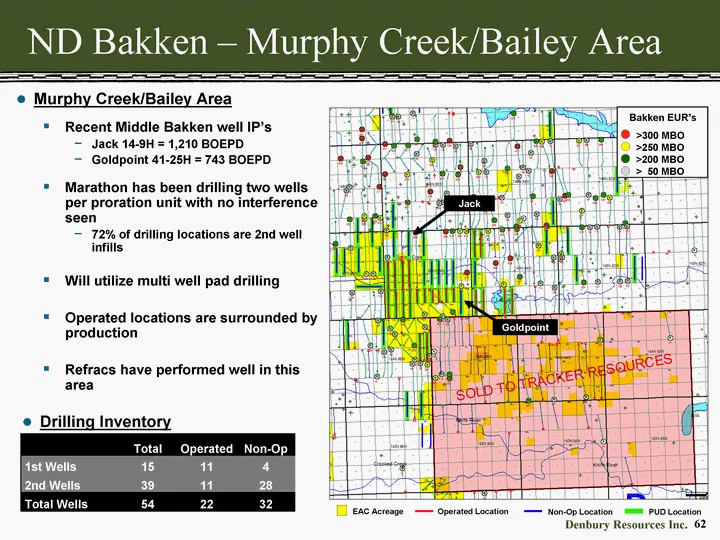
Slide 62: ND Bakken - Murphy Creek/Bailey Area
ND Bakken - Murphy Creek/Bailey Area Total Operated Non-Op 1st Wells 15 11 4 2nd Wells 39 11 28 Total Wells 54 22 32 Drilling Inventory Jack Bakken EUR's >300 MBO >250 MBO >200 MBO > 50 MBO Goldpoint EAC Acreage Operated Location Non-Op Location PUD Location Murphy Creek/Bailey Area Recent Middle Ba
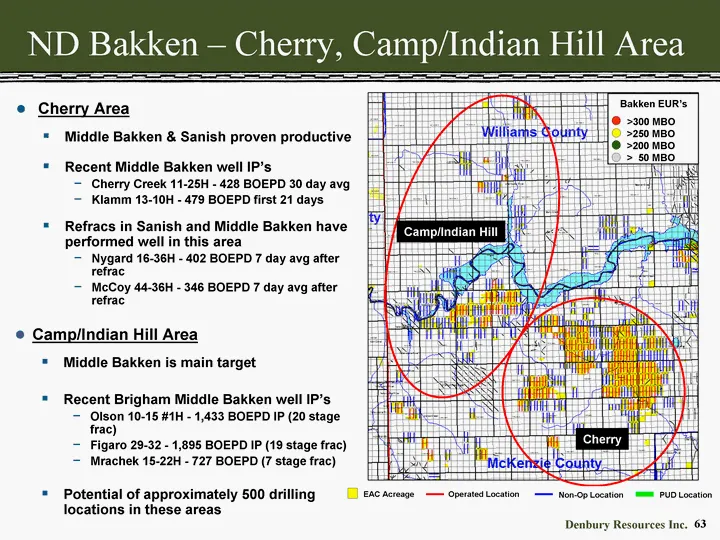
Slide 63: ND Bakken - Cherry, Camp/Indian Hill Area
ND Bakken - Cherry, Camp/Indian Hill Area Bakken EUR's >300 MBO >250 MBO >200 MBO > 50 MBO EAC Acreage Operated Location Non-Op Location PUD Location Cherry Area Middle Bakken & Sanish proven productive Recent Middle Bakken well IP's Cherry Creek 11-25H - 428 BOEPD 30 day avg Klamm 13-10H - 479 BOEP
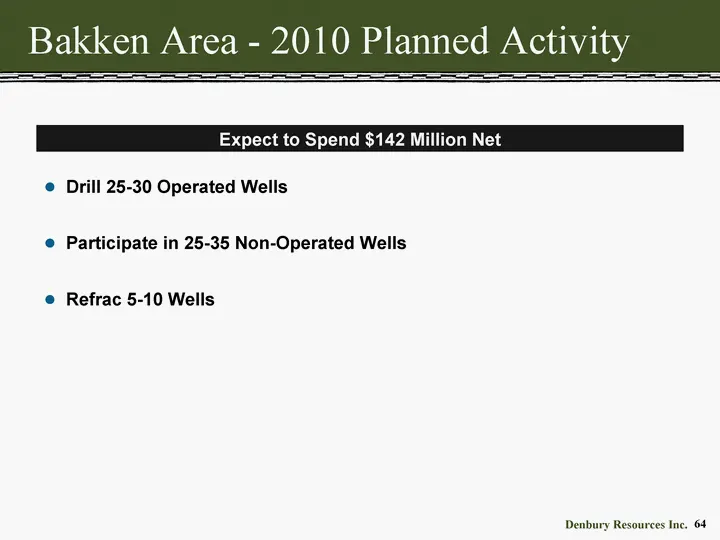
Slide 64: Bakken Area - 2010 Planned Activity
Bakken Area - 2010 Planned Activity Expect to Spend $142 Million Net Drill 25-30 Operated Wells Participate in 25-35 Non-Operated Wells Refrac 5-10 Wells
Slide 65: Unconventional Gas Plays
Unconventional Gas Plays
Slide 66: Haynesville Acreage
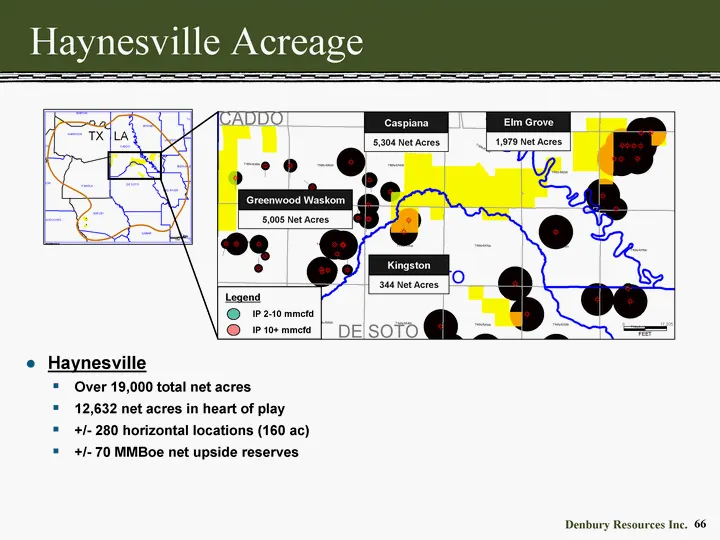
66 Legend IP 2-10 mmcfd IP 10+ mmcfd TX LA CADDO DE SOTO Haynesville Acreage Caspiana 5,304 Net Acres Elm Grove 1,979 Net Acres Kingston 344 Net Acres Greenwood Waskom 5,005 Net Acres Haynesville Over 19,000 total net acres 12,632 net acres in heart of play +/- 280 horizontal locations (160 ac) +/-
Slide 67: Haynesville Operator Map
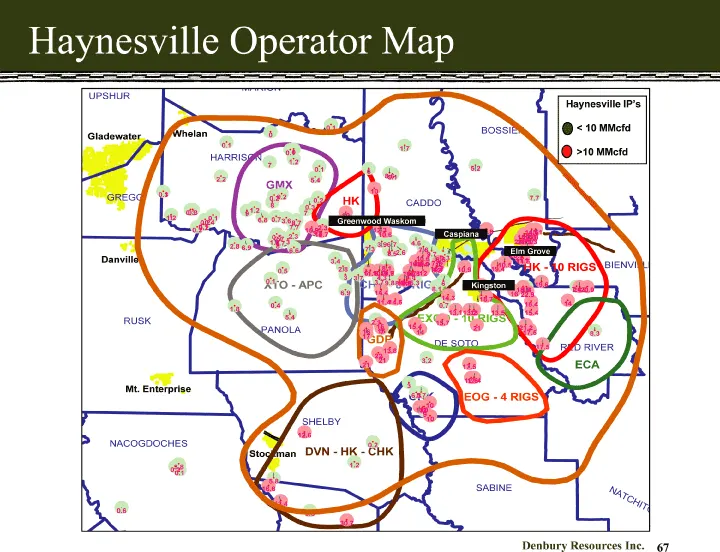
Haynesville Operator Map Caspiana Kingston Elm Grove Greenwood Waskom Haynesville IP's < 10 MMcfd >10 MMcfd
Slide 68: Mobil's Largest West Texas Gas Fields
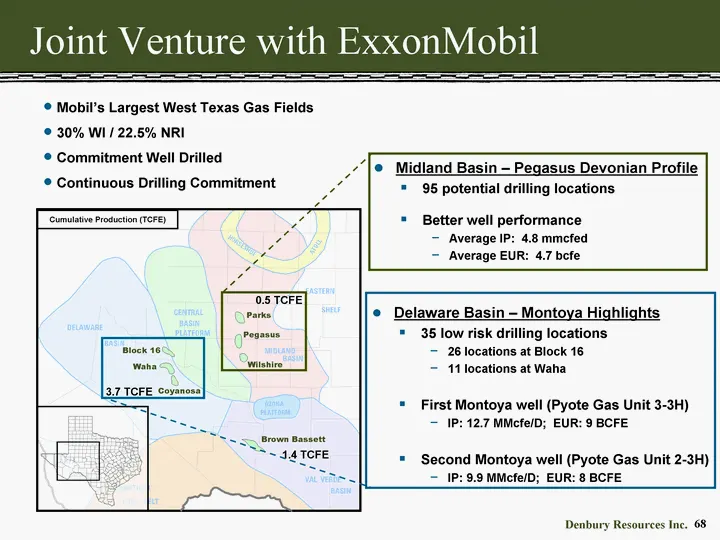
Mobil's Largest West Texas Gas Fields 30% WI / 22.5% NRI Commitment Well Drilled Continuous Drilling Commitment Parks Pegasus Wilshire Coyanosa Waha Block 16 Brown Bassett Cumulative Production (TCFE) 3.7 TCFE 1.4 TCFE 0.5 TCFE Joint Venture with ExxonMobil Midland Basin - Pegasus Devonian Profile 9
Slide 69: Unconventional Gas Plays - 2010 Planned Activity
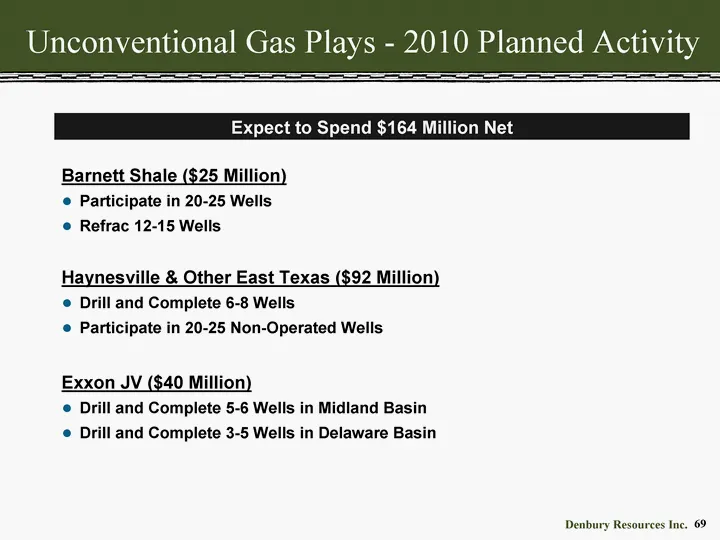
Unconventional Gas Plays - 2010 Planned Activity Expect to Spend $164 Million Net Barnett Shale ($25 Million) Participate in 20-25 Wells Refrac 12-15 Wells Haynesville & Other East Texas ($92 Million) Drill and Complete 6-8 Wells Participate in 20-25 Non-Operated Wells Exxon JV ($40 Million) Drill a
Slide 70: Operational Overview
Operational Overview Denbury Resources Inc. 70
Slide 71: Strategic Pipeline & Facilities
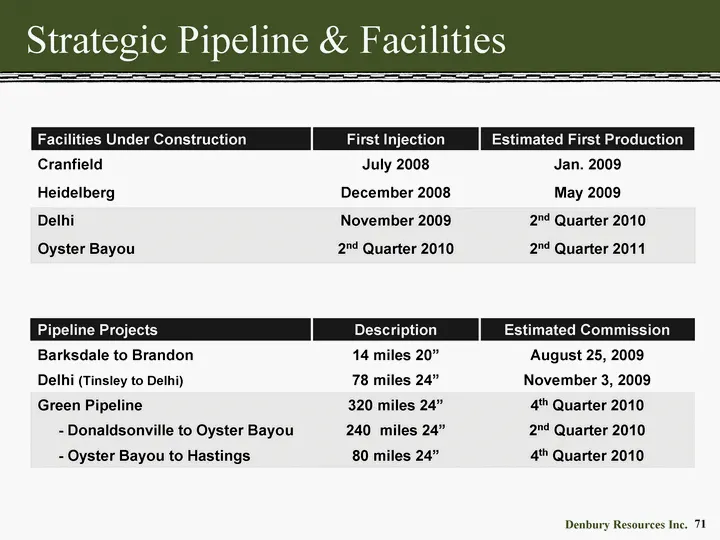
Strategic Pipeline & Facilities Pipeline Projects Description Estimated Commission Barksdale to Brandon 14 miles 20" August 25, 2009 Delhi (Tinsley to Delhi) 78 miles 24" November 3, 2009 Green Pipeline 320 miles 24" 4th Quarter 2010 - Donaldsonville to Oyster Bayou 240 miles 24" 2nd Quarter 2010 -
Slide 72: Key to Success: CO2 Pipeline Network
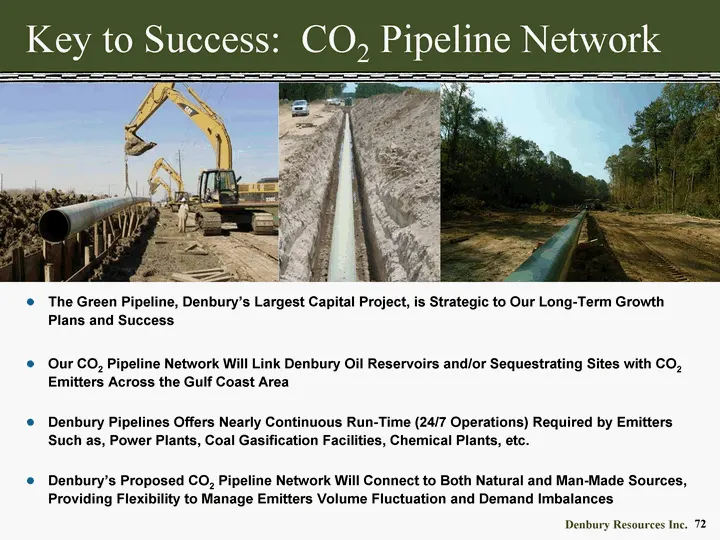
Key to Success: CO2 Pipeline Network The Green Pipeline, Denbury's Largest Capital Project, is Strategic to Our Long-Term Growth Plans and Success Our CO2 Pipeline Network Will Link Denbury Oil Reservoirs and/or Sequestrating Sites with CO2 Emitters Across the Gulf Coast Area Denbury Pipelines Offer
Slide 73: Green Pipeline Project Projected Costs & Timing
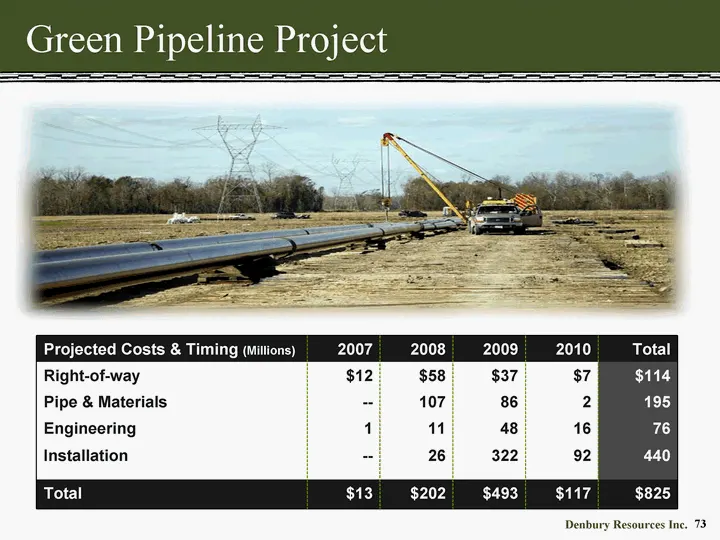
Green Pipeline Project Projected Costs & Timing (Millions) 2007 2008 2009 2010 Total Right-of-way $12 $58 $37 $7 $114 Pipe & Materials -- 107 86 2 195 Engineering 1 11 48 16 76 Installation -- 26 322 92 440 Total $13 $202 $493 $117 $825
Slide 74: Green Pipeline
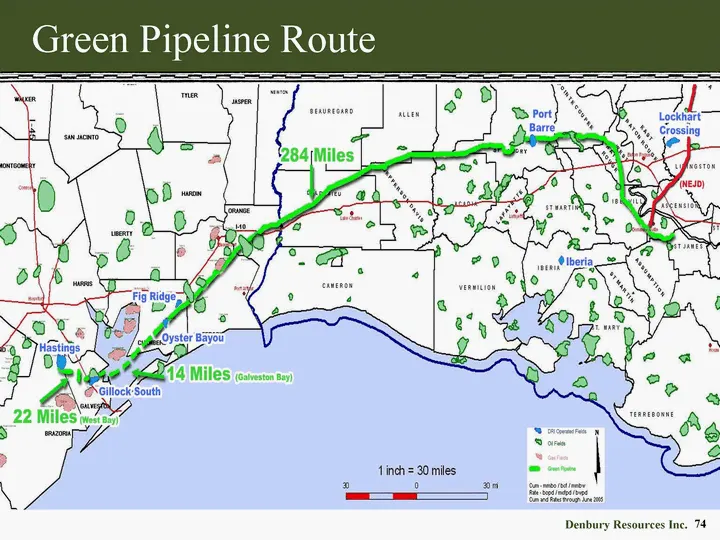
Green Pipeline ite { Miles | cat : Ts
Slide 75: Jackson Dome Area
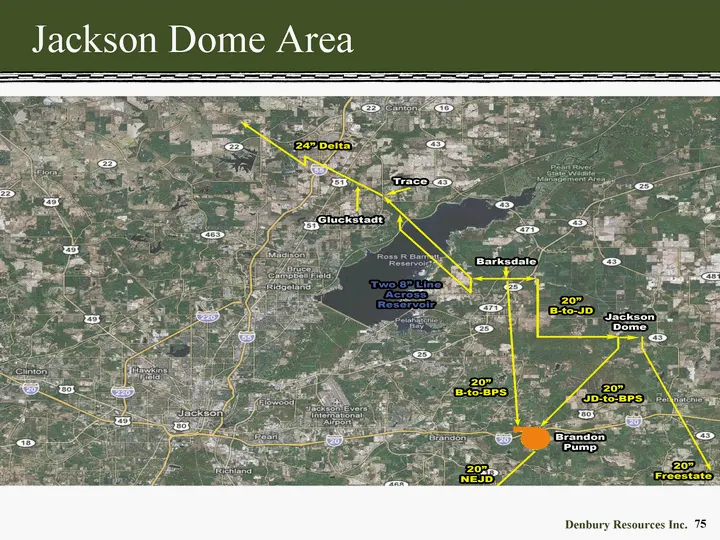
Jackson Dome Area Denbury Resources Inc. 75
Slide 76: Jackson Dome Area - Current
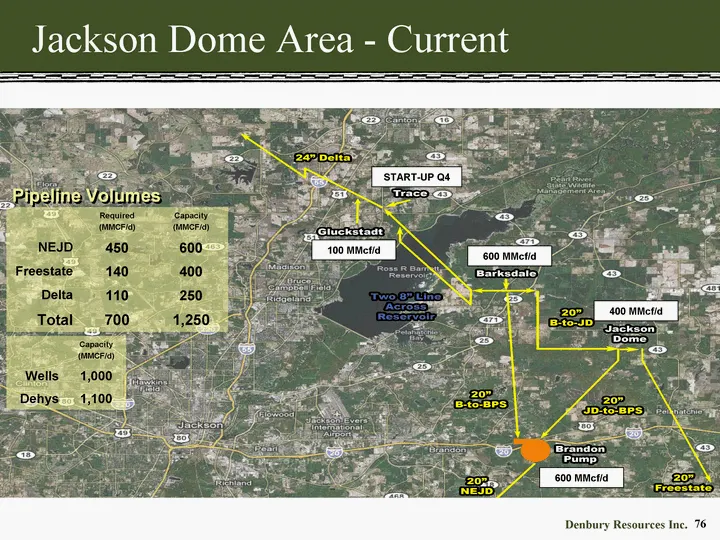
Jackson Dome Area - Current START-UP Q4 600 MMcf/d 100 MMcf/d 400 MMcf/d 600 MMcf/d Required (MMCF/d) Capacity (MMCF/d) NEJD 450 600 Freestate 140 400 Delta 110 250 Total 700 1,250 Pipeline Volumes Capacity (MMCF/d) Wells 1,000 Dehys 1,100
Slide 77: Jackson Dome Area - Jan. 2013
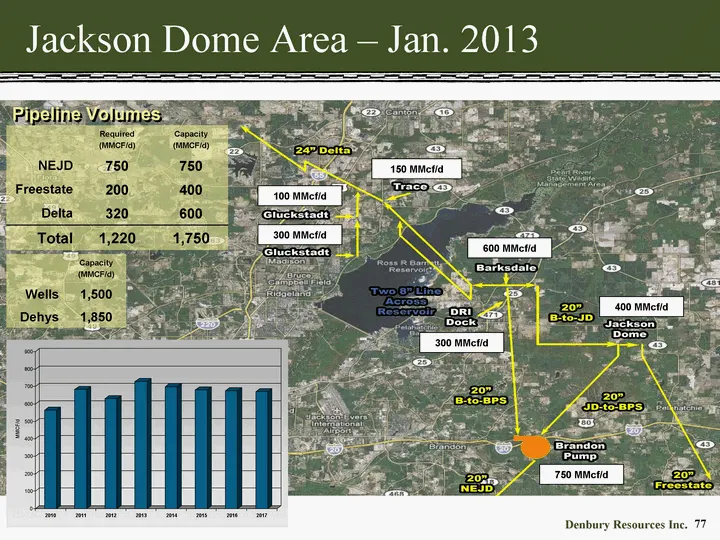
Jackson Dome Area - Jan. 2013 150 MMcf/d 600 MMcf/d 100 MMcf/d 400 MMcf/d 750 MMcf/d 300 MMcf/d 300 MMcf/d Required (MMCF/d) Capacity (MMCF/d) NEJD 750 750 Freestate 200 400 Delta 320 600 Total 1,220 1,750 Pipeline Volumes Capacity (MMCF/d) Wells 1,500 Dehys 1,850 NEJD CO2 Requirements 0 100 200 300
Slide 78: Health, Safety & Environmental
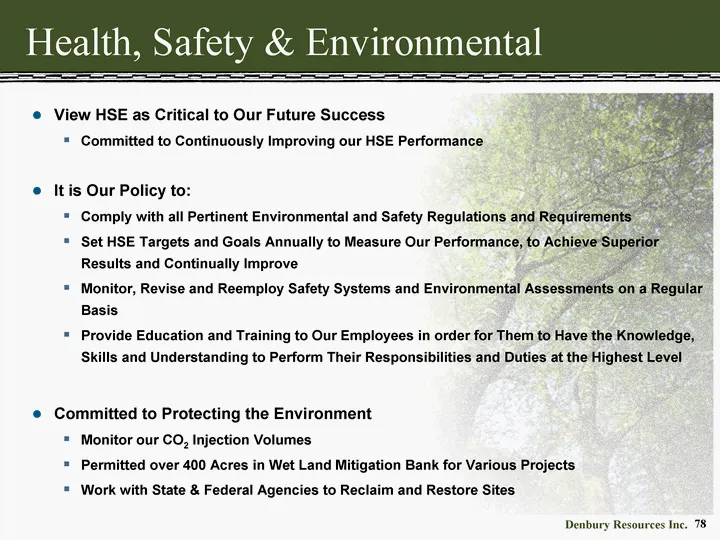
Health, Safety & Environmental View HSE as Critical to Our Future Success Committed to Continuously Improving our HSE Performance It is Our Policy to: Comply with all Pertinent Environmental and Safety Regulations and Requirements Set HSE Targets and Goals Annually to Measure Our Performance, to Ach
Slide 79: Financial Overview
Financial Overview Denbury Resources Inc. 79
Slide 80: Emphasis on CO2 Projects
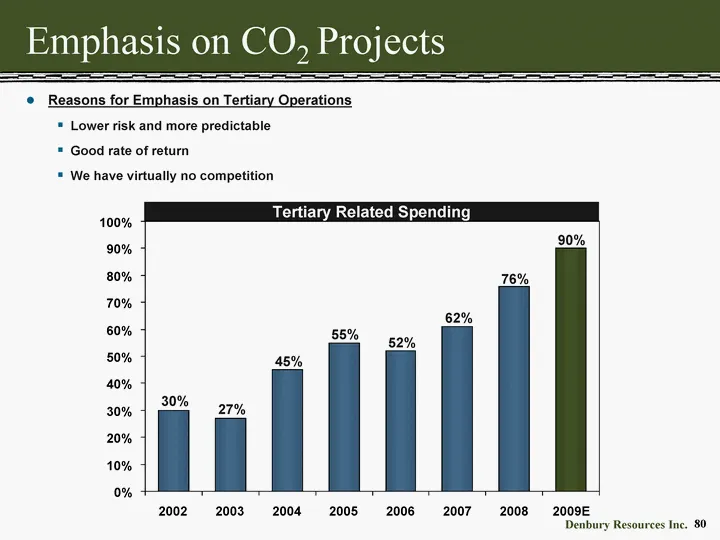
Emphasis on CO2 Projects Reasons for Emphasis on Tertiary Operations Lower risk and more predictable Good rate of return We have virtually no competition 30% 27% 45% 55% 52% 62% 90% Tertiary Related Spending 76% 0% 10% 20% 30% 40% 50% 60% 70% 80% 90% 100% 2002 2003 2004 2005 2006 2007 2008 2009E
Slide 81: CO2 EOR Economics
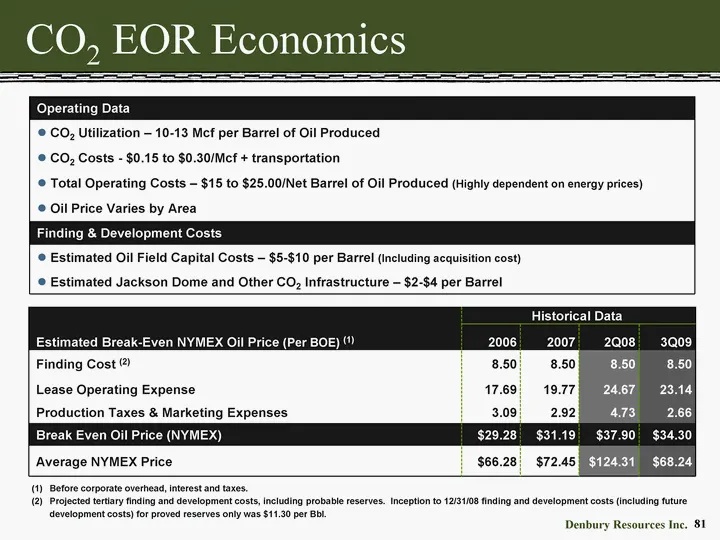
CO2 EOR Economics Operating Data CO2 Utilization - 10-13 Mcf per Barrel of Oil Produced CO2 Costs - $0.15 to $0.30/Mcf + transportation Total Operating Costs - $15 to $25.00/Net Barrel of Oil Produced (Highly dependent on energy prices) Oil Price Varies by Area Finding & Development Costs Estimated
Slide 82: Analysis of Tertiary Operating Costs
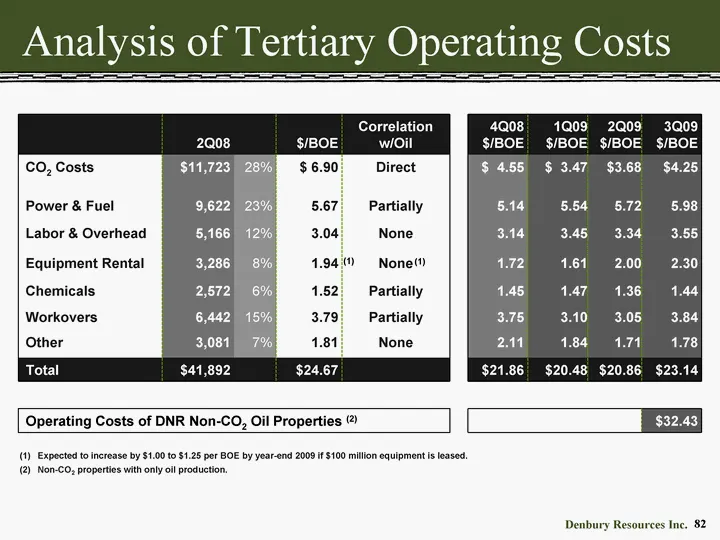
Analysis of Tertiary Operating Costs 2Q08 $/BOE Correlation w/Oil 4Q08 $/BOE 1Q09 $/BOE 2Q09 $/BOE 3Q09 $/BOE CO2 Costs $11,723 28% $ 6.90 Direct $ 4.55 $ 3.47 $3.68 $4.25 Power & Fuel 9,622 23% 5.67 Partially 5.14 5.54 5.72 5.98 Labor & Overhead 5,166 12% 3.04 None 3.14 3.45 3.34 3.55 Equipment Ren
Slide 83: CO2 Cost & NYMEX Price
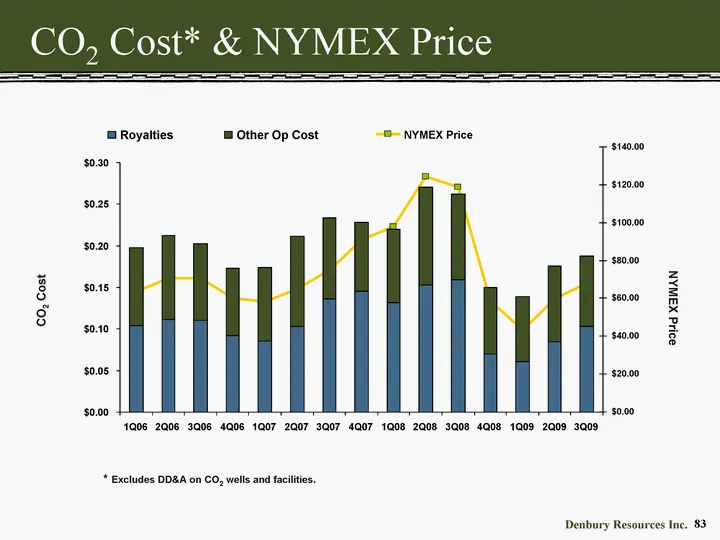
CO2 Cost* & NYMEX Price CO2 Cost NYMEX Price * Excludes DD&A on CO2 wells and facilities. $0.00 $20.00 $40.00 $60.00 $80.00 $100.00 $120.00 $140.00 NYMEX Price $0.00 $0.05 $0.10 $0.15 $0.20 $0.25 $0.30 1Q06 2Q06 3Q06 4Q06 1Q07 2Q07 3Q07 4Q07 1Q08 2Q08 3Q08 4Q08 1Q09 2Q09 3Q09 Royalties Other Op Cost
Slide 84: Production by Area
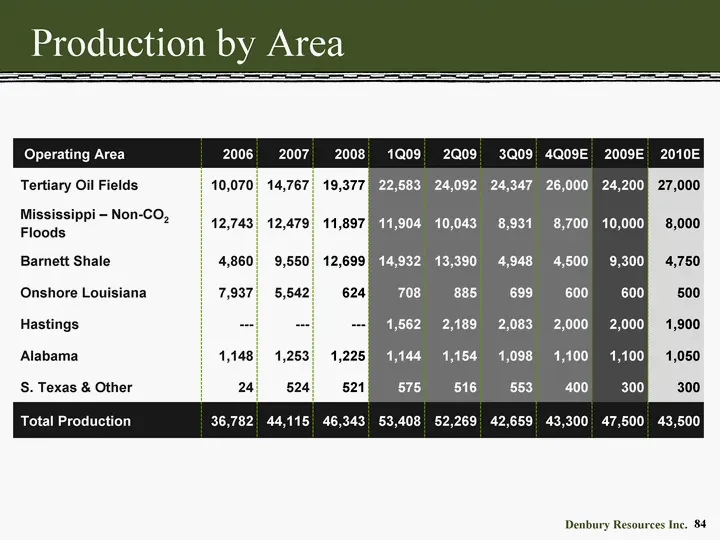
Production by Area Operating Area 2006 2007 2008 1Q09 2Q09 3Q09 4Q09E 2009E 2010E Tertiary Oil Fields 10,070 14,767 19,377 22,583 24,092 24,347 26,000 24,200 27,000 Mississippi - Non-CO2 Floods 12,743 12,479 11,897 11,904 10,043 8,931 8,700 10,000 8,000 Barnett Shale 4,860 9,550 12,699 14,932 13,390
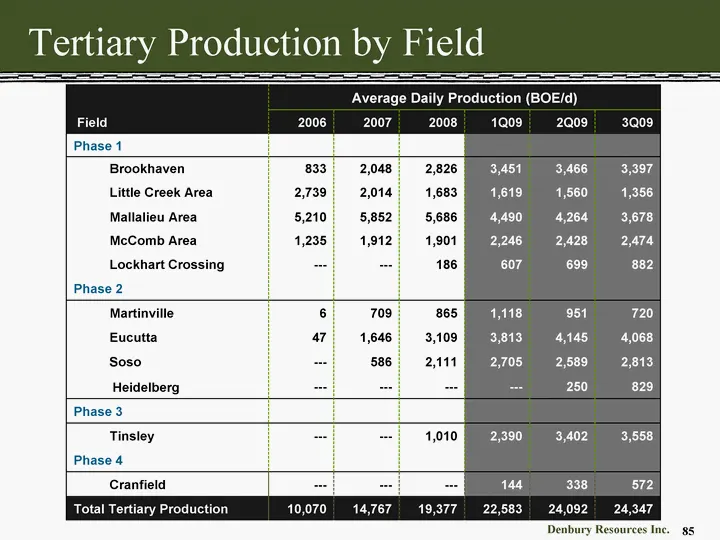
Slide 85: Tertiary Production by Field
Tertiary Production by Field Average Daily Production (BOE/d) Average Daily Production (BOE/d) Average Daily Production (BOE/d) Average Daily Production (BOE/d) Average Daily Production (BOE/d) Average Daily Production (BOE/d) Field 2006 2007 2008 1Q09 2Q09 3Q09 Phase 1 Brookhaven 833 2,048 2,826 3,
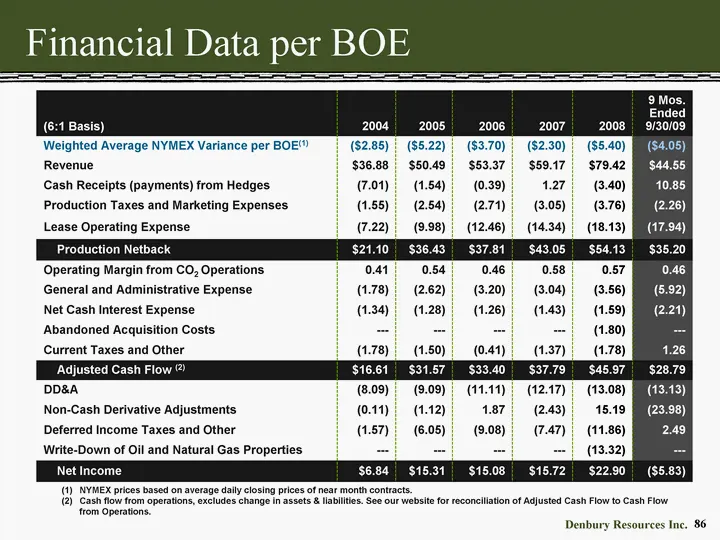
Slide 86: Financial Data per BOE
Financial Data per BOE NYMEX prices based on average daily closing prices of near month contracts. Cash flow from operations, excludes change in assets & liabilities. See our website for reconciliation of Adjusted Cash Flow to Cash Flow from Operations. (6:1 Basis) 2004 2005 2006 2007 2008 9 Mos. En
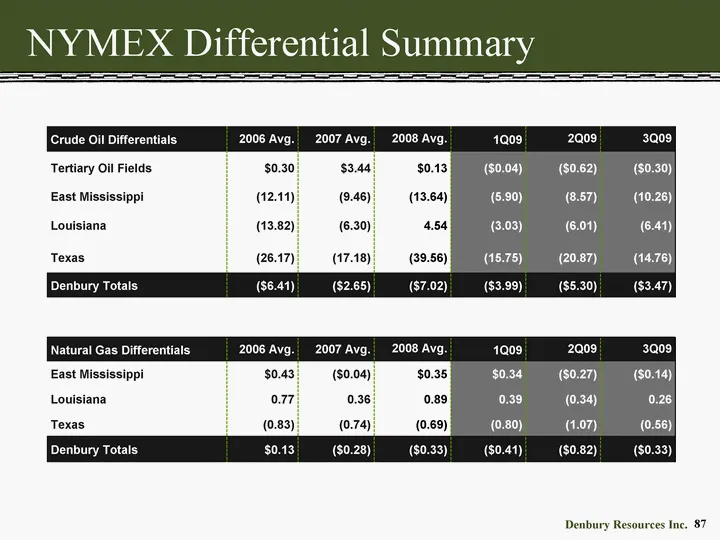
Slide 87: NYMEX Differential Summary
NYMEX Differential Summary Crude Oil Differentials 2006 Avg. 2007 Avg. 2008 Avg. 1Q09 2Q09 3Q09 Tertiary Oil Fields $0.30 $3.44 $0.13 ($0.04) ($0.62) ($0.30) East Mississippi (12.11) (9.46) (13.64) (5.90) (8.57) (10.26) Louisiana (13.82) (6.30) 4.54 (3.03) (6.01) (6.41) Texas (26.17) (17.18) (39.56)
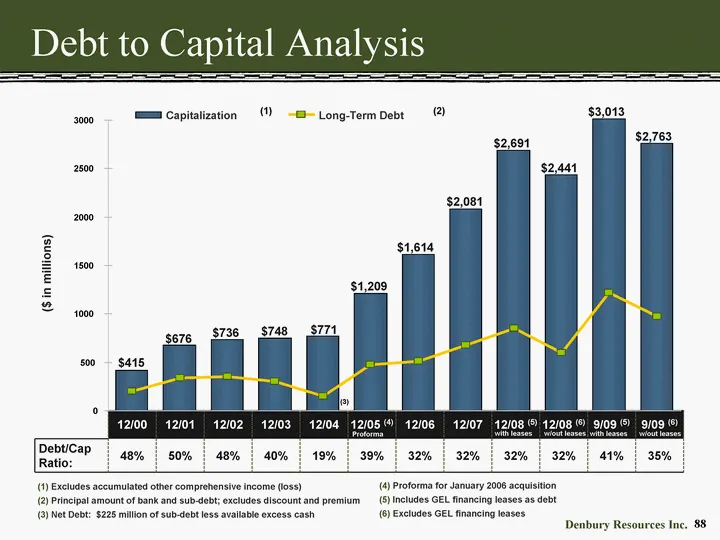
Slide 88: Debt to Capital Analysis
Debt to Capital Analysis $350 ($ in millions) $415 $736 (1) (2) 12/00 12/01 12/02 12/03 12/04 12/05 (4) 12/06 12/07 12/08 (5) 12/08 (6) 9/09 (5) 9/09 (6) Debt/Cap Ratio: 48% 50% 48% 40% 19% 39% 32% 32% 32% 32% 41% 35% $300 $748 $150 (3) $771 $1,614 $475 $1,209 $509 $2,081 $675 $2,691 $2,441 $850 $60
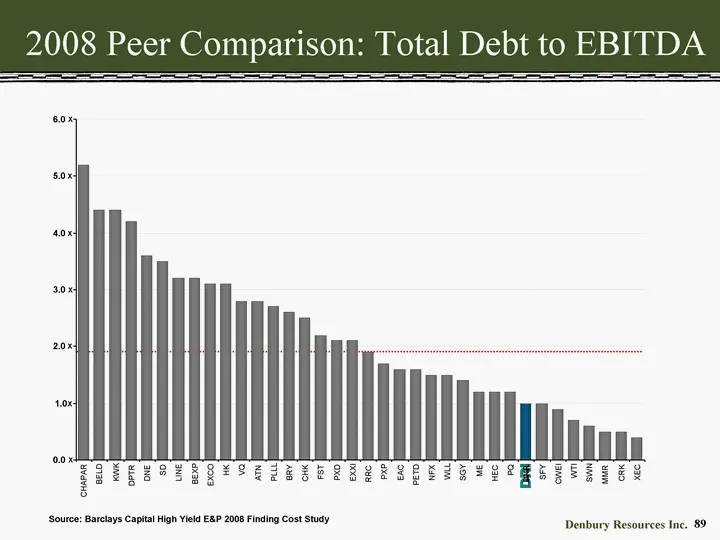
Slide 89: 2008 Peer Comparison: Total Debt to EBITDA
2008 Peer Comparison: Total Debt to EBITDA Source: Barclays Capital High Yield E&P 2008 Finding Cost Study X X X X X X X 0.0 1.0 2.0 3.0 4.0 5.0 6.0 CHAPAR BELD KWK DPTR DNE SD LINE BEXP EXCO HK VQ ATN PLLL BRY CHK FST PXD EXXI RRC PXP EAC PETD NFX WLL SGY ME HEC PQ DNR SFY CWEI WTI SWN MMR CRK XEC
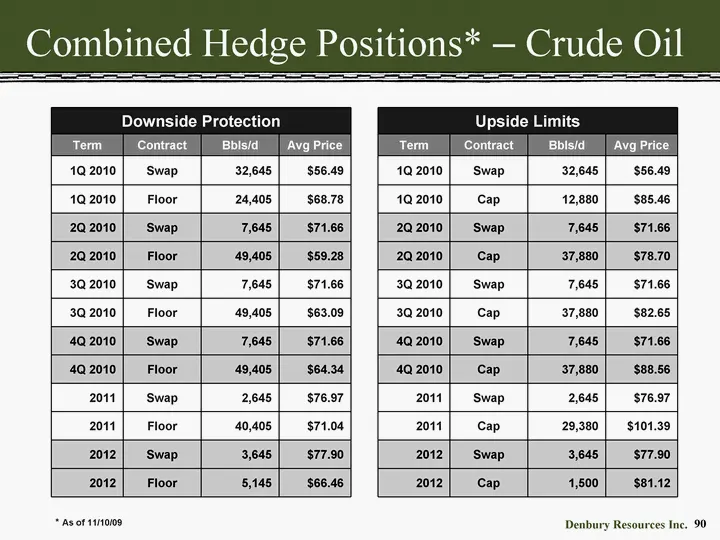
Slide 90: Combined Hedge Positions - Crude Oil
Combined Hedge Positions* - Crude Oil Downside Protection Downside Protection Downside Protection Downside Protection Term Contract Bbls/d Avg Price 1Q 2010 Swap 32,645 $56.49 1Q 2010 Floor 24,405 $68.78 2Q 2010 Swap 7,645 $71.66 2Q 2010 Floor 49,405 $59.28 3Q 2010 Swap 7,645 $71.66 3Q 2010 Floor 49
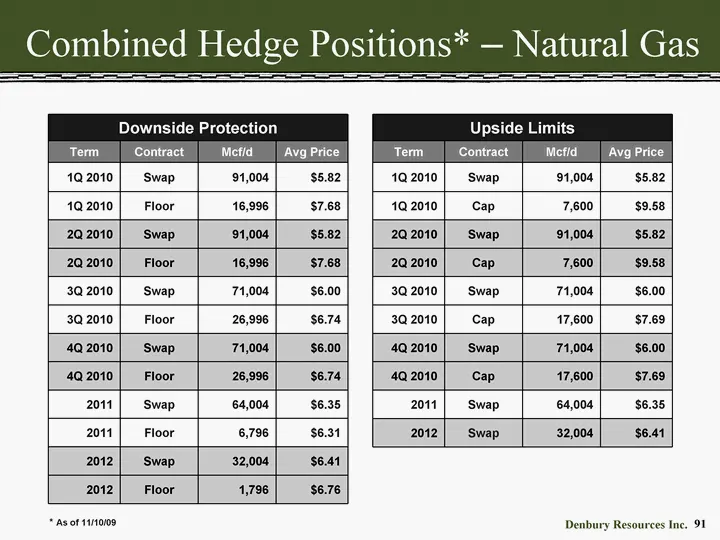
Slide 91: Combined Hedge Positions - Natural Gas
Combined Hedge Positions* - Natural Gas Downside Protection Downside Protection Downside Protection Downside Protection Term Contract Mcf/d Avg Price 1Q 2010 Swap 91,004 $5.82 1Q 2010 Floor 16,996 $7.68 2Q 2010 Swap 91,004 $5.82 2Q 2010 Floor 16,996 $7.68 3Q 2010 Swap 71,004 $6.00 3Q 2010 Floor 26,9
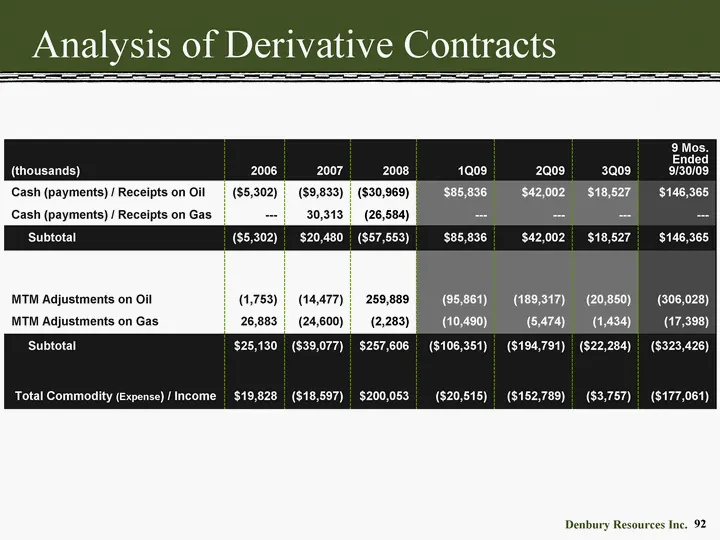
Slide 92: Analysis of Derivative Contracts
Analysis of Derivative Contracts (thousands) 2006 2007 2008 1Q09 2Q09 3Q09 9 Mos. Ended 9/30/09 Cash (payments) / Receipts on Oil ($5,302) ($9,833) ($30,969) $85,836 $42,002 $18,527 $146,365 Cash (payments) / Receipts on Gas --- 30,313 (26,584) --- --- --- --- Subtotal ($5,302) $20,480 ($57,553) $85
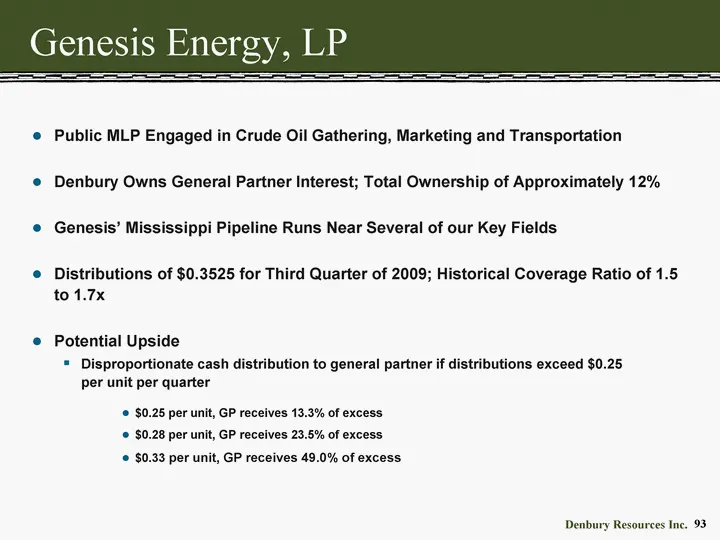
Slide 93: Genesis Energy, LP
Genesis Energy, LP Public MLP Engaged in Crude Oil Gathering, Marketing and Transportation Denbury Owns General Partner Interest; Total Ownership of Approximately 12% Genesis' Mississippi Pipeline Runs Near Several of our Key Fields Distributions of $0.3525 for Third Quarter of 2009; Historical Cove
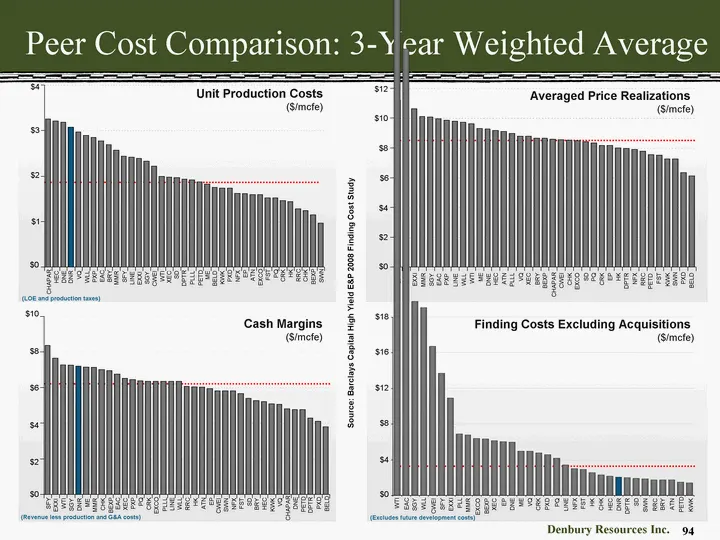
Slide 94: Peer Cost Comparison: 3-Year Weighted Average
Peer Cost Comparison: 3-Year Weighted Average Source: Barclays Capital High Yield E&P 2008 Finding Cost Study Finding Costs Excluding Acquisitions ($/mcfe) $0 $4 $8 $12 $16 $18 WTI EAC SGY WLL CWEI SFY EXXI PLL MMR EXCO BEXP XEC EP DNE ME VQ CRK PXD PQ LINE NFX FST HK CHK HEC DNR DPTR SD SWN RRC BRY
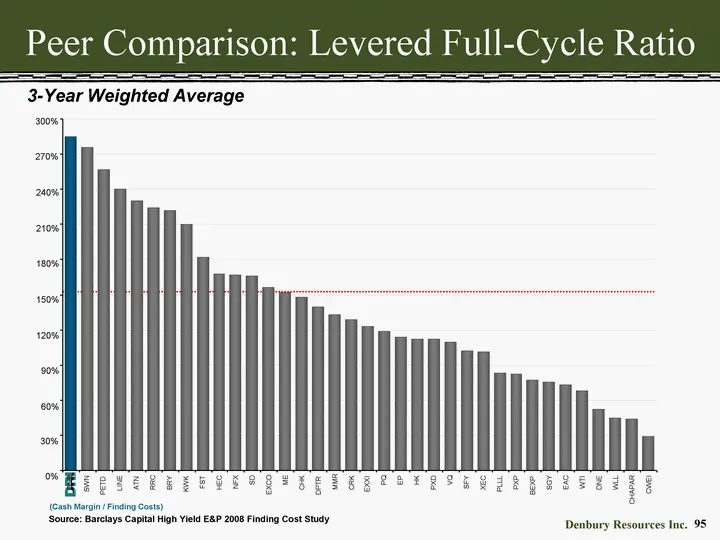
Slide 95: Peer Comparison: Levered Full-Cycle Ratio
Peer Comparison: Levered Full-Cycle Ratio Source: Barclays Capital High Yield E&P 2008 Finding Cost Study 300% 270% 0% 30% 60% 90% 120% 150% 180% 210% 240% (Cash Margin / Finding Costs) 3-Year Weighted Average DNR SWN PETD LINE ATN RRC BRY KWK FST HEC NFX SD EXCO ME CHK DPTR MMR CRK EXXI PQ EP HK PX
Slide 96: ENCO2RE + Merger
ENCO2RE + Merger
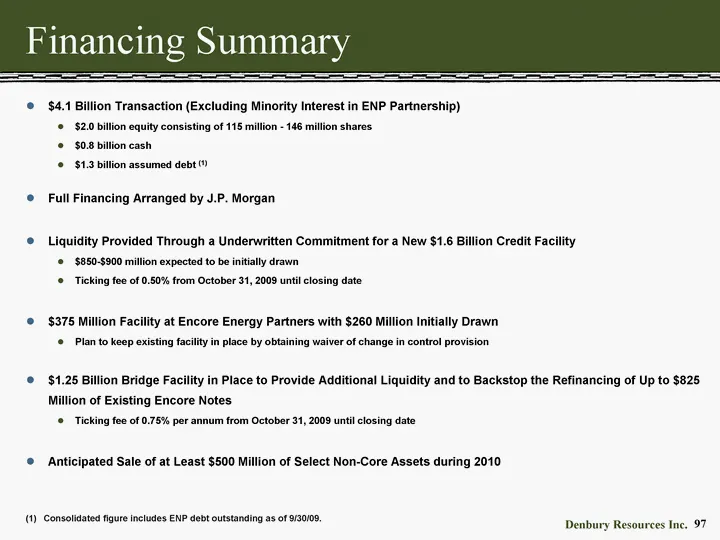
Slide 97: Financing Summary
97 Financing Summary $4.1 Billion Transaction (Excluding Minority Interest in ENP Partnership) $2.0 billion equity consisting of 115 million - 146 million shares $0.8 billion cash $1.3 billion assumed debt (1) Full Financing Arranged by J.P. Morgan Liquidity Provided Through a Underwritten Commitmen
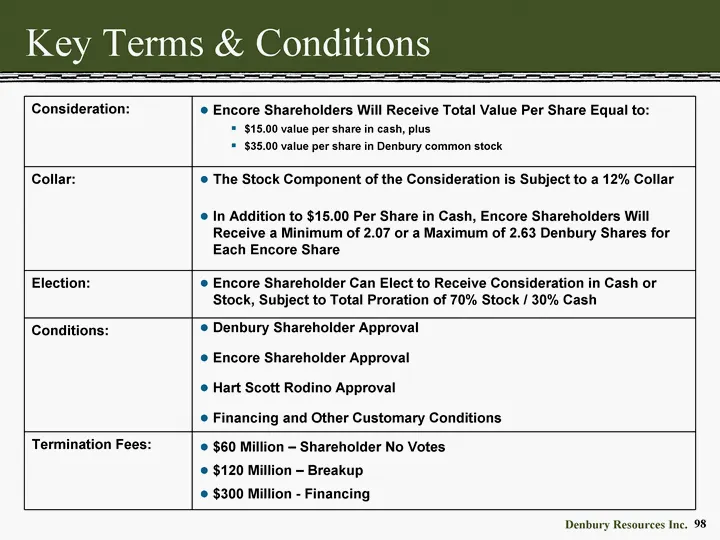
Slide 98: Key Terms & Conditions
98 Key Terms & Conditions 82% Oil 18% Gas 19% Gas Consideration: Encore Shareholders Will Receive Total Value Per Share Equal to: $15.00 value per share in cash, plus $35.00 value per share in Denbury common stock Collar: The Stock Component of the Consideration is Subject to a 12% Collar In Additio
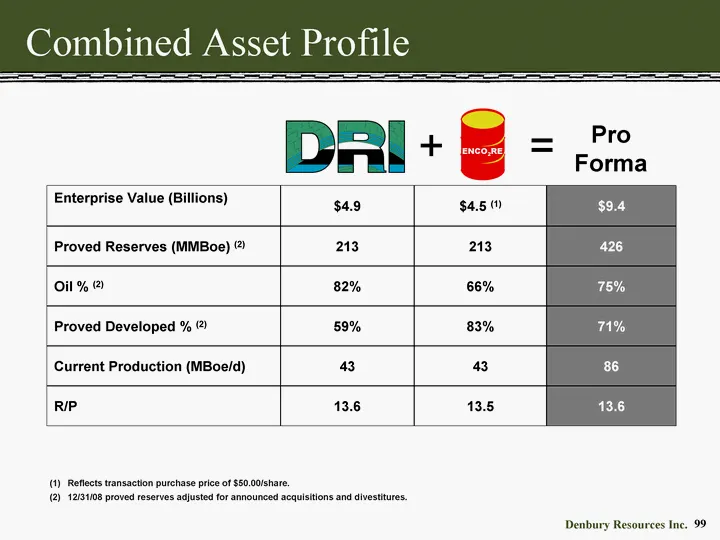
Slide 99: Combined Asset Profile
99 Combined Asset Profile Enterprise Value (Billions) $4.9 $4.5 (1) $9.4 Proved Reserves (MMBoe) (2) 213 213 426 Oil % (2) 82% 66% 75% Proved Developed % (2) 59% 83% 71% Current Production (MBoe/d) 43 43 86 R/P 13.6 13.5 13.6 Pro Forma Reflects transaction purchase price of $50.00/share. 12/31/08 pr
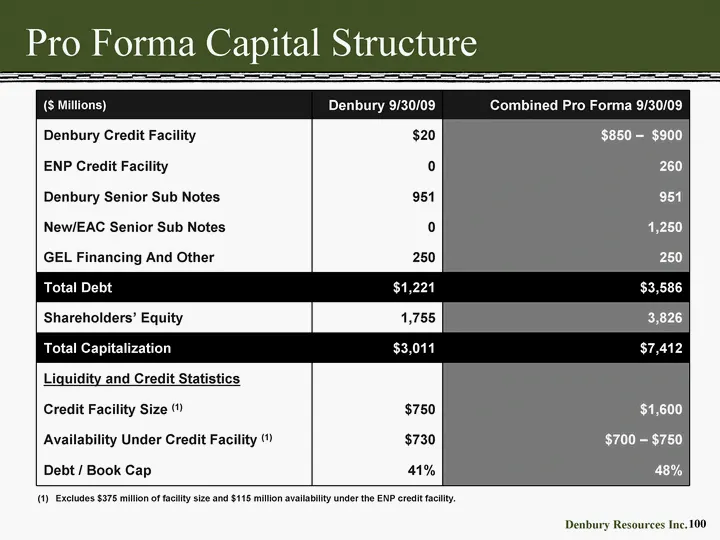
Slide 100: Pro Forma Capital Structure
100 100 Pro Forma Capital Structure ($ Millions) Denbury 9/30/09 Combined Pro Forma 9/30/09 Denbury Credit Facility $20 $850 - $900 ENP Credit Facility 0 260 Denbury Senior Sub Notes 951 951 New/EAC Senior Sub Notes 0 1,250 GEL Financing And Other 250 250 Total Debt $1,221 $3,586 Shareholders' Equit
Slide 101: Encore Energy Partners
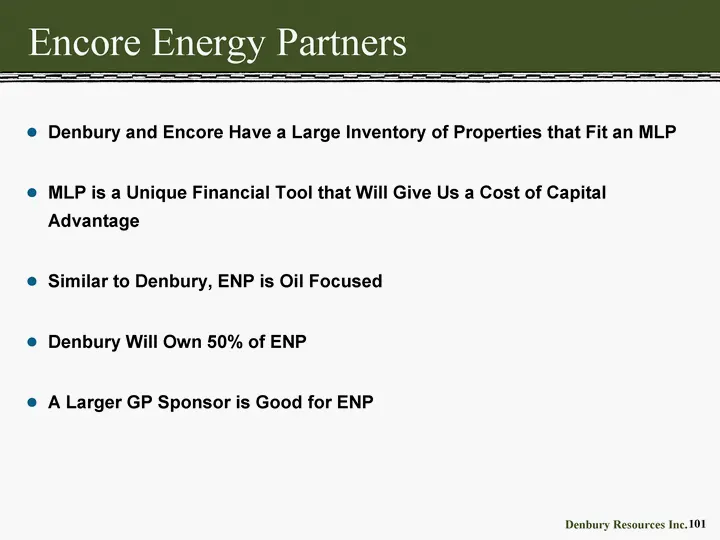
Encore Energy Partners Denbury and Encore Have a Large Inventory of Properties that Fit an MLP MLP is a Unique Financial Tool that Will Give Us a Cost of Capital Advantage Similar to Denbury, ENP is Oil Focused Denbury Will Own 50% of ENP A Larger GP Sponsor is Good for ENP
Slide 102: Concluding Remarks
Concluding Remarks Denbury Resources Inc.102
Slide 103: Summary
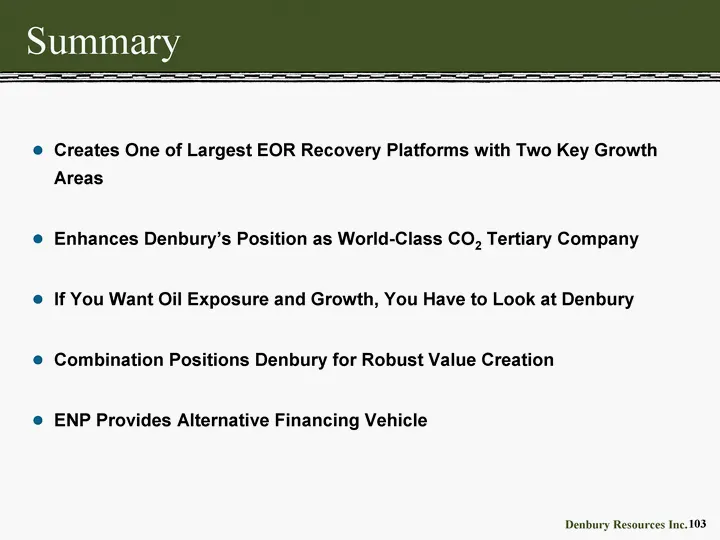
Summary Creates One of Largest EOR Recovery Platforms with Two Key Growth Areas Enhances Denbury's Position as World-Class CO2 Tertiary Company If You Want Oil Exposure and Growth, You Have to Look at Denbury Combination Positions Denbury for Robust Value Creation ENP Provides Alternative Financing
Source: SEC EDGAR · 8-K filed Nov 13, 2009
More decks from Denbury Inc.
 Merger or Acquisition (July 2023)15 slides · Jul 24, 2023
 Merger or Acquisition (July 2023)11 slides · Jul 13, 2023
 Investor Day (December 2022)40 slides · Dec 13, 2022
 Investor Presentation (September 2020)21 slides · Sep 23, 2020
 Denbury Resources — Debt Investor Presentation (July 2020)14 slides · Jul 29, 2020
 Denbury Resources — FY2018 Earnings Presentation37 slides · Feb 27, 2019