Provident Bankshares — SunTrust Robinson Humphrey conference (September 2004)
32 slides from Provident Bankshares's conference presentation, Sep 9, 2004

Slide 1: Provident Bankshares Corporation
PROVIDENT BANKSHARES CORPORATION SunTrust Robinson Humphrey September 9, 2004

Slide 2: Forward-Looking Statements and Risk Factors
FORWARD-LOOKING STATEMENTS AND RISK FACTORS This presentation, and other written materials and oral statements made by management, may contain certain forward-looking statements, including those regarding the Company’s prospective performance, plans, strategies and expectations, within the meaning o

Slide 3: Agenda
AGENDA HISTORY ‘THE NEW PROVIDENT’ KEY STRATEGIES INVESTMENT ATTRIBUTES
Slide 4: History
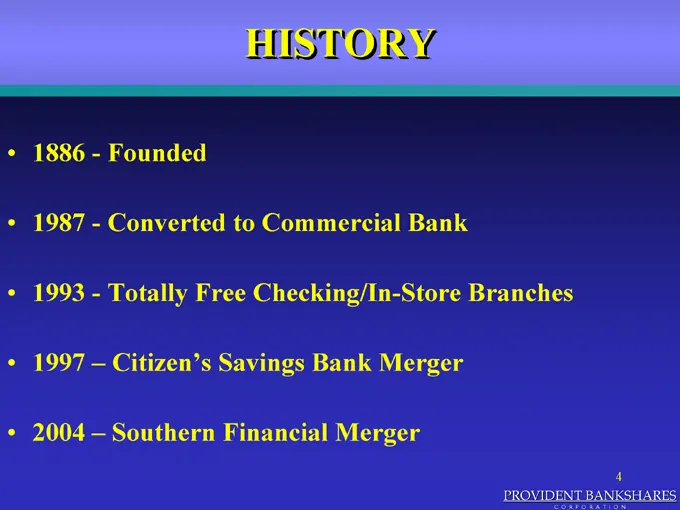
HISTORY 1886 - Founded 1987 - Converted to Commercial Bank 1993 - Totally Free Checking/In-Store Branches 1997 – Citizen’s Savings Bank Merger 2004 – Southern Financial Merger PROVIDENT BANKSHARES CORPORATION
Slide 5: The New Provident
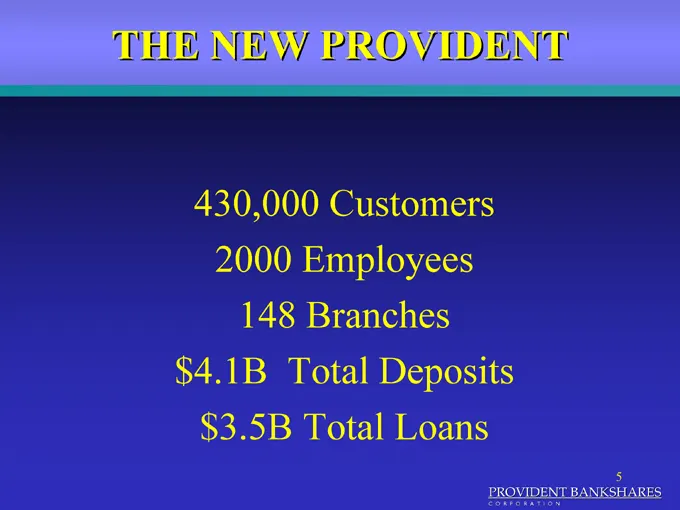
THE NEW PROVIDENT 430,000 Customers 2000 Employees 148 Branches $4.1B Total Deposits $3.5B Total Loans PROVIDENT BANKSHARES CORPORATION
Slide 6: The New Provident Franchise
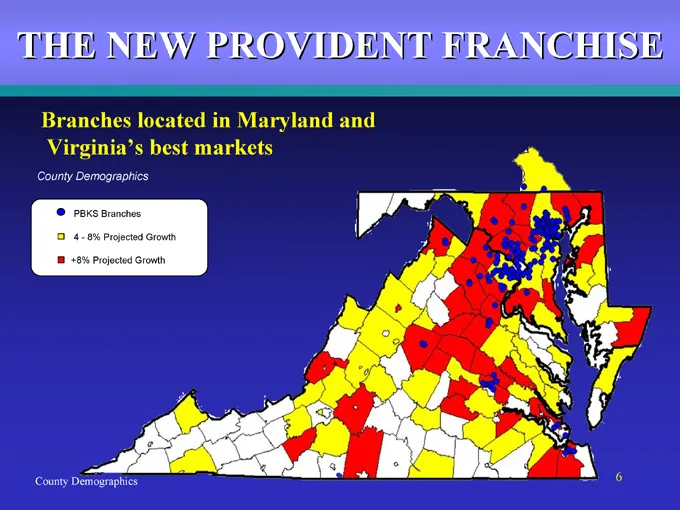
THE NEW PROVIDENT FRANCHISE Branches located in Maryland and Virginia’s best markets County Demographics PBKS Branches 4—8% Projected Growth +8% Projected Growth County Demographics

Slide 7: Strategy Statement
STRATEGY STATEMENT Provident is a regional bank serving Maryland and Virginia with emphasis in the key urban markets of Baltimore, Washington, and Richmond. Provident will continue to provide the products and services of our largest competitors, while delivering the level of service found in only th

Slide 8: Key Strategies
KEY STRATEGIES Broaden Presence and Customer Base in Washington Metro and Virginia Grow Commercial Banking Market Share in the Maryland and Virginia Markets Focus Resources on Growth in Core Business Lines Improve Financial Fundamentals PROVIDENT BANKSHARES CORPORATION

Slide 9: Broaden Presence and Customer Base in Washington Metro and Virginia
BROADEN PRESENCE AND CUSTOMER BASE IN WASHINGTON METRO AND VIRGINIA PROVIDENT BANKSHARES CORPORATION
Slide 10: Virginia and Washington Metro Expansion
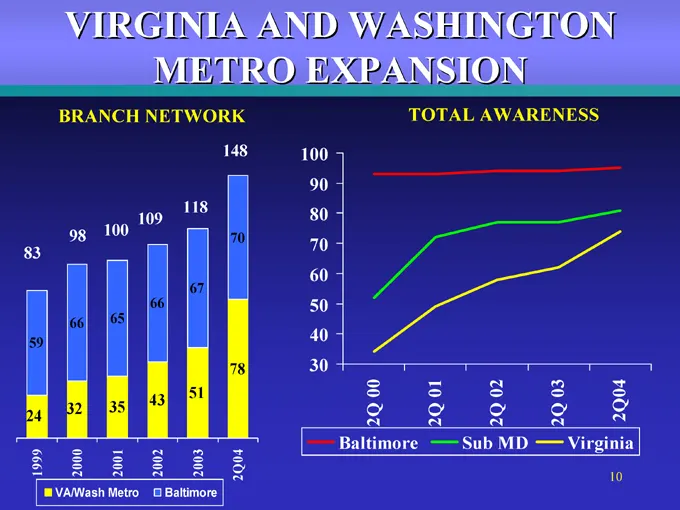
VIRGINIA AND WASHINGTON METRO EXPANSION BRANCH NETWORK 1999 2000 2001 2002 2003 2Q04 VA/Wash Metro Baltimore TOTAL AWARENESS 100 90 80 70 60 50 40 30 2Q 00 2Q 01 2Q 02 2Q 03 2Q04 Baltimore Sub MD Virginia
Slide 11: Checking Balance Growth
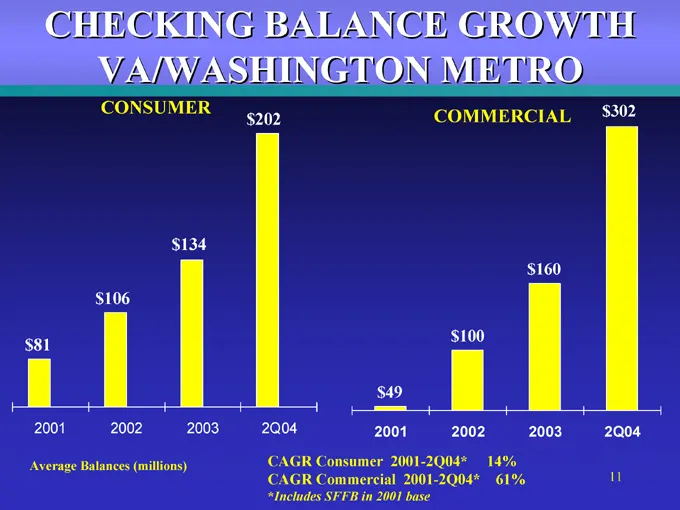
CHECKING BALANCE GROWTH VA/WASHINGTON METRO CONSUMER $81 $106 $134 $202 2001 2002 2003 2Q04 Average Balances (millions) COMMERCIAL $49 $100 $160 $302 2001 2002 2003 2Q04 CAGR Consumer 2001-2Q04* 14% CAGR Commercial 2001-2Q04* 61% * Includes SFFB in 2001 base

Slide 12: Grow Commercial Banking Market Share in Maryland and Virginia Markets
GROW COMMERCIAL BANKING MARKET SHARE IN THE MARYLAND AND VIRGINIA MARKETS PROVIDENT BANKSHARES CORPORATION

Slide 13: Definitions
DEFINITIONS Core Loans Originated by Provident; participations in our defined market area Core Consumer includes home equity loans and lines, marine, other installment loans Core Commercial includes real estate, commercial loans and lines and leases Non-Core Loans Purchased loans; participations out
Slide 14: Core Commercial Loan and Deposit/Repo Growth
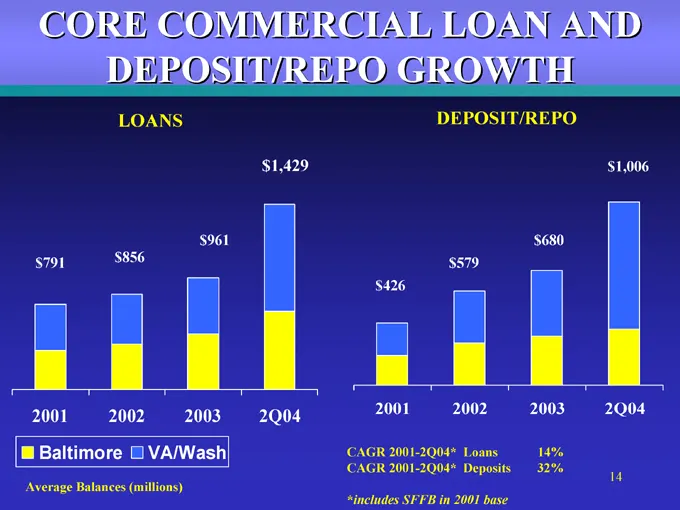
CORE COMMERCIAL LOAN AND DEPOSIT/REPO GROWTH LOANS $961 $791 $856 $1,429 2001 2002 2003 2Q04 Baltimore VA/Wash Average Balances (millions) DEPOSIT/REPO $680 $579 $426 $1,006 2001 2002 2003 2Q04 CAGR 2001-2Q04* Loans 14% CAGR 2001-2Q04* Deposits 32% *includes SFFB in 2001 base

Slide 15: Focus Resources on Growth in Core Business Lines
FOCUS RESOURCES ON GROWTH IN CORE BUSINESS LINES PROVIDENT BANKSHARES CORPORATION
Slide 16: Core Loan and Deposit Growth
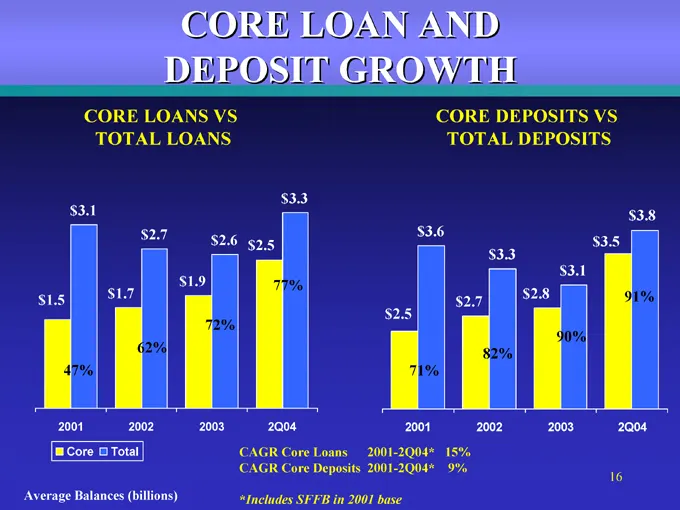
CORE LOAN AND DEPOSIT GROWTH CORE LOANS VS TOTAL LOANS $1.5 $3.1 $1.7 $2.7 $1.9 $2.6 $2.5 $3.3 47% 62% 72% 77% 2001 2002 2003 2Q04 Core Total Average Balances (billions) CORE DEPOSITS VS TOTAL DEPOSITS $2.5 $3.6 $2.7 $3.3 $2.8 $3.1 $3.5 $3.8 71% 82% 90% 91% 2001 2002 2003 2Q04 CAGR Core Loans 2001-2

Slide 17: Provident's In-Store Difference
PROVIDENT’S IN-STORE DIFFERENCE *PEOPLE* *PARTNERS *PRODUCT* *PROGRAM
Slide 18: Provident Bank Network Traditional/In-Store
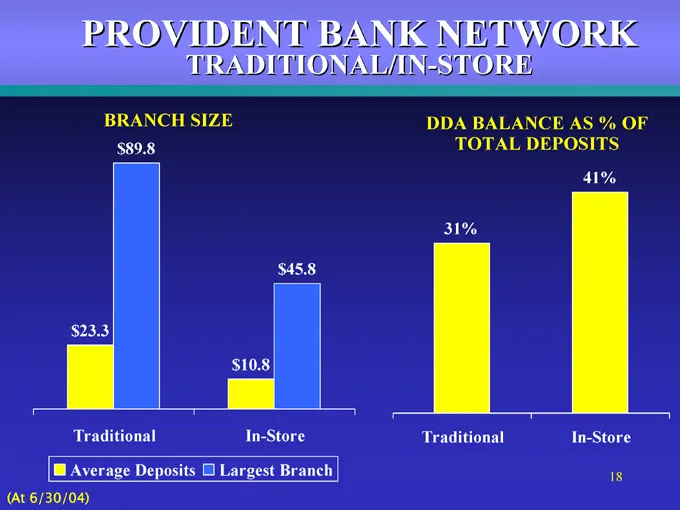
PROVIDENT BANK NETWORK TRADITIONAL/IN-STORE BRANCH SIZE $89.8 $23.3 $45.8 $10.8 Traditional In-Store Average Deposits Largest Branch (At 6/30/04) DDA BALANCE AS % OF TOTAL DEPOSITS 31% 41% Traditional In-Store
Slide 19: Consumer DDA Fees
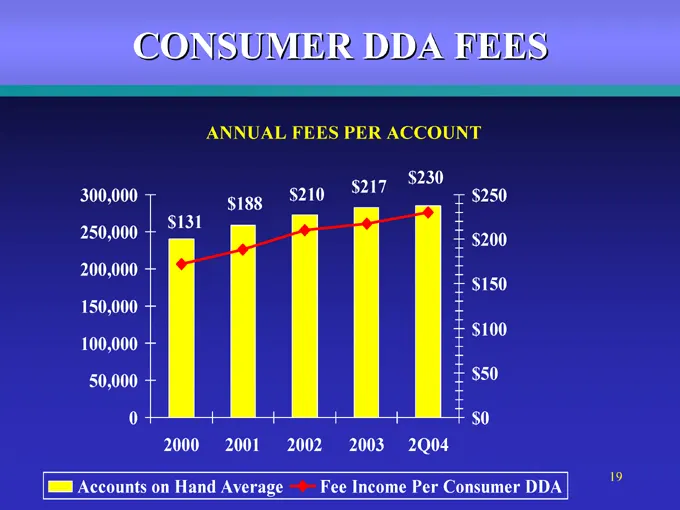
CONSUMER DDA FEES ANNUAL FEES PER ACCOUNT 300,000 250,000 200,000 150,000 100,000 50,000 0 $230 $210 $217 $188 $131 $250 $200 $150 $100 $50 $0 2000 2001 2002 2003 2Q04 Accounts on Hand Average Fee Income Per Consumer DDA

Slide 20: Improve Financial Fundamentals
IMPROVE FINANCIAL FUNDAMENTALS PROVIDENT BANKSHARES CORPORATION

Slide 21: The New Provident
THE NEW PROVIDENT TRANSFORMED BALANCE SHEET HIGHER ABSOLUTE EARNINGS IMPROVED EARNINGS QUALITY
Slide 22: Component of Earning Asset
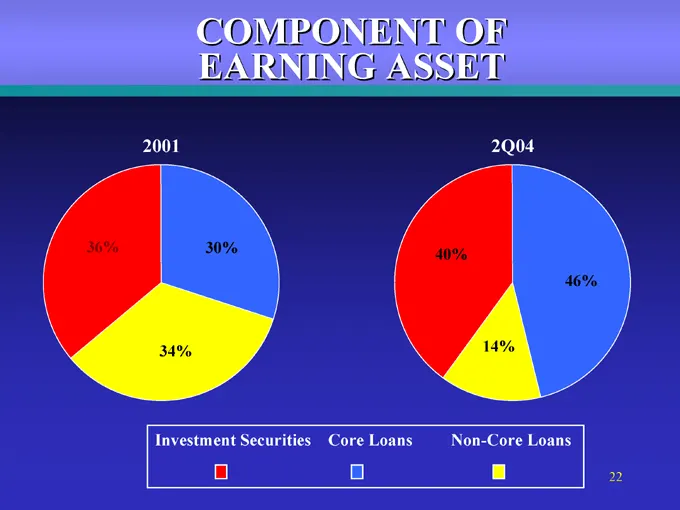
COMPONENT OF EARNING ASSET 36% 30% 34% 2Q04 40% 46% 14% Investment Securities Core Loans Non-Core Loans
Slide 23: Core Loans to Total Loans
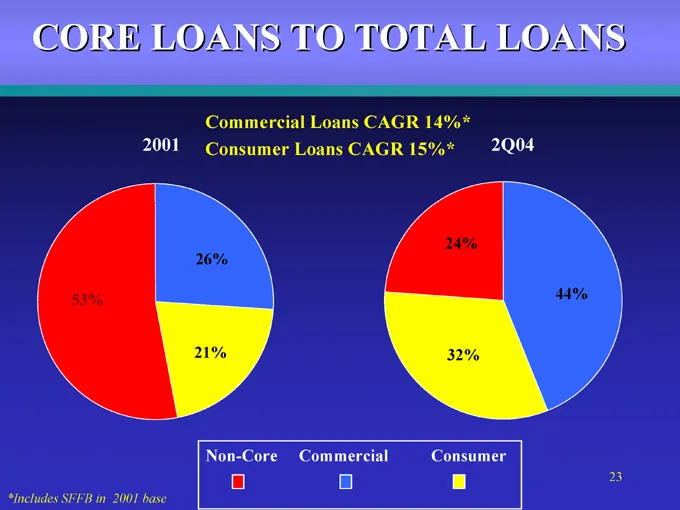
CORE LOANS TO TOTAL LOANS Commercial Loans CAGR 14%* Consumer Loans CAGR 15%* 2Q04 53% 26% 21% 24% 32% 44% Non-Core Commercial Consumer *Includes SFFB in 2001 base
Slide 24: Funding to Earning Assets
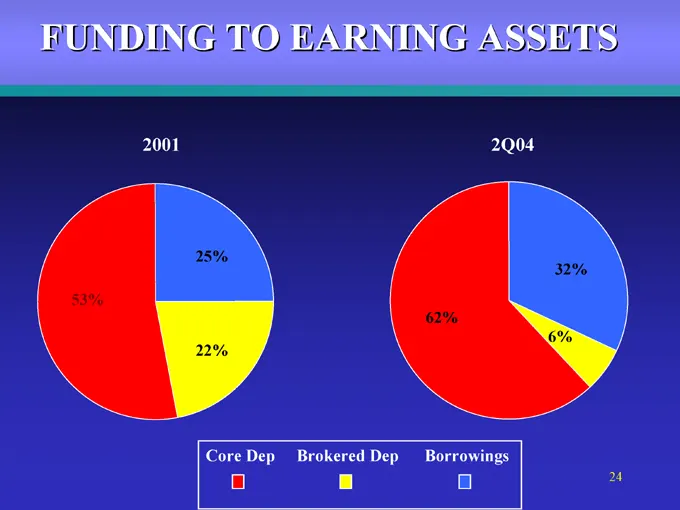
FUNDING TO EARNING ASSETS 53% 25% 22% 2Q04 62% 32% 6% Core Dep Brokered Dep Borrowings
Slide 25: Core Deposit Growth
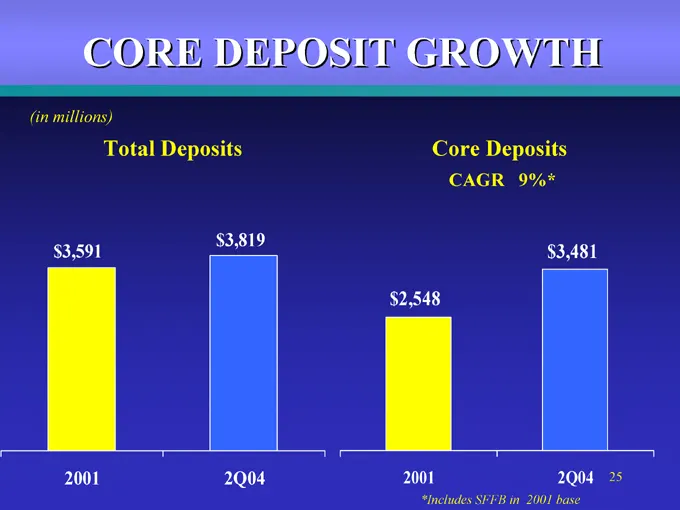
CORE DEPOSIT GROWTH (in millions) Total Deposits Core Deposits CAGR 9%* $3,819 $3,591 $3,481 $2,548 2Q04 2001 2Q04 *Includes SFFB in 2001 base
Slide 26: Asset Quality
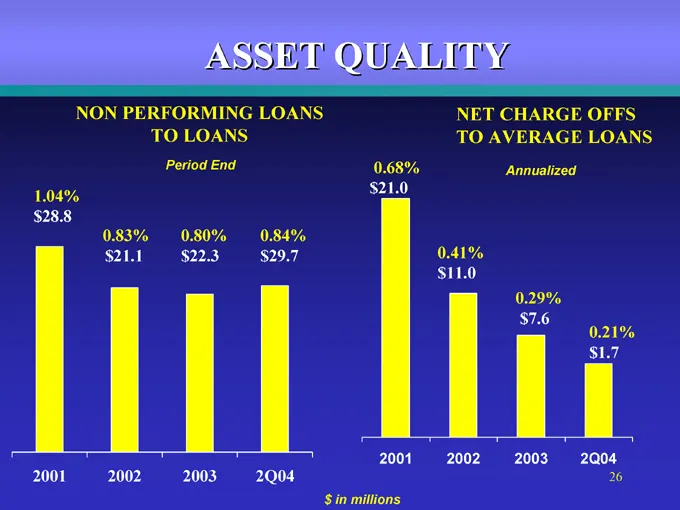
ASSET QUALITY NON PERFORMING LOANS TO LOANS Period End NET CHARGE OFFS TO AVERAGE LOANS Annualized 1.04% $28.8 0.83% $21.1 0.80% $22.3 0.84% $29.7 0.68% $21.0 0.41% $11.0 0.29% $7.6 0.21% $1.7 2001 2002 2003 2Q04 2001 2002 2003 2Q04 $ in millions
Slide 27: Earnings Per Share
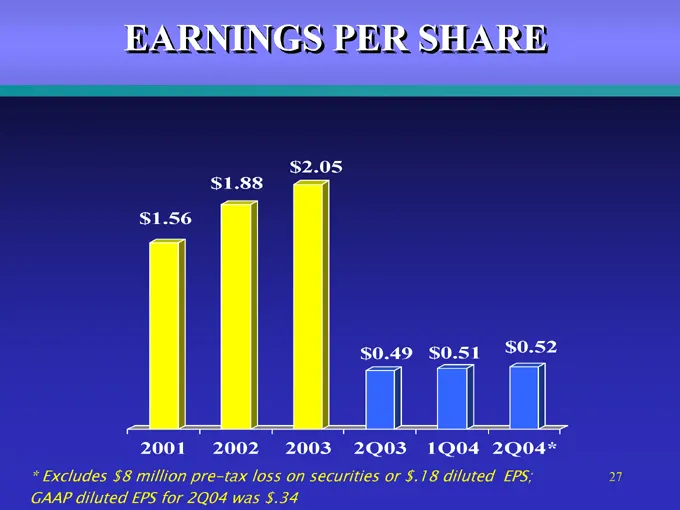
EARNINGS PER SHARE $2.05 $1.88 $1.56 $0.49 $0.51 $0.52 2001 2002 2003 2Q03 1Q04 2Q04* * Excludes $8 million pre-tax loss on securities or $.18 diluted EPS; GAAP diluted EPS for 2Q04 was $.34
Slide 28: Dividend Trends
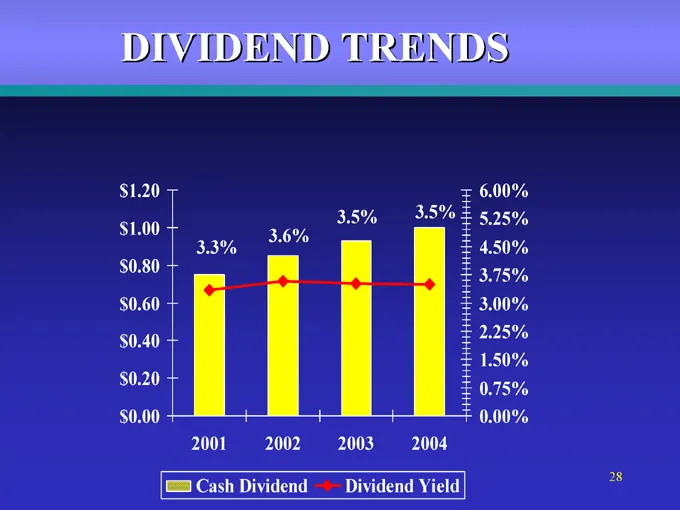
DIVIDEND TRENDS $1.20 $1.00 $0.80 $0.60 $0.40 $0.20 $0.00 3.6% 3.3% 3.5% 3.5% 6.00% 5.25% 4.50% 3.75% 3.00% 2.25% 1.50% 0.75% 0.00% 2001 2002 2003 2004 Cash Dividend Dividend Yield
Slide 29: Equity Summary Total Return Comparison
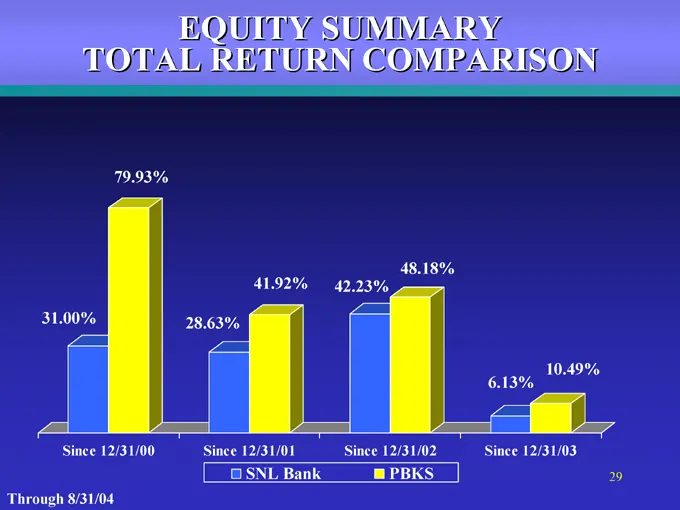
EQUITY SUMMARY TOTAL RETURN COMPARISON 31.00% 79.93% 28.63% 41.92% 42.23% 48.18% 6.13% 10.49% Since 12/31/00 Since 12/31/01 Since 12/31/02 Since 12/31/03 SNL Bank PBKS Through 8/31/04
Slide 30: Measures of Success
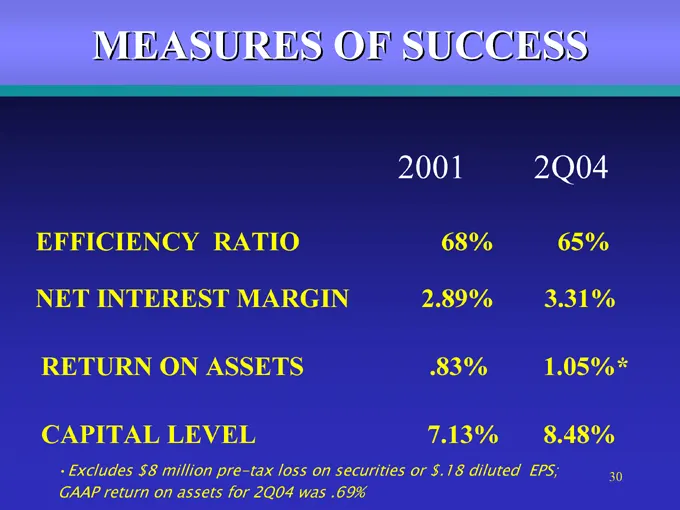
MEASURES OF SUCCESS 2001 2Q04 EFFICIENCY RATIO 68% 65% NET INTEREST MARGIN 2.89% 3.31% RETURN ON ASSETS83% 1.05%* CAPITAL LEVEL 7.13% 8.48% Excludes $8 million pre-tax loss on securities or $.18 diluted EPS; GAAP return on assets for 2Q04 was .69%

Slide 31: Investment Attributes
INVESTMENT ATTRIBUTES Core balance sheet momentum Effective expansion strategy Growing market share in attractive markets Stable and improving credit quality Experienced management team PROVIDENT BANKSHARES CORPORATION

Slide 32: Provident Bankshares Corporation Contact
PROVIDENT BANKSHARES CORPORATION (www.provbank.com) Contact: Media: Lillian Kilroy: (410) 277-2833 Investment Community: Tricia Ferrick: (703) 352-2583 PROVIDENT BANKSHARES CORPORATION
Source: SEC EDGAR · 8-K filed Sep 9, 2004
More decks from Provident Bankshares Corp
 Merger or Acquisition (December 2008)32 slides · Dec 19, 2008
 2007 Stifel Nicolaus Financial Institutions Investor Conference52 slides · Dec 6, 2007
 Investor Presentation (November 2007)49 slides · Nov 8, 2007
 FTN Midwest Small and Mid Cap Bank Conference 200757 slides · Sep 6, 2007
 Investor Presentation (May 2007)51 slides · May 8, 2007
 KBW Regional Bank Conference 200751 slides · Feb 28, 2007