DEX ONE — R.H. Donnelley — Deutsche Bank High Yield Conference 2004
38 slides from DEX ONE's conference presentation, Oct 6, 2004

Slide 1: Deutsche Bank High Yield Conference
Deutsche Bank High Yield Conference October 6, 2004
Slide 2: Safe Harbor Statement
Safe Harbor Statement Certain statements contained in this presentation regarding R.H. Donnelley's future operating results or performance or business plans or prospects and any other statements not constituting historical fact are "forward-looking statements" subject to the safe harbor created by t

Slide 3: Company Overview
Company Overview
Slide 4: Overview of R.H. Donnelley
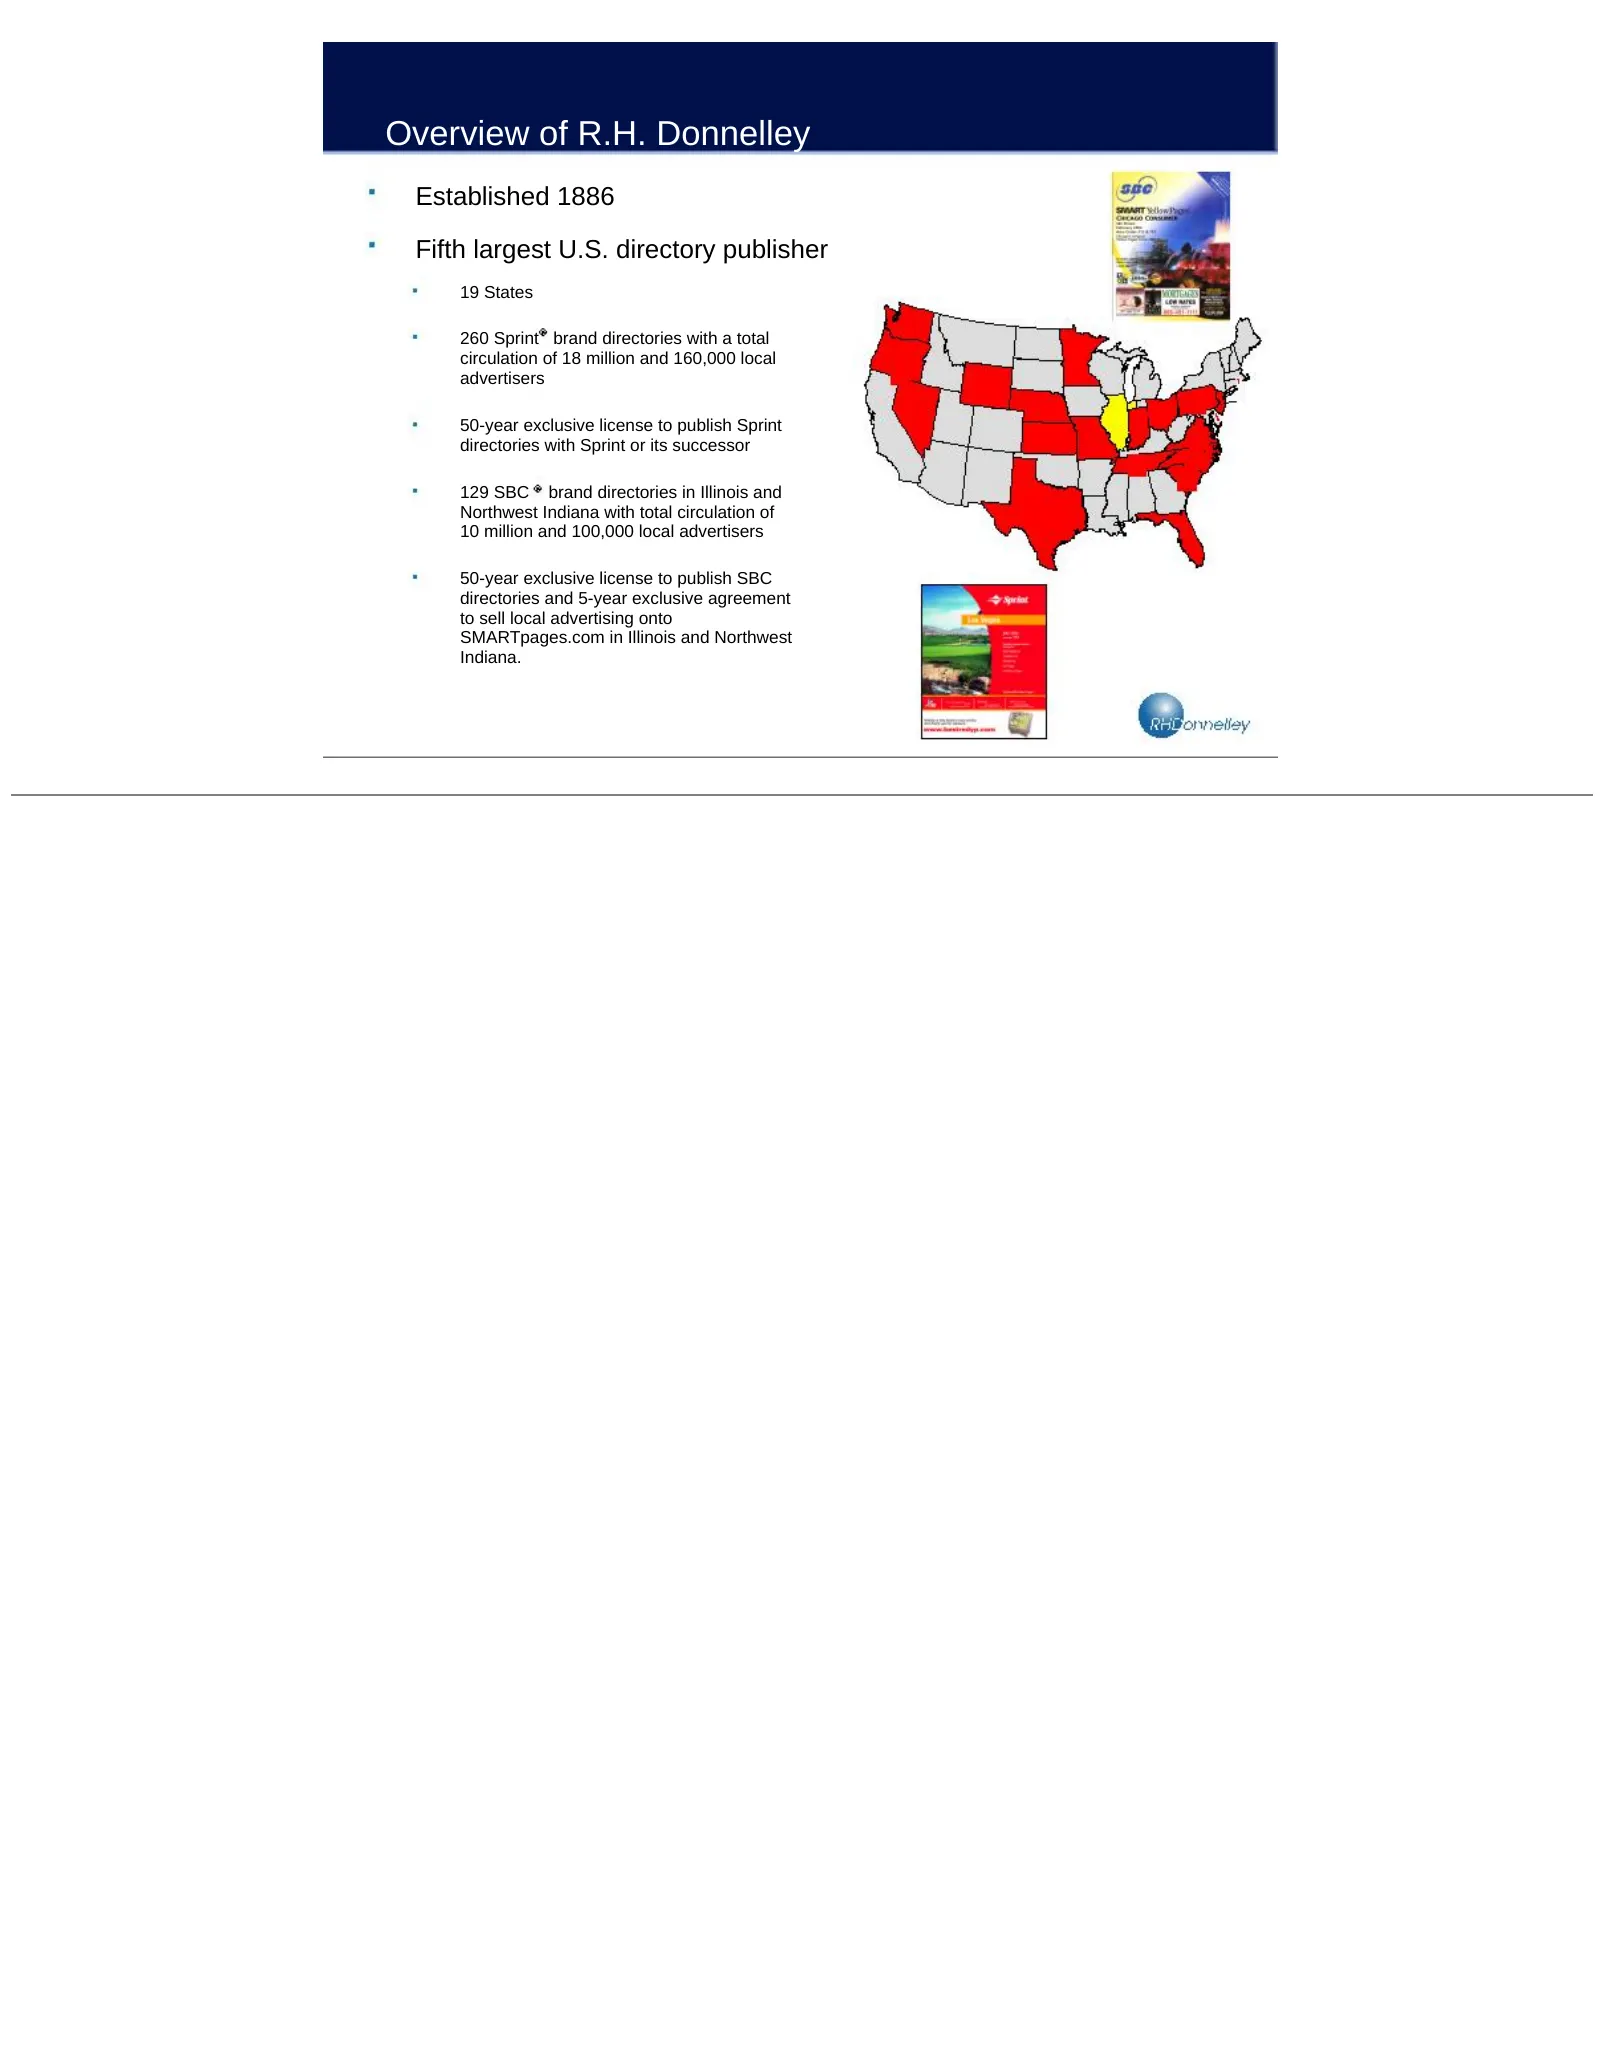
Overview of R.H. Donnelley Established 1886 Fifth largest U.S. directory publisher 19 States 260 Sprint brand directories with a total circulation of 18 million and 160,000 local advertisers 50-year exclusive license to publish Sprint directories with Sprint or its successor 129 SBC brand directorie
Slide 5: Organization Structure
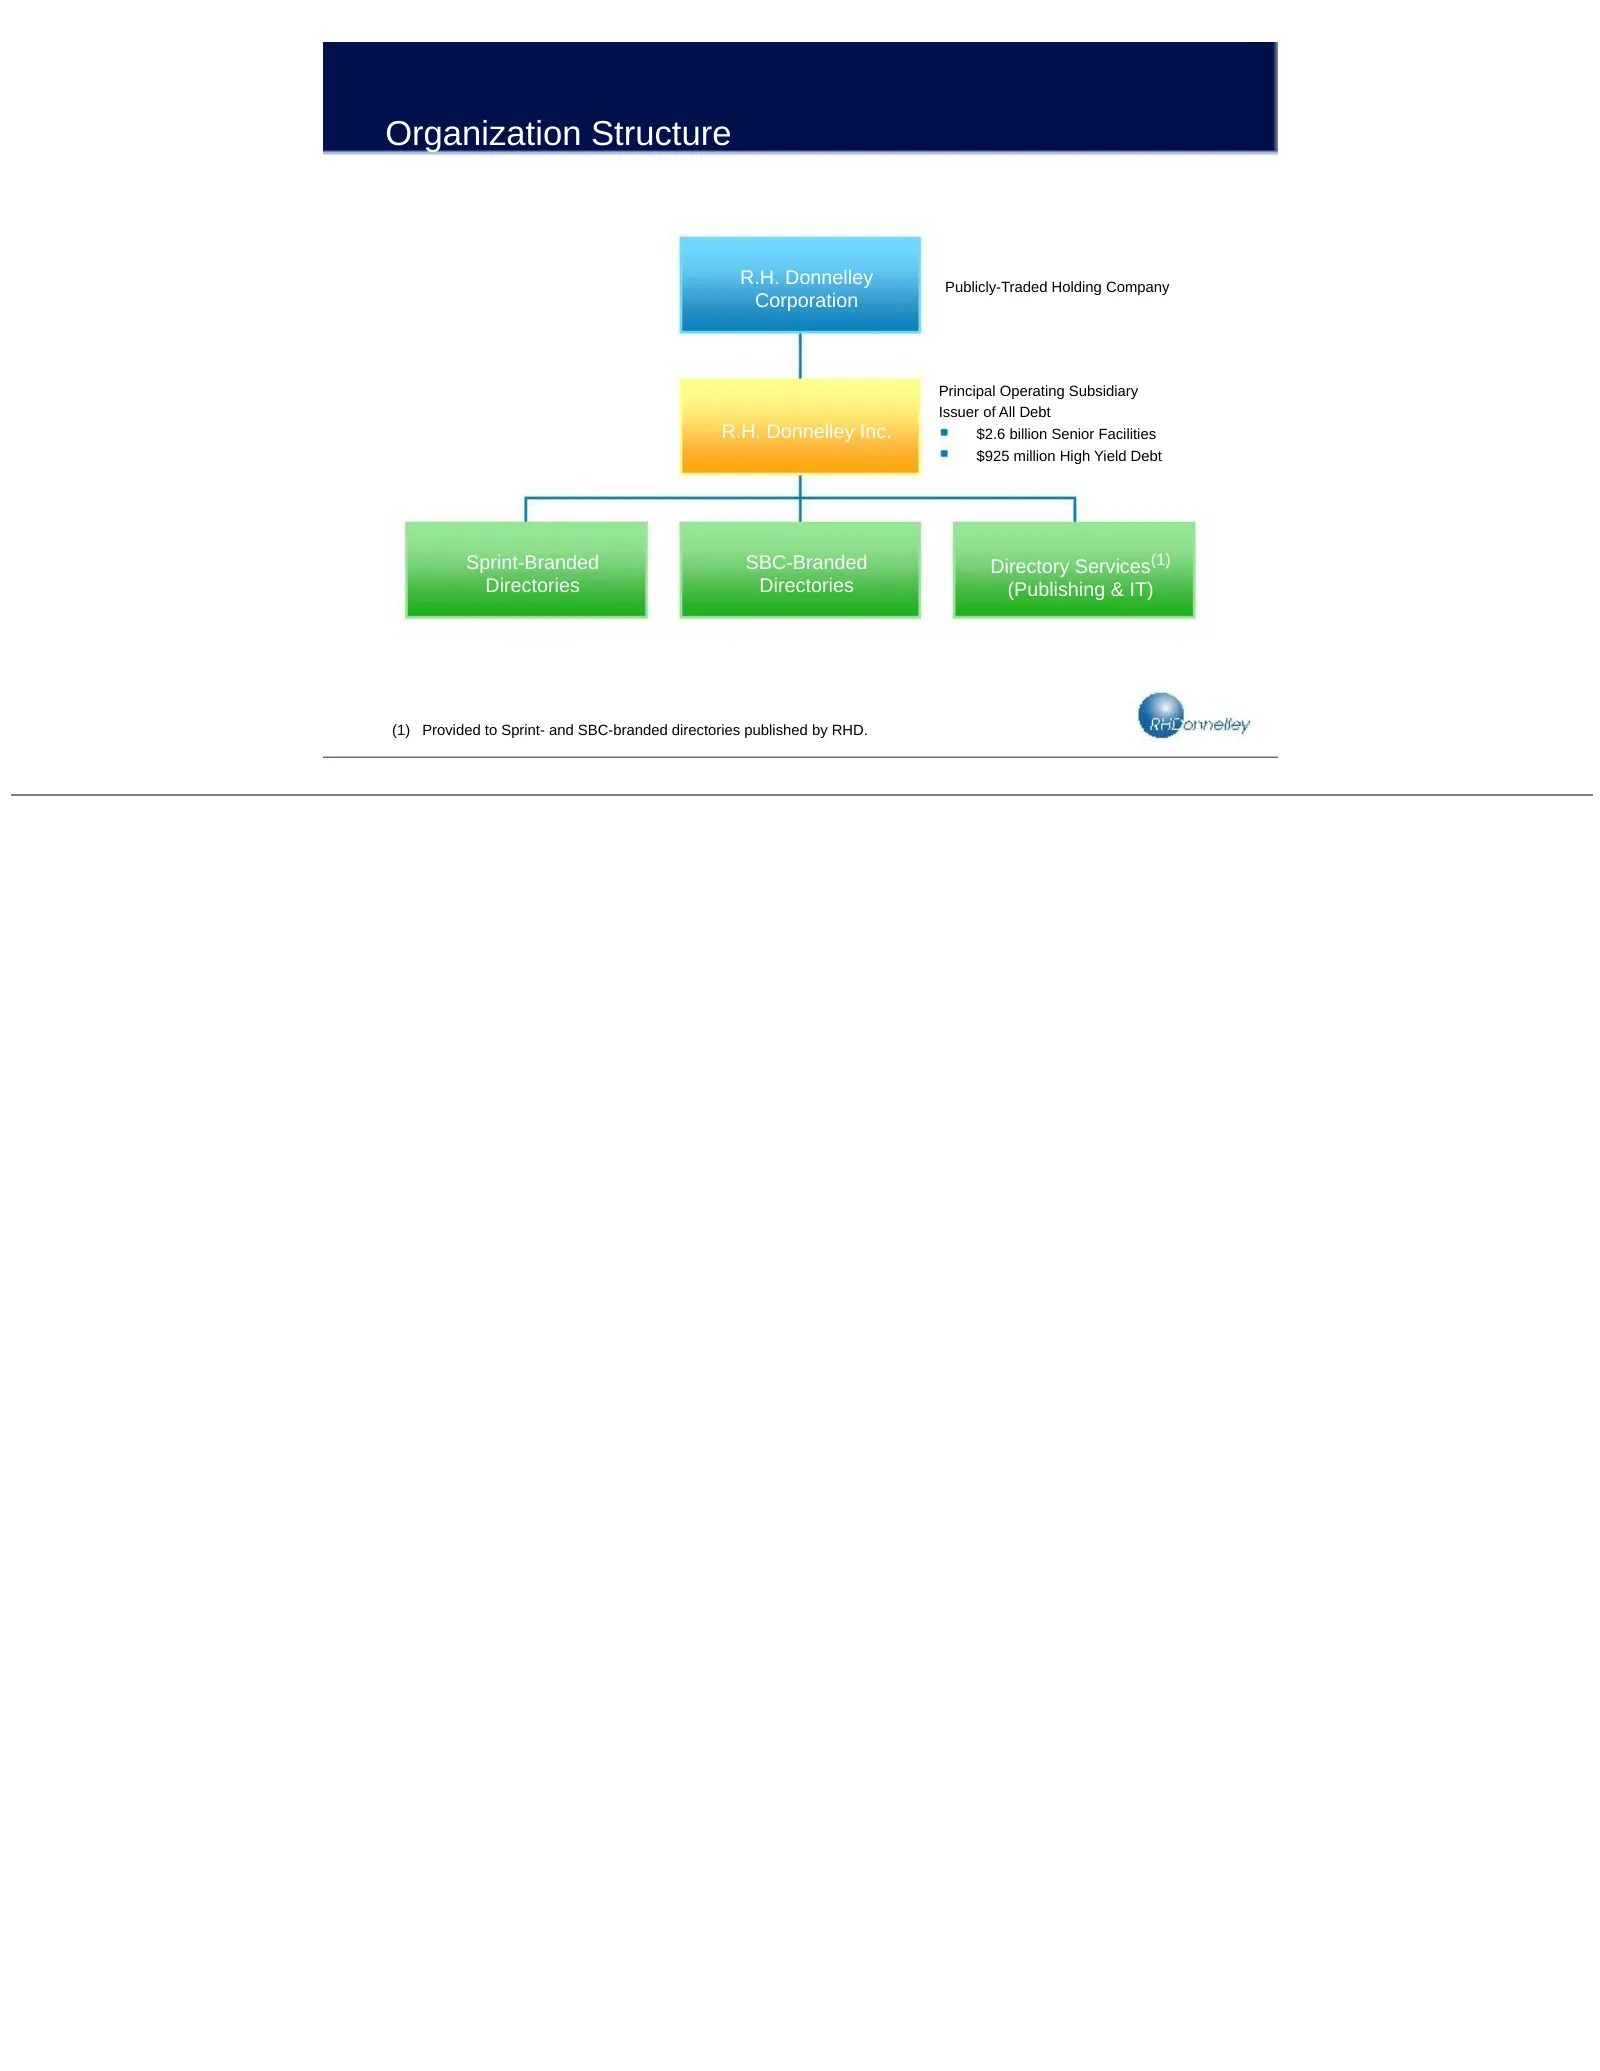
Organization Structure R.H. Donnelley Publicly-Traded Holding Company Corporation Principal Operating Subsidiary Issuer of All Debt R.H. Donnelley Inc. $2.6 billion Senior Facilities $925 million High Yield Debt Sprint-Branded SBC-Branded Directory Services(1) Directories Directories (Publishing & I
Slide 6: Management Team
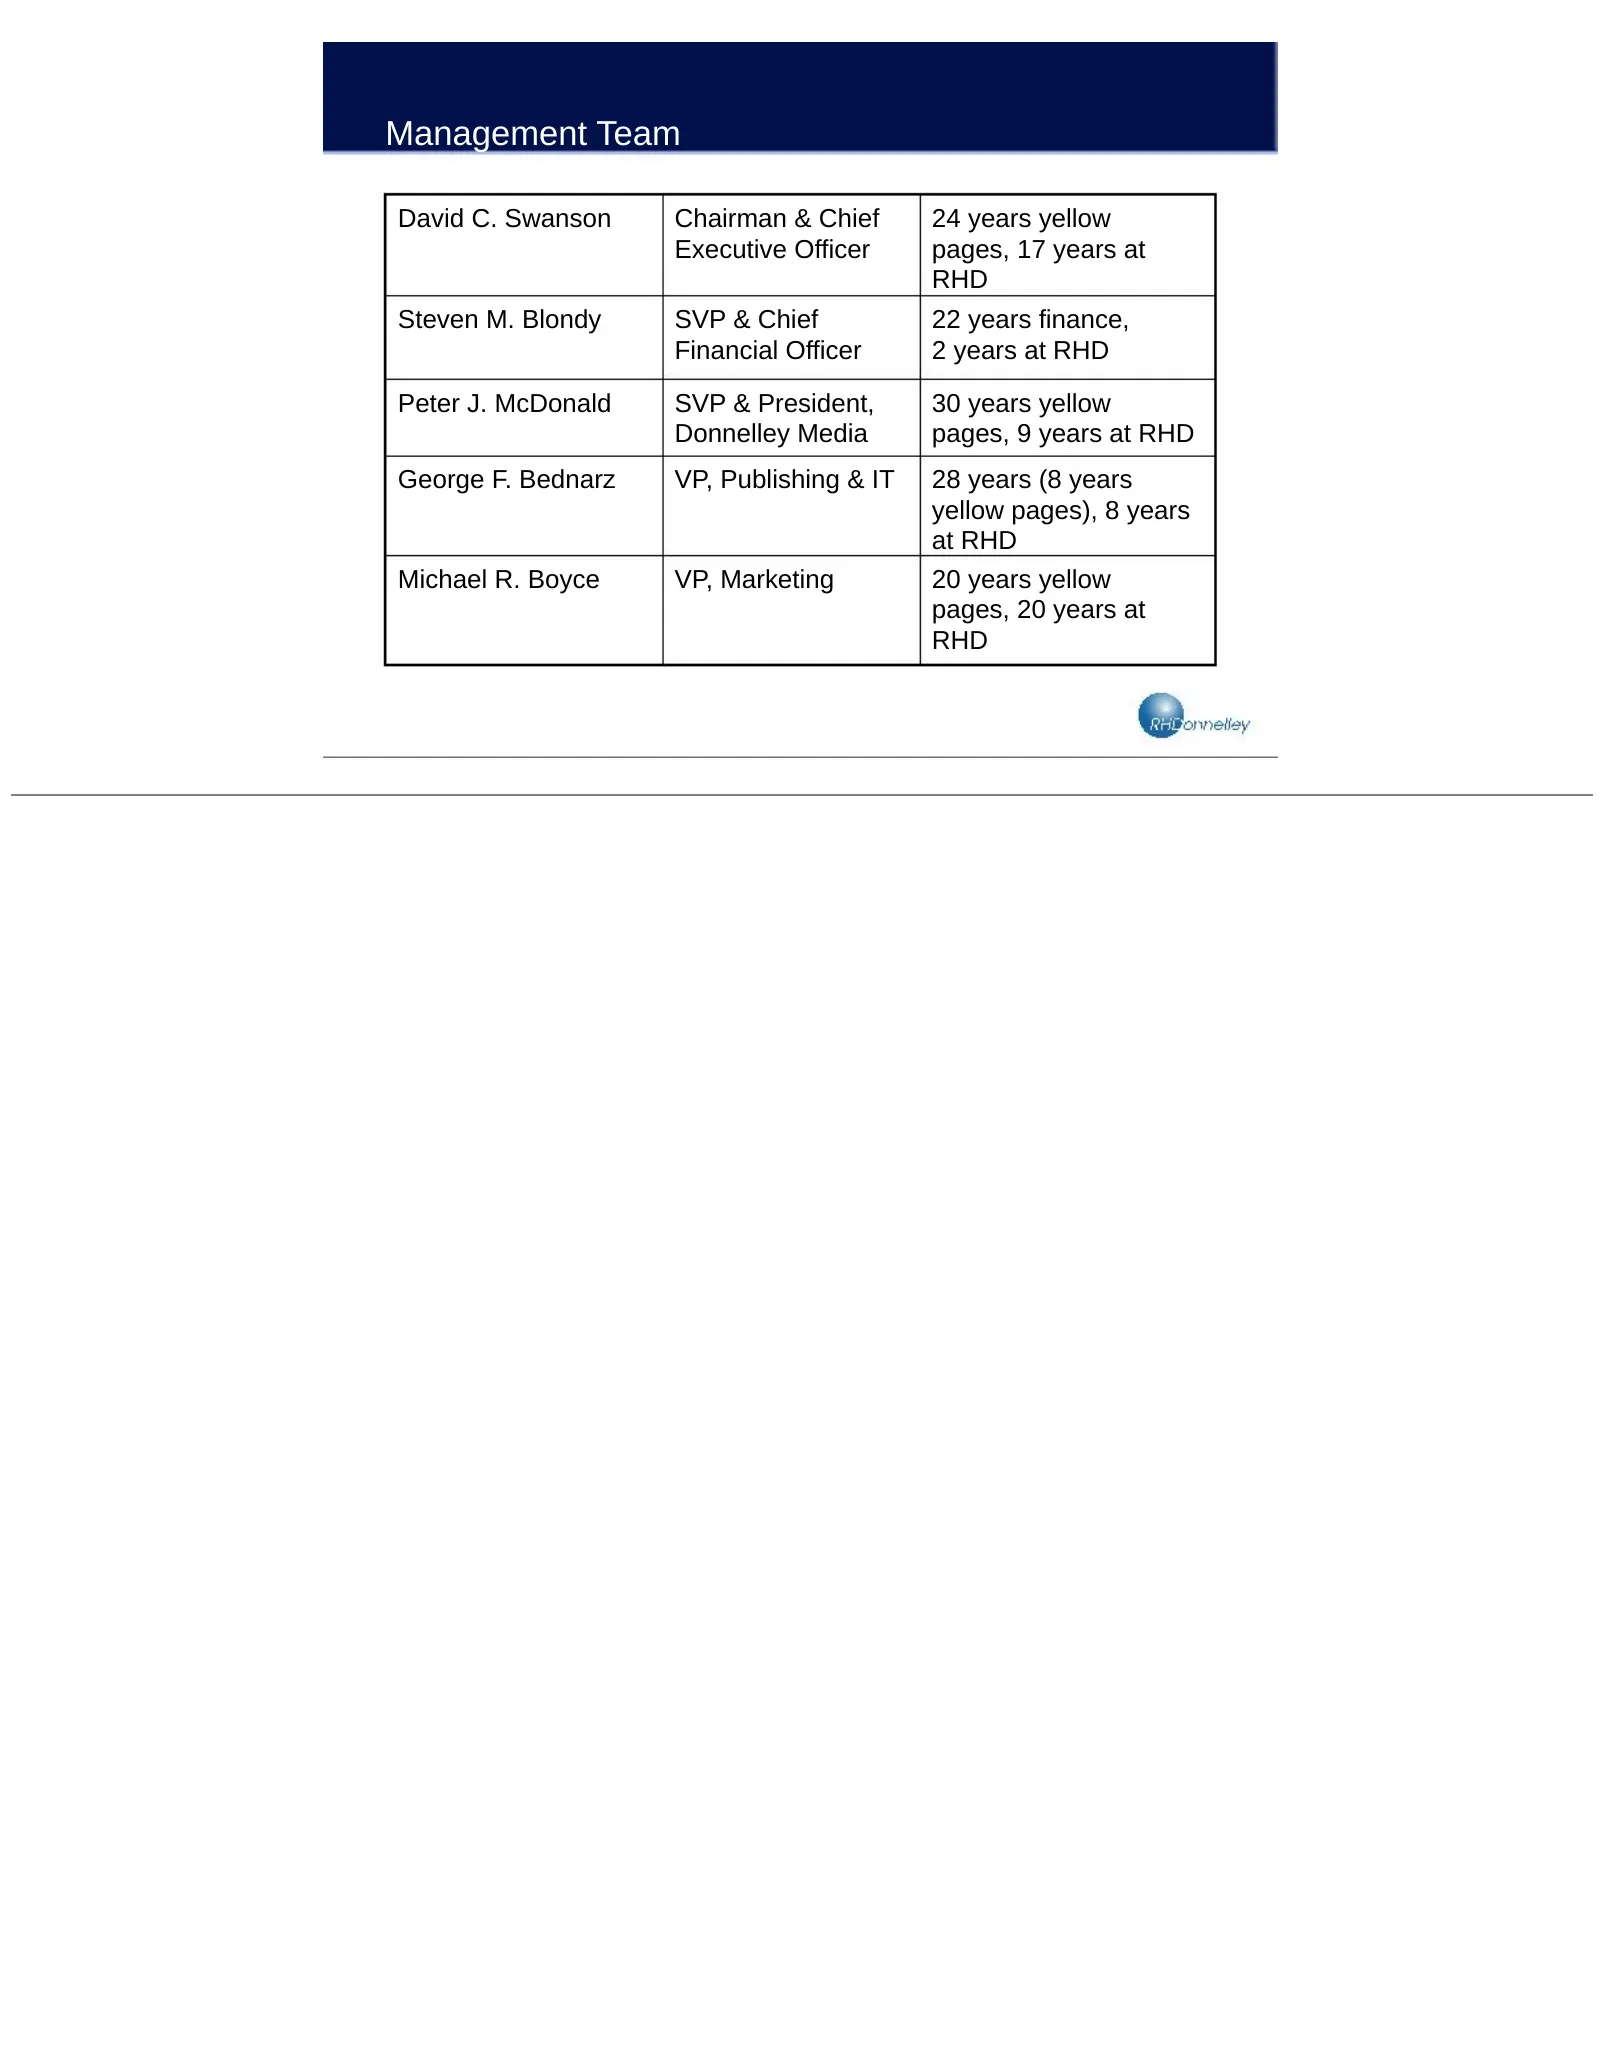
Management Team David C. Swanson Chairman & Chief 24 years yellow Executive Officer pages, 17 years at RHD Steven M. Blondy SVP & Chief 22 years finance, Financial Officer 2 years at RHD Peter J. McDonald SVP & President, 30 years yellow Donnelley Media pages, 9 years at RHD George F. Bednarz VP, Pu
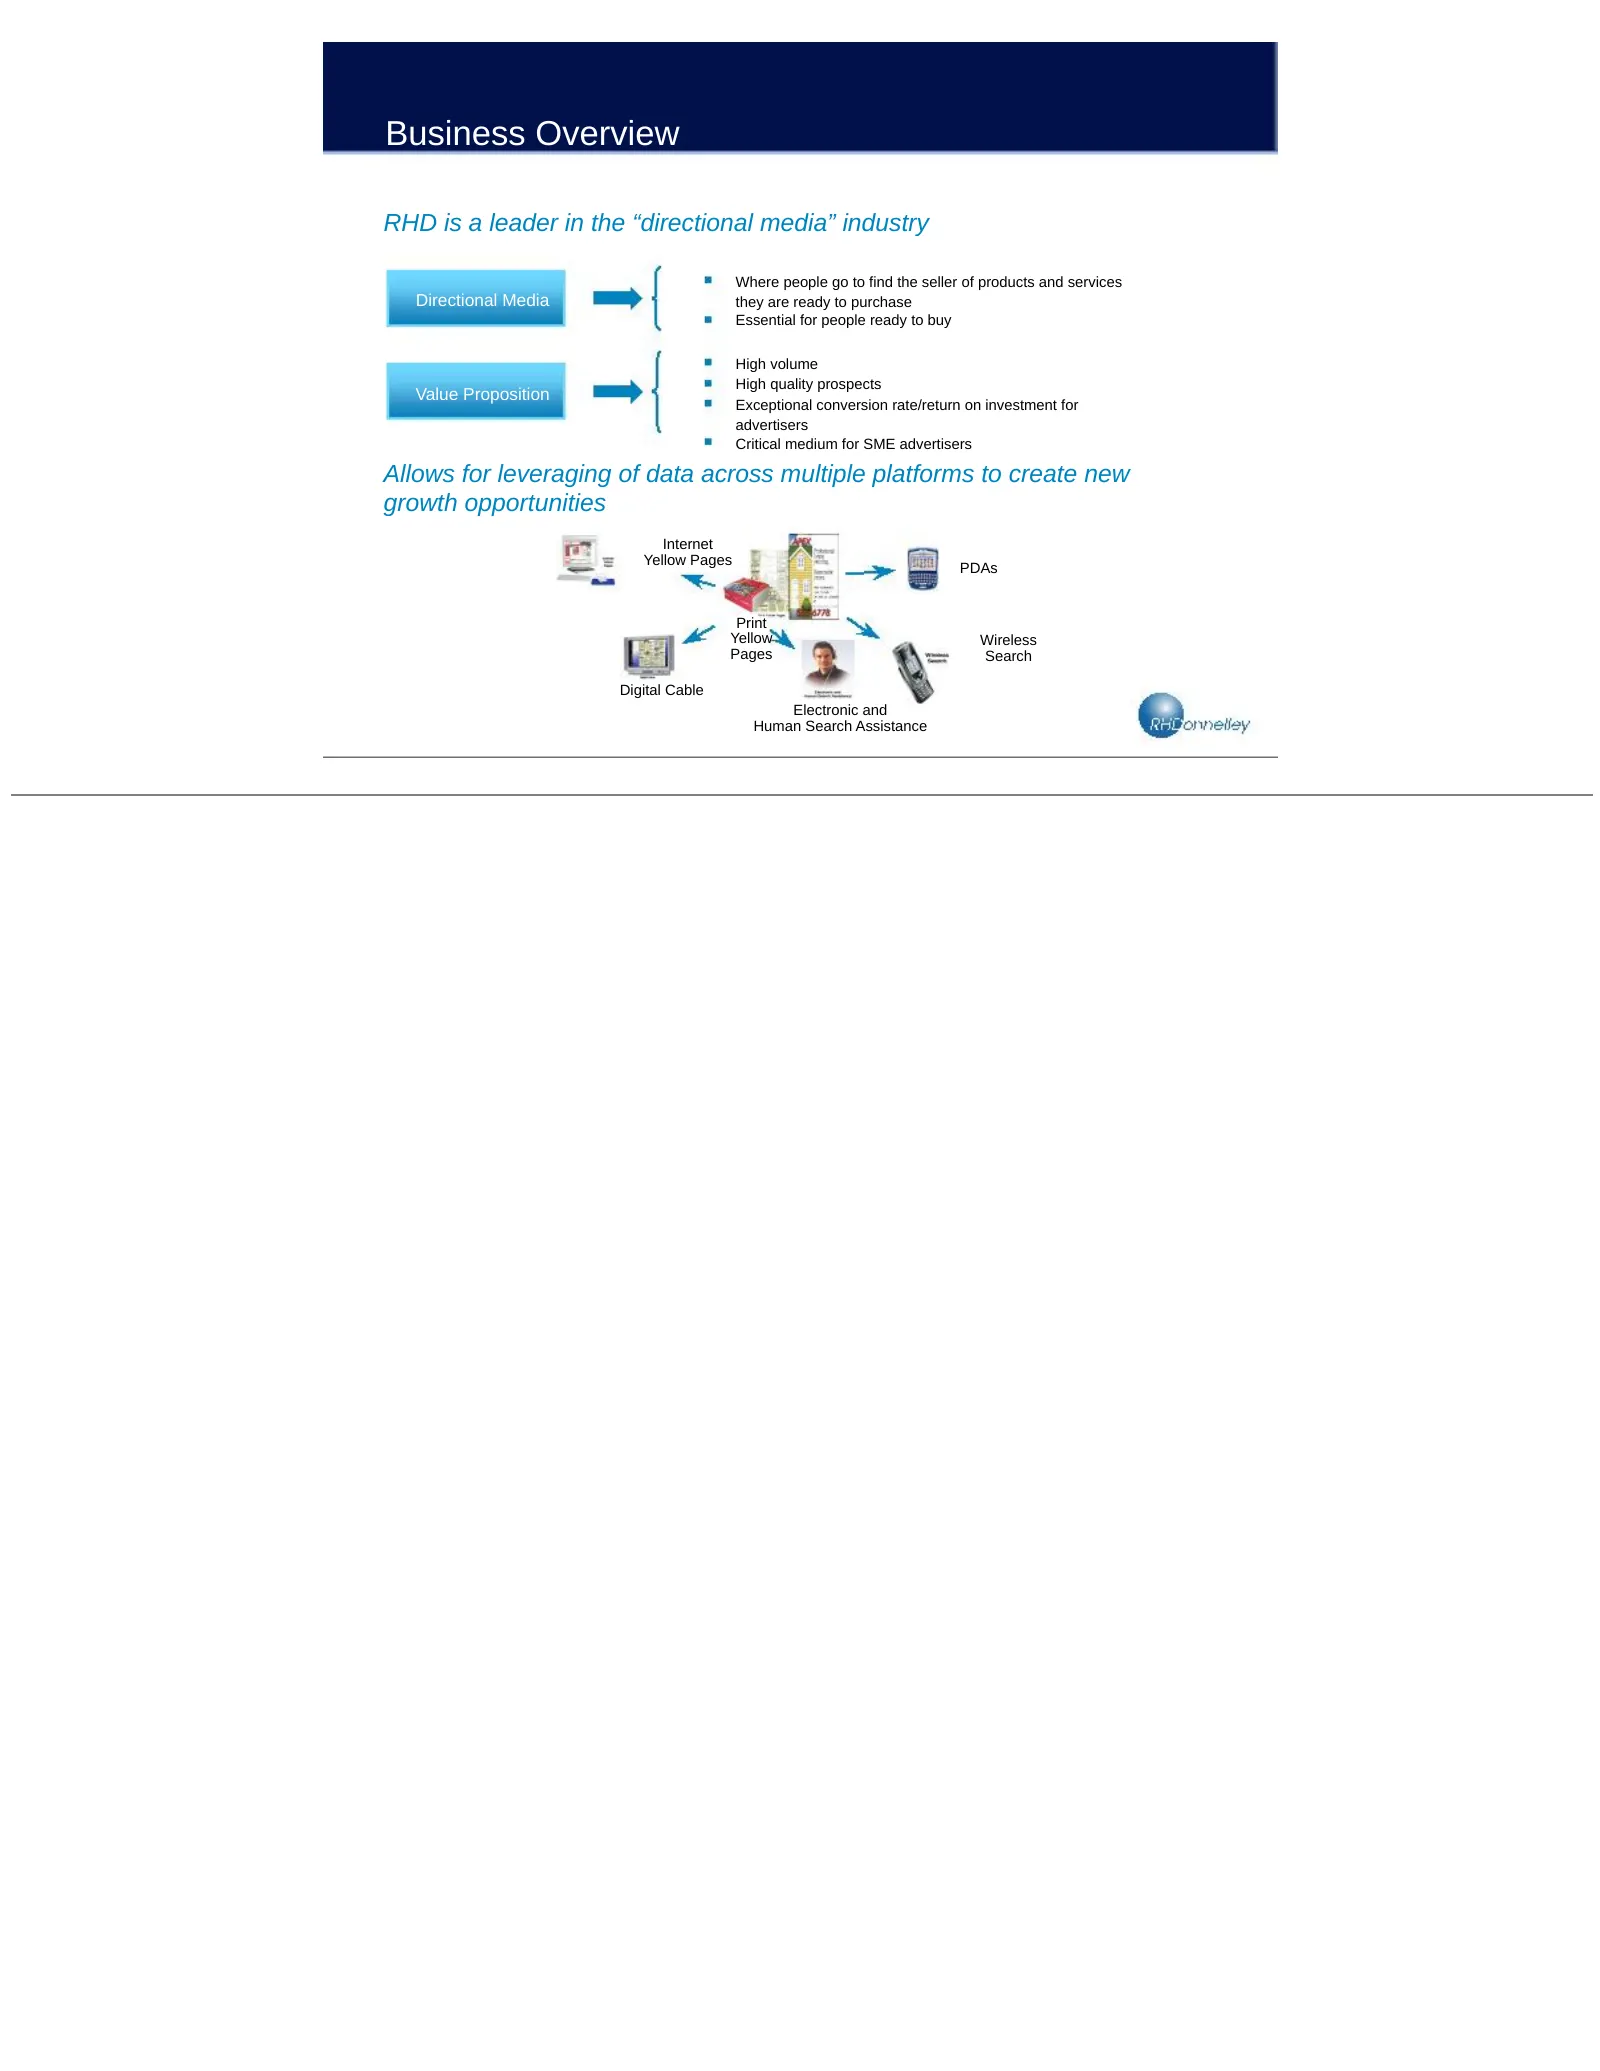
Slide 7: Business Overview
Business Overview RHD is a leader in the “directional media” industry Where people go to find the seller of products and services Directional Media they are ready to purchase Essential for people ready to buy High volume High quality prospects Value Proposition Exceptional conversion rate/return on
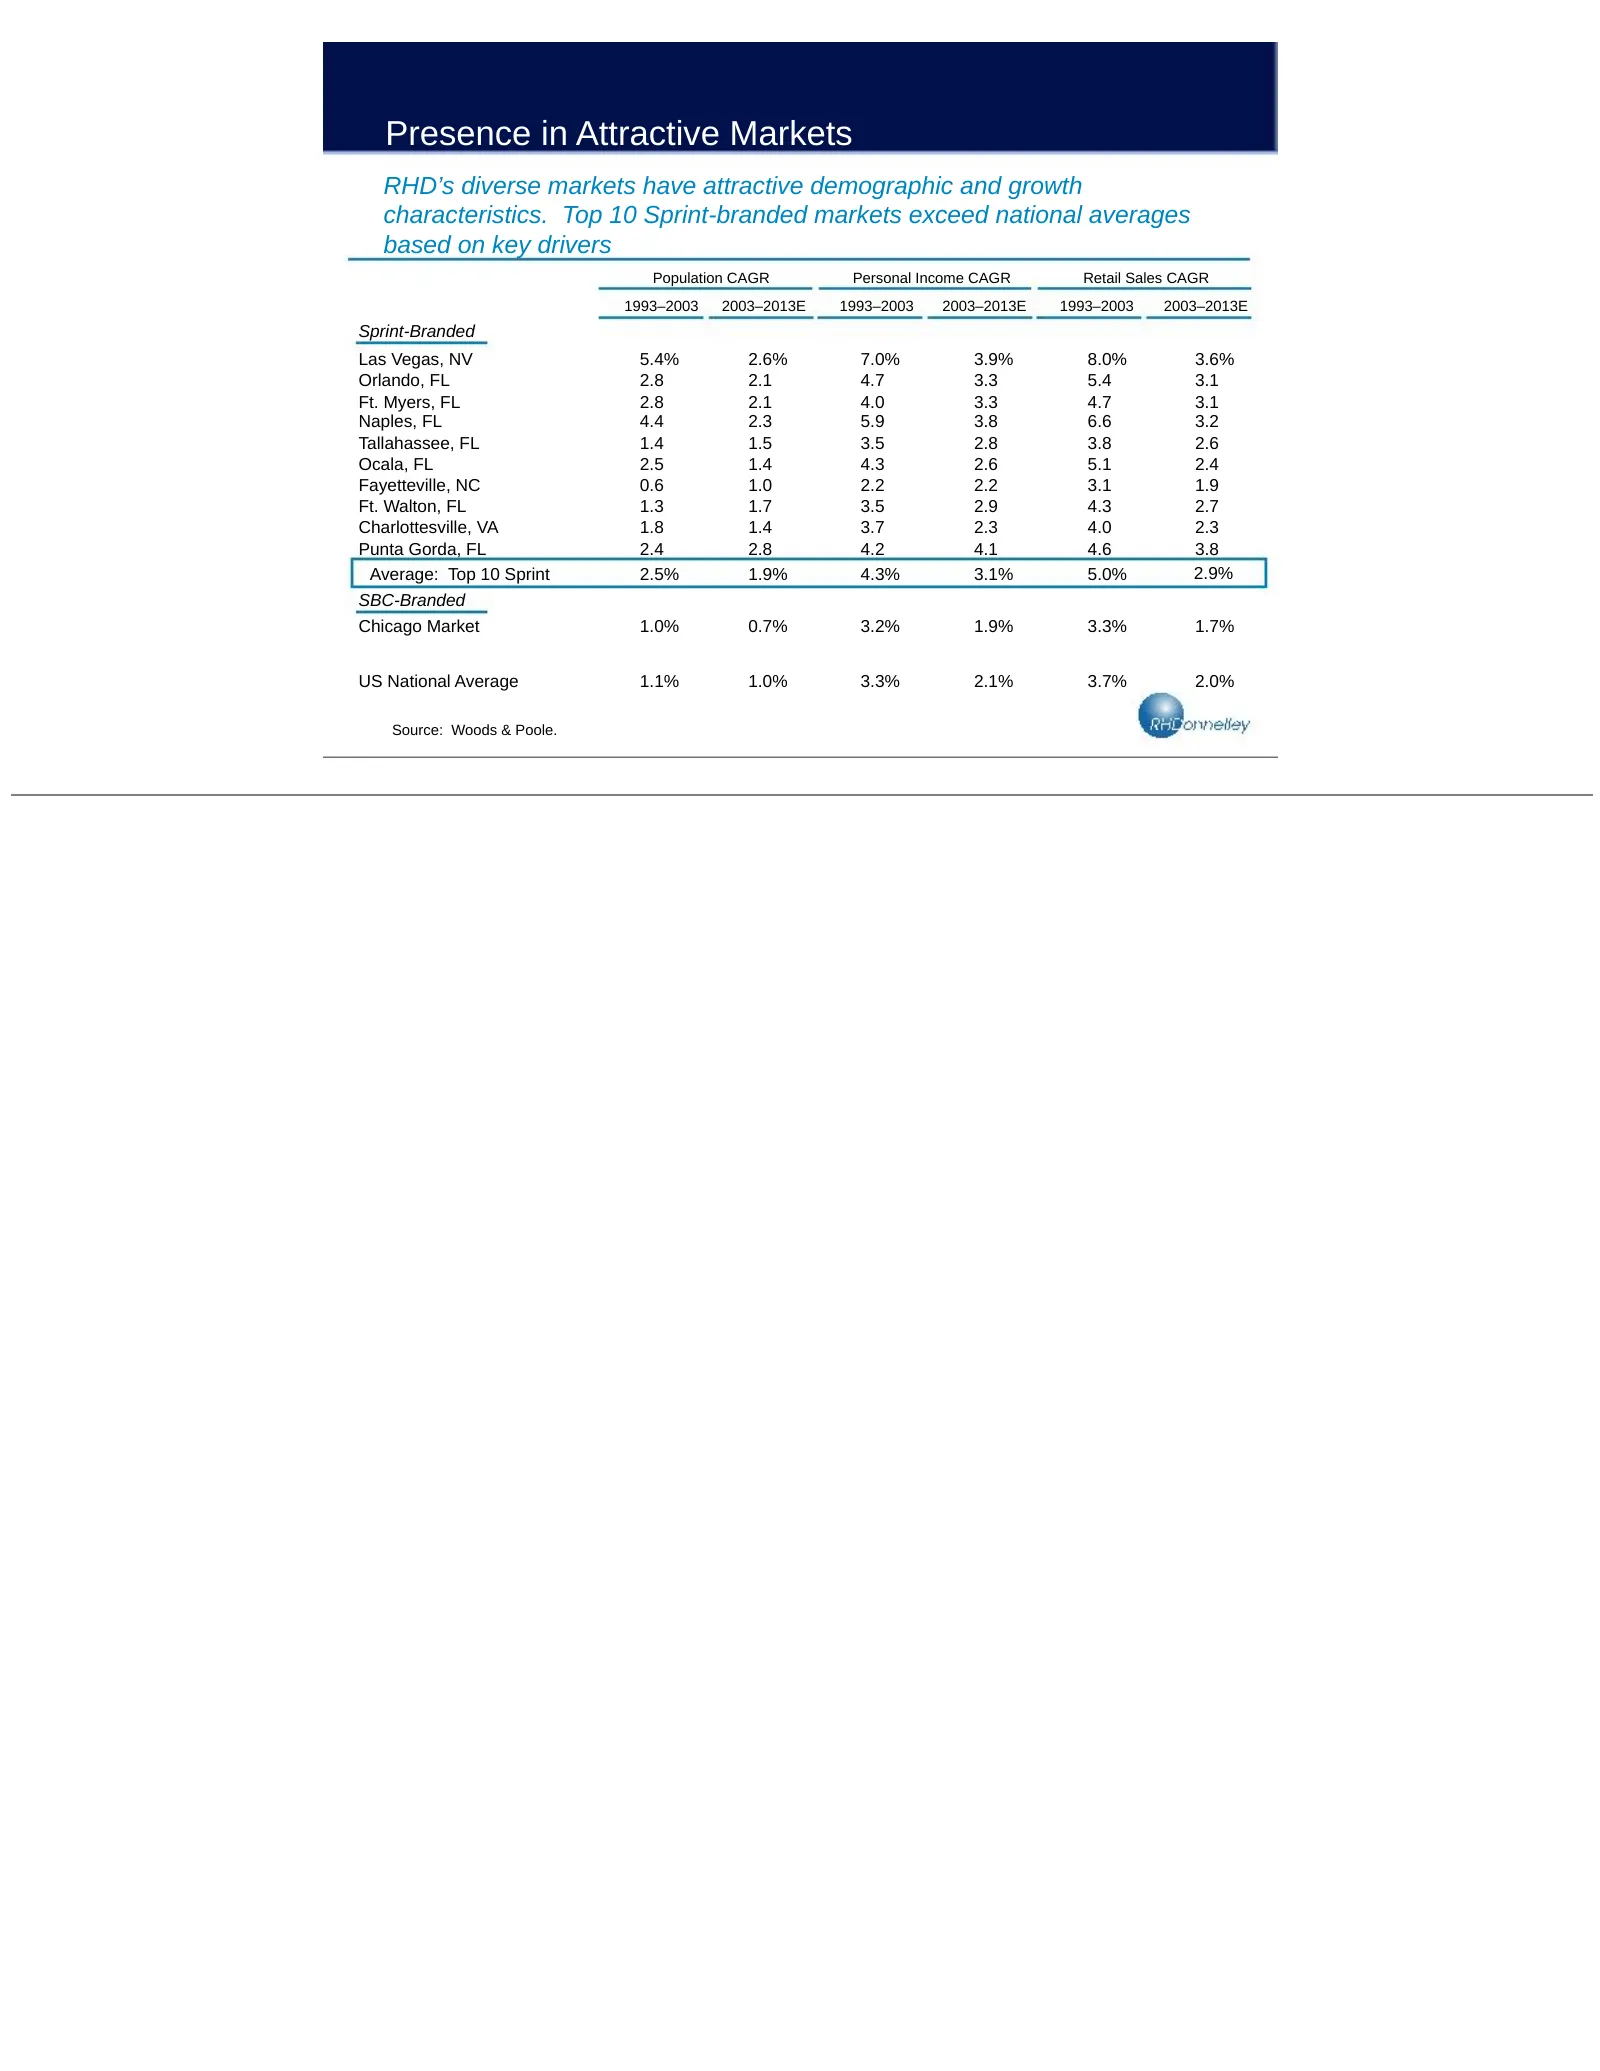
Slide 8: Presence in Attractive Markets
Presence in Attractive Markets RHD’s diverse markets have attractive demographic and growth characteristics. Top 10 Sprint-branded markets exceed national averages based on key drivers Population CAGR Personal Income CAGR Retail Sales CAGR 1993–2003 2003–2013E 1993–2003 2003–2013E 1993–2003 2003–201
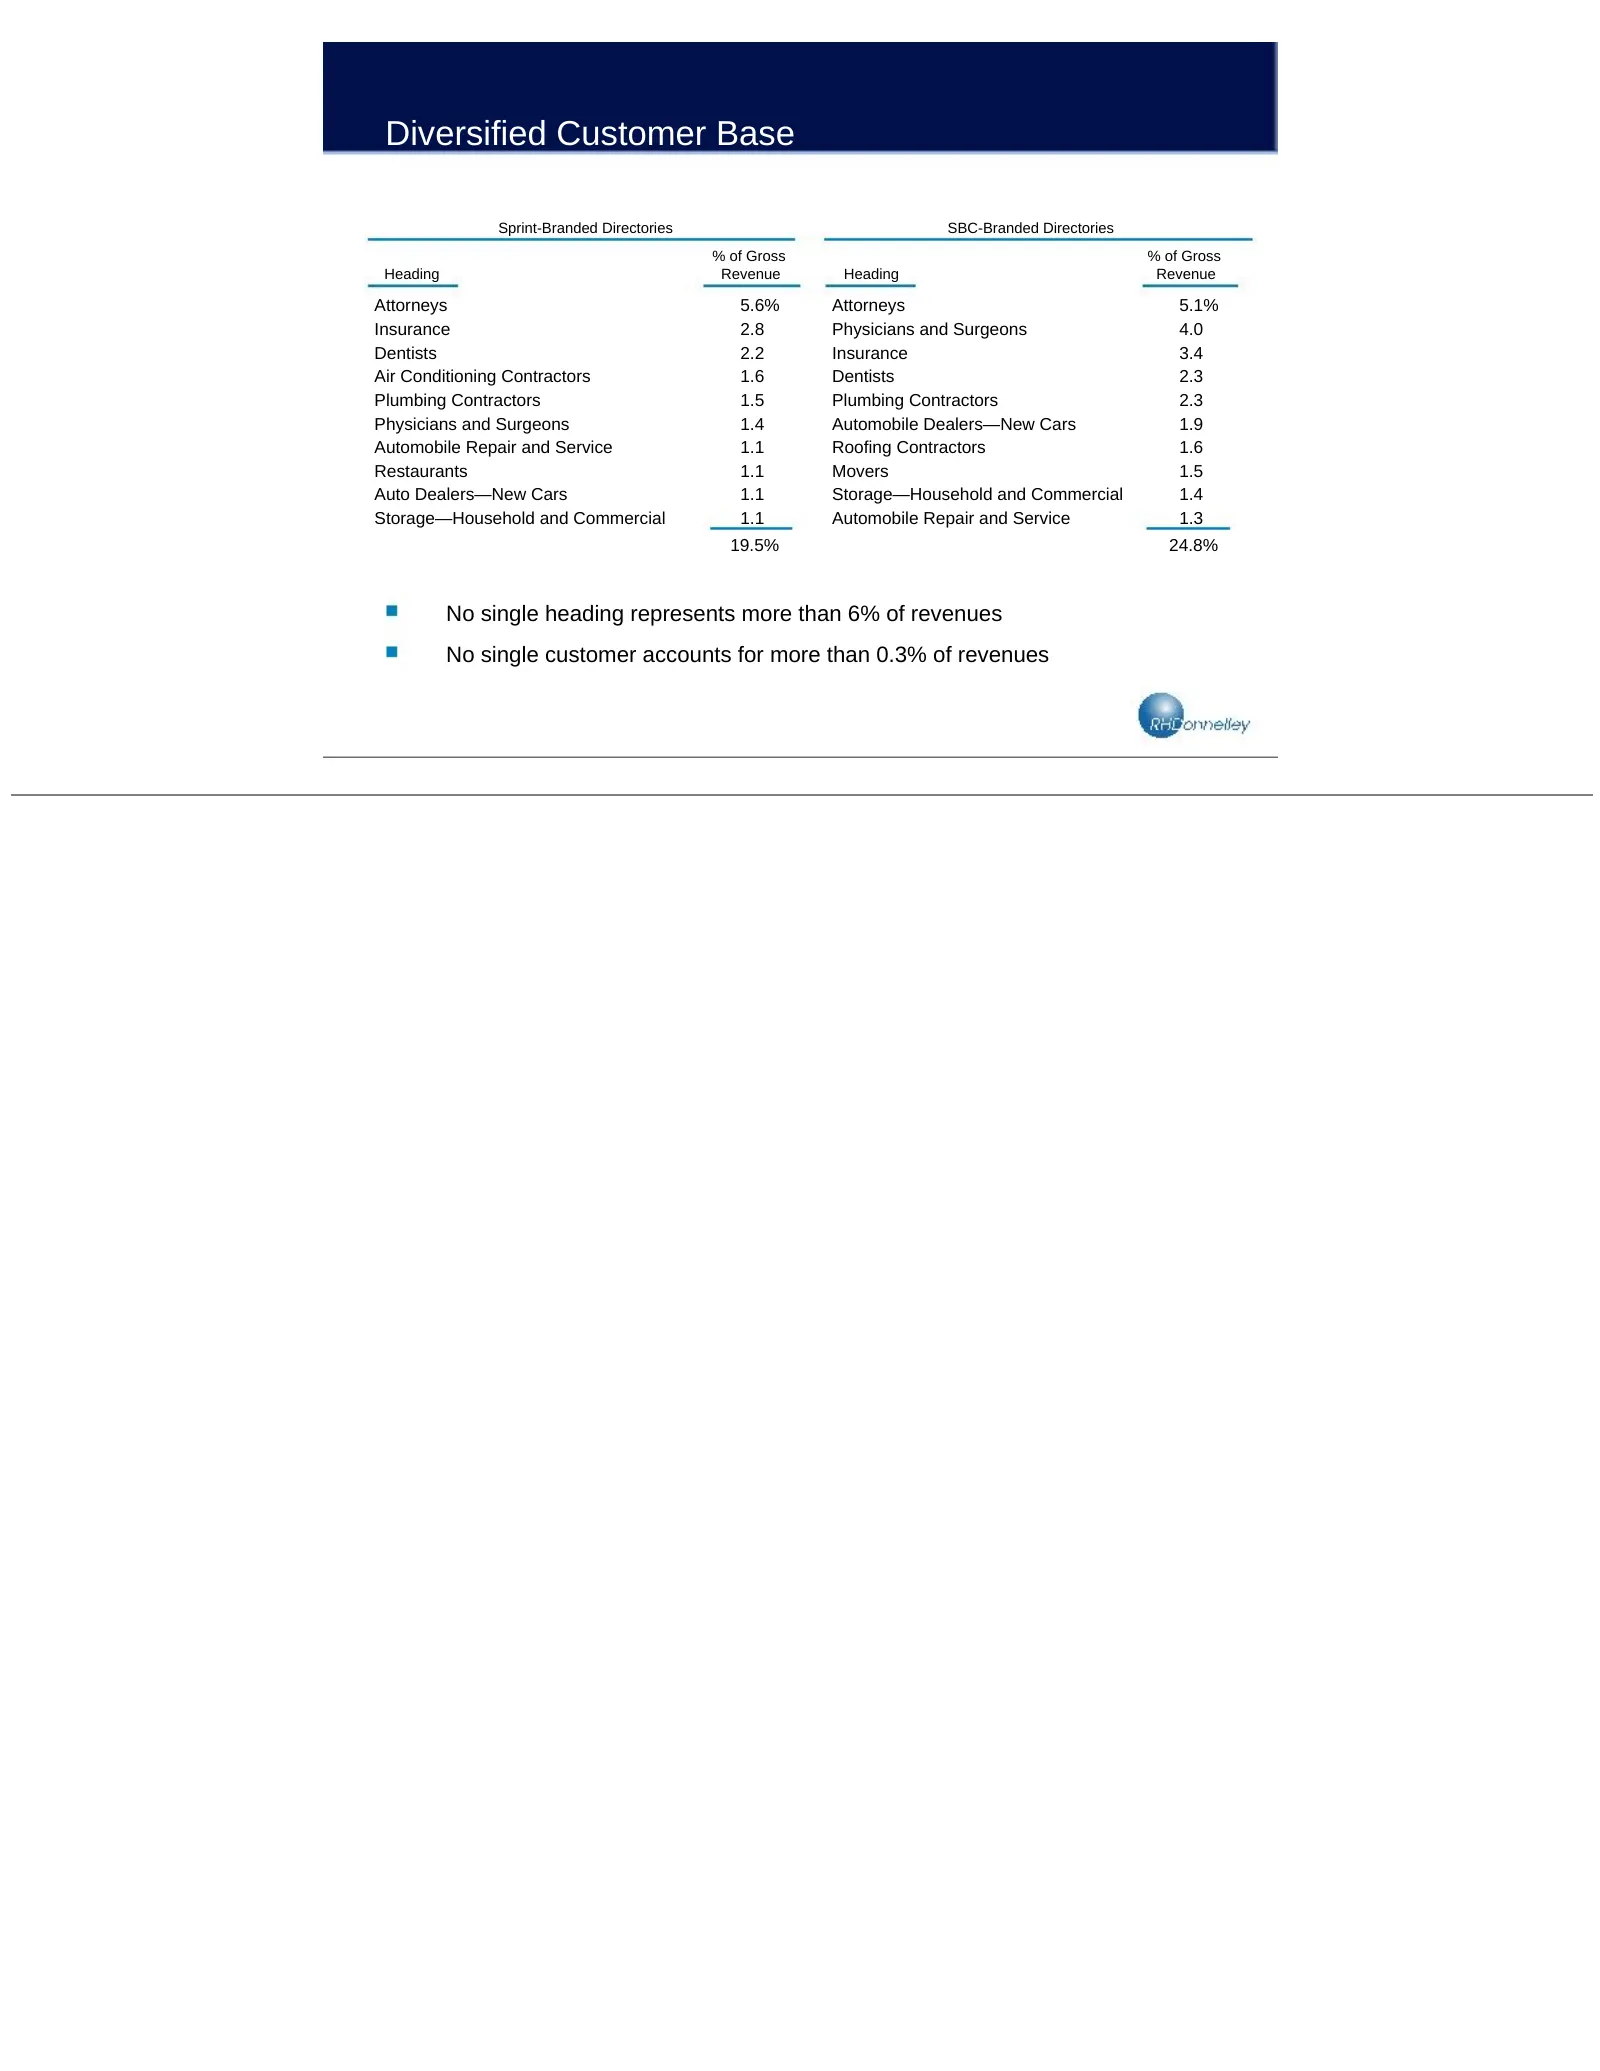
Slide 9: Diversified Customer Base
Diversified Customer Base Sprint-Branded Directories SBC-Branded Directories % of Gross % of Gross Heading Revenue Heading Revenue Attorneys 5.6% Attorneys 5.1% Insurance 2.8 Physicians and Surgeons 4.0 Dentists 2.2 Insurance 3.4 Air Conditioning Contractors 1.6 Dentists 2.3 Plumbing Contractors 1.5

Slide 10: Internet Yellow Pages Product
Internet Yellow Pages Product Sprint Markets Launched first city guide and online yellow pages in Las Vegas in July 2003 (www.bestredyp.com) Operating in over 40 markets; 50 markets by year-end Strong acceptance rate (40%+) from current customer base Bundled with the print product—minimizes cannibal

Slide 11: SBC Transaction
SBC Transaction
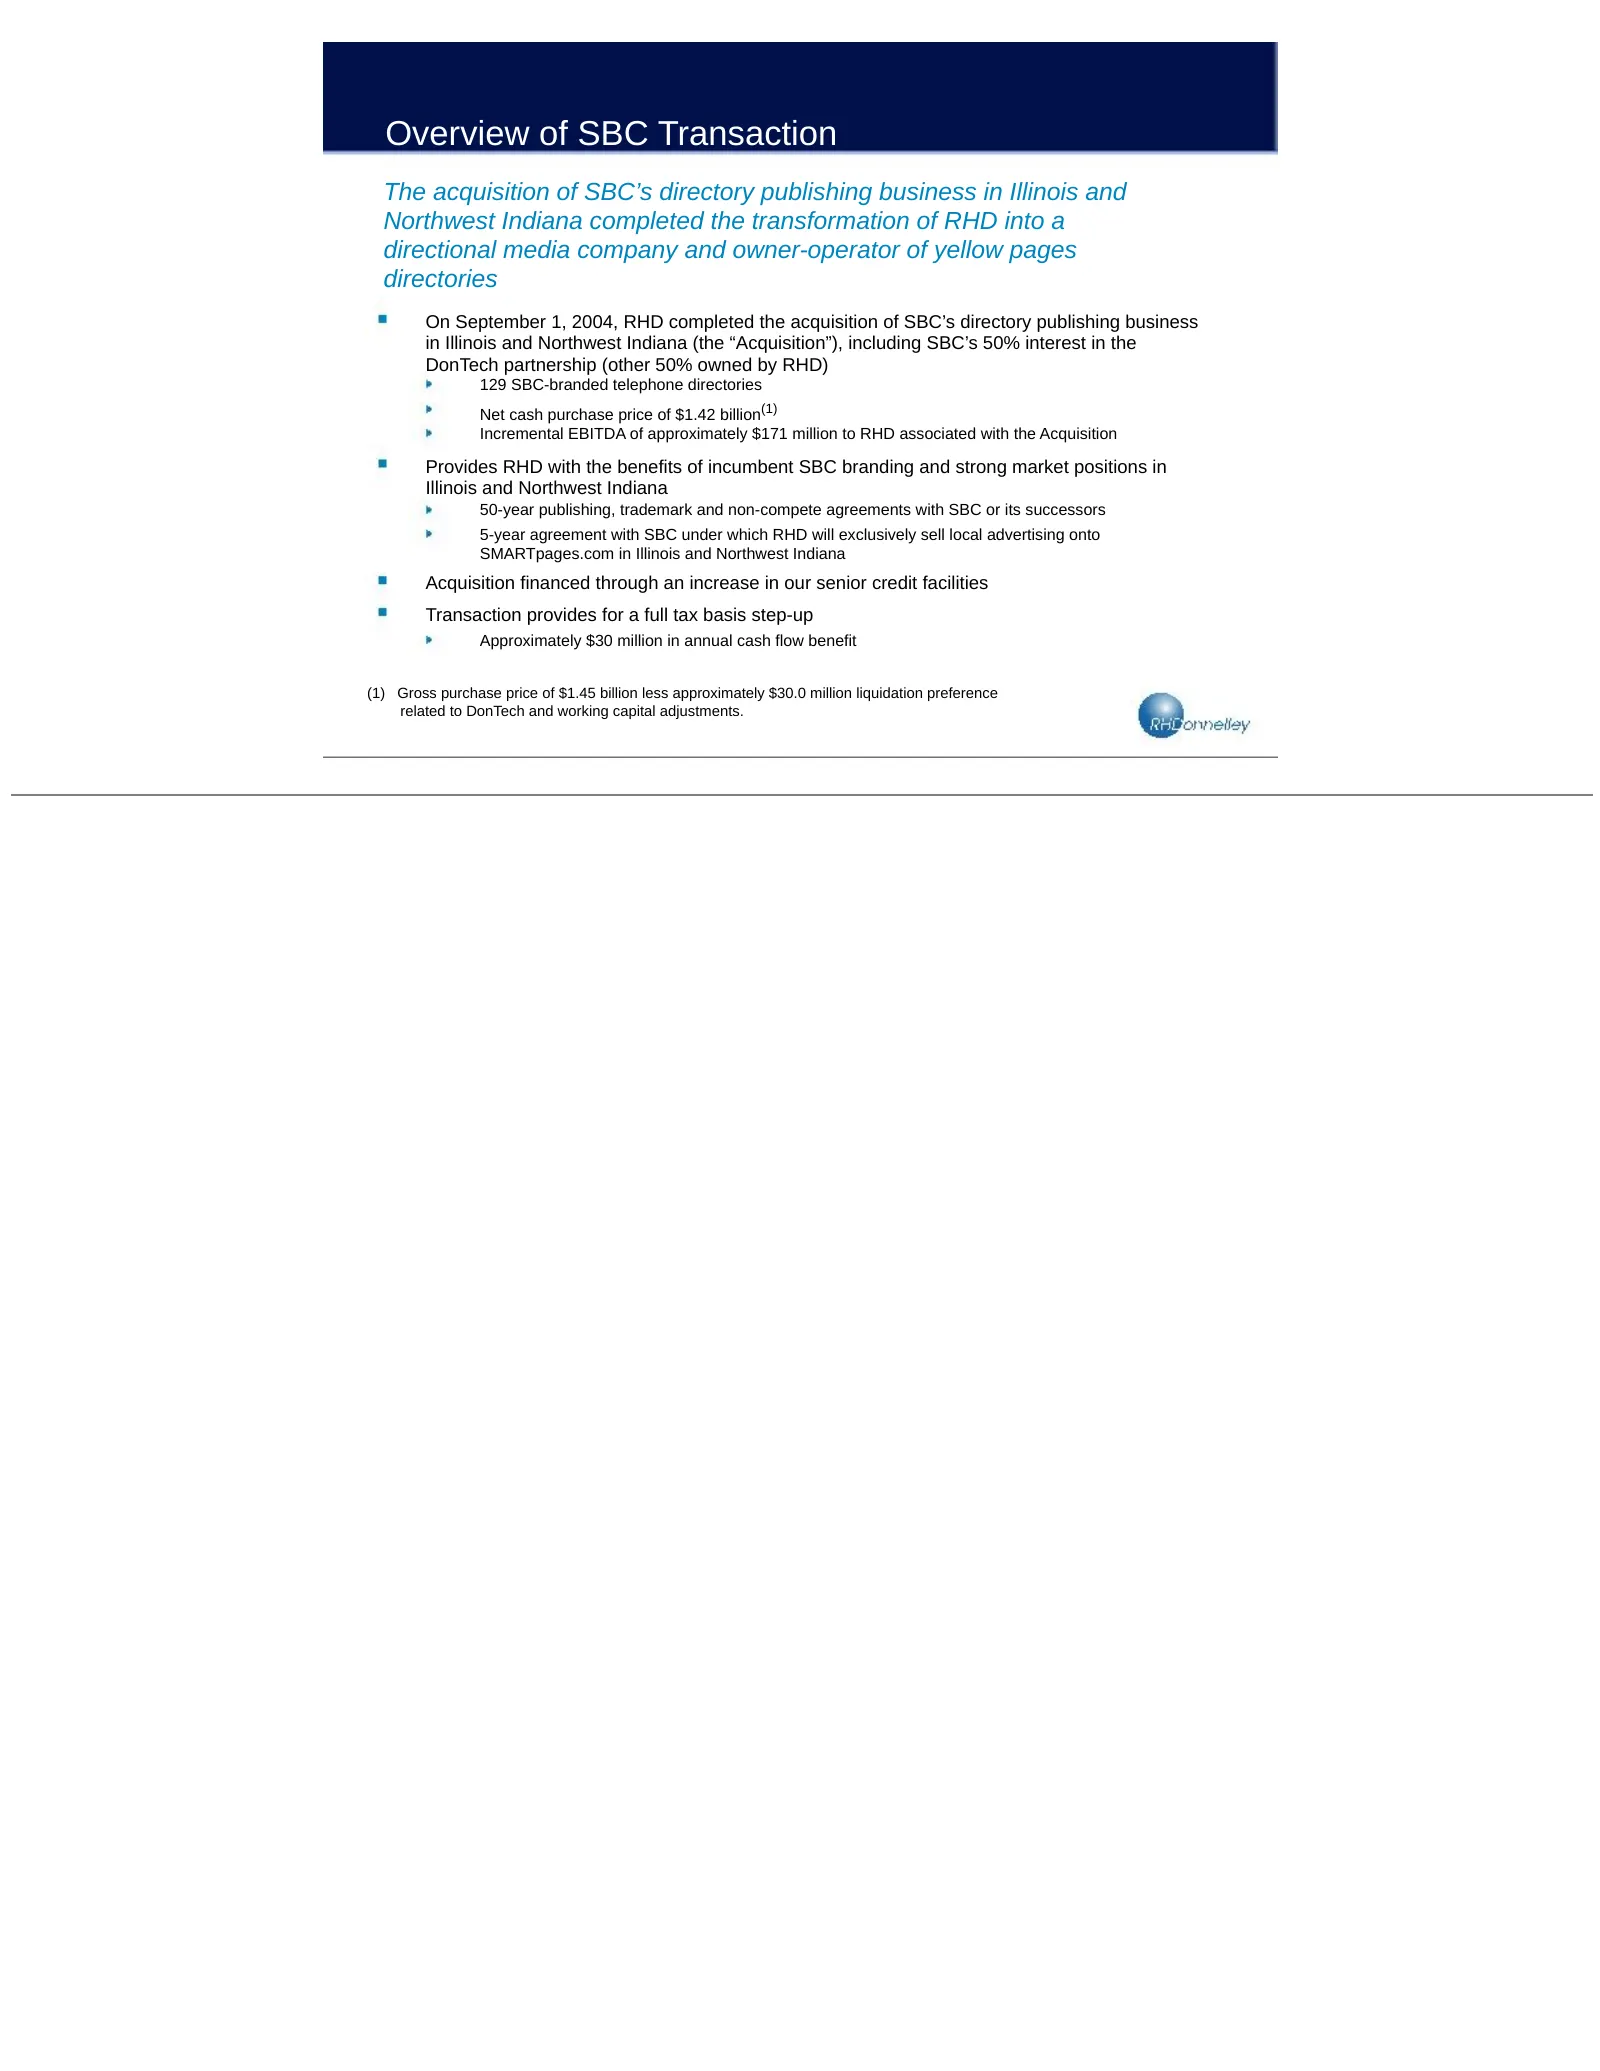
Slide 12: Overview of SBC Transaction
Overview of SBC Transaction The acquisition of SBC’s directory publishing business in Illinois and Northwest Indiana completed the transformation of RHD into a directional media company and owner-operator of yellow pages directories On September 1, 2004, RHD completed the acquisition of SBC’s direct
Slide 13: Strategic Rationale
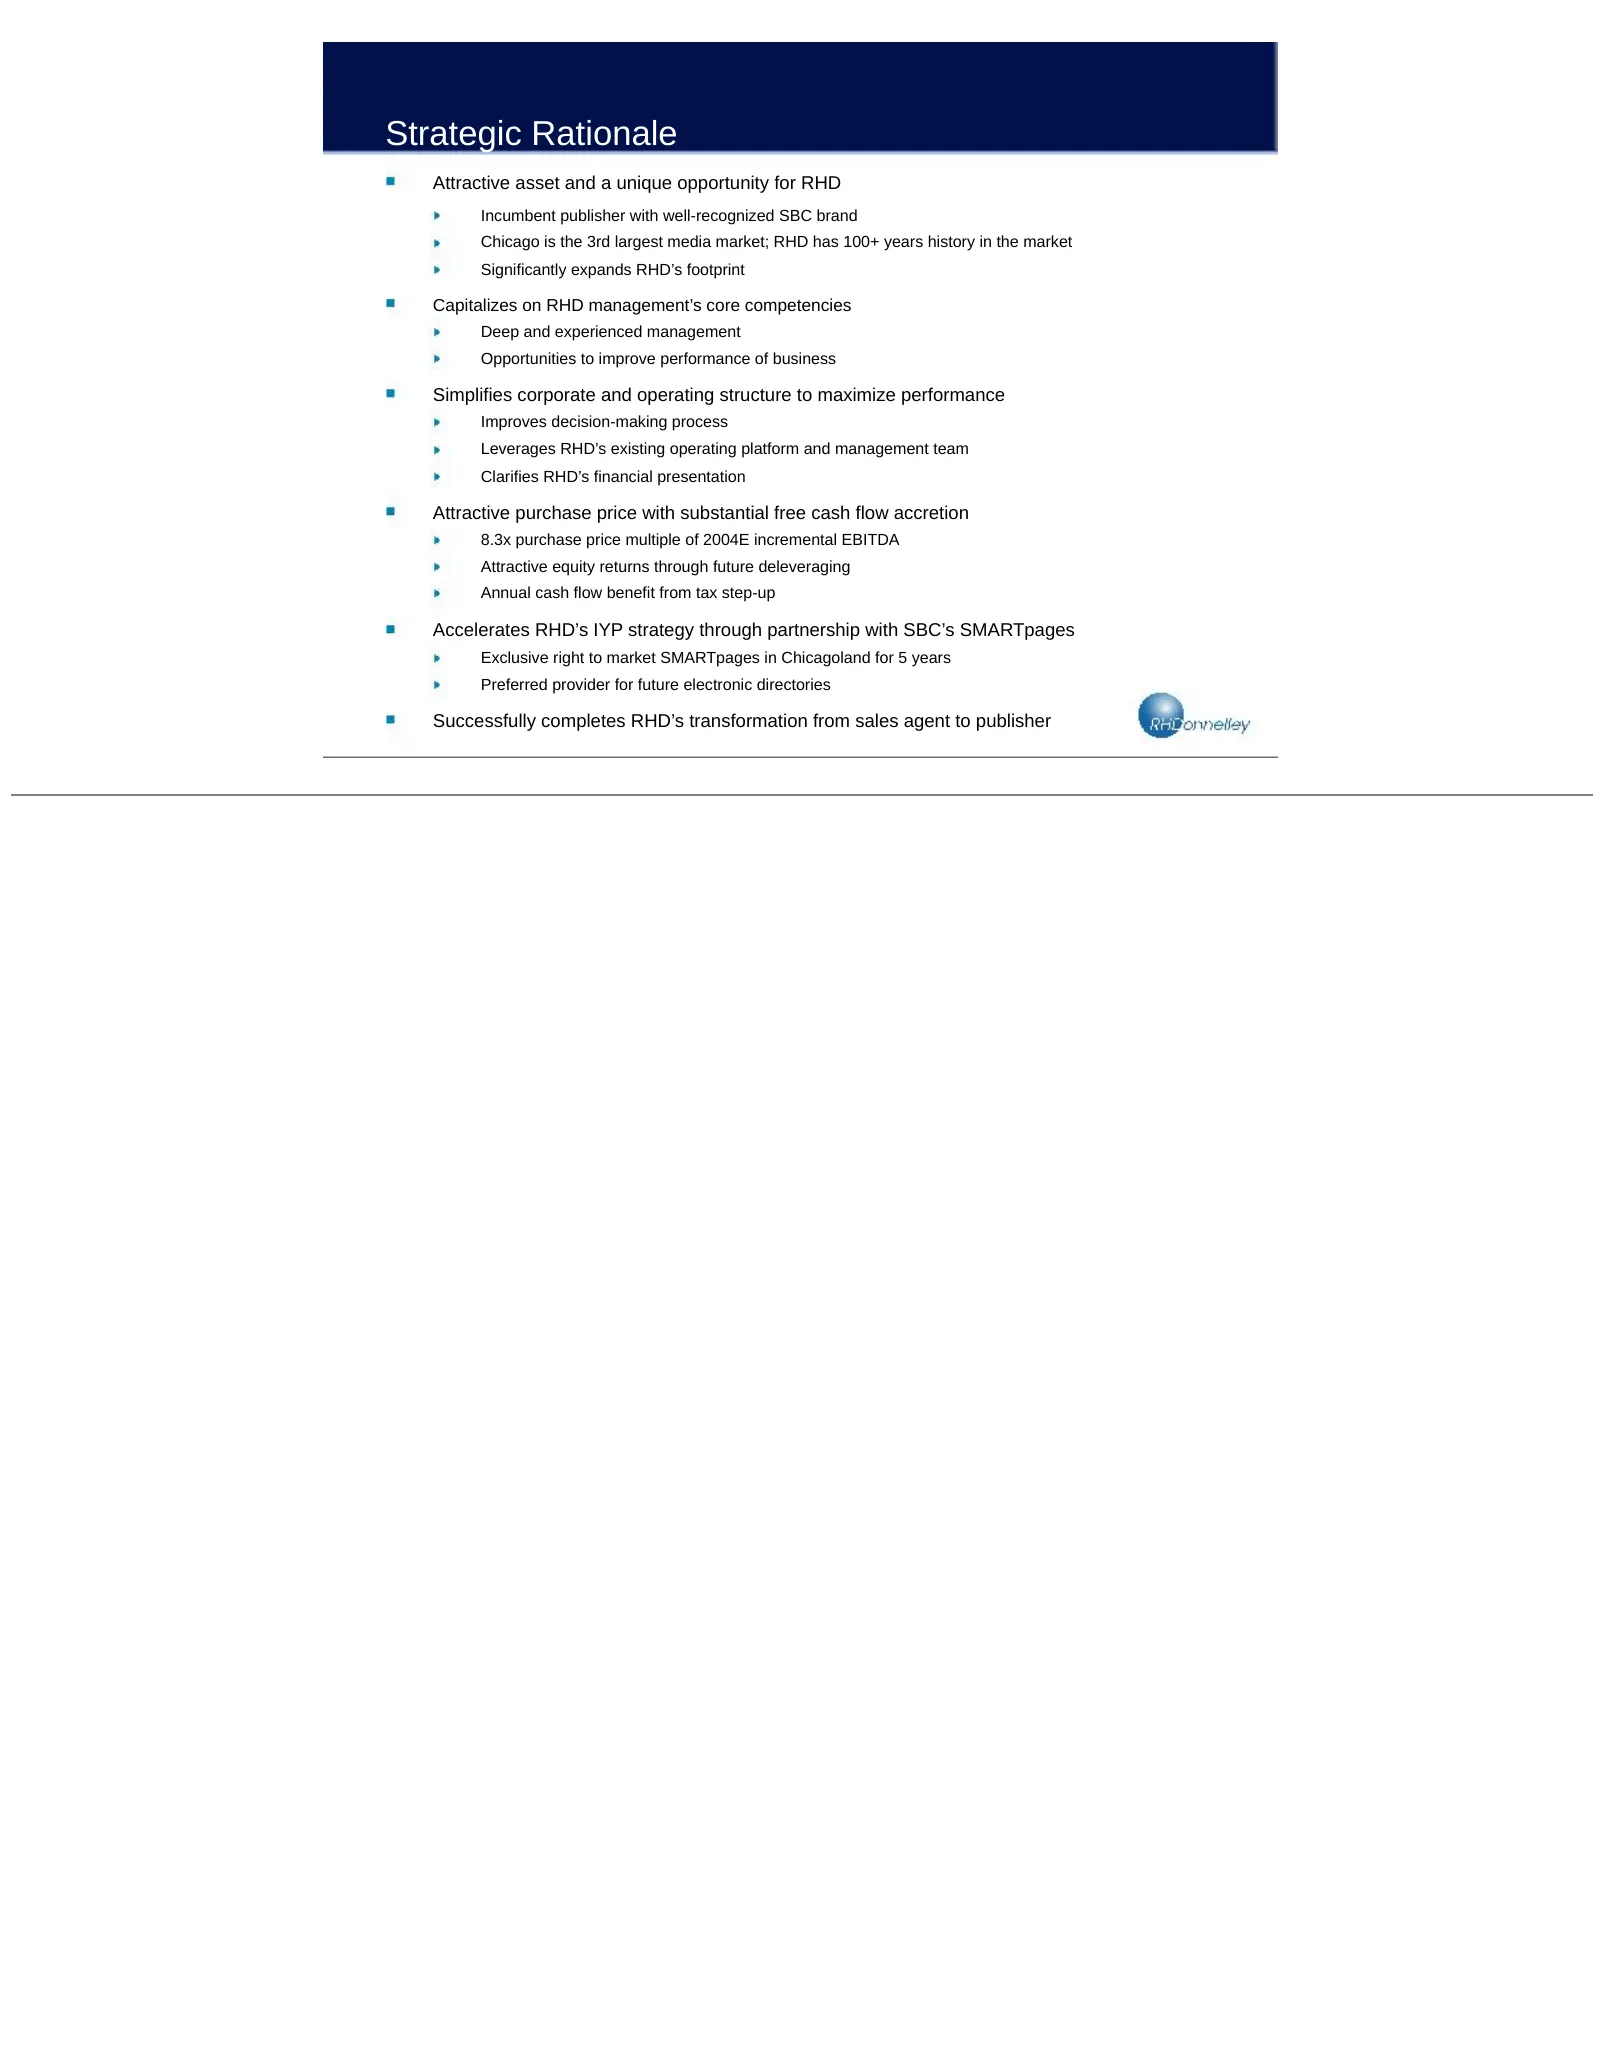
Strategic Rationale Attractive asset and a unique opportunity for RHD Incumbent publisher with well-recognized SBC brand Chicago is the 3rd largest media market; RHD has 100+ years history in the market Significantly expands RHD’s footprint Capitalizes on RHD management’s core competencies Deep and

Slide 14: Pro Forma Company Snapshot
Pro Forma Company Snapshot The acquisition significantly enhances RHD’s scale and reach Acquired Pro Forma RHD Business Combined States 18 IL, IN 19 Directories 260 129 389 Annual Circulation 18 million 10 million 28 million Total Advertisers 160,000 100,000 260,000

Slide 15: Industry Overview
Industry Overview
Slide 16: Consistent Growth
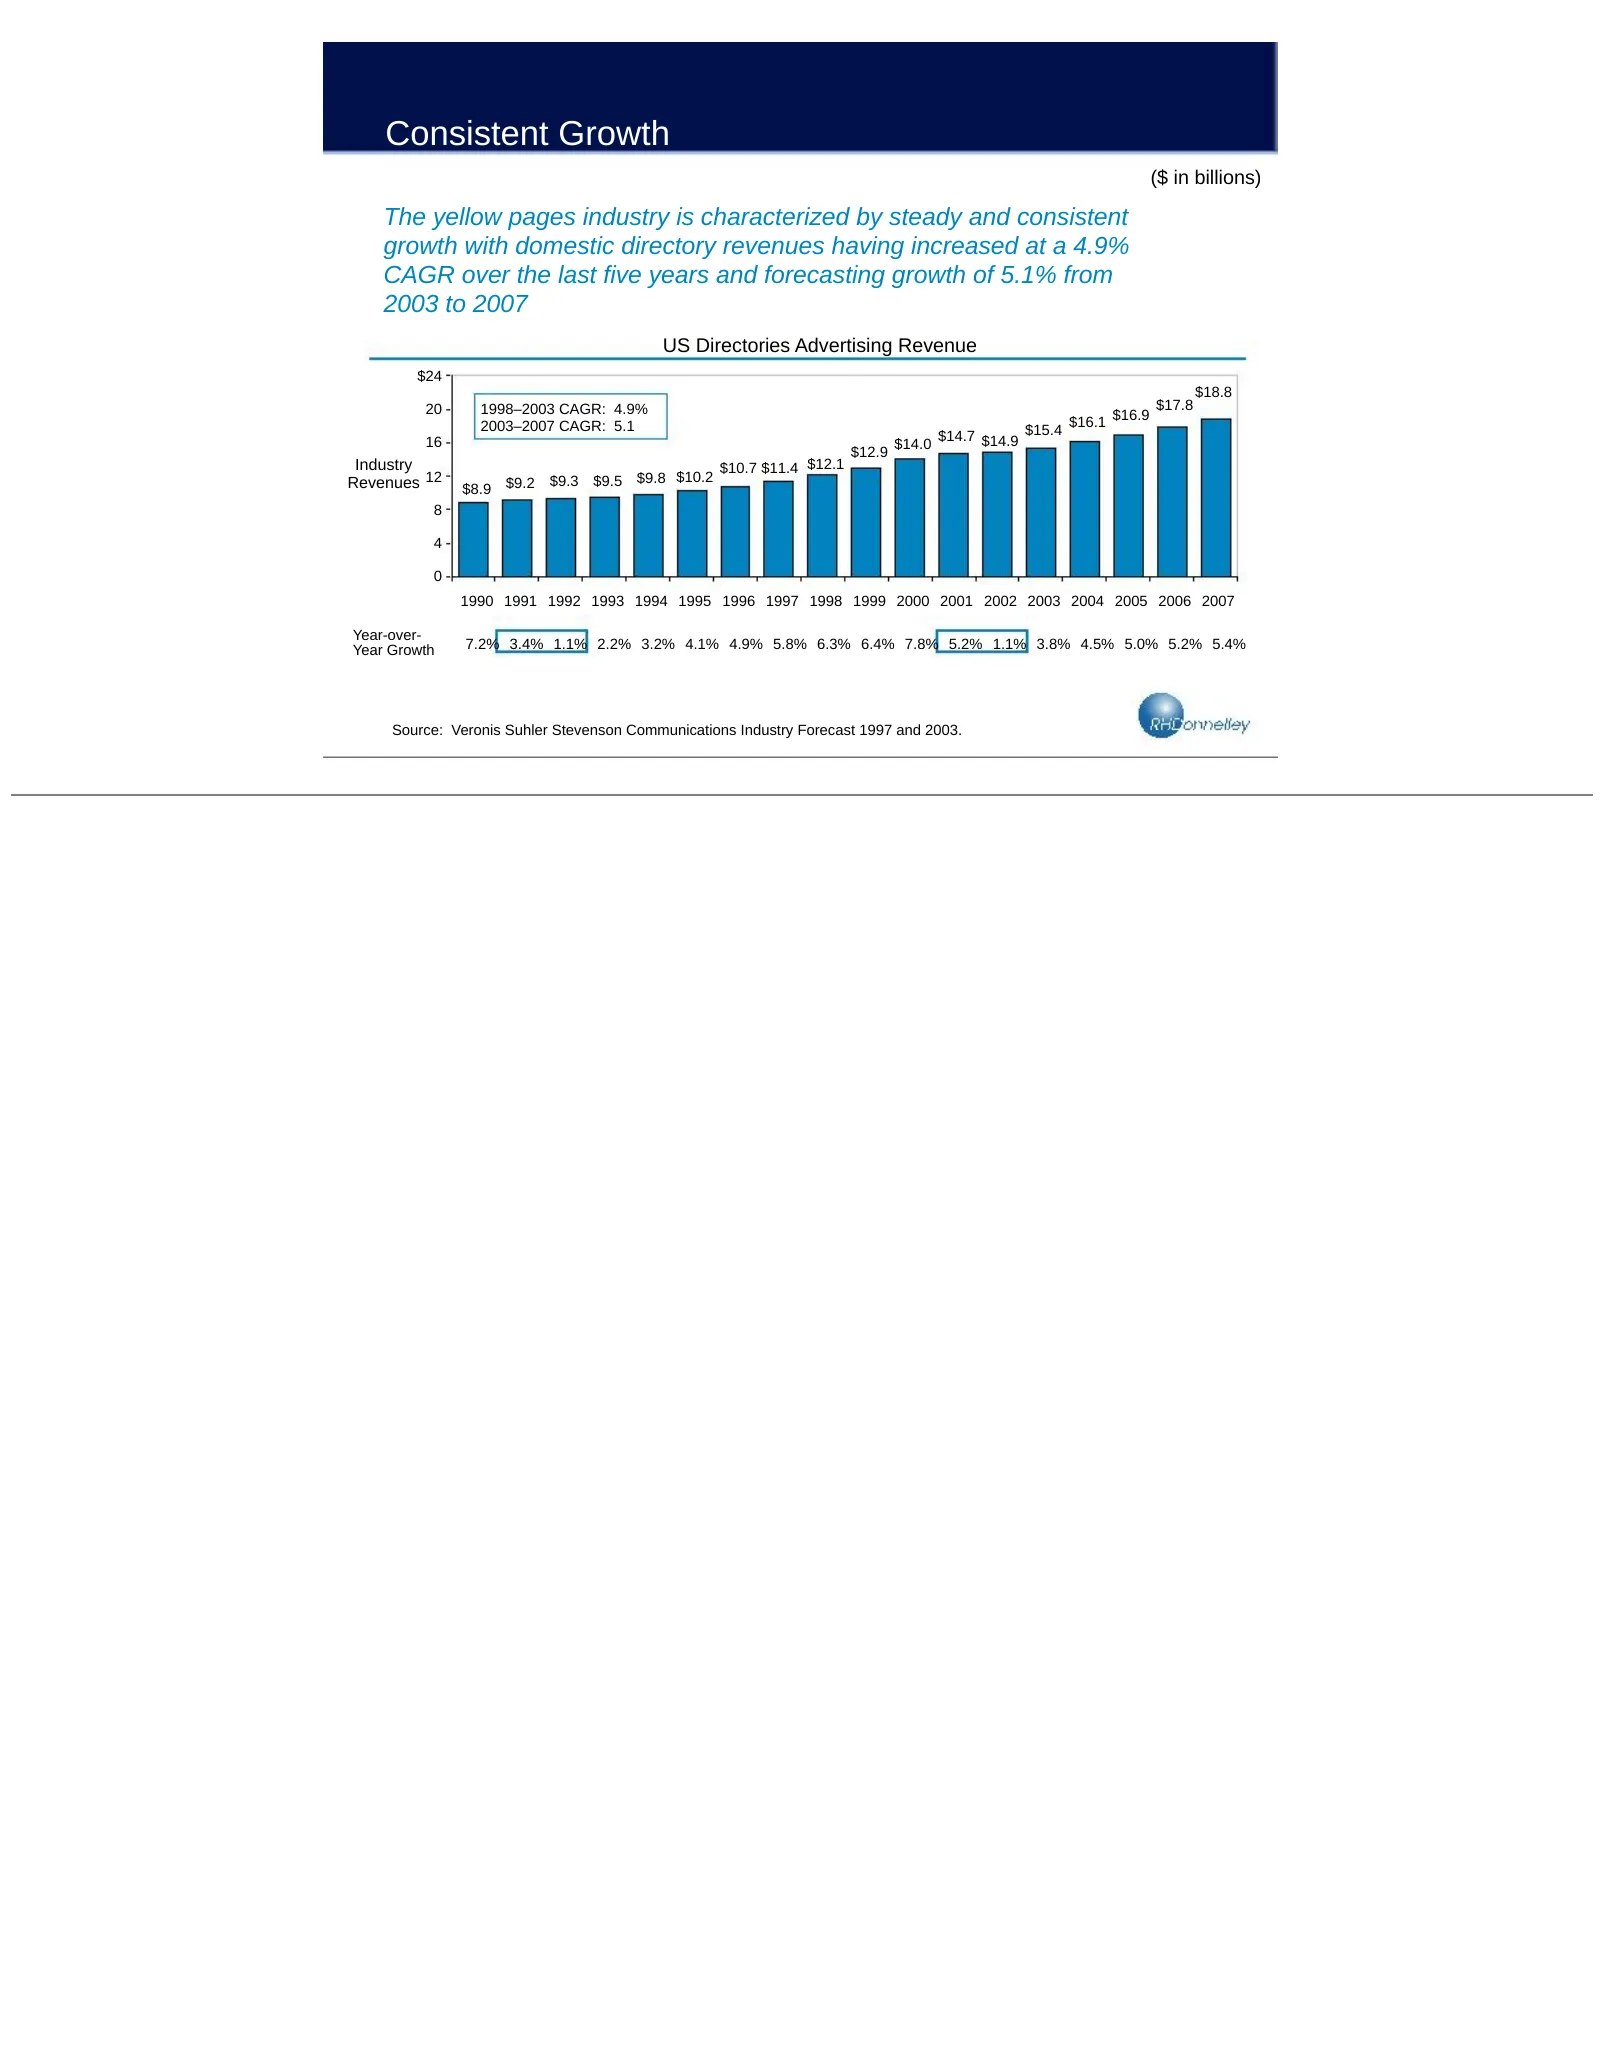
Consistent Growth ($ in billions) The yellow pages industry is characterized by steady and consistent growth with domestic directory revenues having increased at a 4.9% CAGR over the last five years and forecasting growth of 5.1% from 2003 to 2007 US Directories Advertising Revenue $24 $18.8 20 1998
Slide 17: Impact of Yellow Pages Advertising
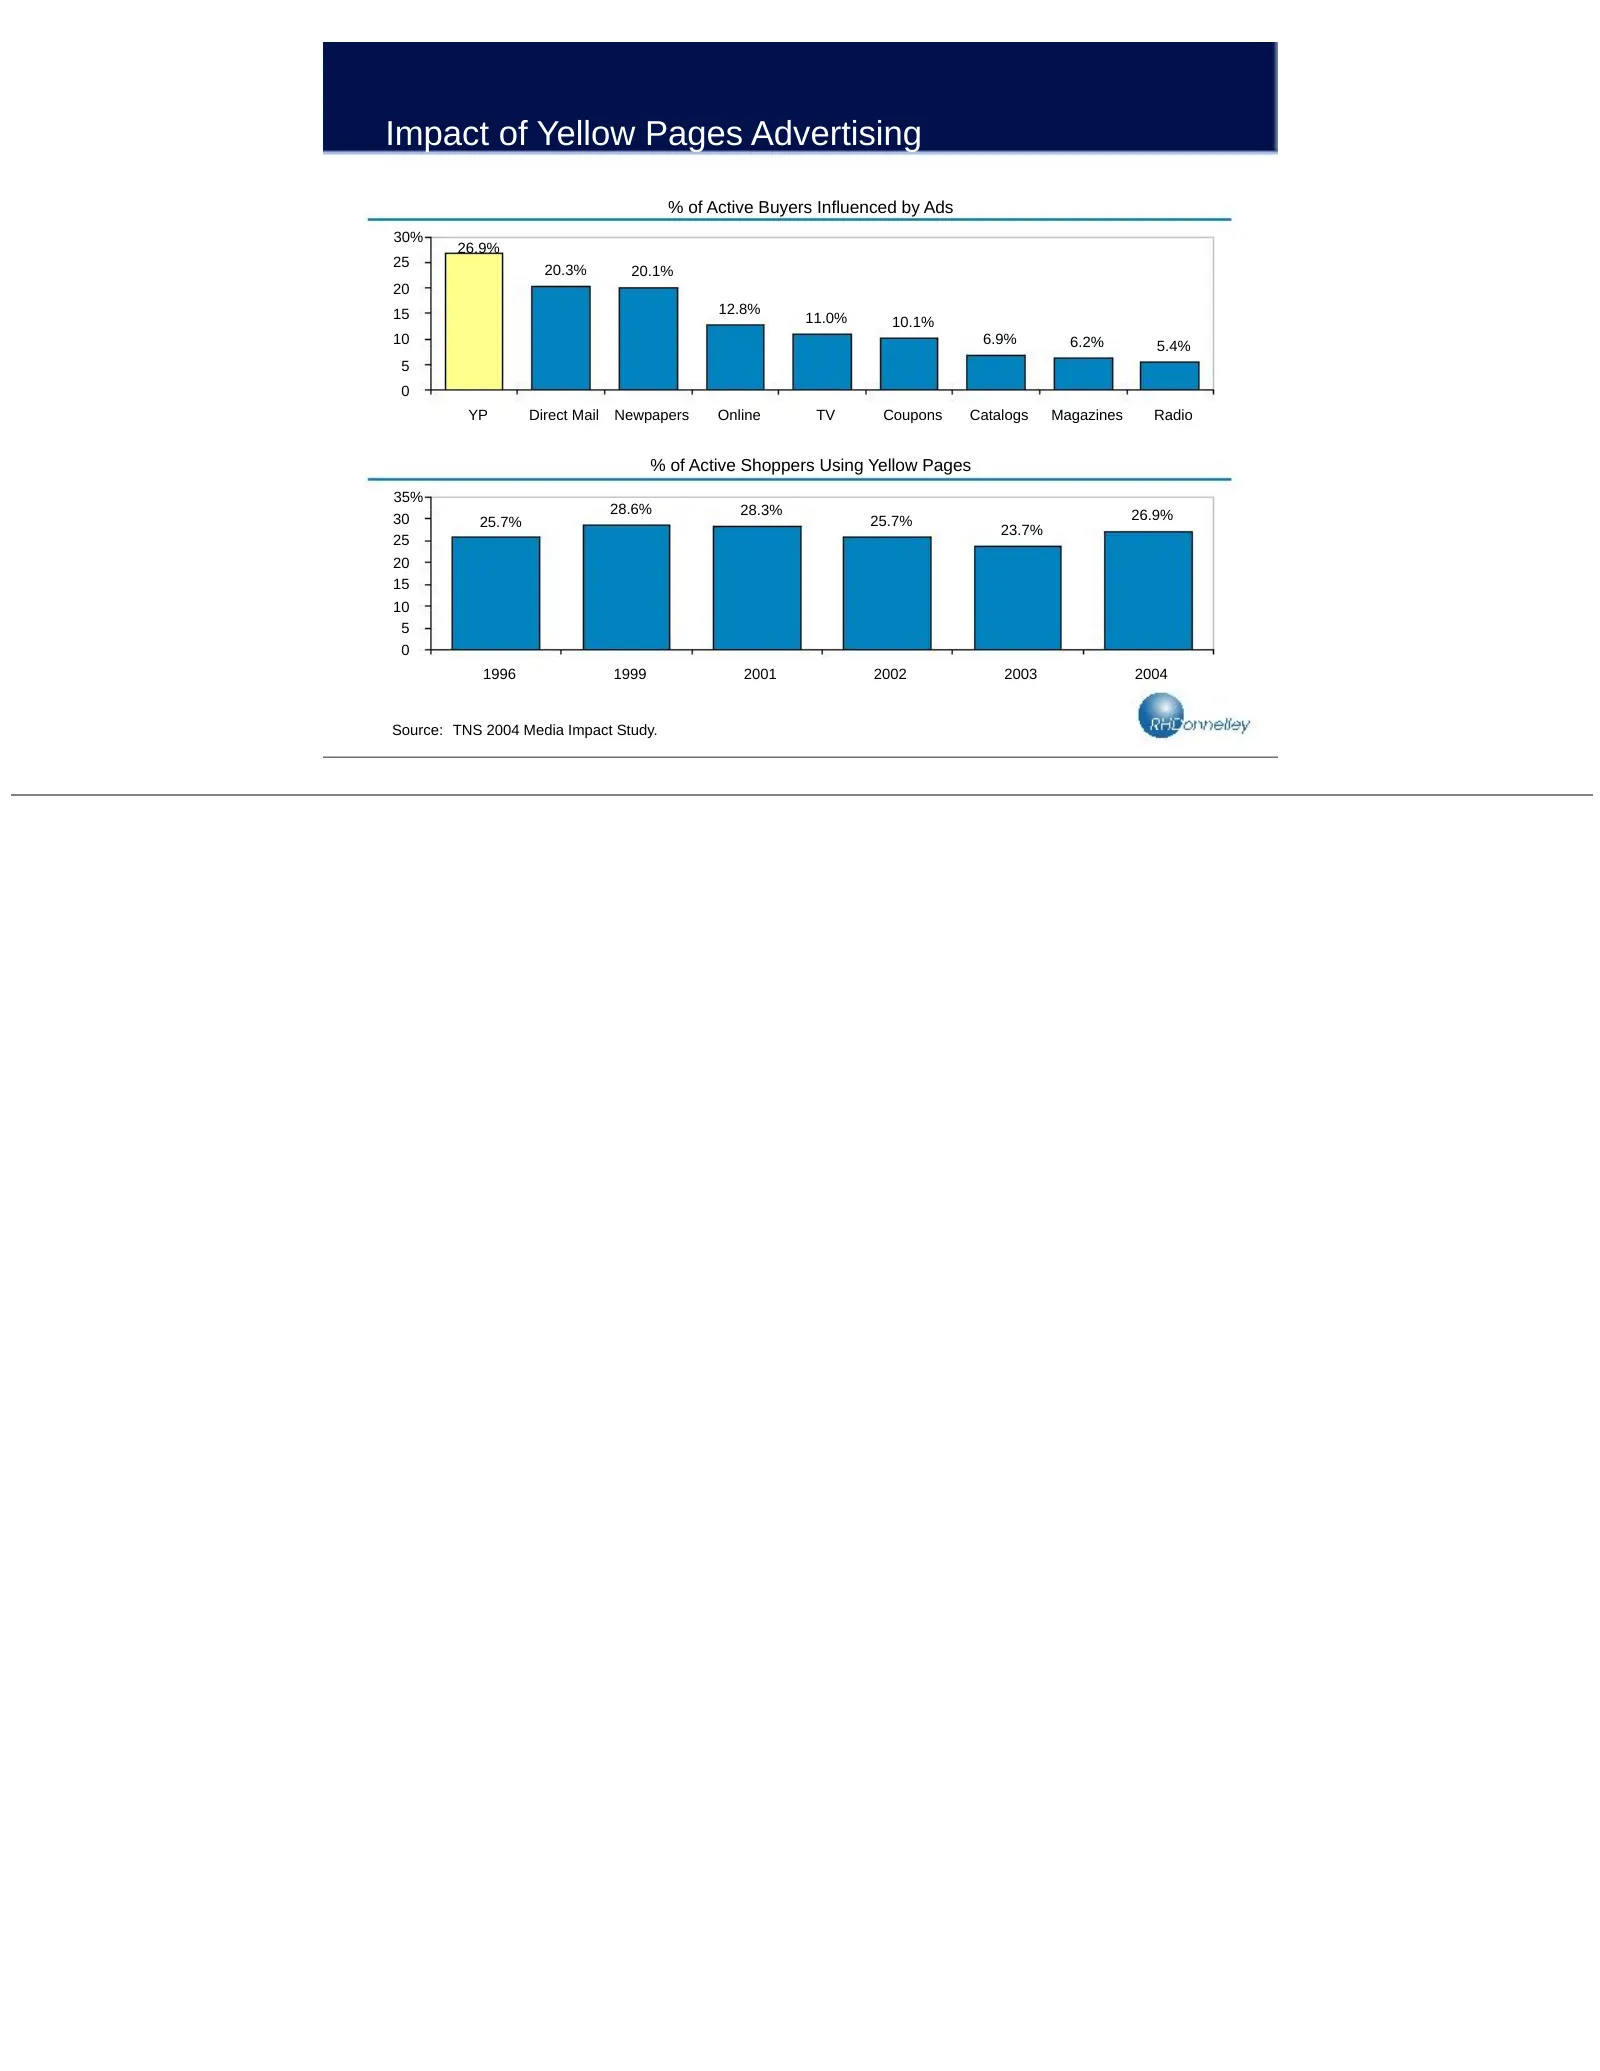
Impact of Yellow Pages Advertising % of Active Buyers Influenced by Ads 30% 26.9% 25 20.3% 20.1% 20 15 12.8% 11.0% 10.1% 10 6.9% 6.2% 5.4% 5 0 YP Direct Mail Newpapers Online TV Coupons Catalogs Magazines Radio % of Active Shoppers Using Yellow Pages 35% 28.6% 28.3% 26.9% 30 25.7% 25.7% 23.7% 25 20
Slide 18: Strong Value Proposition
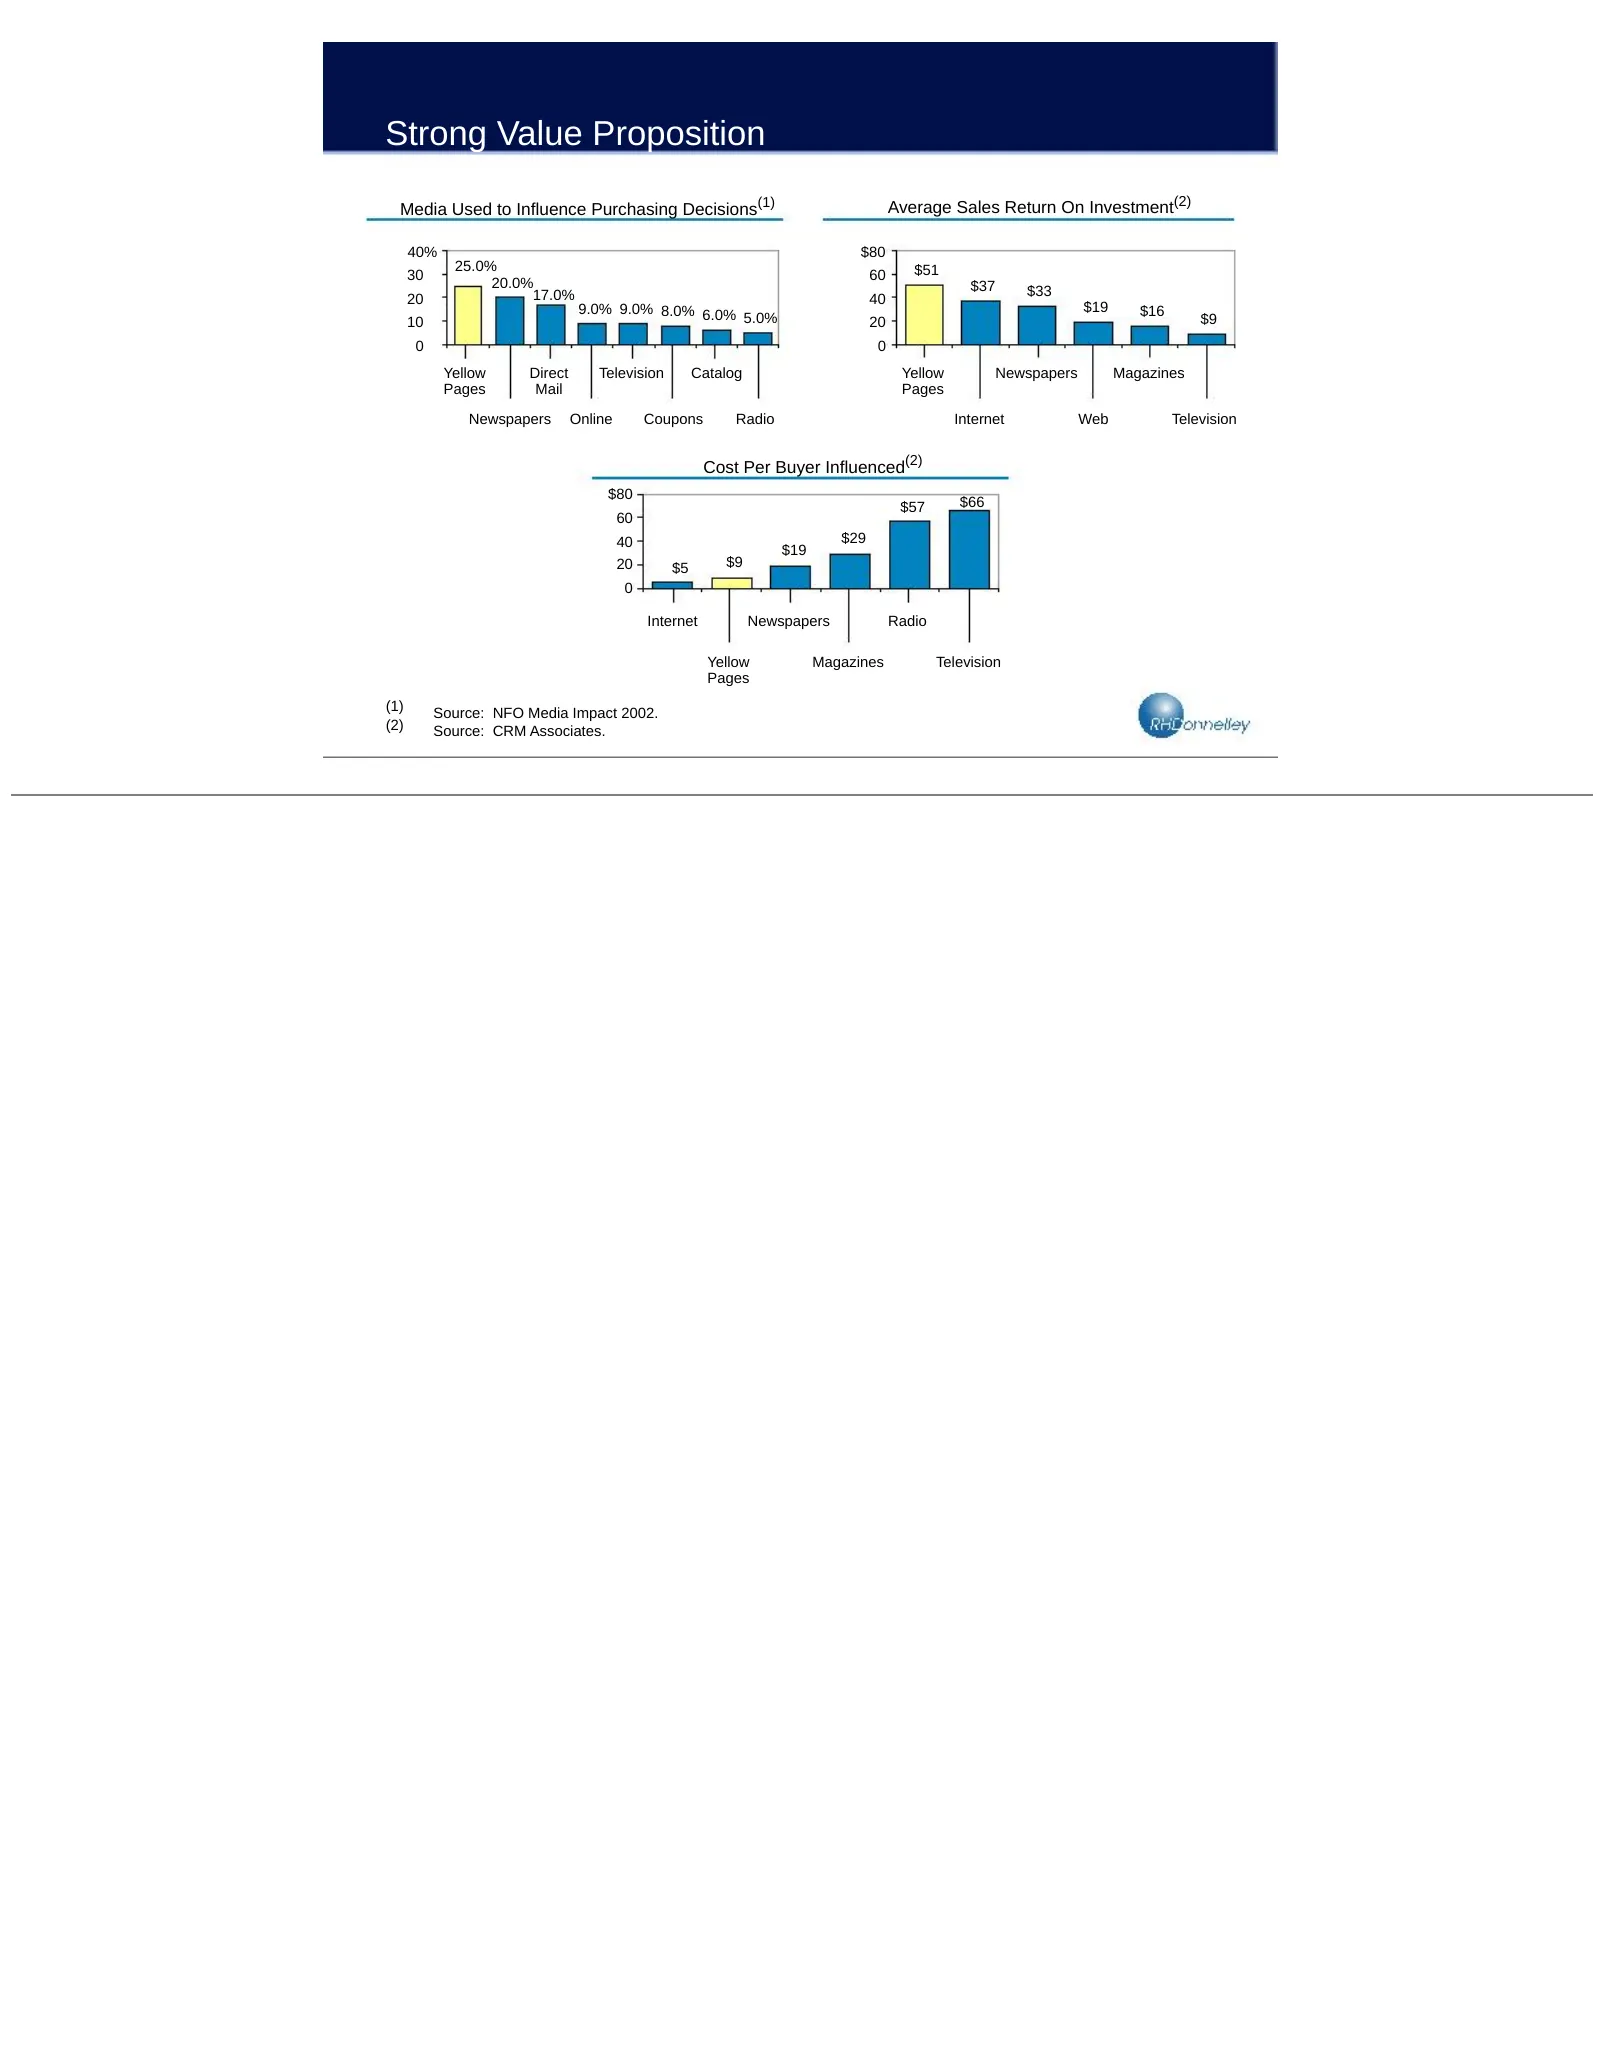
Strong Value Proposition Media Used to Influence Purchasing Decisions(1) Average Sales Return On Investment(2) 40% $80 25.0% $51 30 60 20.0% $37 17.0% $33 20 40 9.0% 9.0% 8.0% 6.0% $19 $16 10 5.0% 20 $9 0 0 Yellow Direct Television Catalog Yellow Newspapers Magazines Pages Mail Pages Newspapers Onli
Slide 19: Yellow Pages as Directional Media
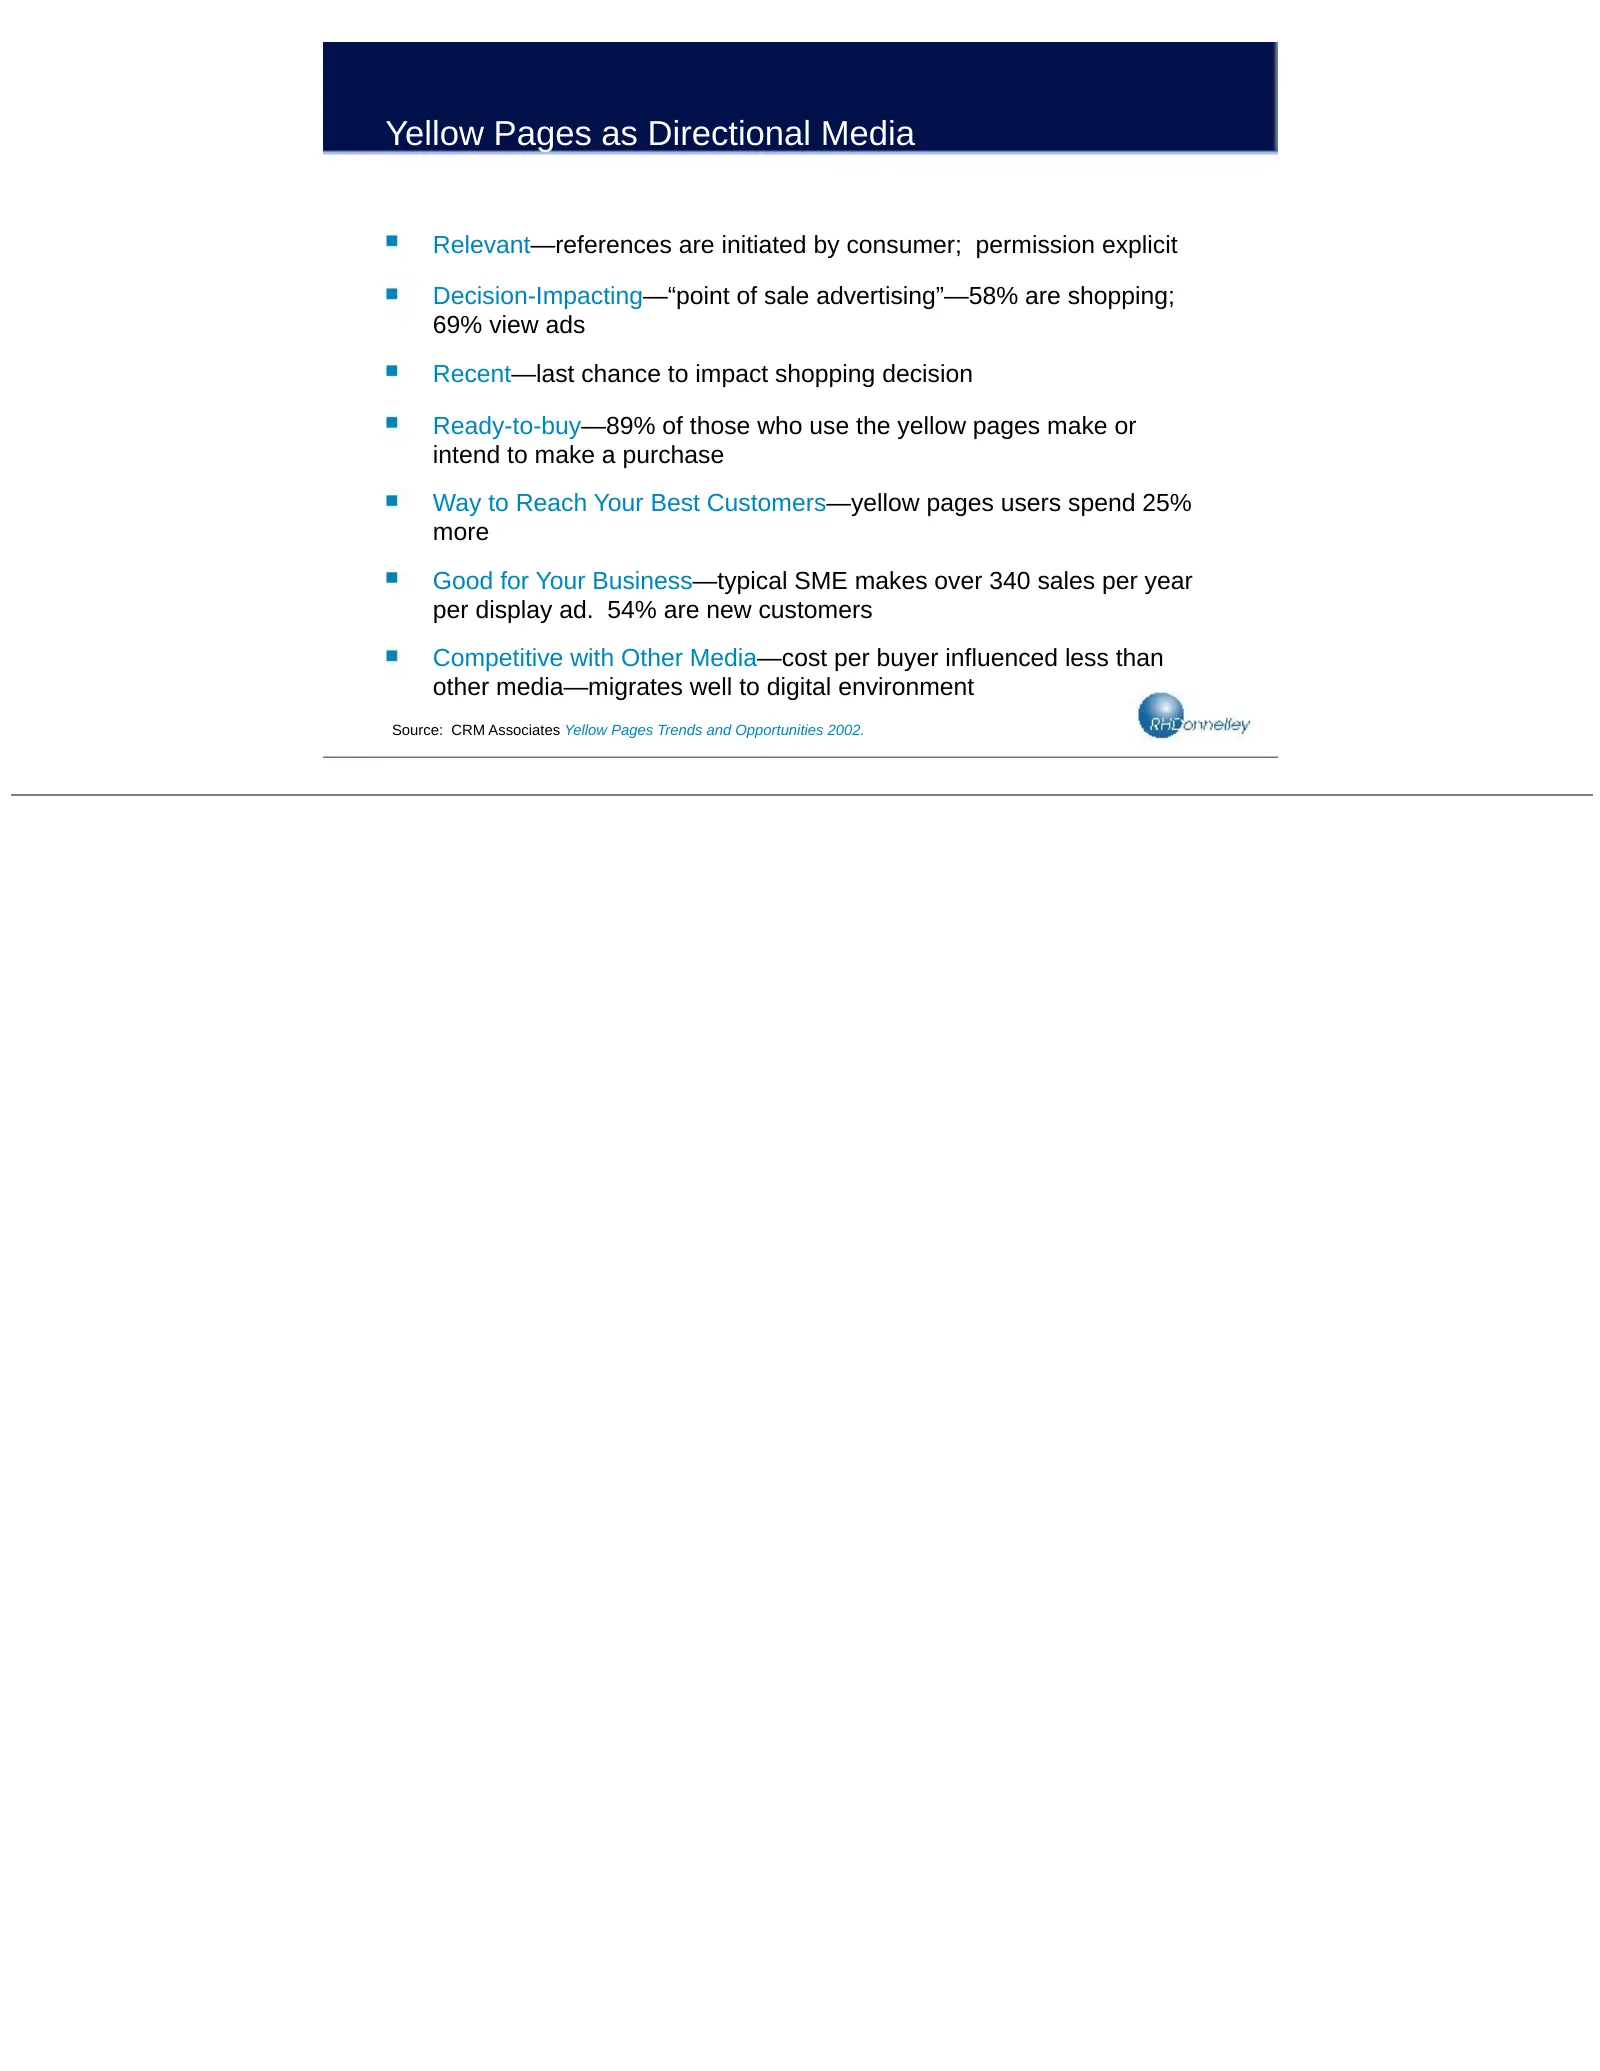
Yellow Pages as Directional Media Relevant—references are initiated by consumer; permission explicit Decision-Impacting—“point of sale advertising”—58% are shopping; 69% view ads Recent—last chance to impact shopping decision Ready-to-buy—89% of those who use the yellow pages make or intend to make
Slide 20: Incumbent Competitive Advantage
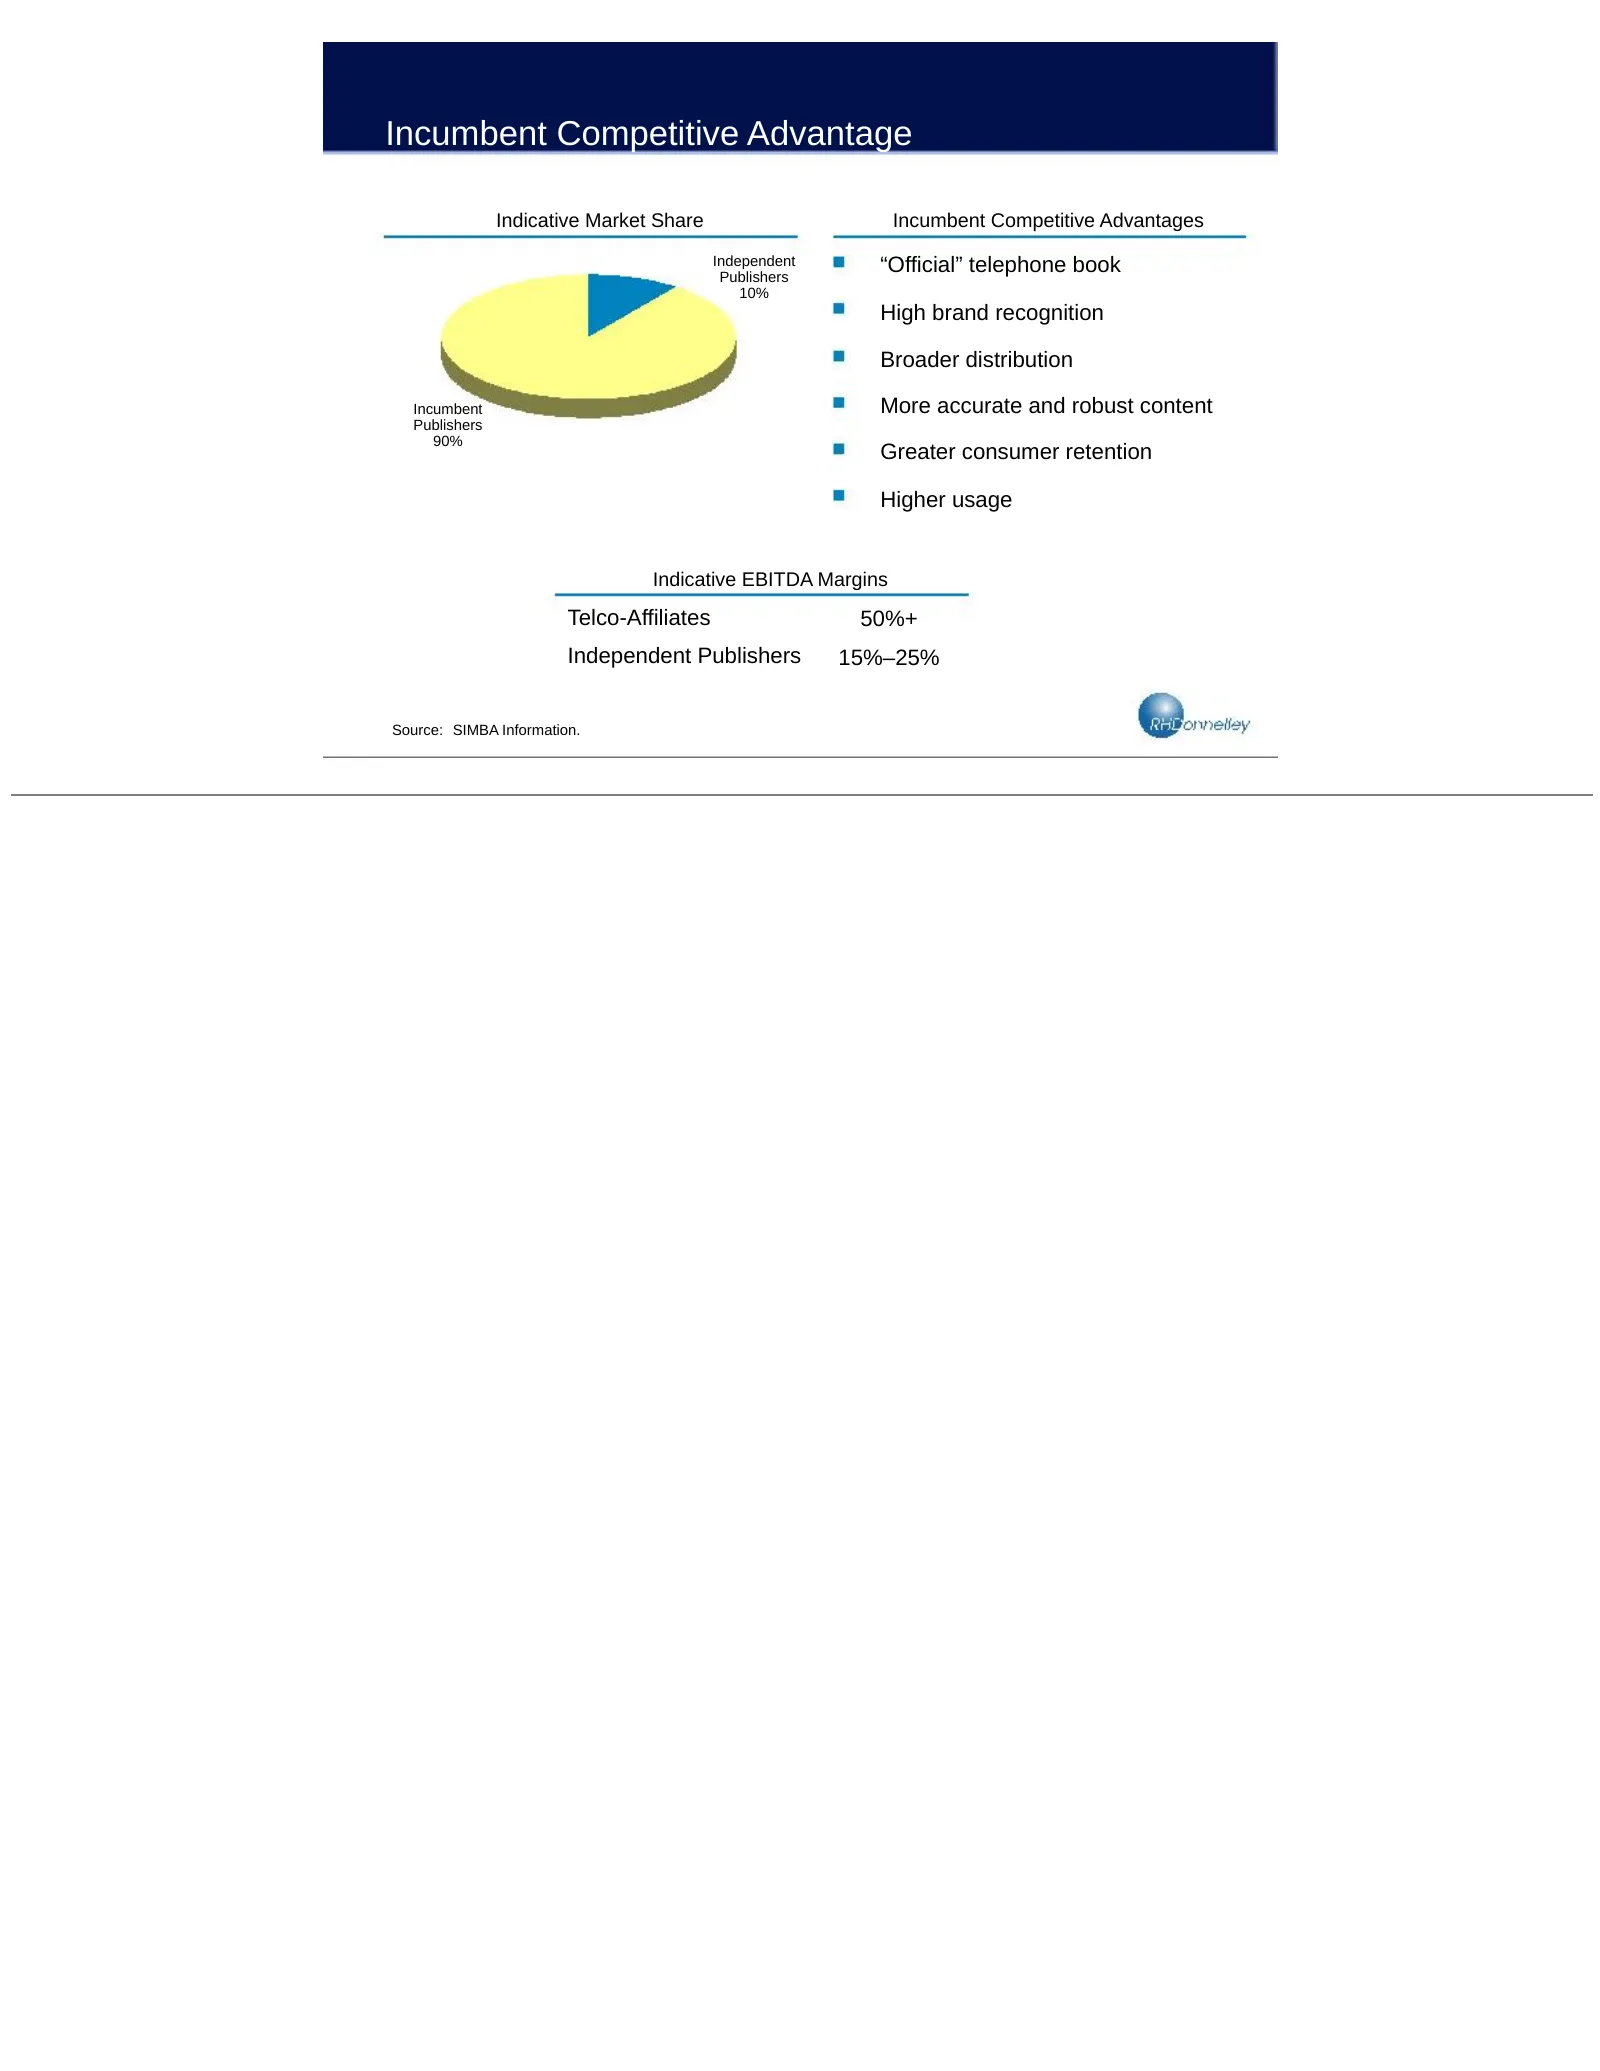
Incumbent Competitive Advantage Indicative Market Share Incumbent Competitive Advantages Independent Publishers “Official” telephone book 10% High brand recognition Broader distribution Incumbent More accurate and robust content Publishers 90% Greater consumer retention Higher usage Indicative EBITD
Slide 21: Strong Advertiser Base and High Recurring Revenue Streams
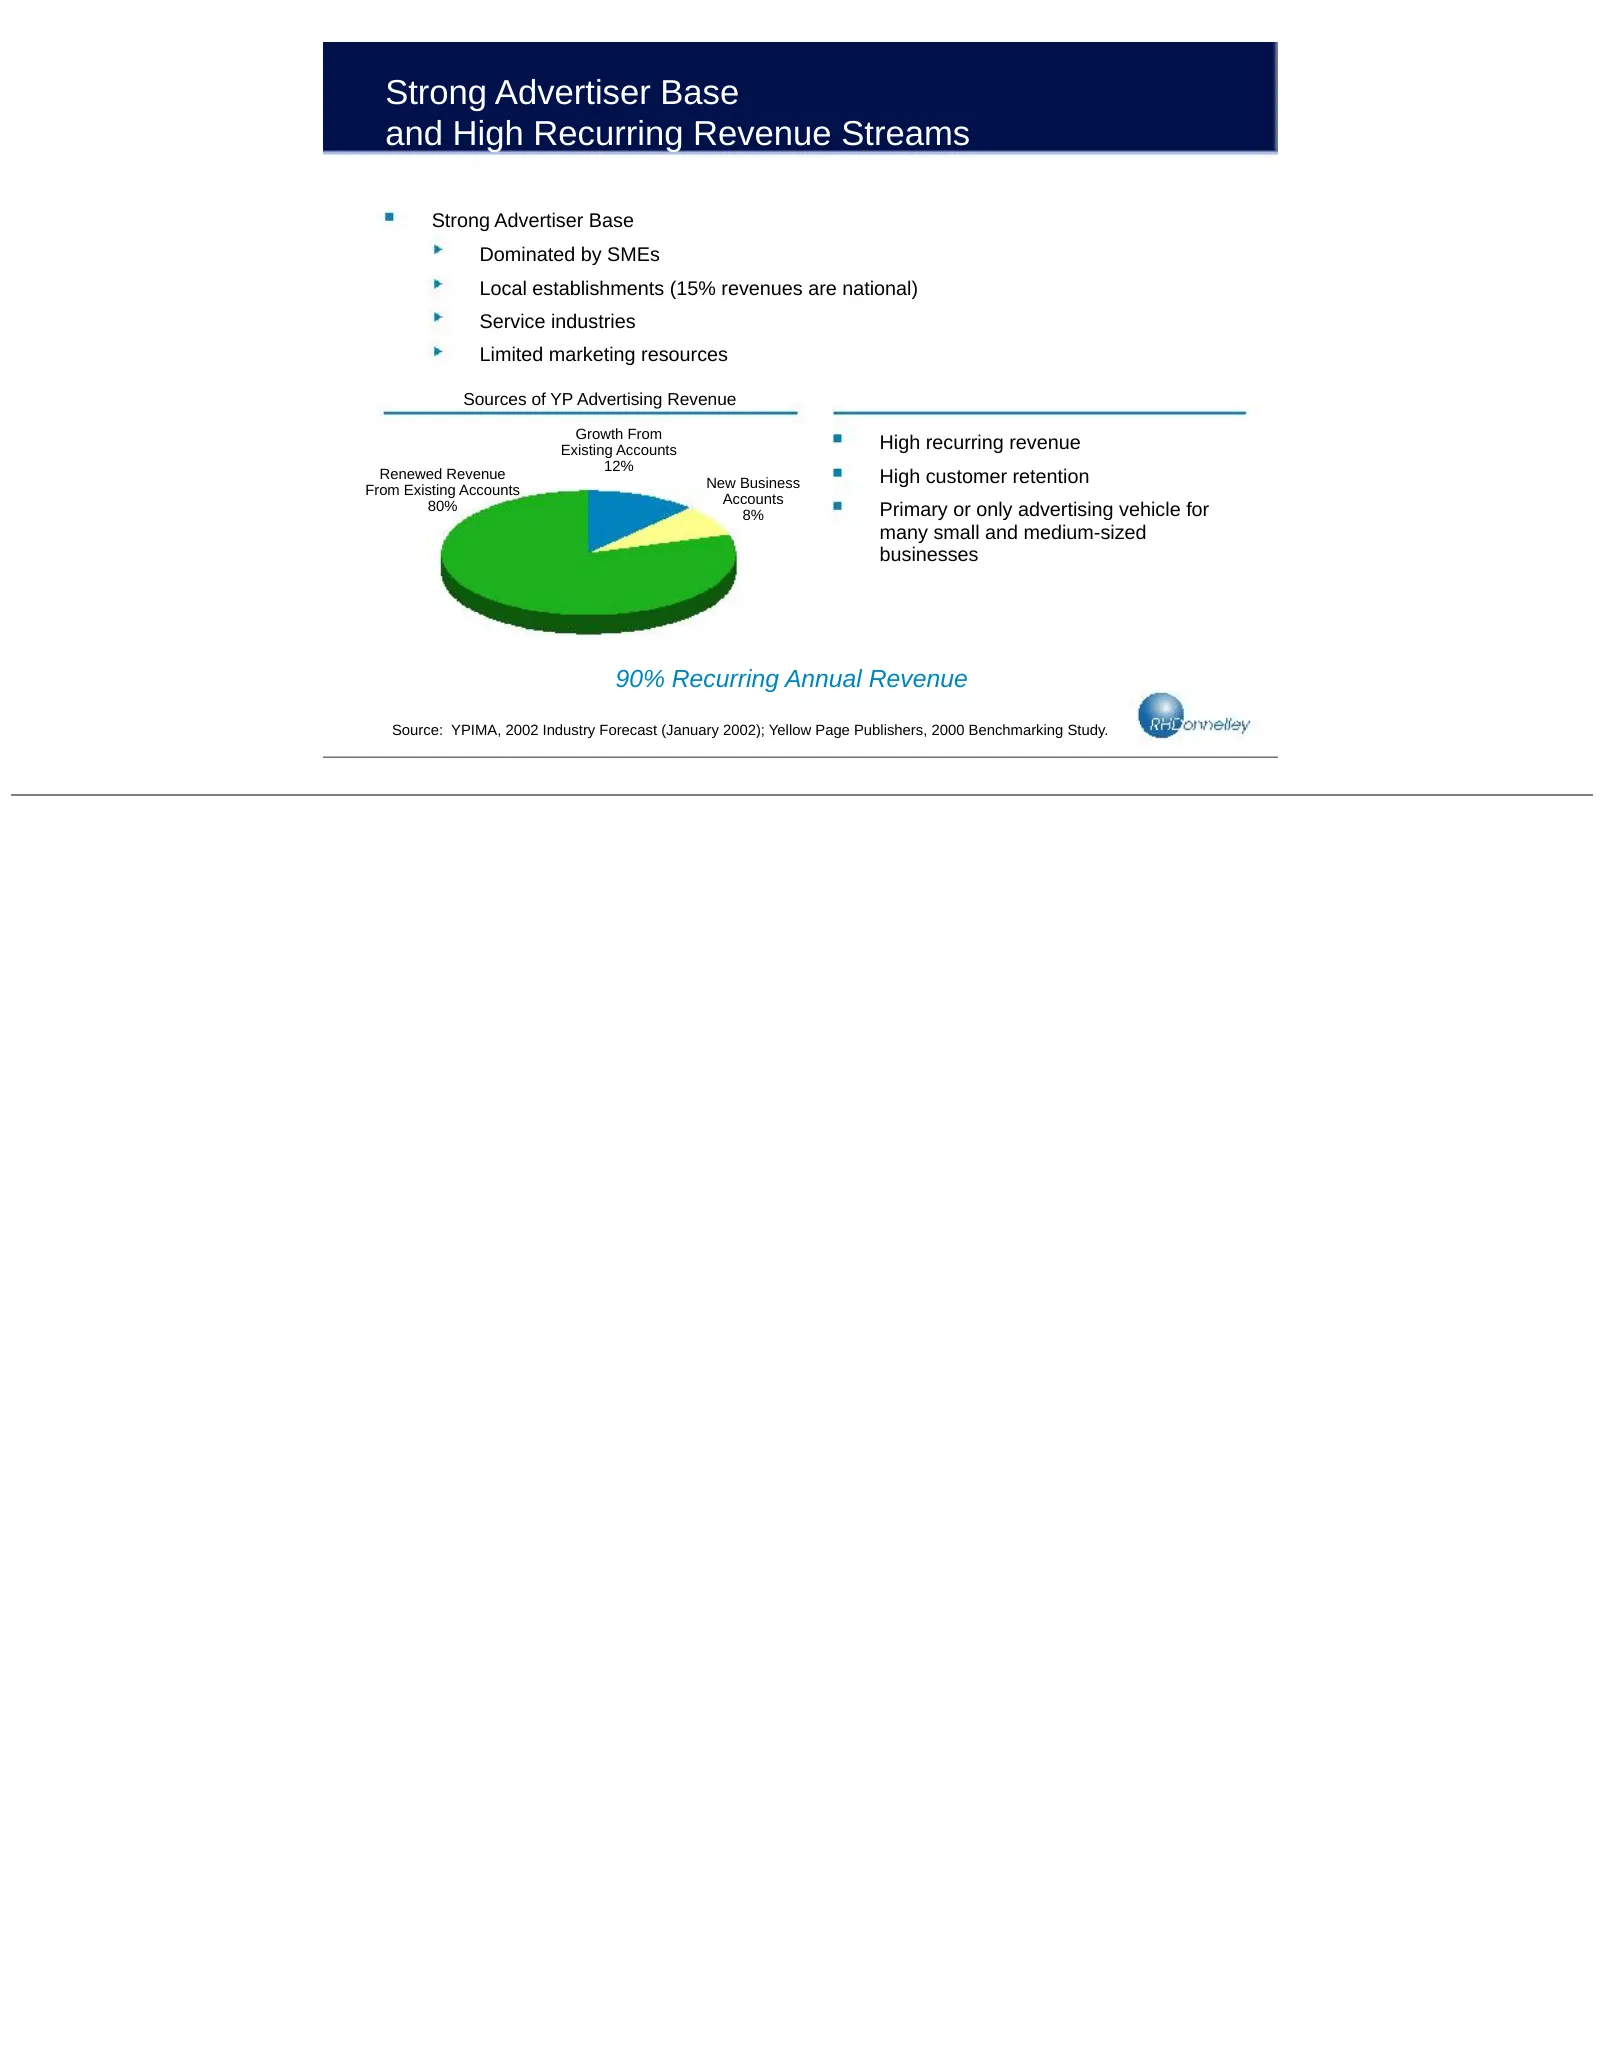
Strong Advertiser Base and High Recurring Revenue Streams Strong Advertiser Base Dominated by SMEs Local establishments (15% revenues are national) Service industries Limited marketing resources Sources of YP Advertising Revenue Growth From Existing Accounts High recurring revenue 12% Renewed Revenu

Slide 22: Financial Overview and Investment Thesis
Financial Overview and Investment Thesis
Slide 23: Historical & Projected Financial Performance
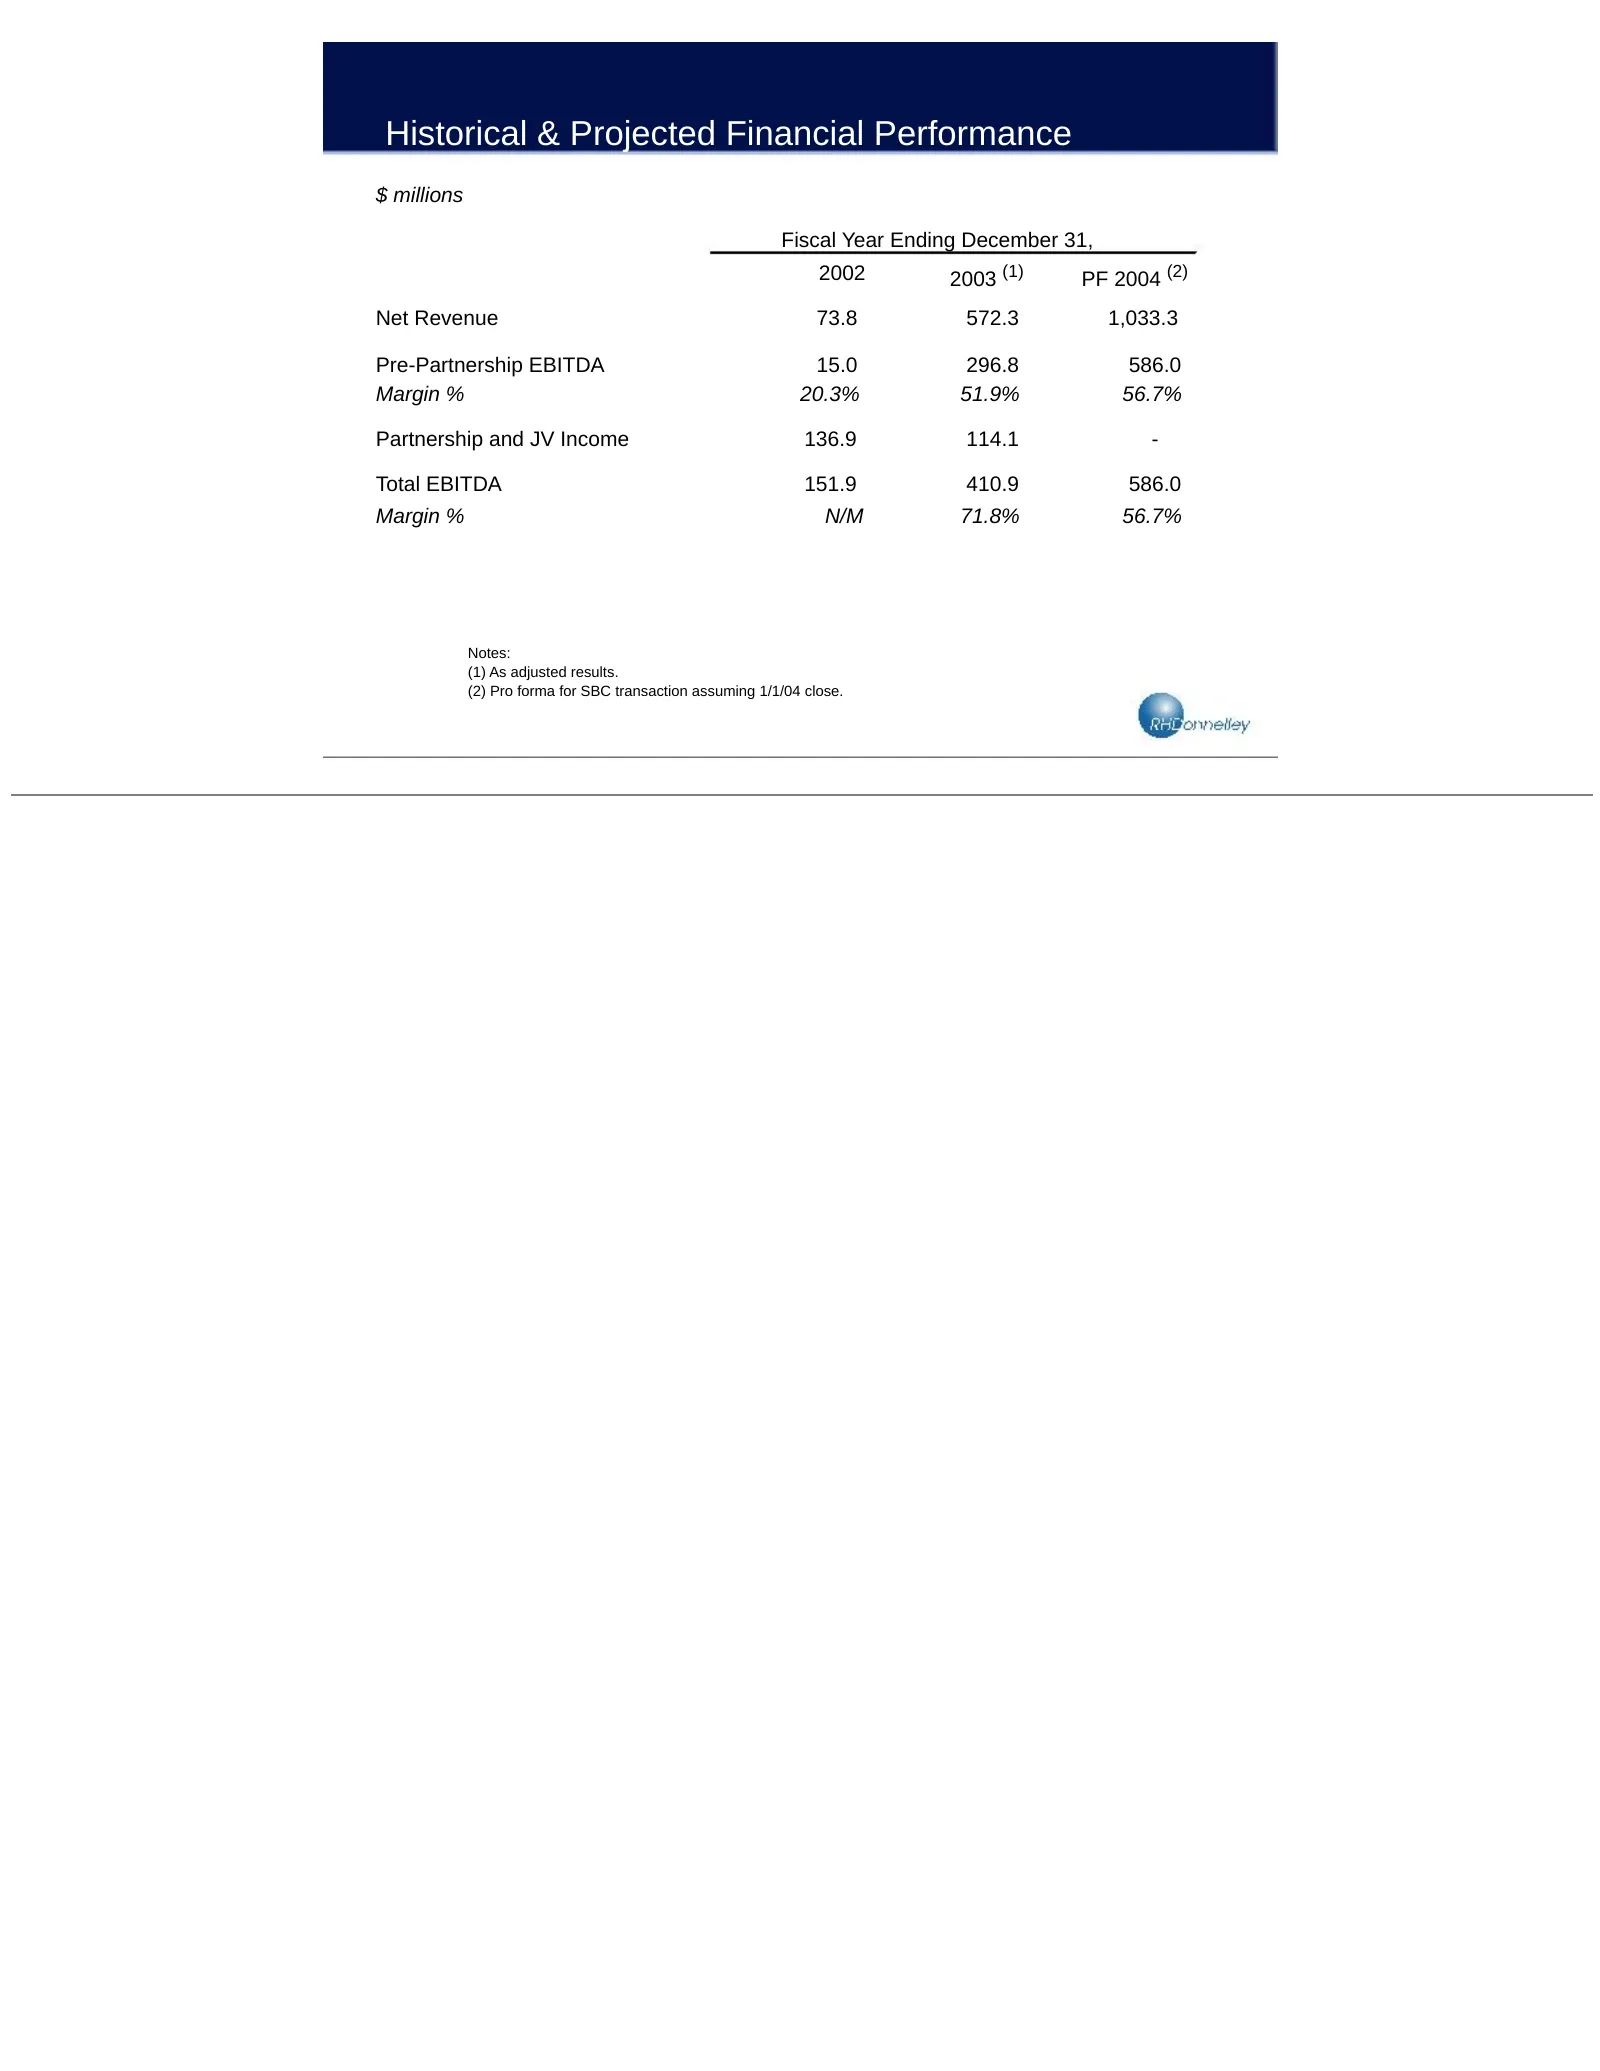
Historical & Projected Financial Performance $ millions Fiscal Year Ending December 31, 2002 2003 (1) PF 2004 (2) Net Revenue 73.8 572.3 1,033.3 Pre-Partnership EBITDA 15.0 296.8 586.0 Margin % 20.3% 51.9% 56.7% Partnership and JV Income 136.9 114.1 - Total EBITDA 151.9 410.9 586.0 Margin % N/M 71.8
Slide 24: Capitalization
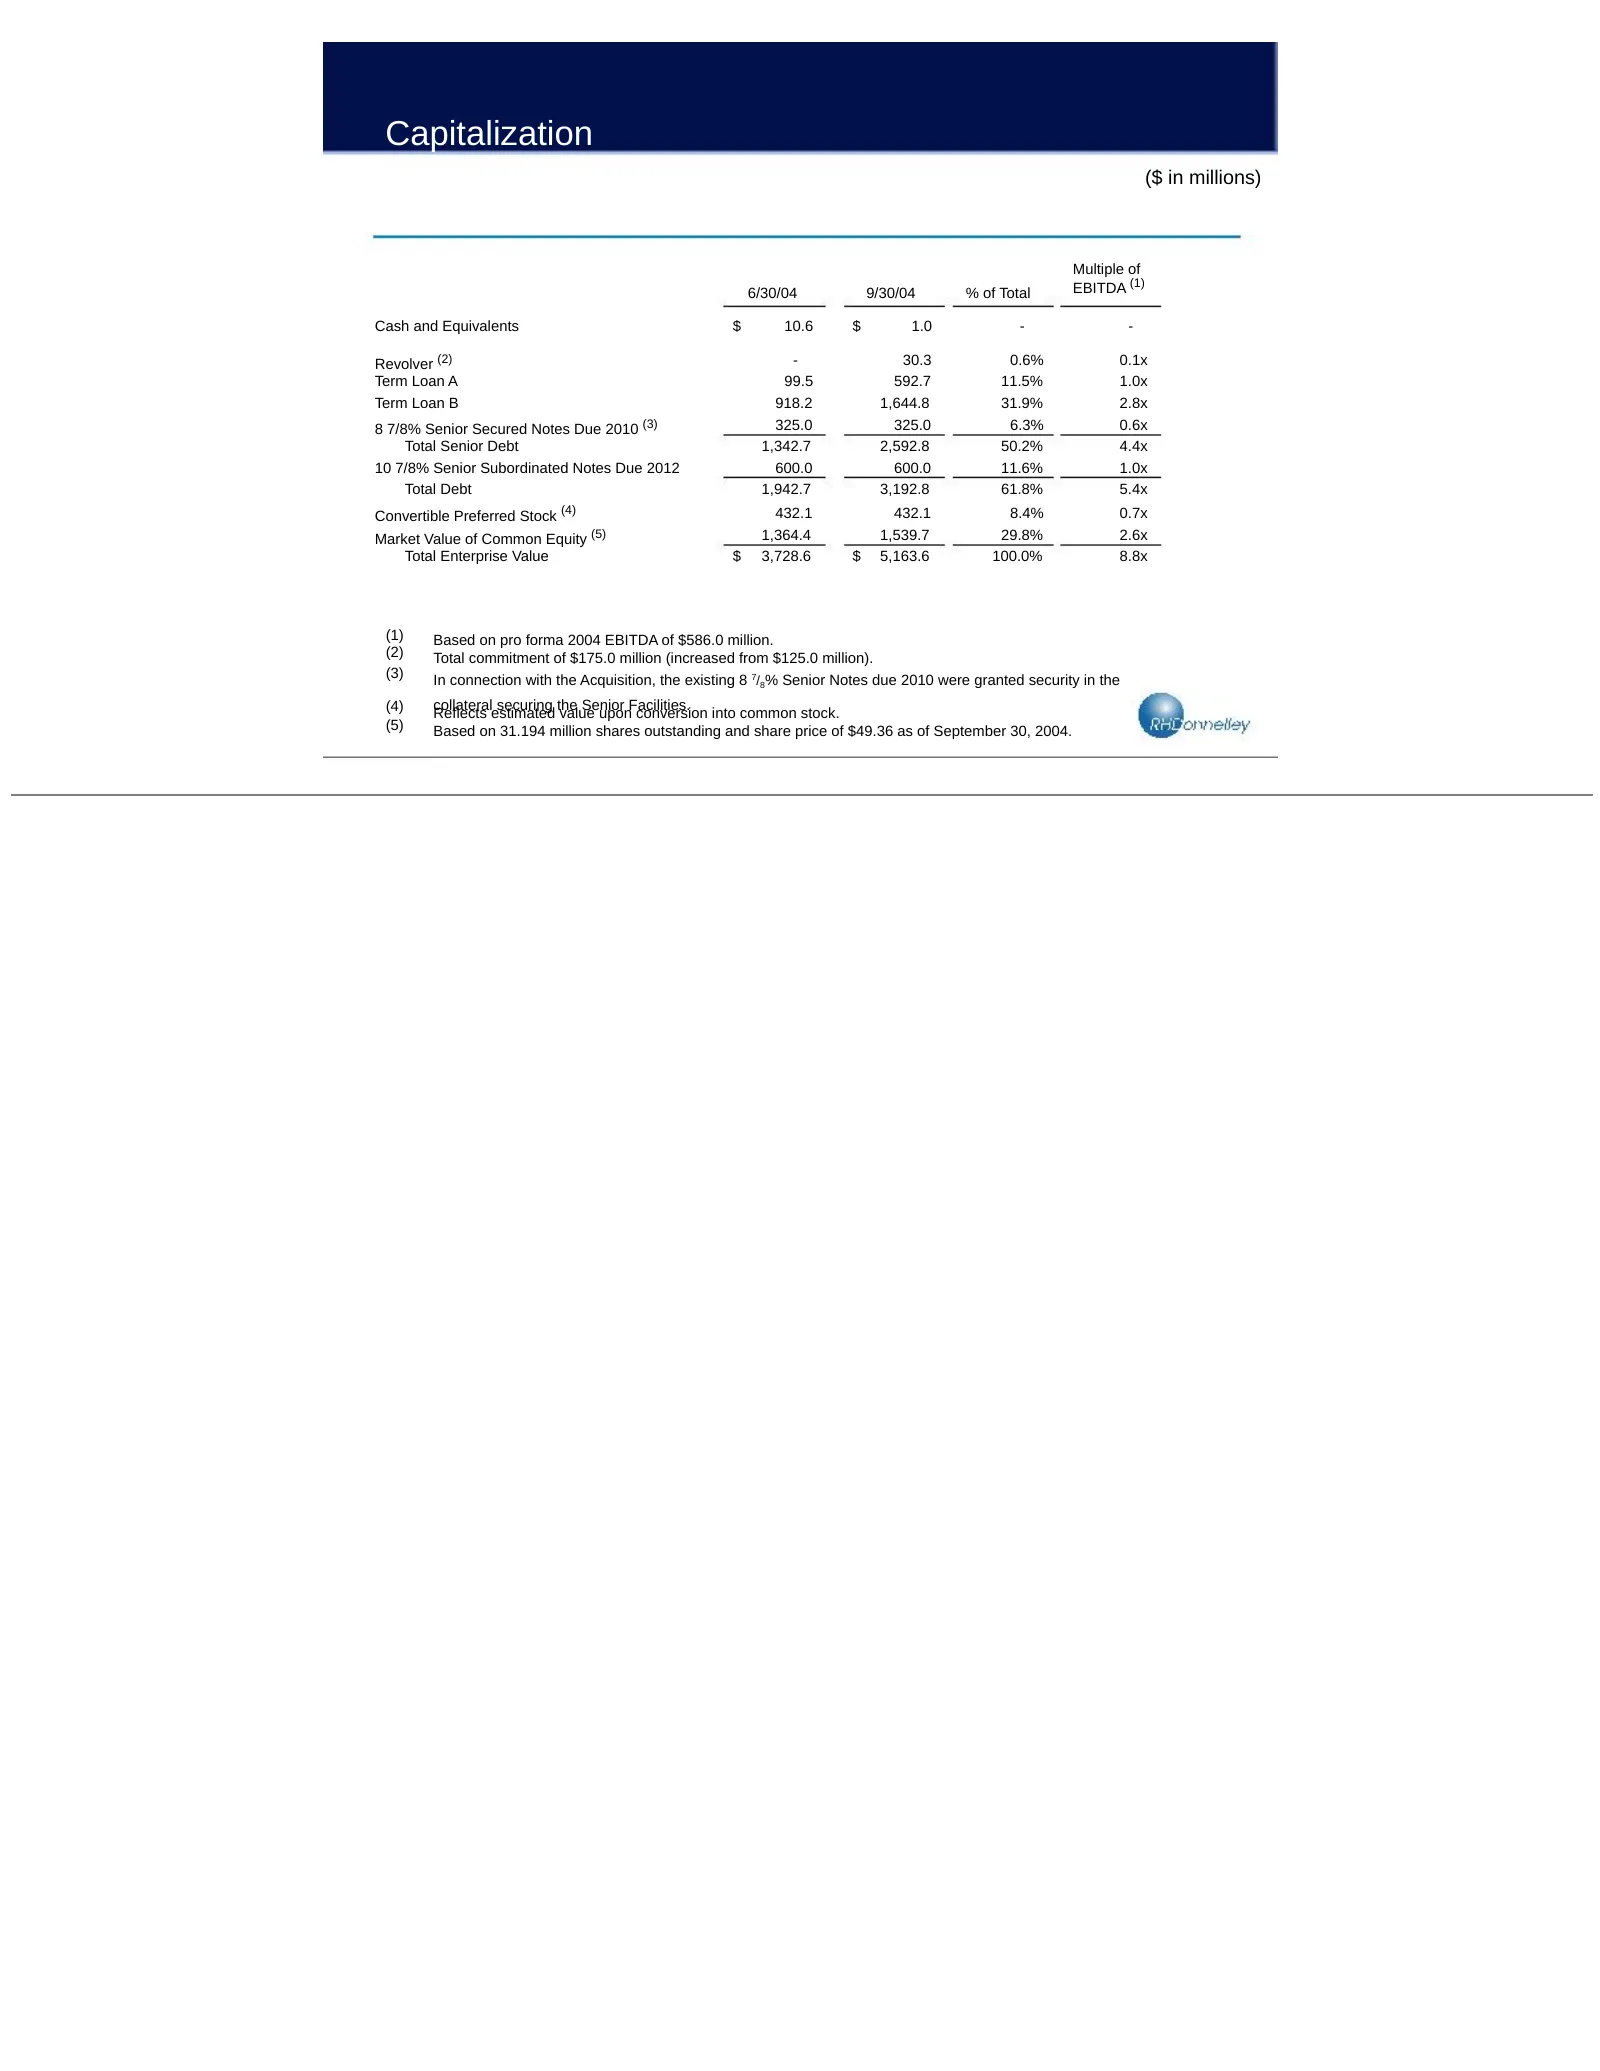
Capitalization ($ in millions) Multiple of 6/30/04 9/30/04 % of Total EBITDA (1) Cash and Equivalents $ 10.6 $ 1.0 - - Revolver (2) - 30.3 0.6% 0.1x Term Loan A 99.5 592.7 11.5% 1.0x Term Loan B 918.2 1,644.8 31.9% 2.8x 8 7/8% Senior Secured Notes Due 2010 (3) 325.0 325.0 6.3% 0.6x Total Senior Debt
Slide 25: History of Shareholder Value Creation
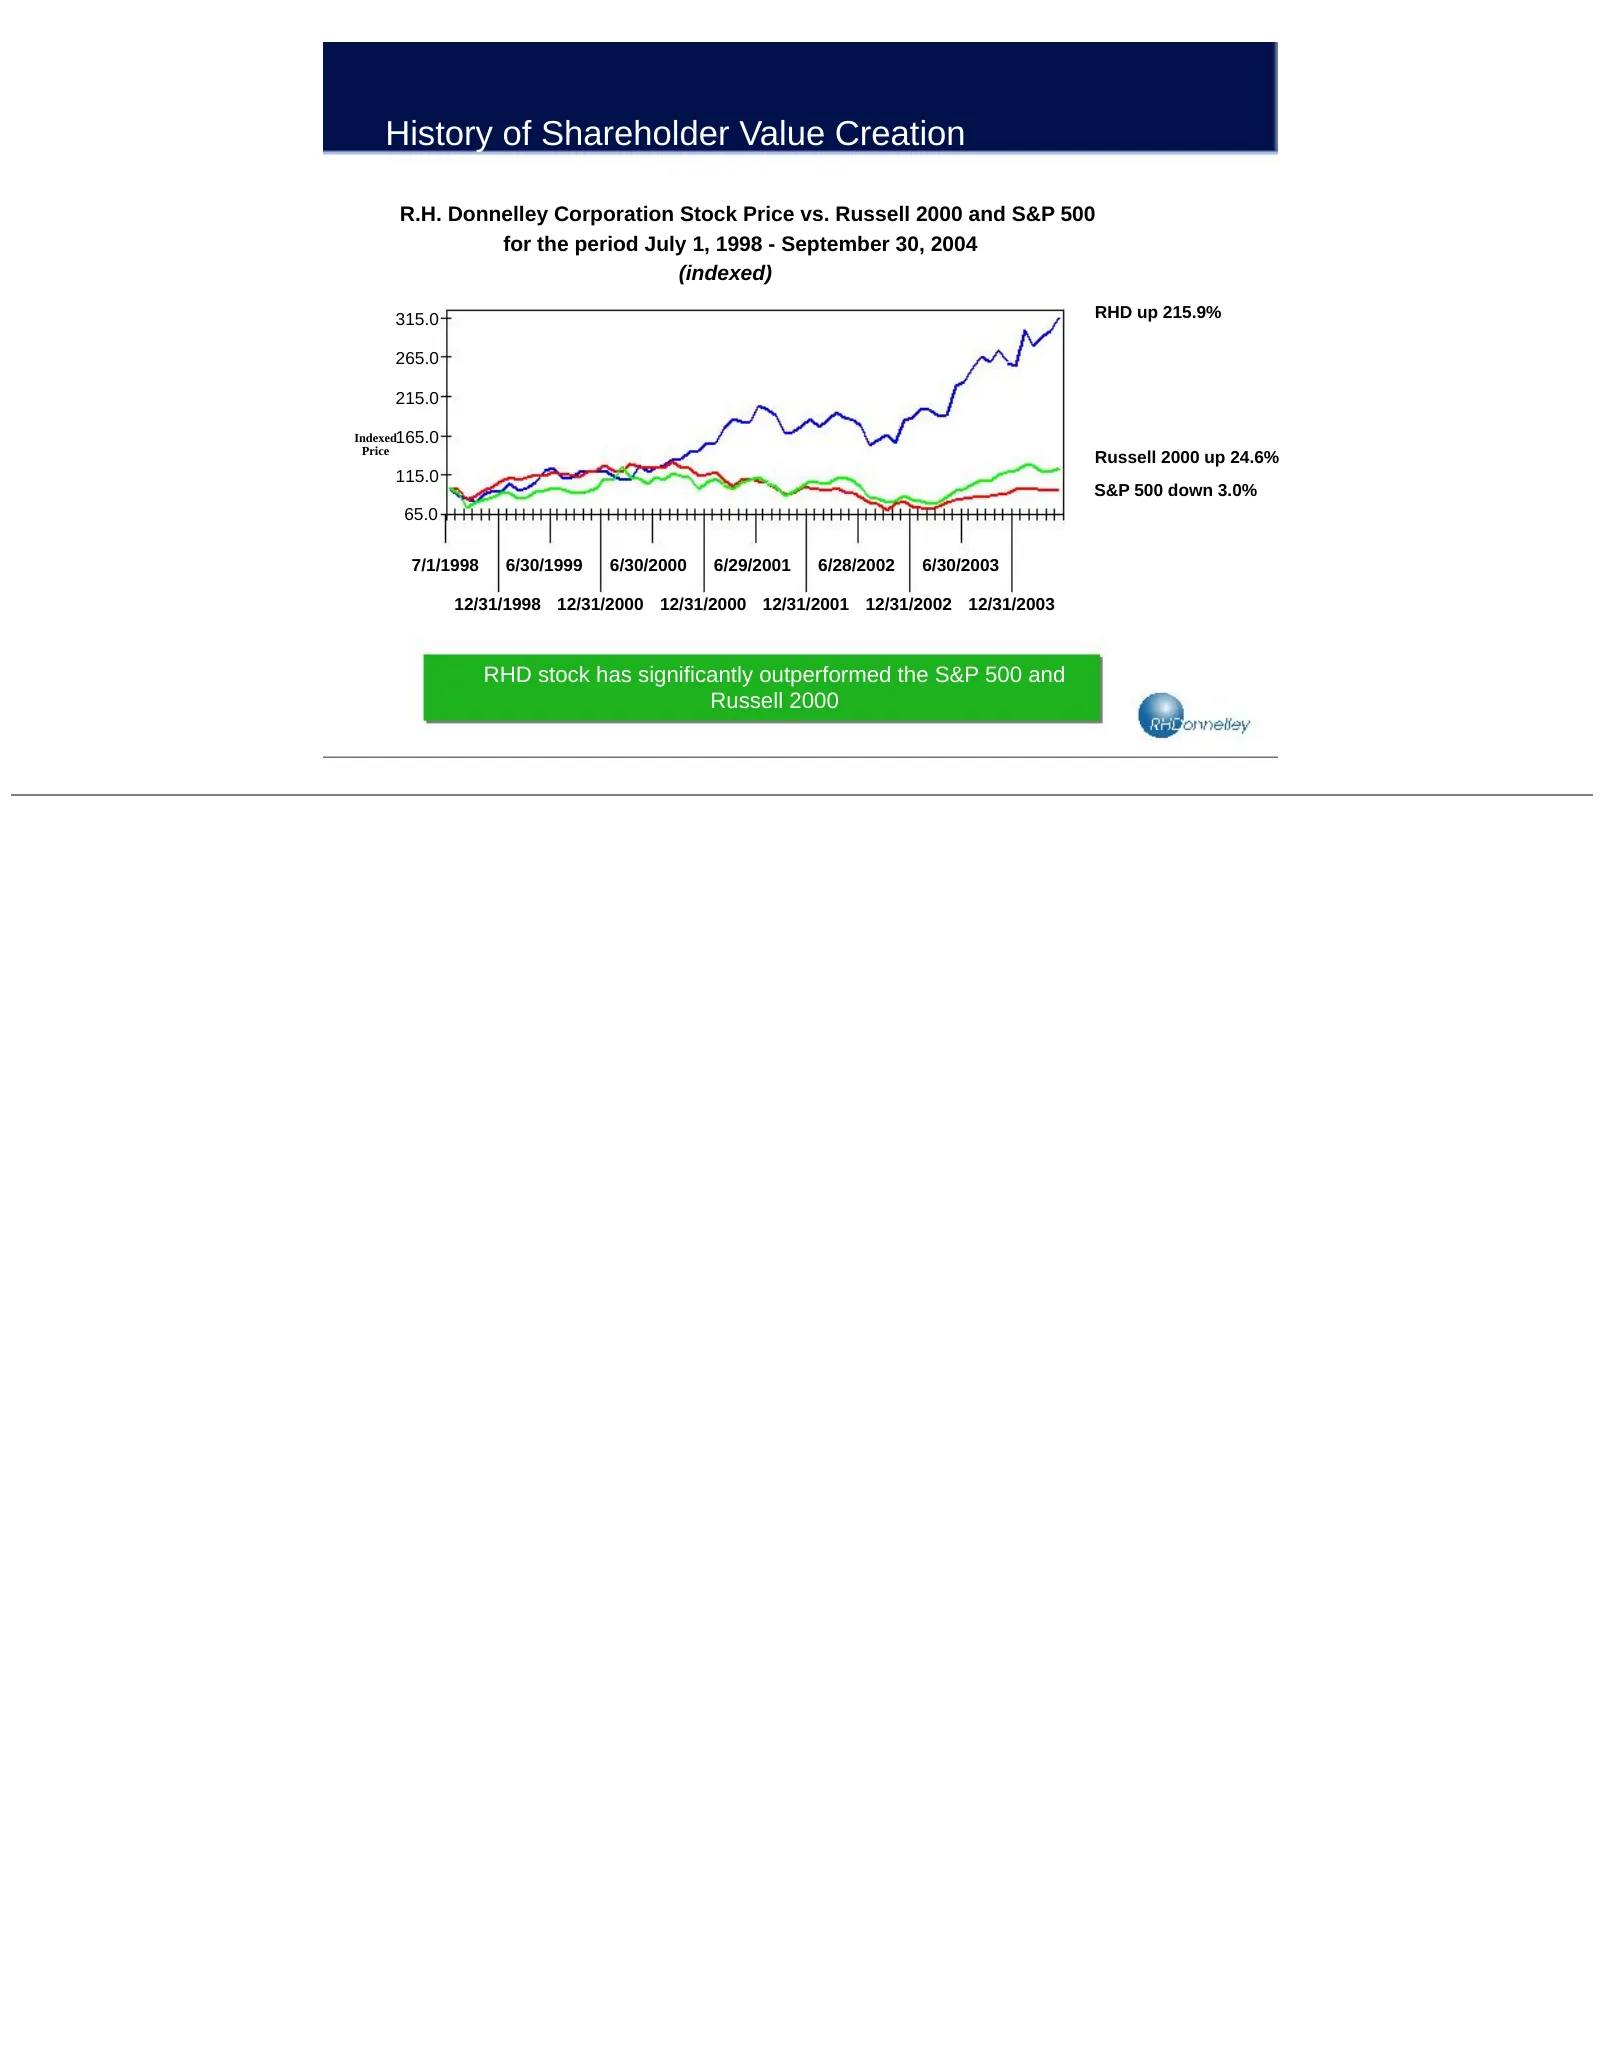
History of Shareholder Value Creation R.H. Donnelley Corporation Stock Price vs. Russell 2000 and S&P 500 for the period July 1, 1998 - September 30, 2004 (indexed) 315.0 RHD up 215.9% 265.0 215.0 Indexed165.0 Price Russell 2000 up 24.6% 115.0 S&P 500 down 3.0% 65.0 7/1/1998 6/30/1999 6/30/2000 6/29
Slide 26: Cash Conversion: Favorable to Other Media
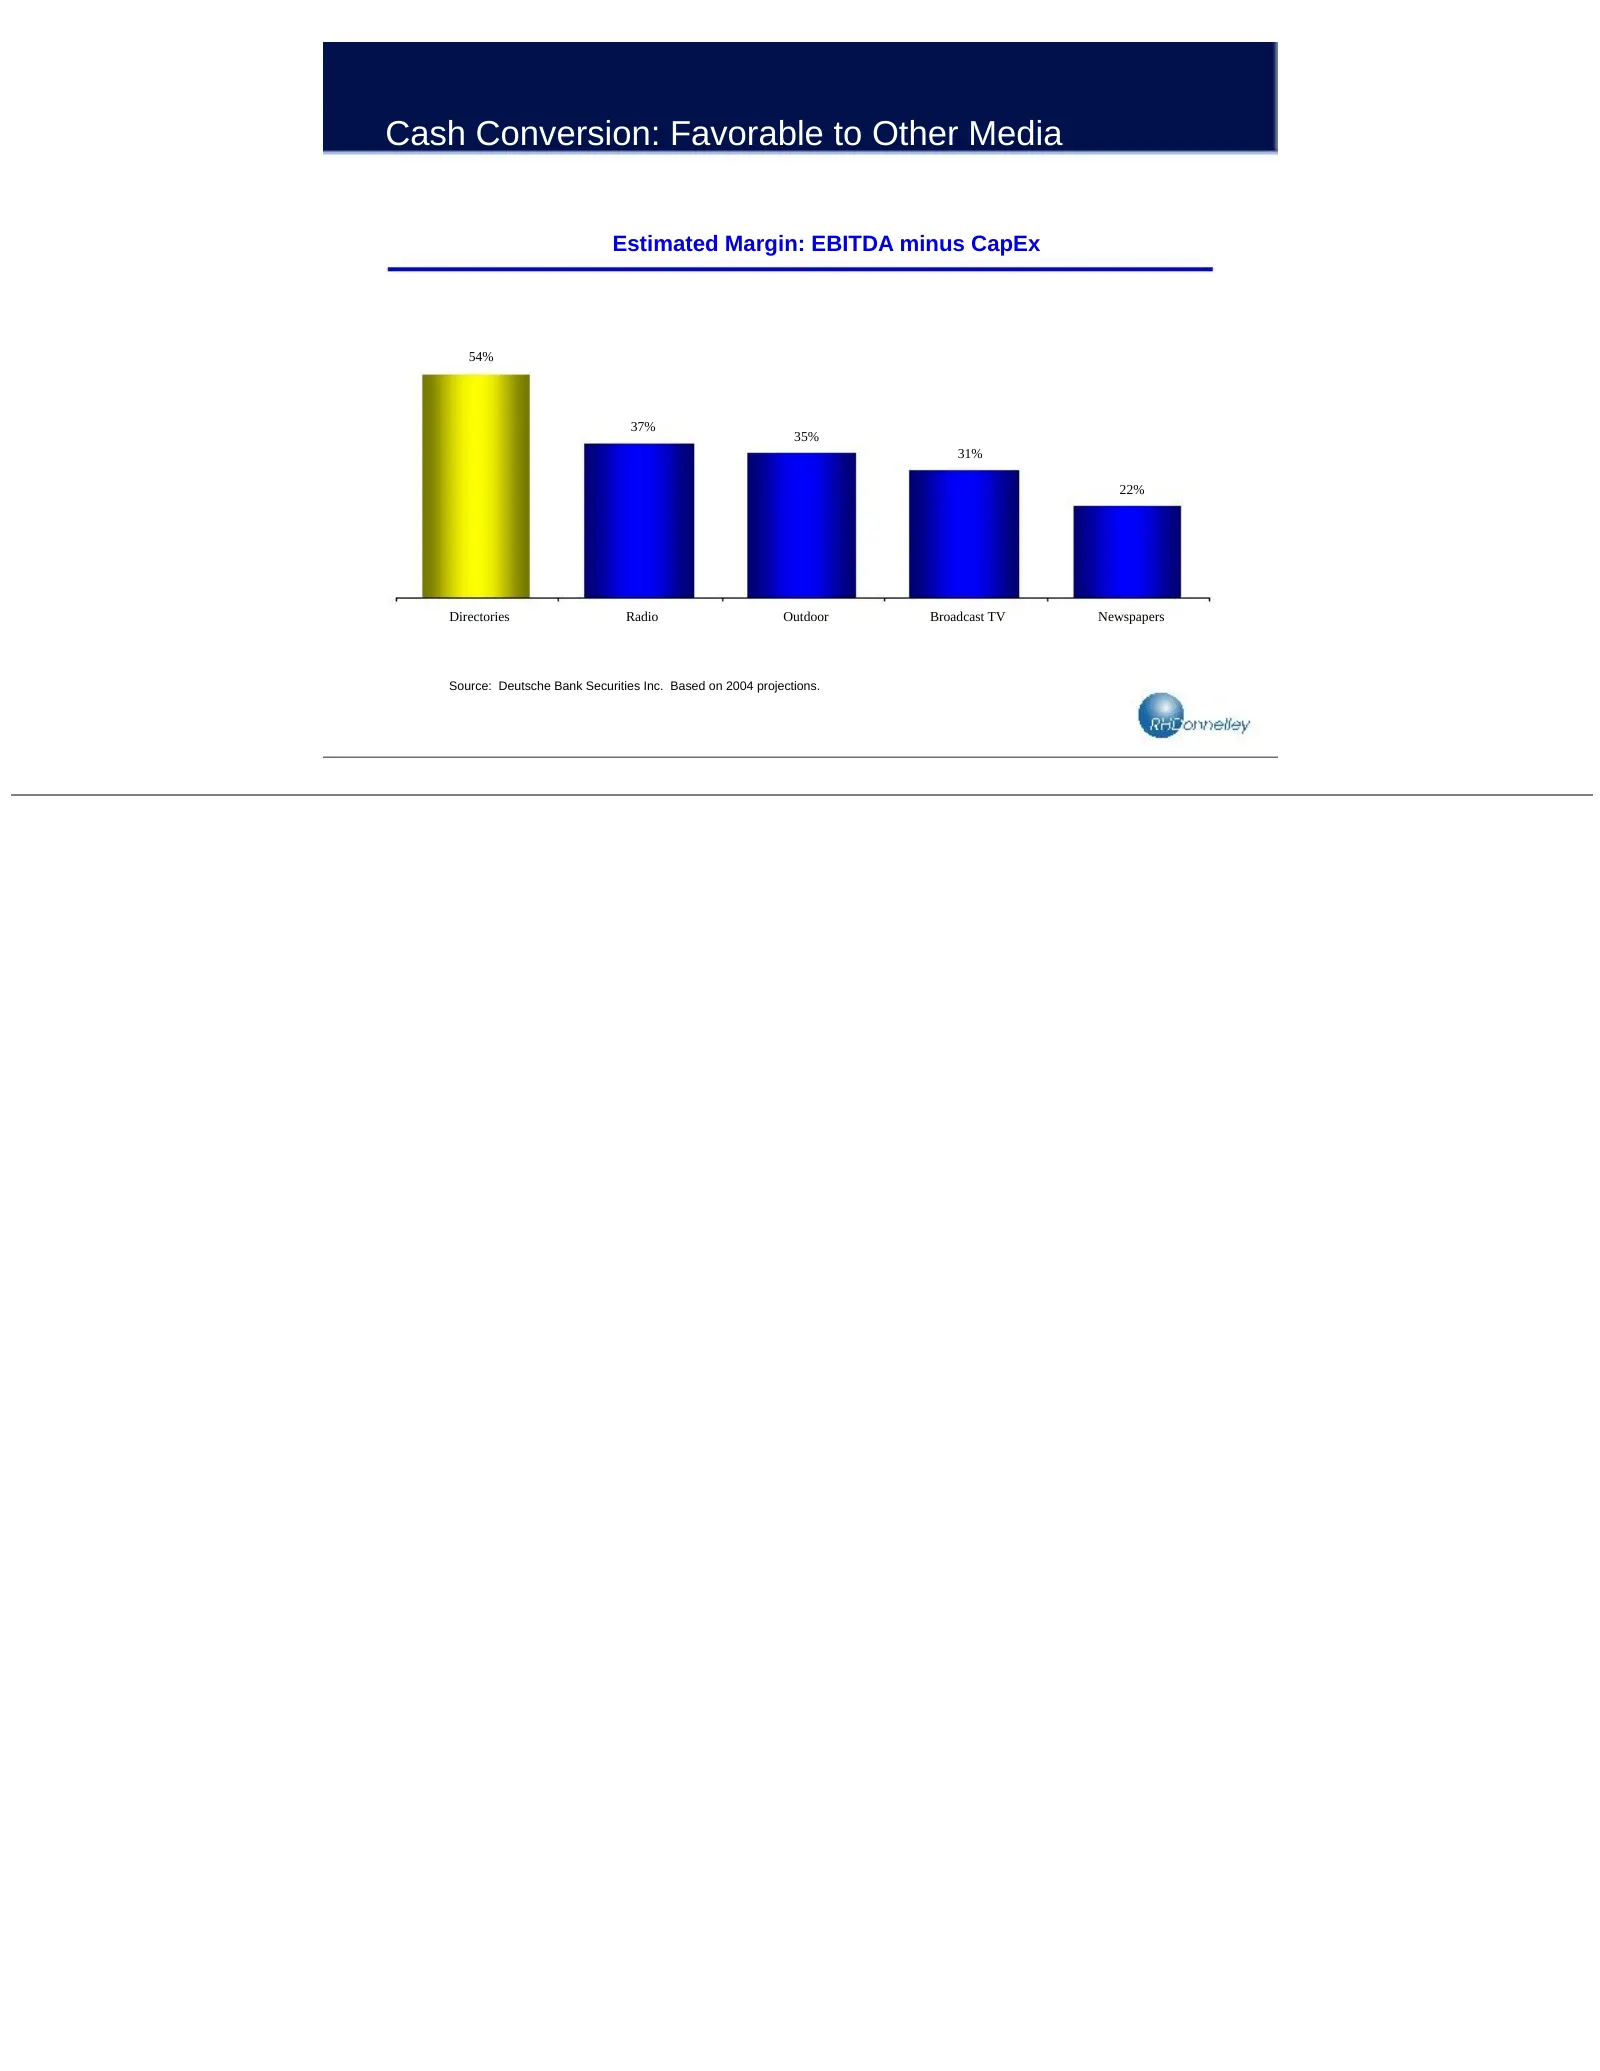
Cash Conversion: Favorable to Other Media Estimated Margin: EBITDA minus CapEx 54% 37% 35% 31% 22% Directories Radio Outdoor Broadcast TV Newspapers Source: Deutsche Bank Securities Inc. Based on 2004 projections.
Slide 27: EBITDA Valuation: Favorable to Other Media
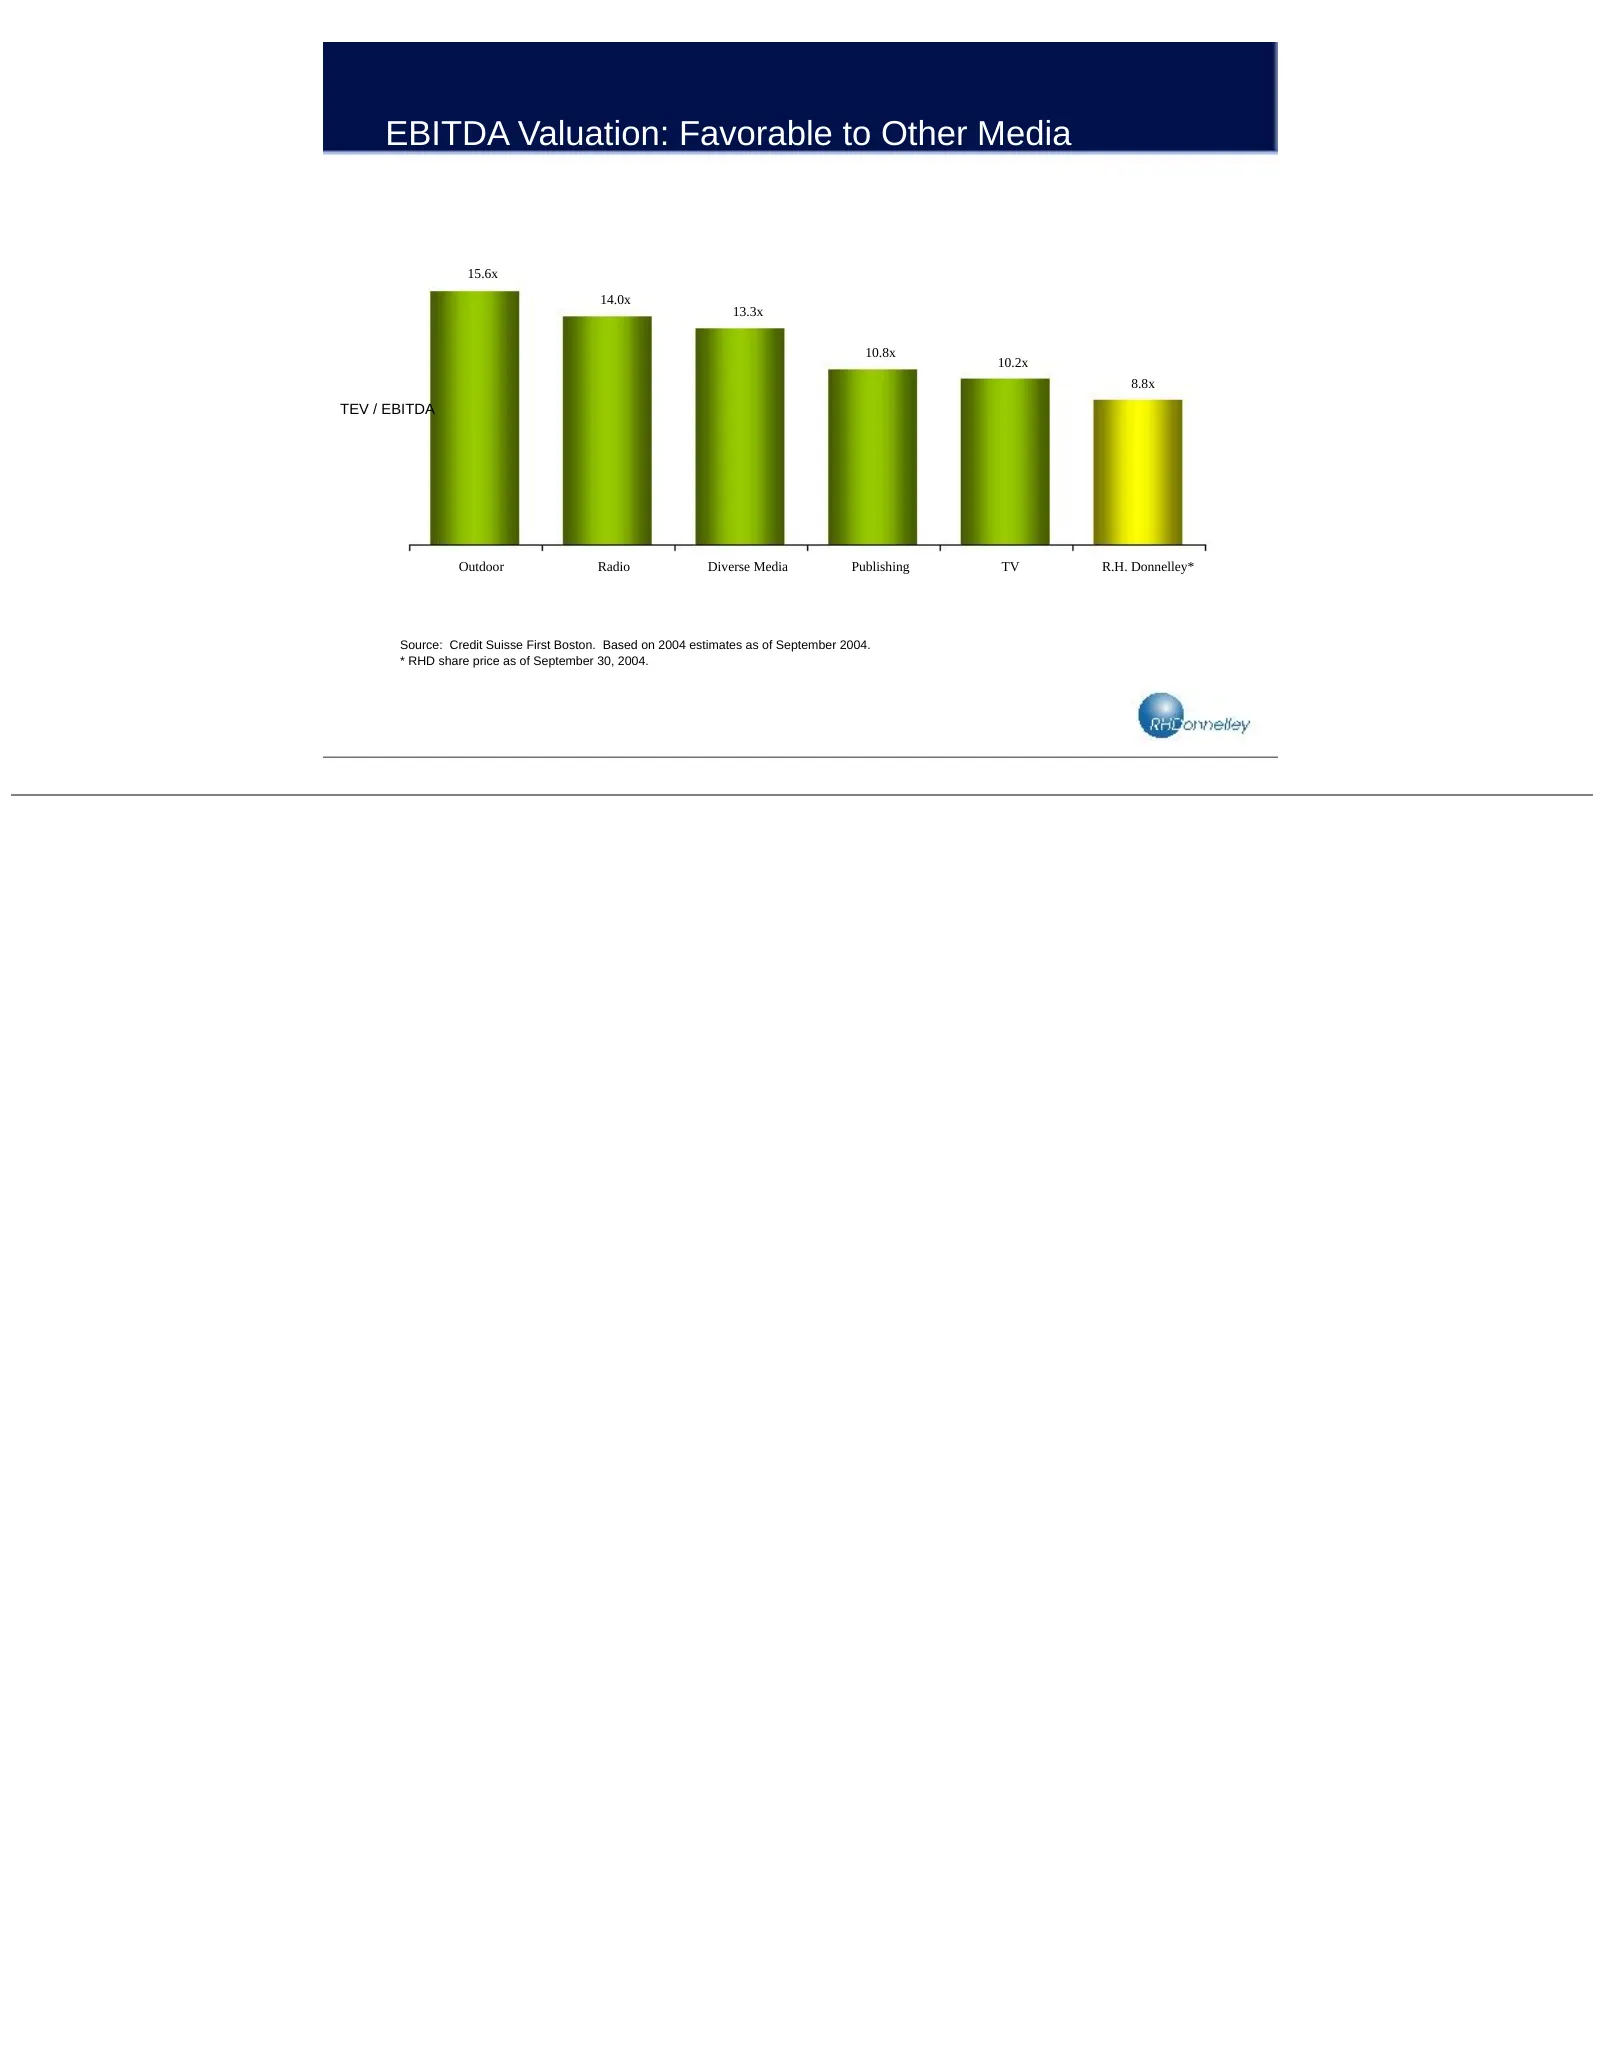
EBITDA Valuation: Favorable to Other Media 15.6x 14.0x 13.3x 10.8x 10.2x 8.8x TEV / EBITDA Outdoor Radio Diverse Media Publishing TV R.H. Donnelley* Source: Credit Suisse First Boston. Based on 2004 estimates as of September 2004. * RHD share price as of September 30, 2004.
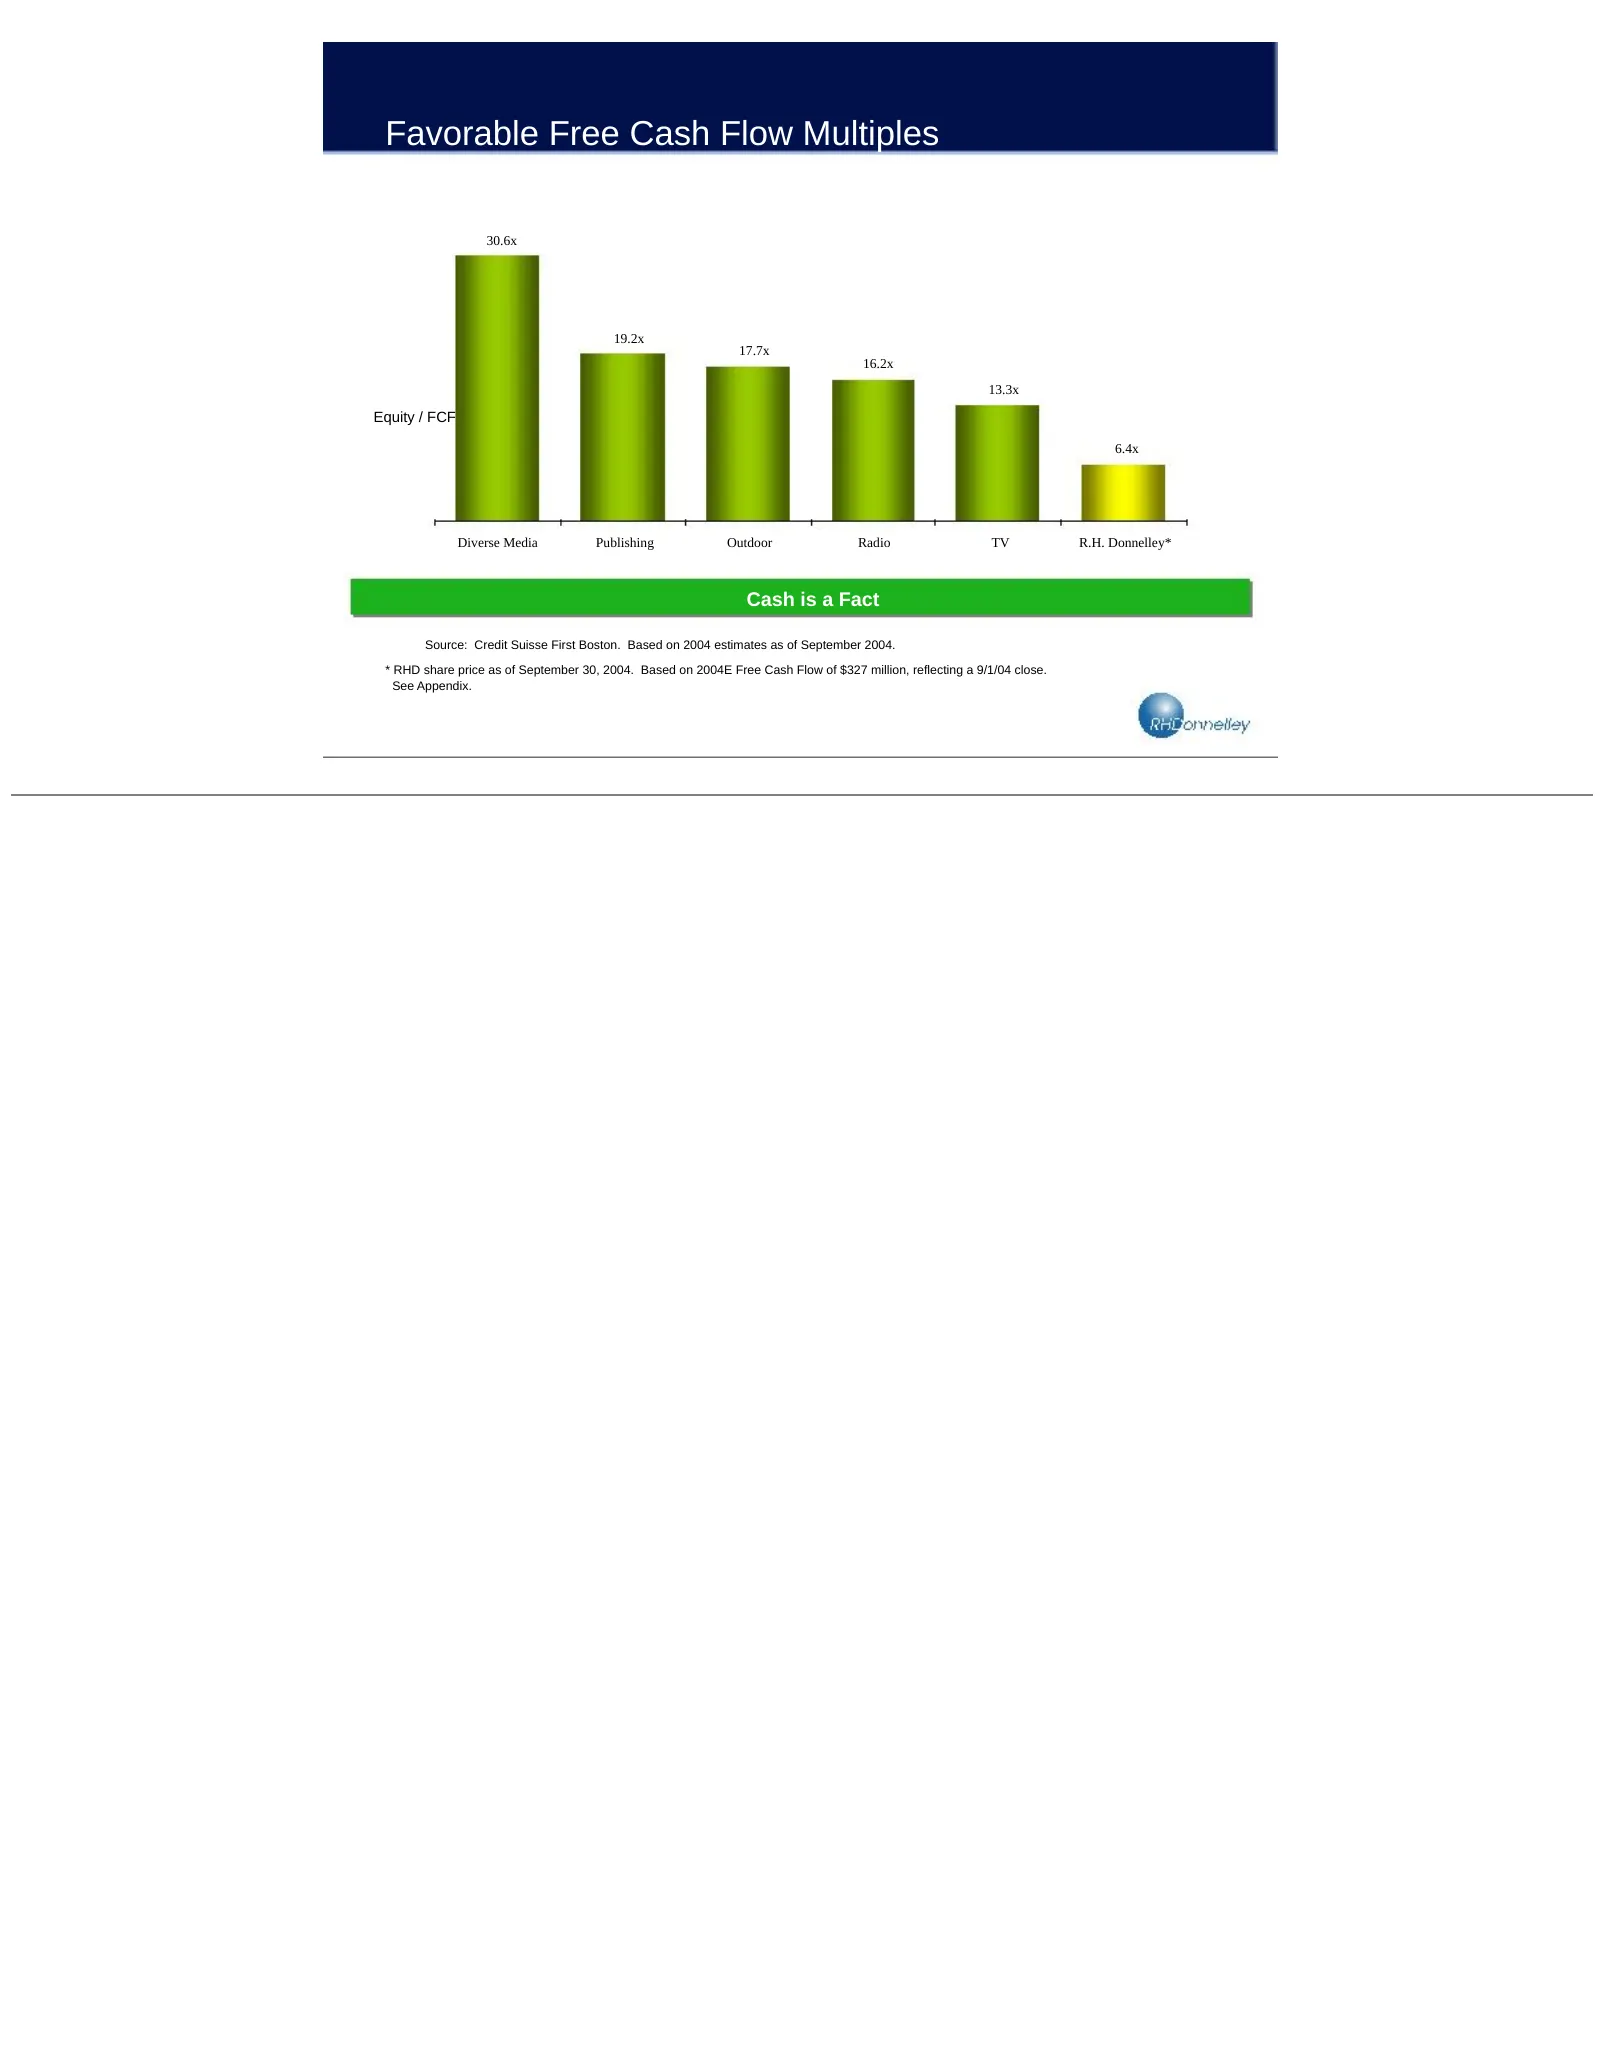
Slide 28: Favorable Free Cash Flow Multiples
Favorable Free Cash Flow Multiples 30.6x 19.2x 17.7x 16.2x 13.3x Equity / FCF 6.4x Diverse Media Publishing Outdoor Radio TV R.H. Donnelley* Cash is a Fact Source: Credit Suisse First Boston. Based on 2004 estimates as of September 2004. * RHD share price as of September 30, 2004. Based on 2004E Fre

Slide 29: Credit Highlights
Credit Highlights Recent strategic acquisition Proven management track record Strong and improving credit profile Strong operating performance Leading incumbent market positions Attractive markets Positive industry fundamentals
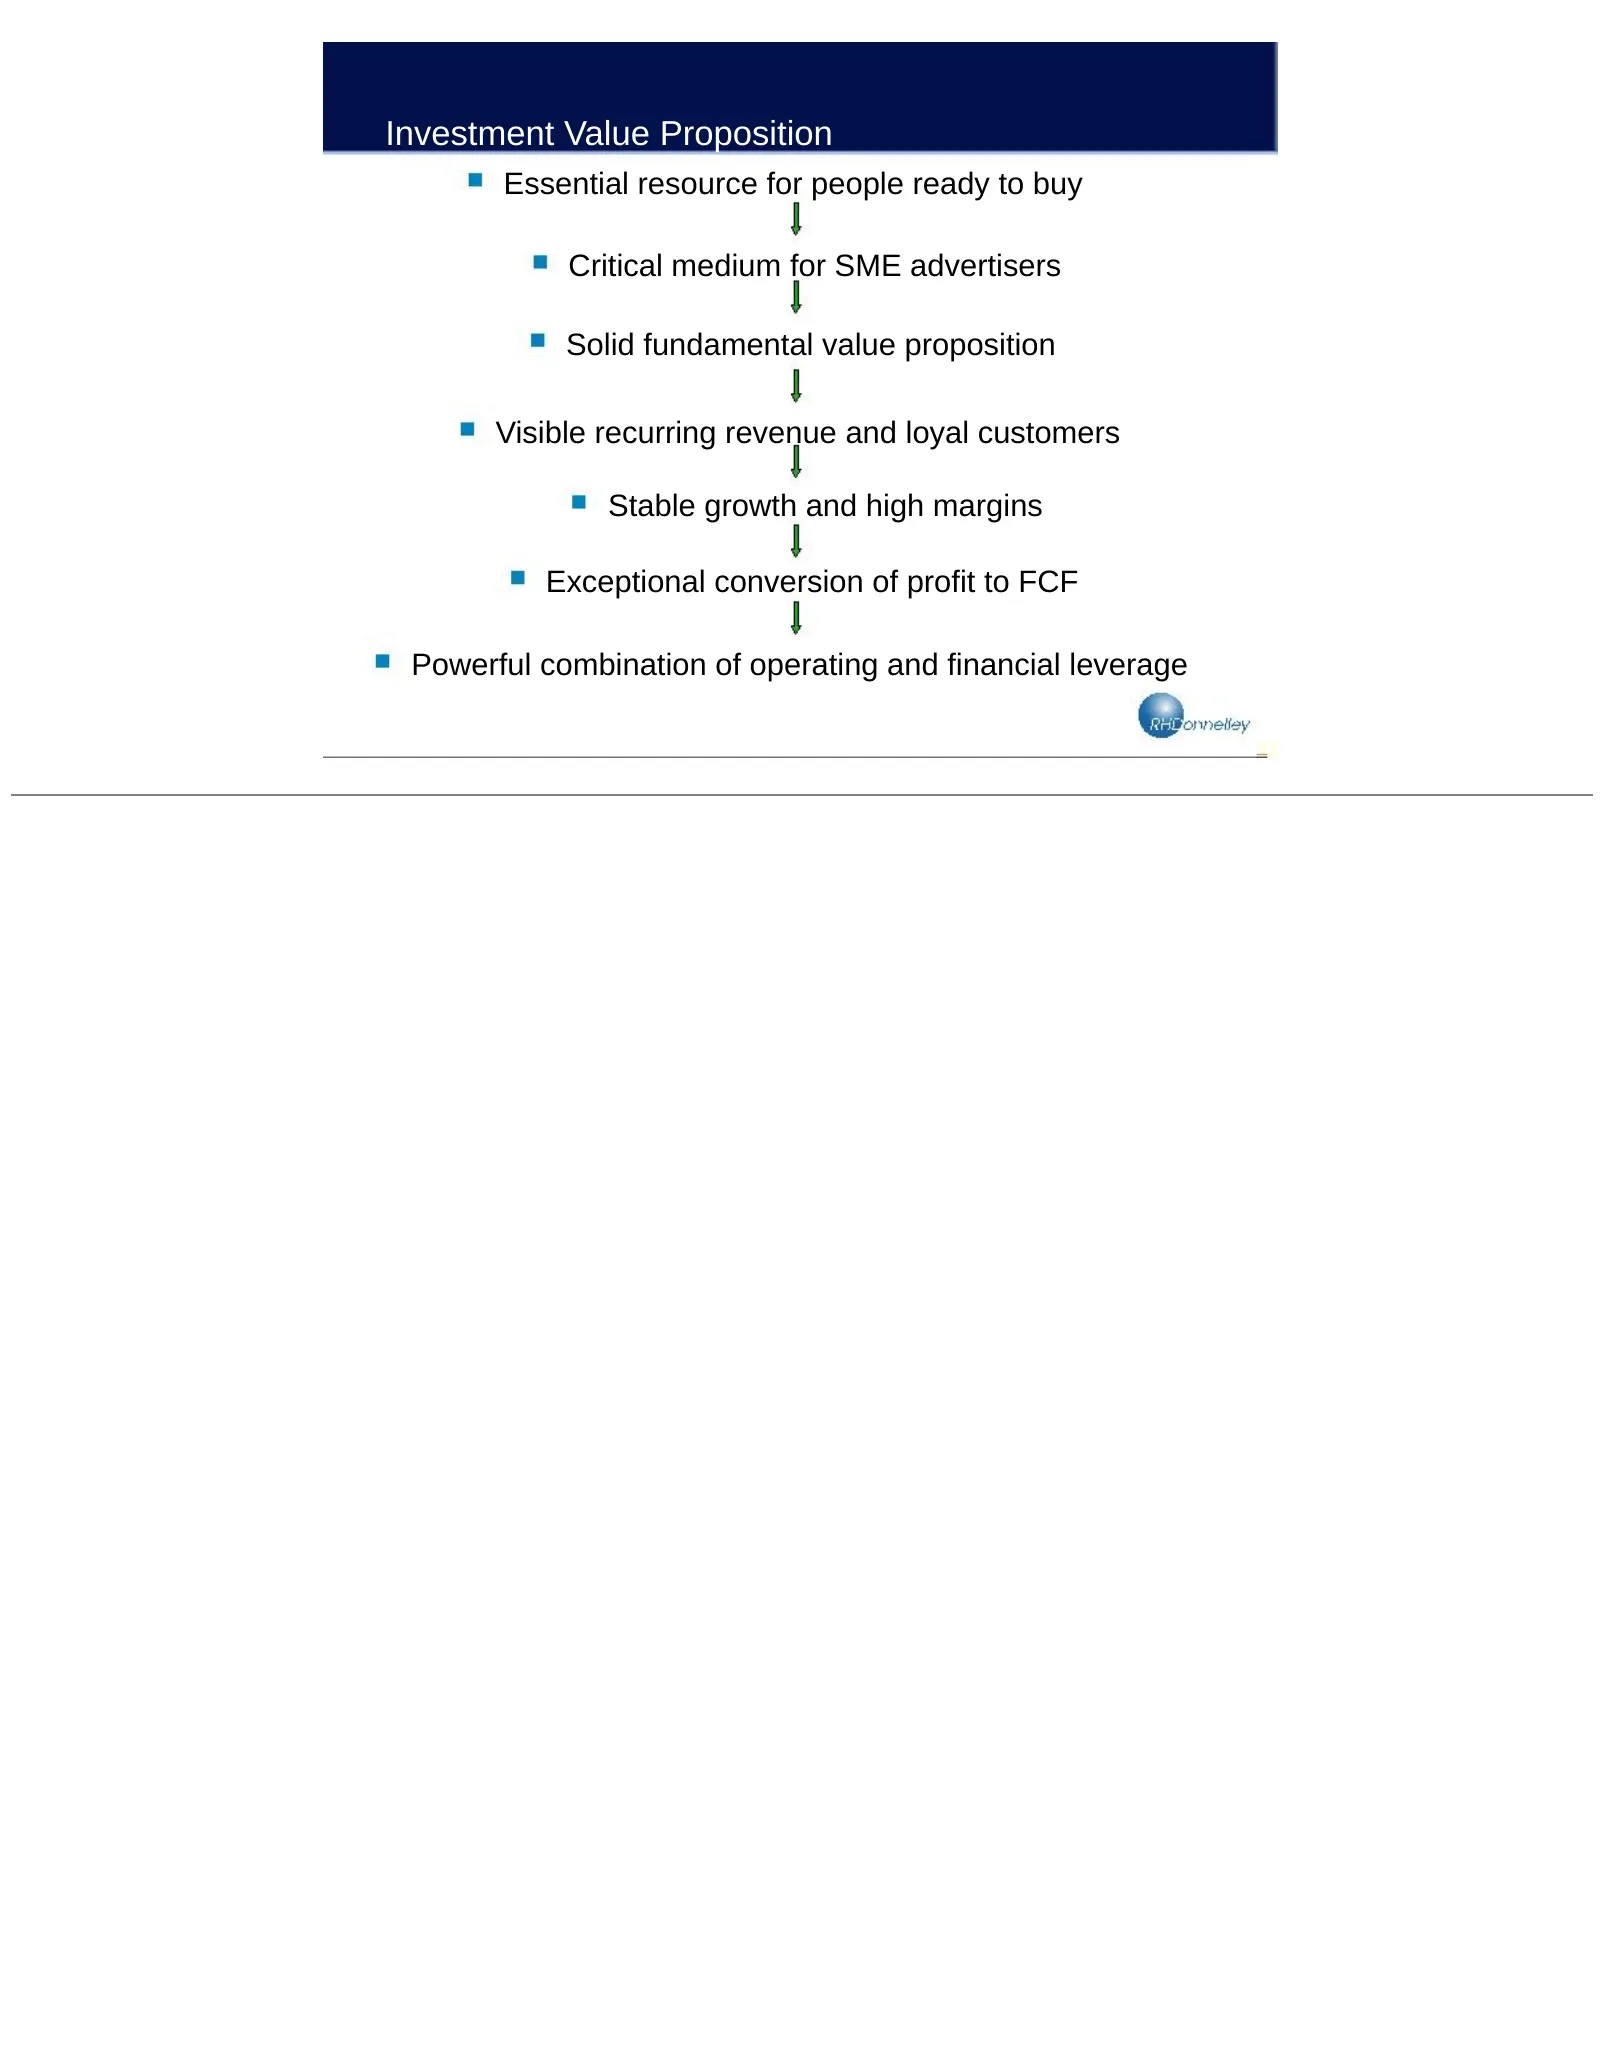
Slide 30: Investment Value Proposition
Investment Value Proposition Essential resource for people ready to buy Critical medium for SME advertisers Solid fundamental value proposition Visible recurring revenue and loyal customers Stable growth and high margins Exceptional conversion of profit to FCF Powerful combination of operating and f

Slide 31: Appendix
Appendix
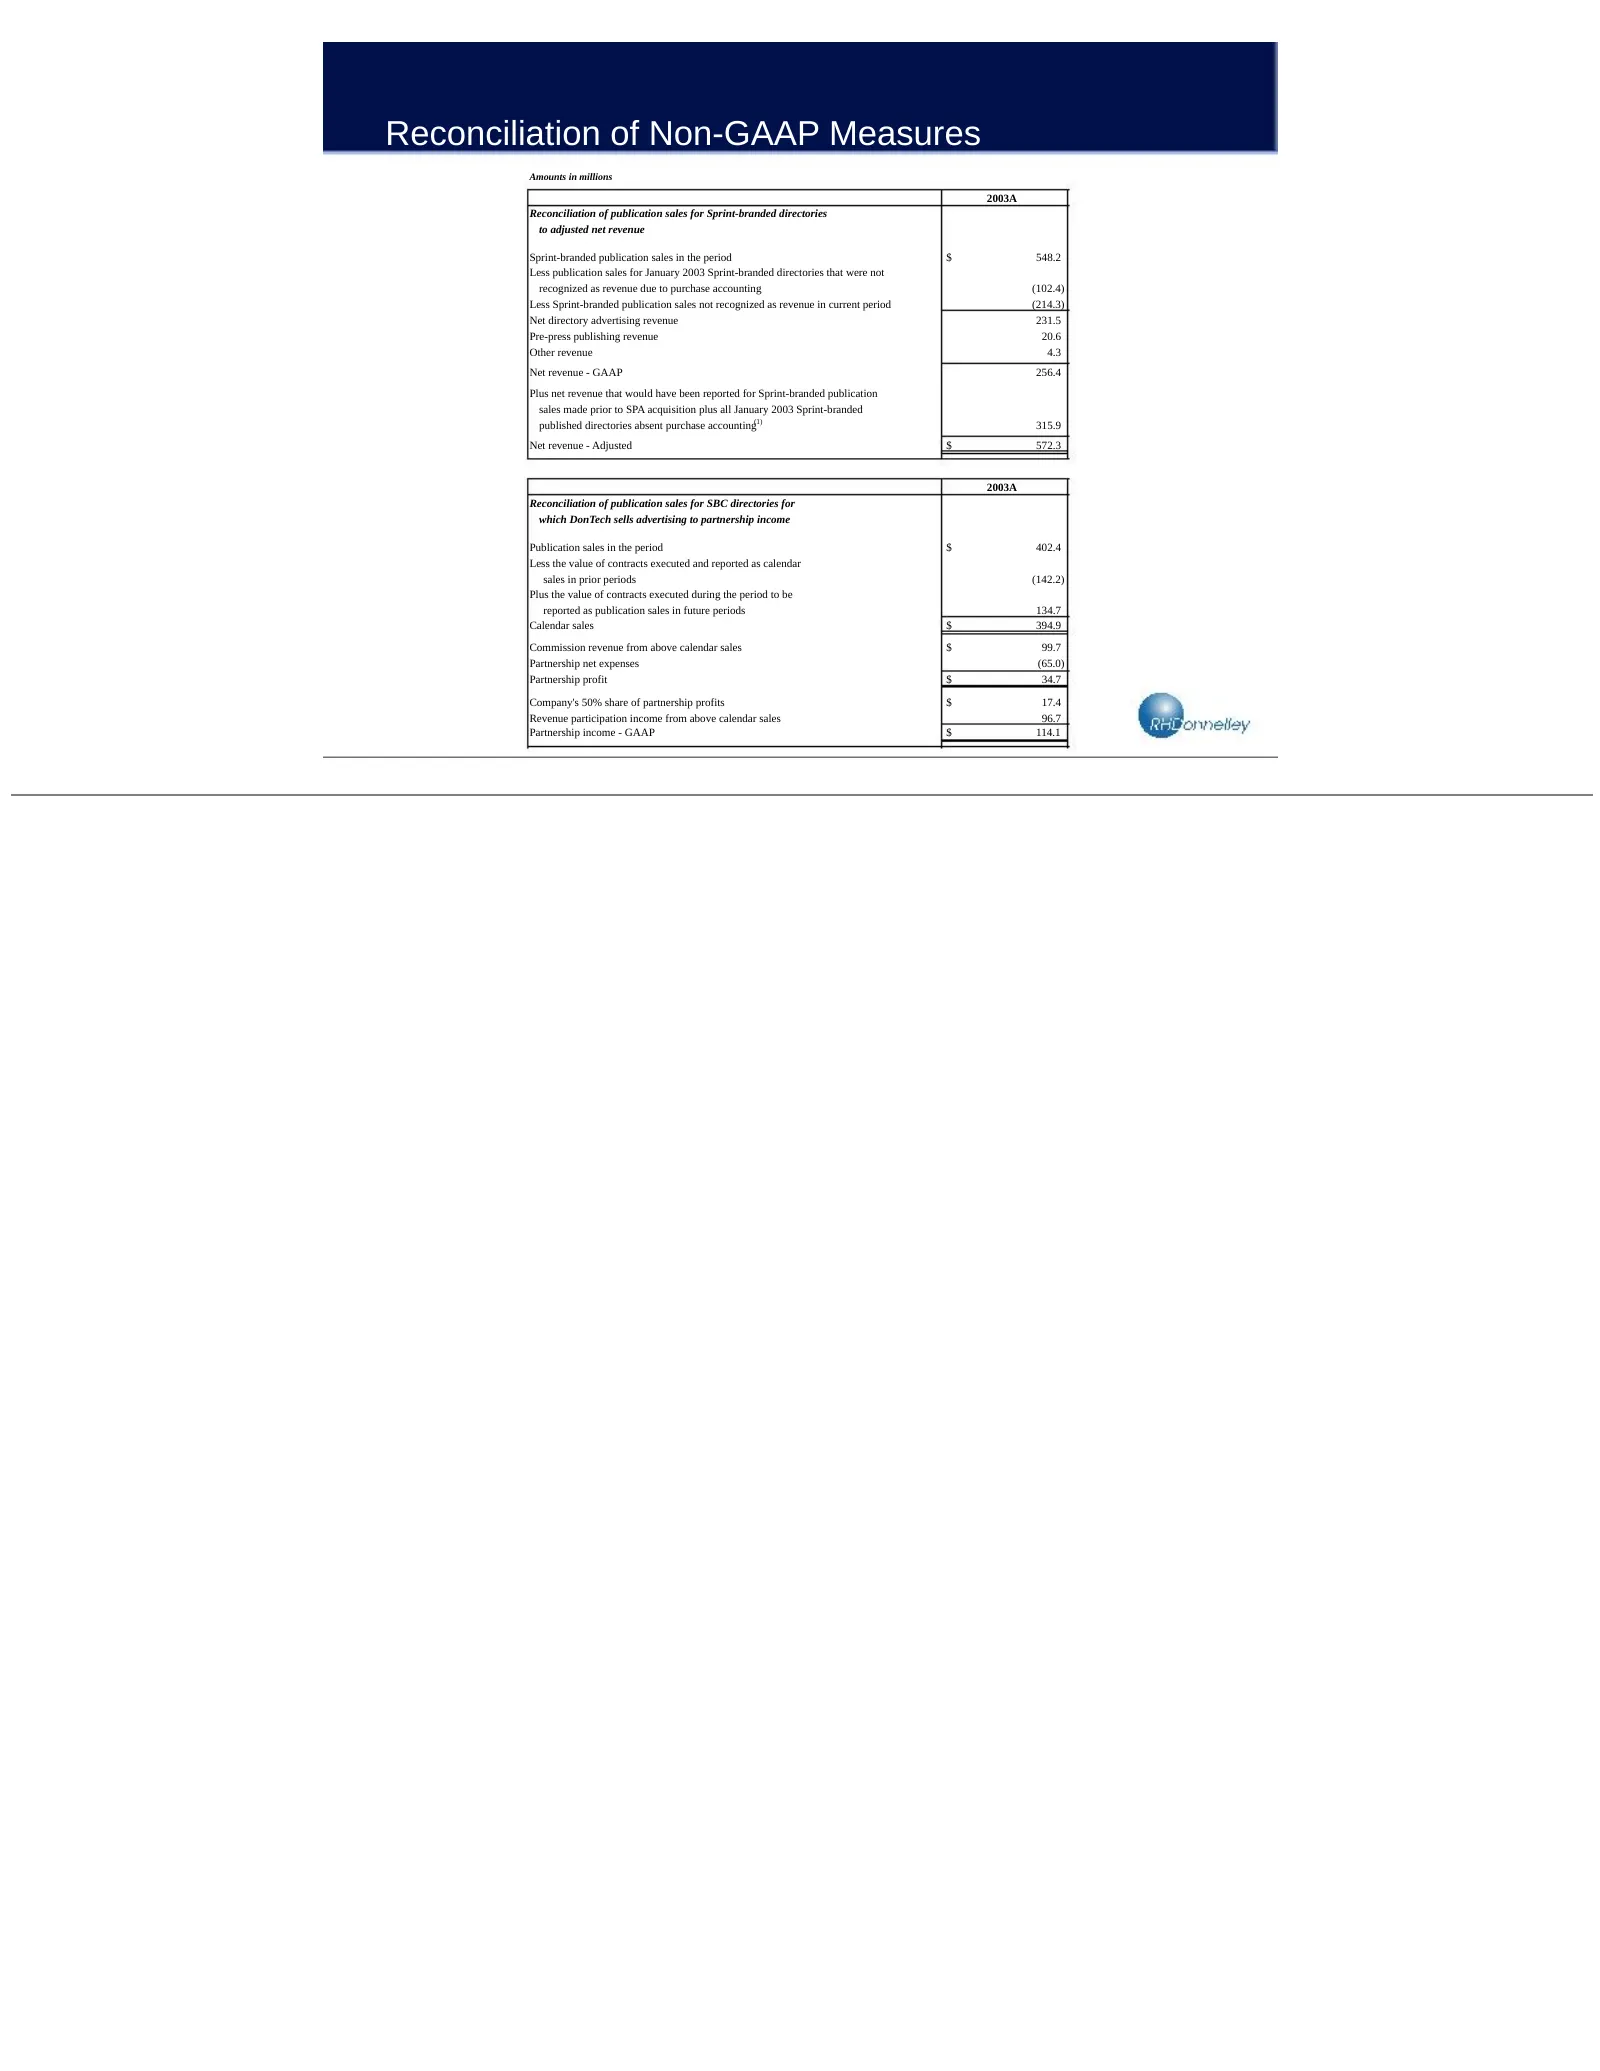
Slide 32: Reconciliation of Non-GAAP Measures
Reconciliation of Non-GAAP Measures Amounts in millions 2003A Reconciliation of publication sales for Sprint-branded directories to adjusted net revenue Sprint-branded publication sales in the period $ 548.2 Less publication sales for January 2003 Sprint-branded directories that were not recognized
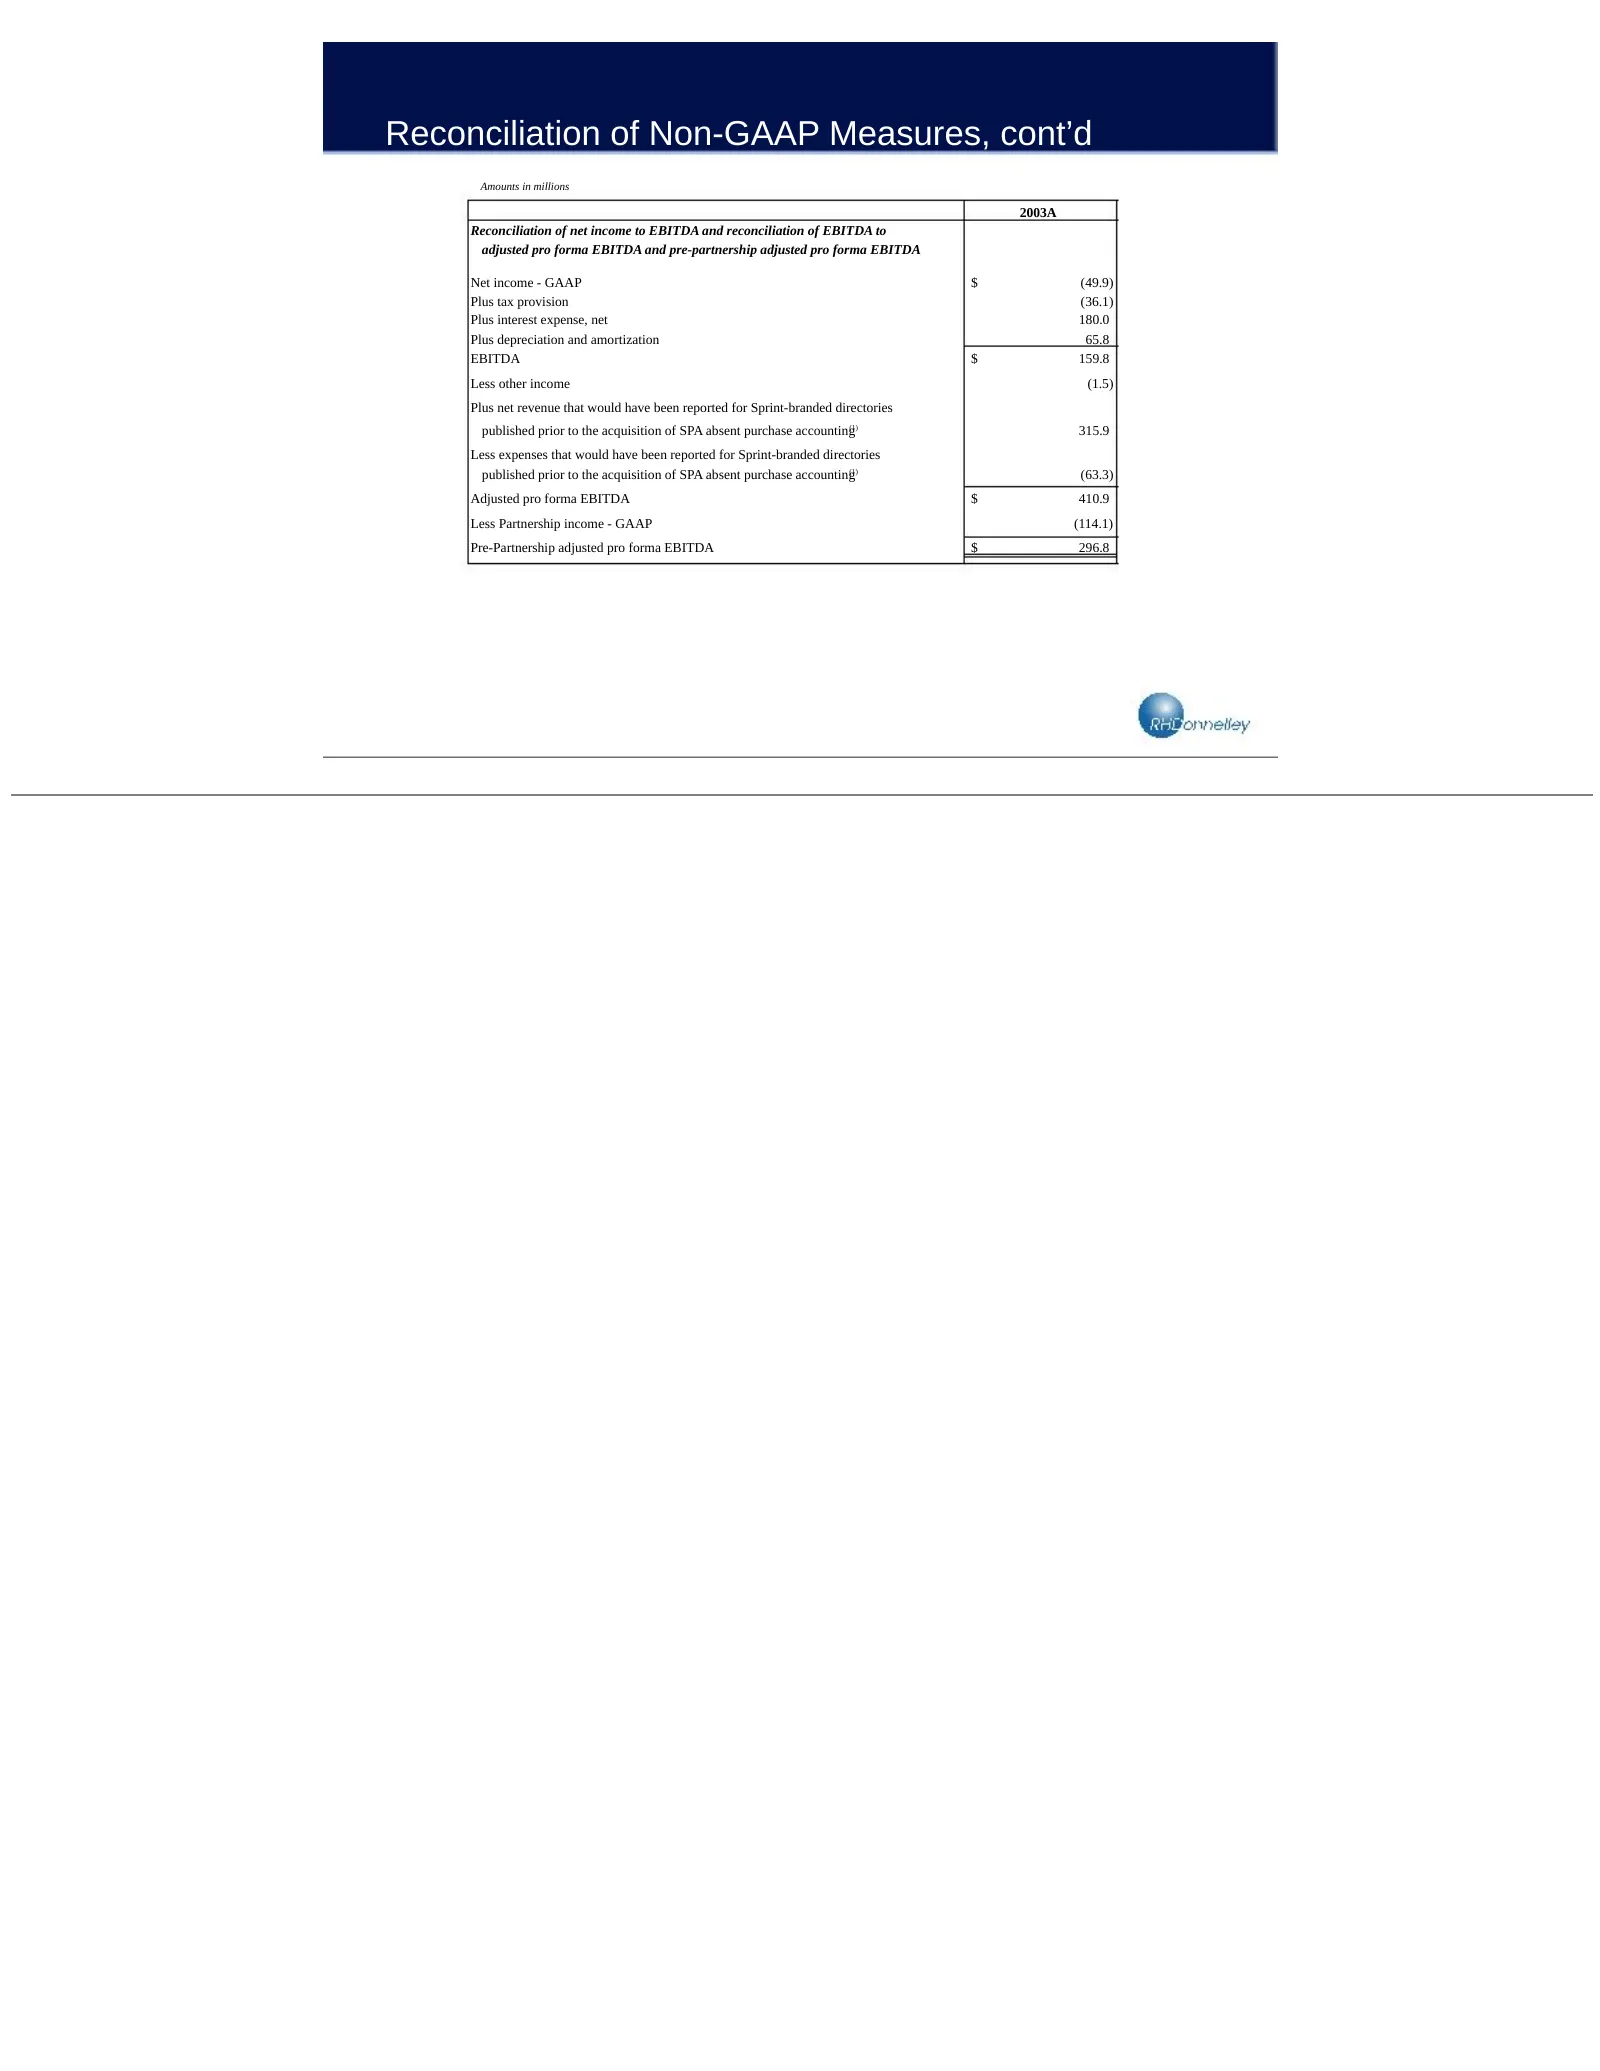
Slide 33: Reconciliation of Non-GAAP Measures, cont'd
Reconciliation of Non-GAAP Measures, cont’d Amounts in millions 2003A Reconciliation of net income to EBITDA and reconciliation of EBITDA to adjusted pro forma EBITDA and pre-partnership adjusted pro forma EBITDA Net income - GAAP $ (49.9) Plus tax provision (36.1) Plus interest expense, net 180.0 P
Slide 34: Reconciliation of Non-GAAP Measures, cont'd
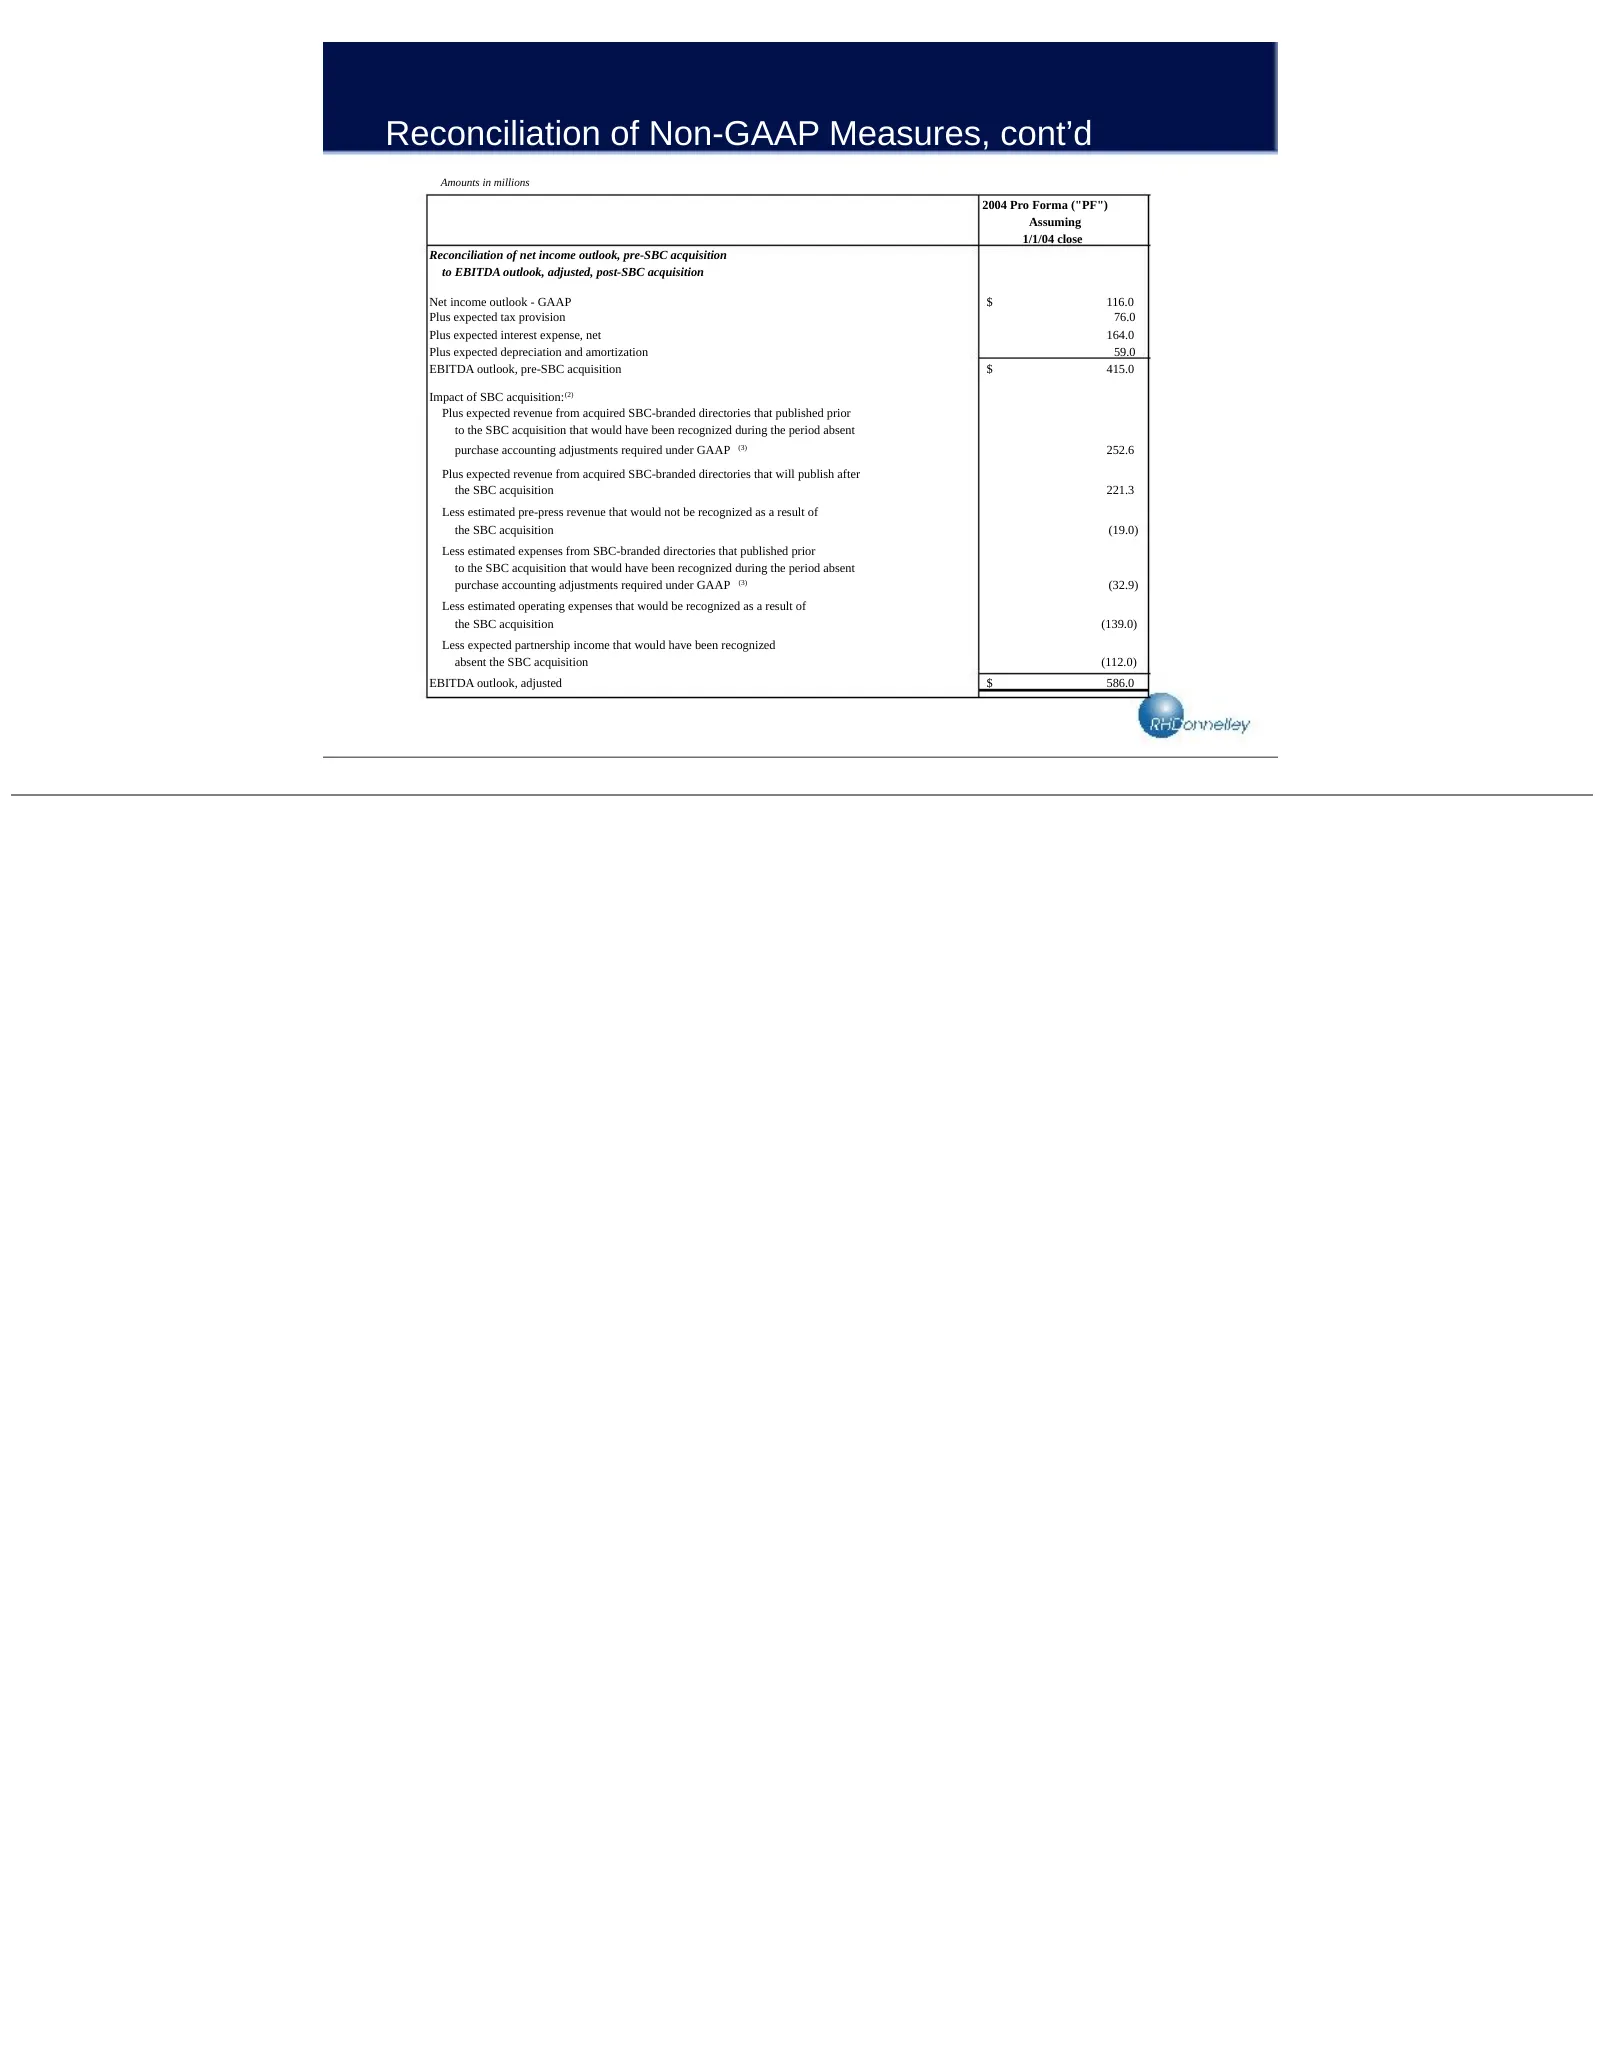
Reconciliation of Non-GAAP Measures, cont’d Amounts in millions 2004 Pro Forma ("PF") Assuming 1/1/04 close Reconciliation of net income outlook, pre-SBC acquisition to EBITDA outlook, adjusted, post-SBC acquisition Net income outlook - GAAP $ 116.0 Plus expected tax provision 76.0 Plus expected int
Slide 35: Reconciliation of Non-GAAP Measures, cont'd
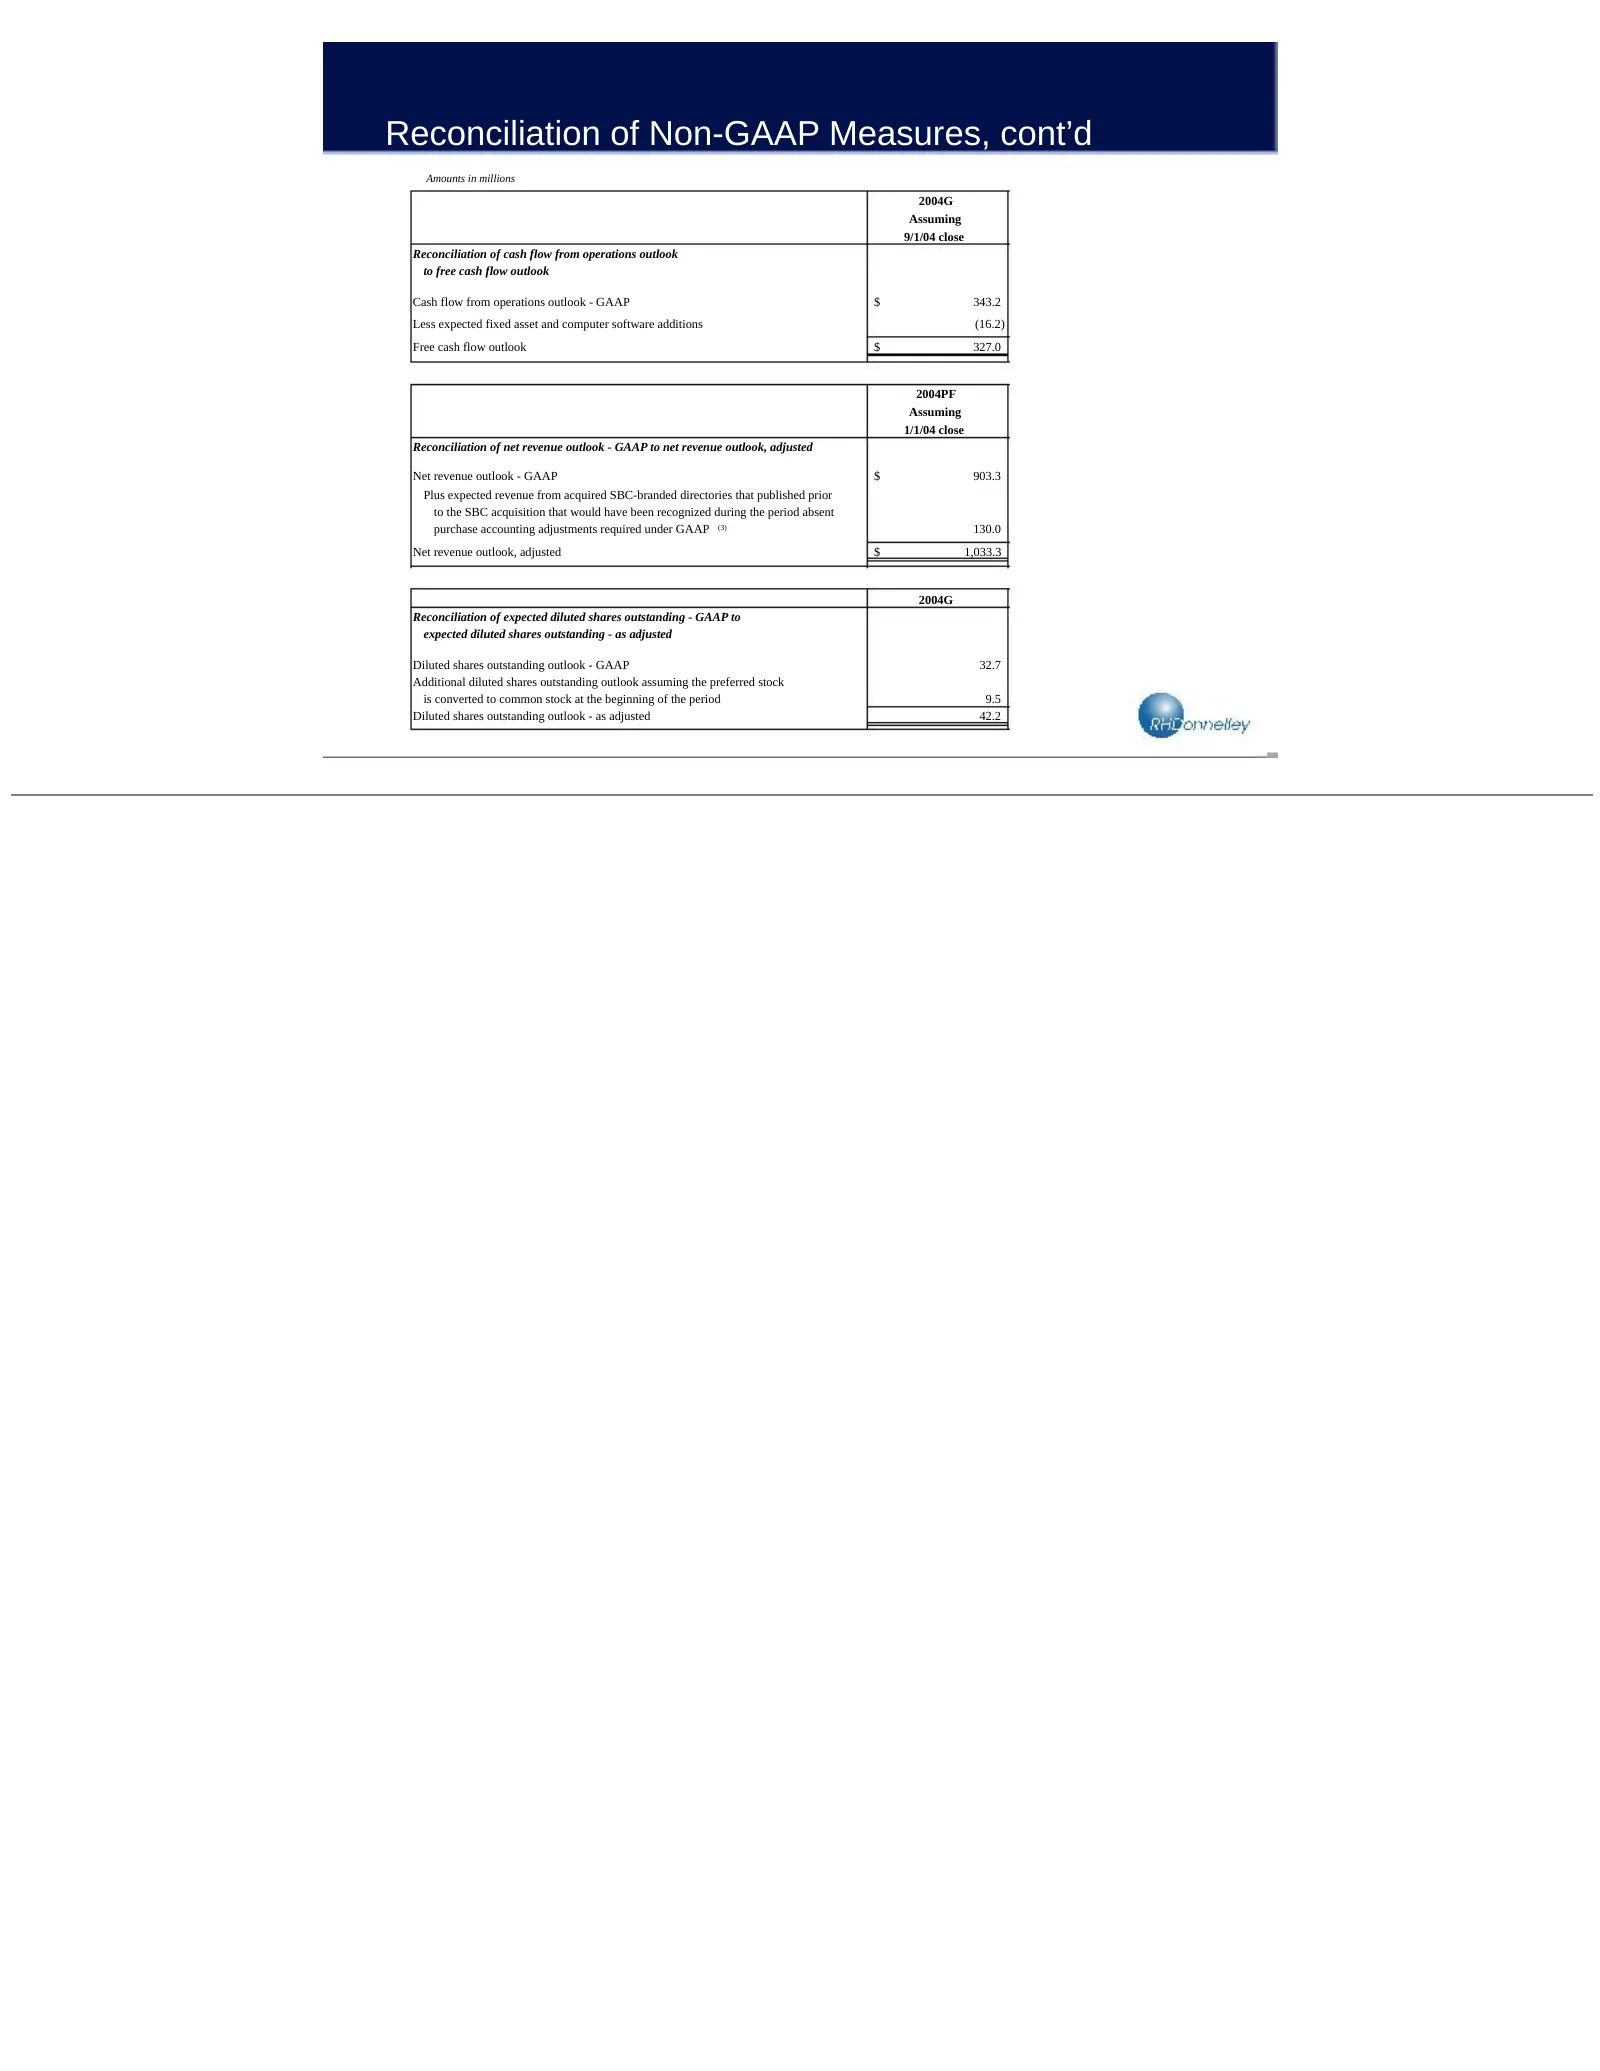
Reconciliation of Non-GAAP Measures, cont’d Amounts in millions 2004G Assuming 9/1/04 close Reconciliation of cash flow from operations outlook to free cash flow outlook Cash flow from operations outlook - GAAP $ 343.2 Less expected fixed asset and computer software additions (16.2) Free cash flow o

Slide 36: Reconciliation of Non-GAAP Measures, cont'd
Reconciliation of Non-GAAP Measures, cont’d Amounts in millions 2004PF Assuming 1/1/04 close Reconciliation of expected pro forma revenue from acquired SBC directories to acquired pro forma EBITDA Expected pro forma revenue from acquired SBC-branded directories $ 473.9 Less estimated pro forma expen

Slide 37: Reconciliation of Non-GAAP Measures, cont'd
Reconciliation of Non-GAAP Measures, cont’d Notes: 1. Represents the revenue and direct costs from Sprint directories published prior to the SPA acquisition that would have been recognized during the period had it not been for purchase accounting adjustments required under GAAP and includes an adjus

Slide 38: Orci
Orci
Source: SEC EDGAR · 8-K filed Oct 6, 2004
More decks from DEX ONE Corp
 Q4 2012 Earnings Presentation17 slides · Mar 18, 2013
 Merger or Acquisition (December 2012)42 slides · Dec 6, 2012
 Merger or Acquisition (September 2012)51 slides · Sep 18, 2012
 Merger or Acquisition (August 2012)15 slides · Aug 21, 2012
 Q2 2012 Earnings Presentation16 slides · Jul 25, 2012
 Q1 2012 Earnings Presentation17 slides · Apr 26, 2012