LL Flooring — Lumber Liquidators Holdings — Goldman Sachs Global Retailing Conference 2014
21 slides from LL Flooring's conference presentation, Sep 5, 2014
Slide 1: Goldman Sachs Global Retailing Conference
LumbenLiquidators Goldman Sachs Global Retailing Conference September 4, 2014
Slide 2: Safe Harbor Statement
2 Safe Harbor Statement The following information contains certain statements that are not historical facts and that constitute “forward - looking statements” within the meaning of the Private Securities Litigation Reform Act of 1995. These forward - looking statements are based on management’s curr
Slide 3: Growth Retailer: Largest Specialty Retailer of Flooring
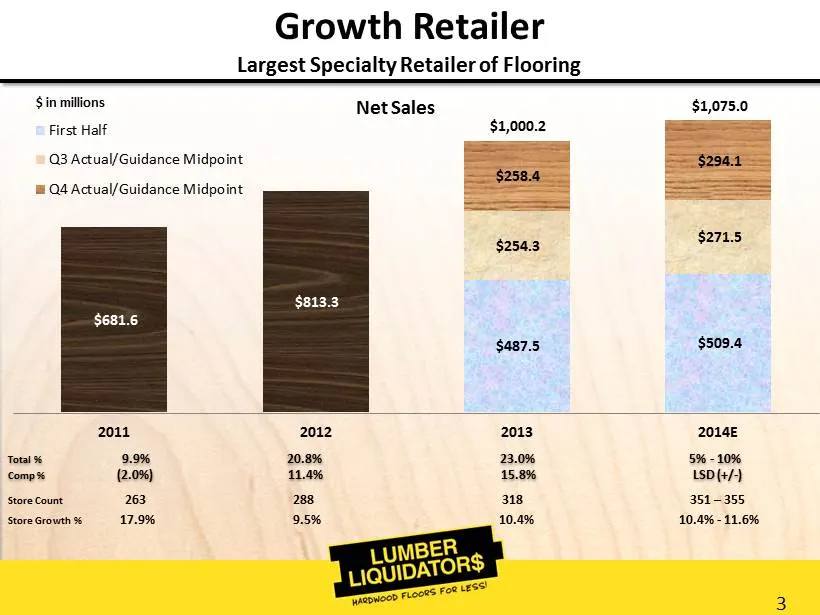
3 Growth Retailer Largest Specialty Retailer of Flooring Total % 9.9 % 20.8 % 23.0% 5% - 10% Comp % ( 2.0%) 11.4 % 15.8% LSD (+/ - ) Store Count 263 288 318 351 – 355 Store Growth % 17.9 % 9.5 % 10.4% 10.4% - 11.6% $487.5 $509.4 $254.3 $271.5 $258.4 $294.1 $681.6 $813.3 $1,000.2 $1,075.0 2011 2012 2
Slide 4: Differentiated Value Proposition
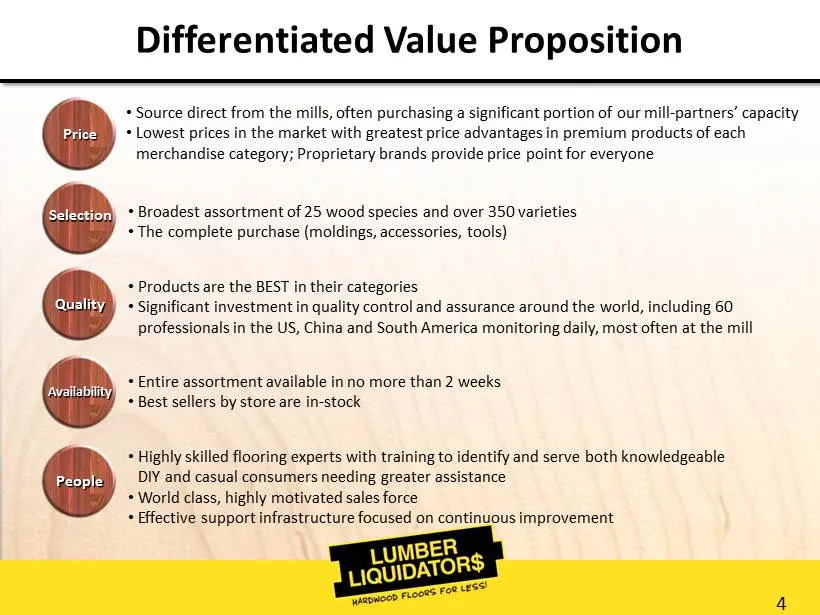
4 Differentiated Value Proposition • Source direct from the mills, often purchasing a significant portion of our mill - partners’ capacity • Lowest prices in the market with greatest price advantages in premium products of each merchandise category; Proprietary brands provide price point for everyon
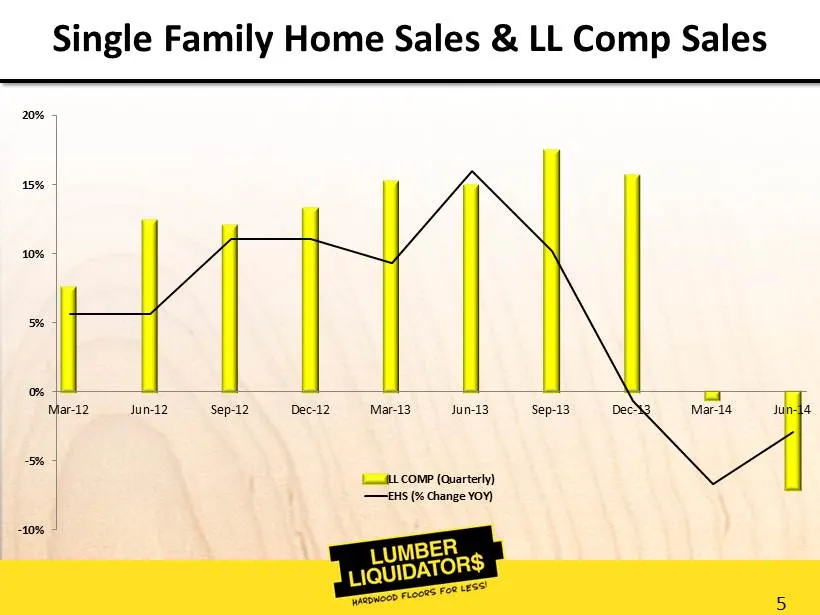
Slide 5: Single Family Home Sales & LL Comp Sales
5 -10% -5% 0% 5% 10% 15% 20% Mar-12 Jun-12 Sep-12 Dec-12 Mar-13 Jun-13 Sep-13 Dec-13 Mar-14 Jun-14 LL COMP (Quarterly) EHS (% Change YOY) Single Family Home Sales & LL Comp Sales
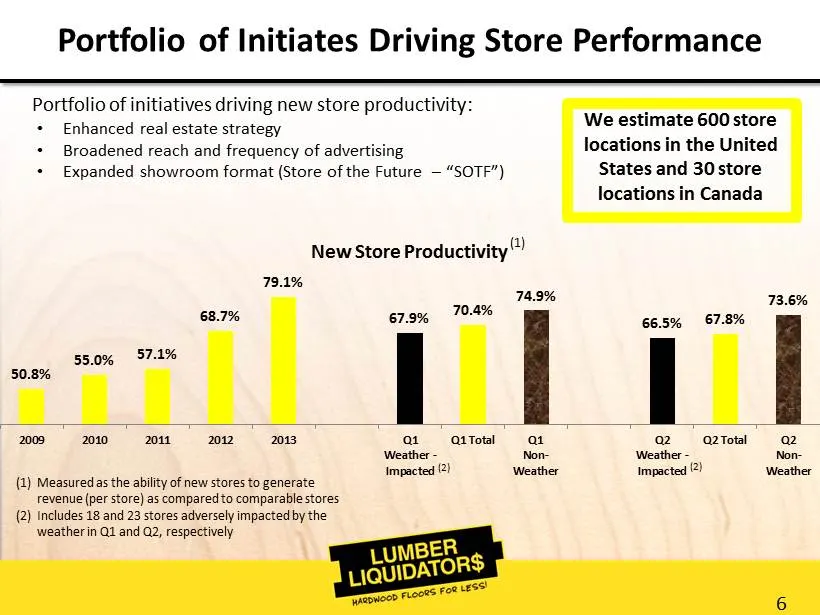
Slide 6: Portfolio of Initiatives Driving Store Performance
6 Portfolio of Initiates Driving Store Performance Portfolio of initiatives driving new store productivity: • Enhanced real estate strategy • Broadened reach and frequency of advertising • Expanded showroom format (Store of the Future – “SOTF”) 50.8% 55.0% 57.1% 68.7% 79.1% 67.9% 70.4% 74.9% 66.5% 6
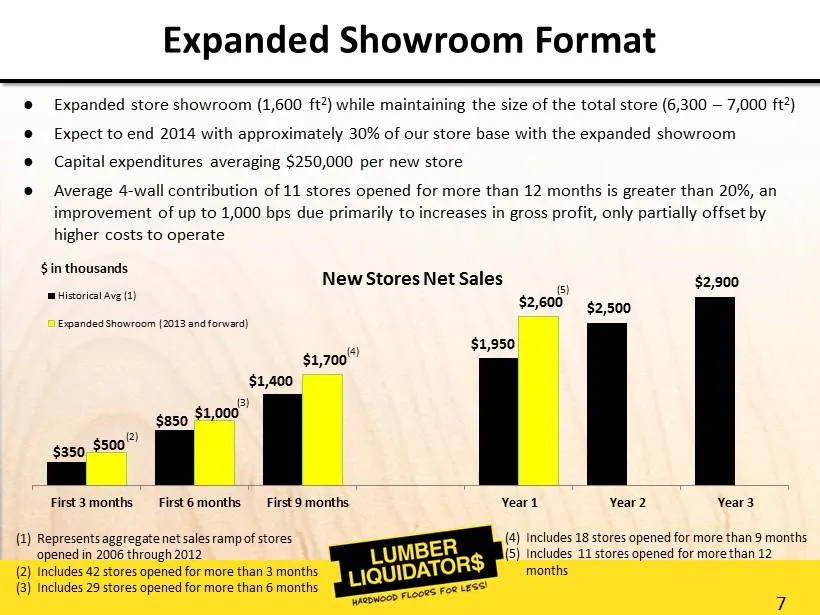
Slide 7: Expanded Showroom Format
7 $350 $850 $1,400 $1,950 $2,500 $2,900 $500 $1,000 $1,700 $2,600 First 3 months First 6 months First 9 months Year 1 Year 2 Year 3 New Stores Net Sales Historical Avg (1) Expanded Showroom (2013 and forward) (2) ( 3 ) ( 4 ) Expanded Showroom Format ● Expanded store showroom (1,600 ft 2 ) while main
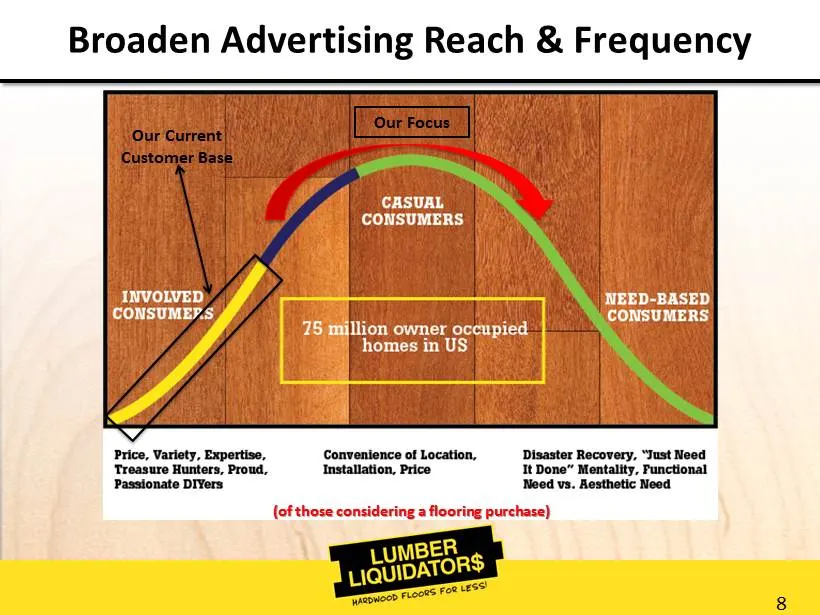
Slide 8: Our Current Customer Base / Our Focus
8 Our Current Customer Base Our Focus Broaden Advertising Reach & Frequency (of those considering a flooring purchase)
Slide 9: Advertising Spend
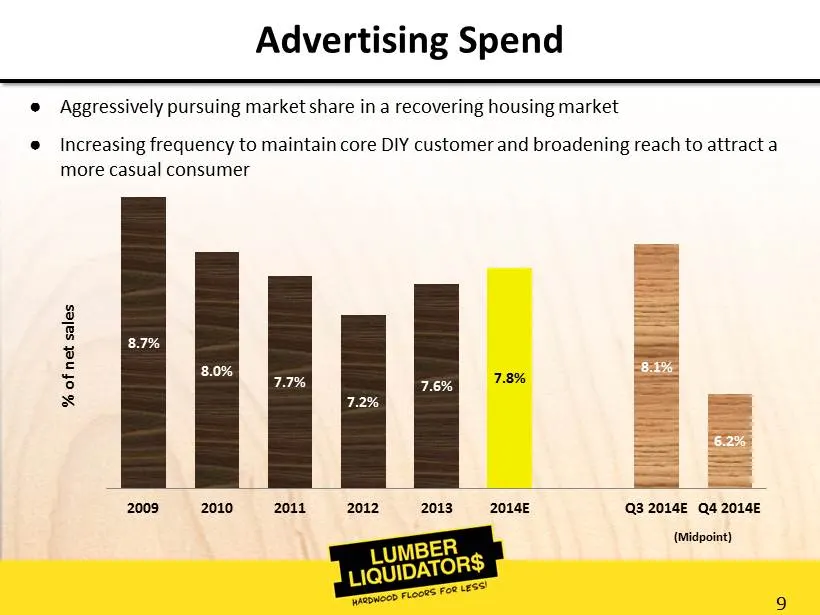
9 8.7% 8.0% 7.7% 7.2% 7.6% 7.8% 8.1% 6.2% 2009 2010 2011 2012 2013 2014E Q3 2014E Q4 2014E Advertising Spend ● Aggressively pursuing market share in a recovering housing market ● Increasing frequency to maintain core DIY customer and broadening reach to attract a more casual consumer % of net sales
Slide 10: Bellawood Re-launch
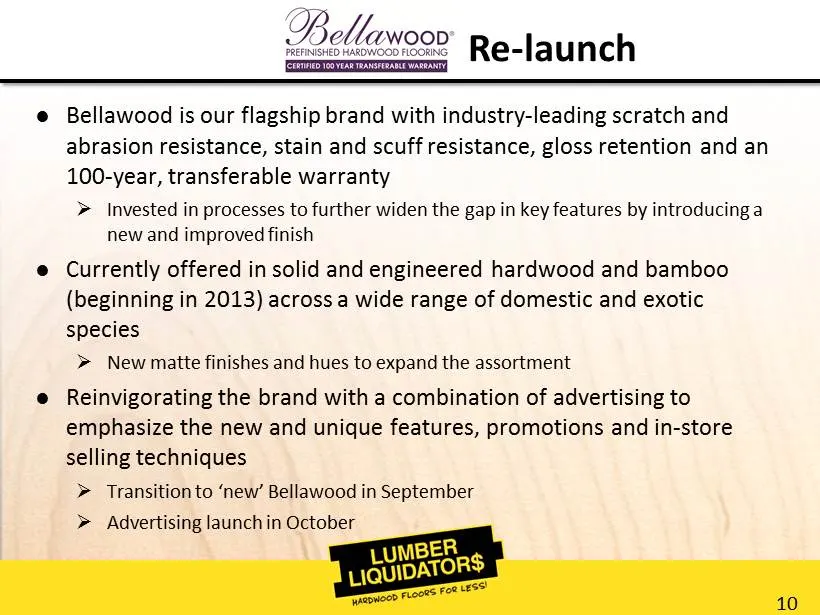
10 ● Bellawood is our flagship brand with industry - leading scratch and abrasion resistance, stain and scuff resistance, gloss retention and an 100 - year, transferable warranty » Invested in processes to further widen the gap in key features by introducing a new and improved finish ● Currently off
Slide 11: Portfolio of Gross Margin Drivers
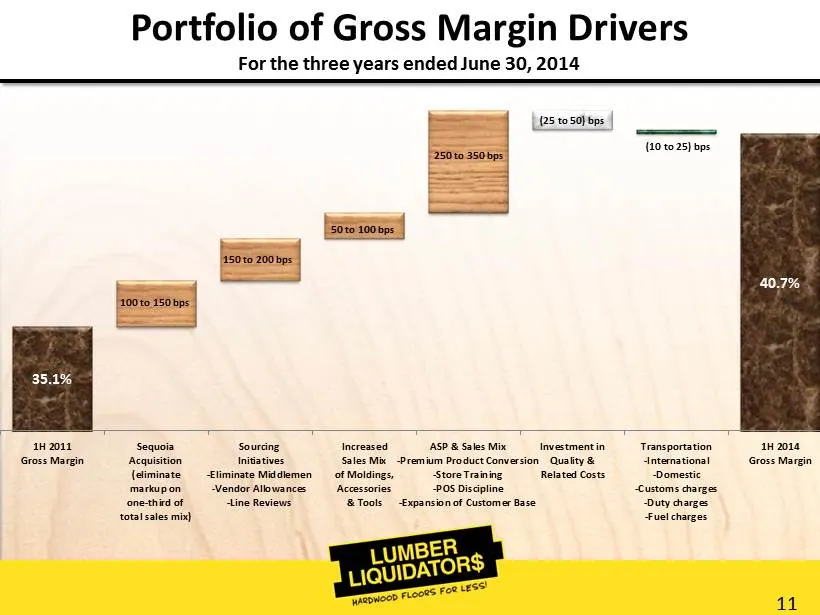
11 Portfolio of Gross Margin Drivers For the three years ended June 30, 2014 35.1% 40.7% 1H 2011 Gross Margin Sequoia Acquisition (eliminate markup on one-third of total sales mix) Sourcing Initiatives -Eliminate Middlemen -Vendor Allowances -Line Reviews Increased Sales Mix of Moldings, Accessories
Slide 12: Gross Margin Bridge 1H 2014 to 2H 2014
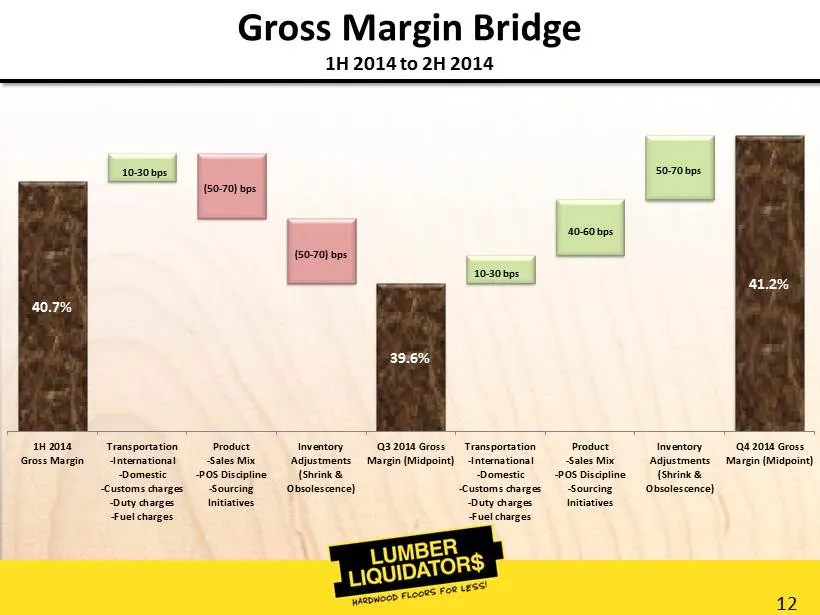
12 Gross Margin Bridge 1H 2014 to 2H 2014 40.7% 39.6% 41.2% 1H 2014 Gross Margin Transportation -International -Domestic -Customs charges -Duty charges -Fuel charges Product -Sales Mix -POS Discipline -Sourcing Initiatives Inventory Adjustments (Shrink & Obsolescence) Q3 2014 Gross Margin (Midpoint)
Slide 13: Constrained Inventory
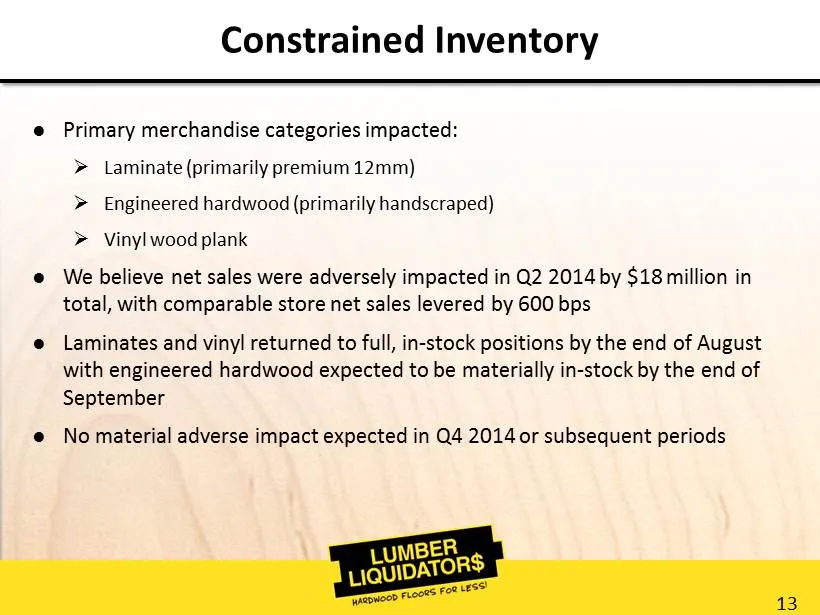
13 C onstrained Inventory ● Primary merchandise categories impacted: » Laminate (primarily premium 12mm) » Engineered hardwood (primarily handscraped ) » Vinyl wood plank ● We believe net sales were adversely impacted in Q2 2014 by $18 million in total, with comparable store net sales levered by 600
Slide 14: Sales Mix 2008 vs. 2013
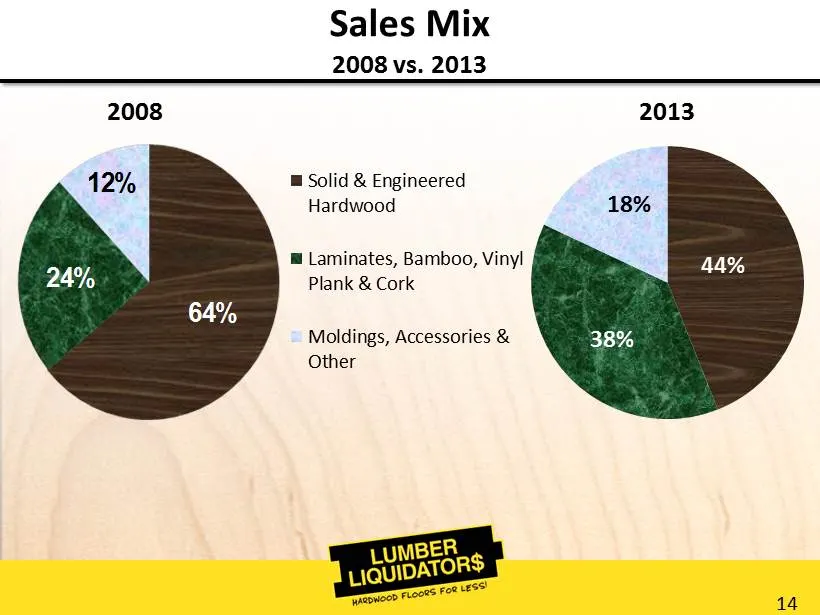
14 Sales Mix 2008 vs. 2013 64% 24% 12% 44% 38% 18% Solid & Engineered Hardwood Laminates, Bamboo, Vinyl Plank & Cork Moldings, Accessories & Other 2008 2013
Slide 15: Sourcing Mix 2008 vs. 2013
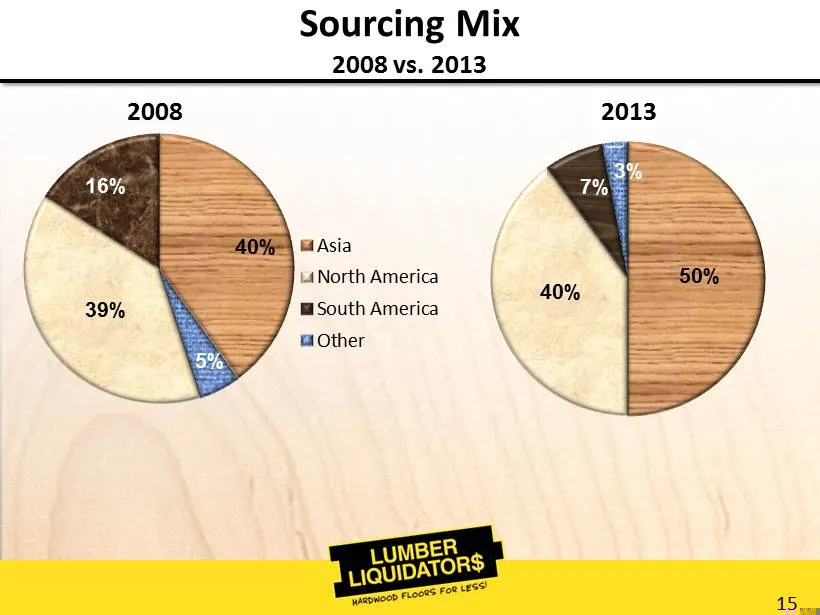
15 Sourcing Mix 2008 vs. 2013 40% 5% 39% 16% 50% 40% 7% 3% Asia North America South America Other 2008 2013
Slide 16: Operating Margin Expansion
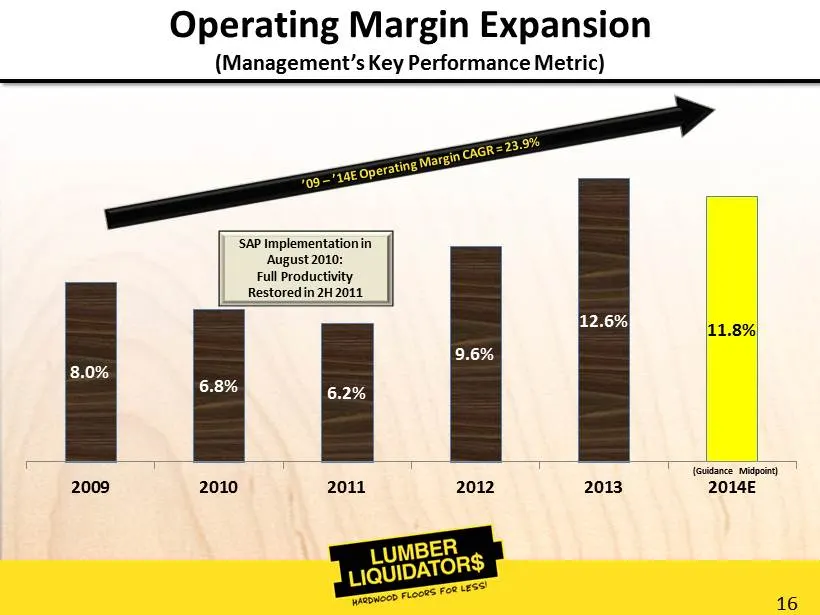
16 8.0% 6.8% 6.2% 9.6% 12.6% 11.8% 2009 2010 2011 2012 2013 2014E Operating Margin Expansion (Management’s Key Performance Metric) SAP Implementation in August 2010: Full Productivity Restored in 2H 2011 (Guidance Midpoint)
Slide 17: Cash Flow & Liquidity
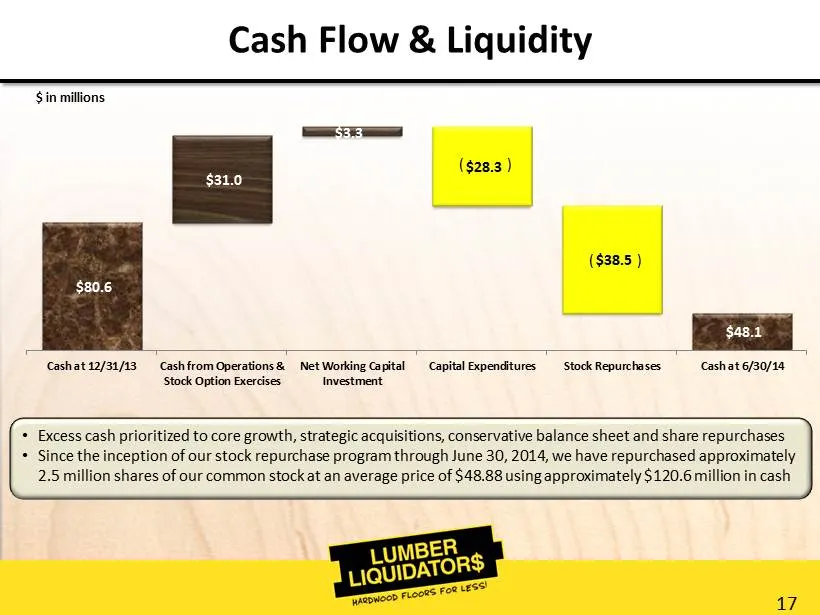
17 Cash Flow & Liquidity • Excess cash prioritized to core growth, strategic acquisitions, conservative balance sheet and share repurchases • Since the inception of our stock repurchase program through June 30, 2014, we have repurchased approximately 2.5 million shares of our common stock at an aver
Slide 18: Capital Expenditures
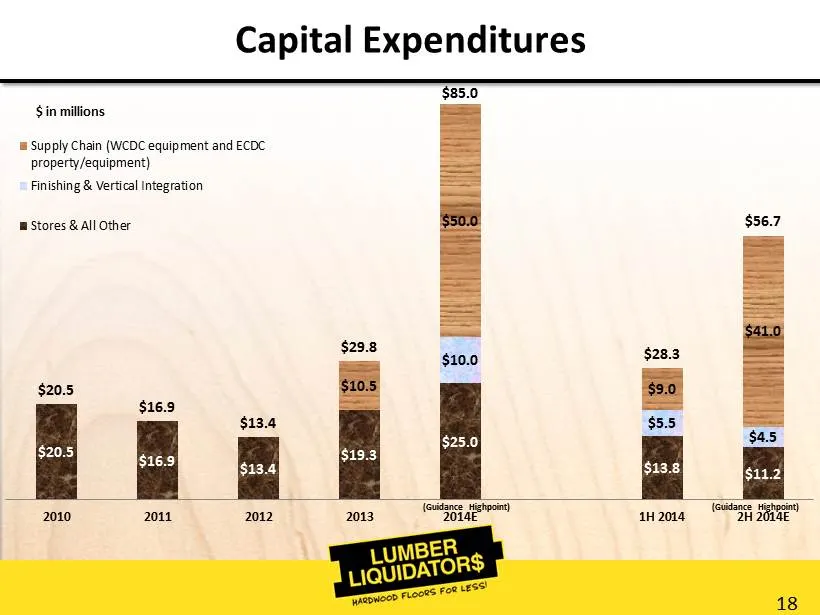
18 Capital Expenditures $ in millions $20.5 $16.9 $13.4 $19.3 $25.0 $13.8 $11.2 $10.0 $5.5 $4.5 $10.5 $50.0 $9.0 $41.0 $20.5 $16.9 $13.4 $29.8 $85.0 $28.3 $56.7 2010 2011 2012 2013 2014E 1H 2014 2H 2014E Supply Chain (WCDC equipment and ECDC property/equipment) Finishing & Vertical Integration Store
Slide 19: 2014 Guidance
2014 Guidance ee:
Slide 20: 2014 Full Year Guidance
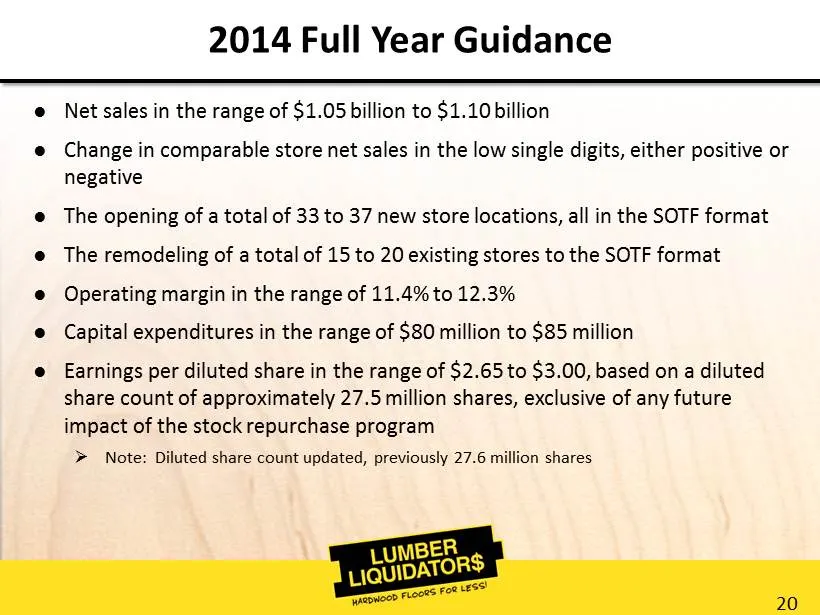
20 2014 Full Year Guidance ● Net sales in the range of $ 1.05 billion to $ 1.10 billion ● Change in comparable store net sales in the low single digits, either positive or negative ● The opening of a total of 33 to 37 new store locations, all in the SOTF format ● The remodeling of a total of 15 to 2
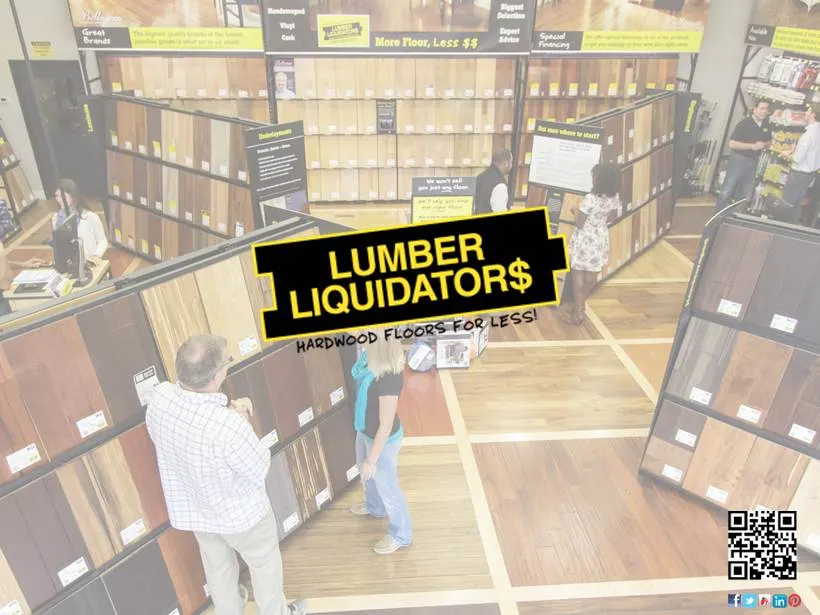
Slide 21: FE He,
FE He,
Source: SEC EDGAR · 8-K filed Sep 5, 2014
More decks from LL Flooring Holdings Inc
 Proxy Contest (June 2024)37 slides · Jun 17, 2024
 Proxy Contest (June 2024)56 slides · Jun 13, 2024
 Investor Presentation (December 2022)27 slides · Dec 13, 2022
 Investor Presentation (November 2022)26 slides · Nov 29, 2022
 Investor Presentation (June 2022)9 slides · Jun 7, 2022
 Investor Presentation (May 2022)33 slides · May 4, 2022