Alliance Bankshares — Q1 2009 Earnings Presentation
13 slides from Alliance Bankshares's earnings presentation, May 8, 2009
Slide 1: Summary Financial Trends
Summary Financial Trends The following charts present trend information on key Alliance Bankshares balance sheet items, credit quality and net interest margin. The trend period starts with March 2007 and reflects quarterly positions through March 2009.
Slide 2: Total Assets
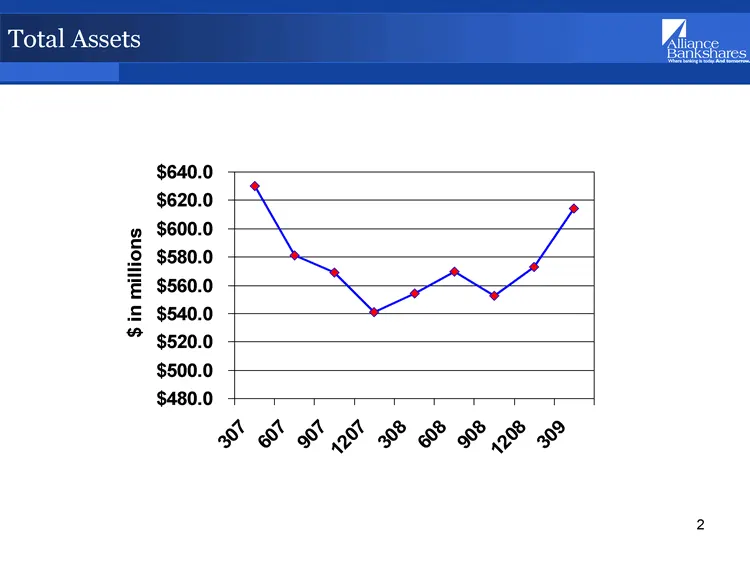
Total Assets 307 607 907 1207 308 608 908 1208 309 629.9 581.1 569 541.3 554.4 569.6 552.8 572.8 614.2
Slide 3: Total Loans
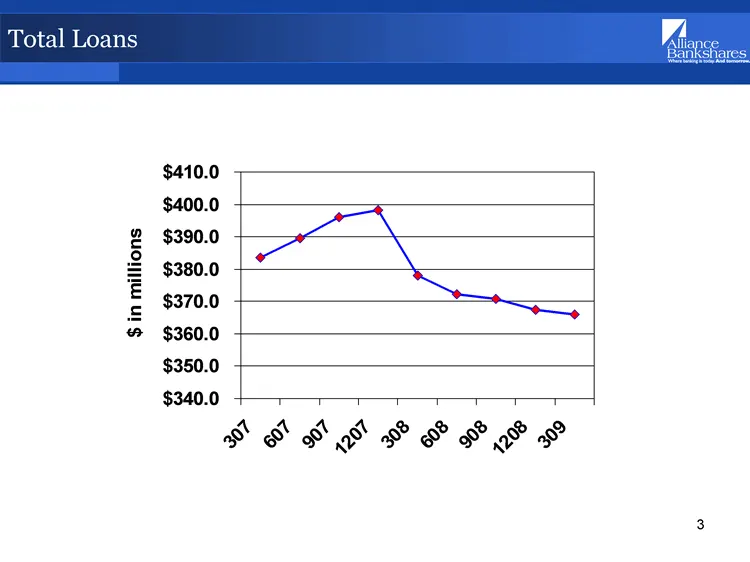
Total Loans 307 607 907 1207 308 608 908 1208 309 383.5 389.6 396 398.2 378.1 372.2 370.8 367.4 365.95
Slide 4: Trading Assets
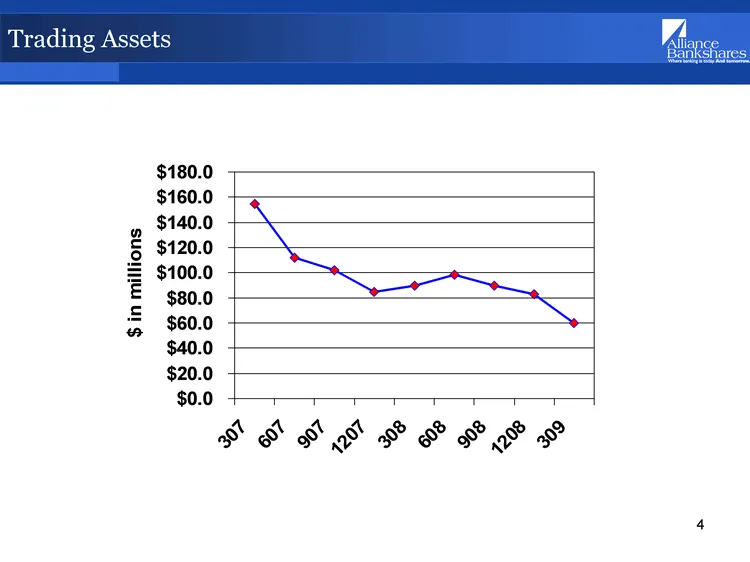
Trading Assets 307 607 907 1207 308 608 908 1208 309 154.6 112 101.96 84.95 89.4 98.5 89.4 82.58 60.16
Slide 5: Investment Securities, AFS
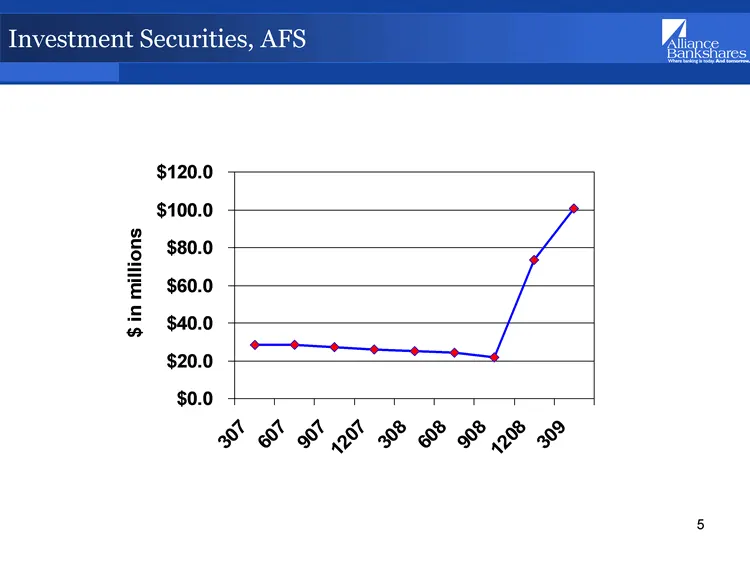
Investment Securities, AFS 307 607 907 1207 308 608 908 1208 309 28.5 28.5 27.2 26.1 25.3 24.4 21.8 73.3 100.8
Slide 6: Demand Deposits
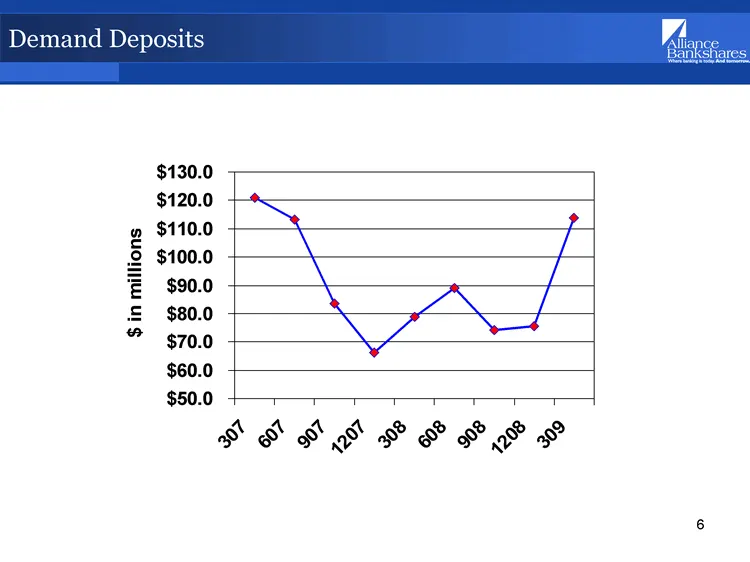
Demand Deposits 307 607 907 1207 308 608 908 1208 309 120.86 113.33 83.59 66.15 78.96 89.17 74.167 75.448 113.7
Slide 7: Total Deposits
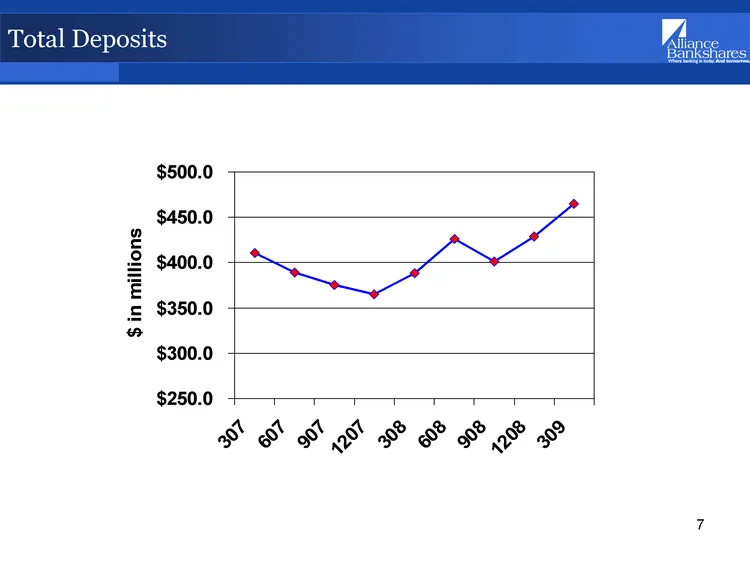
Total Deposits 307 607 907 1207 308 608 908 1208 309 410.85 389.289 375.517 365.26 388.078 426.275 401.448 428.7 465.075
Slide 8: Demand Deposits to Total Deposits
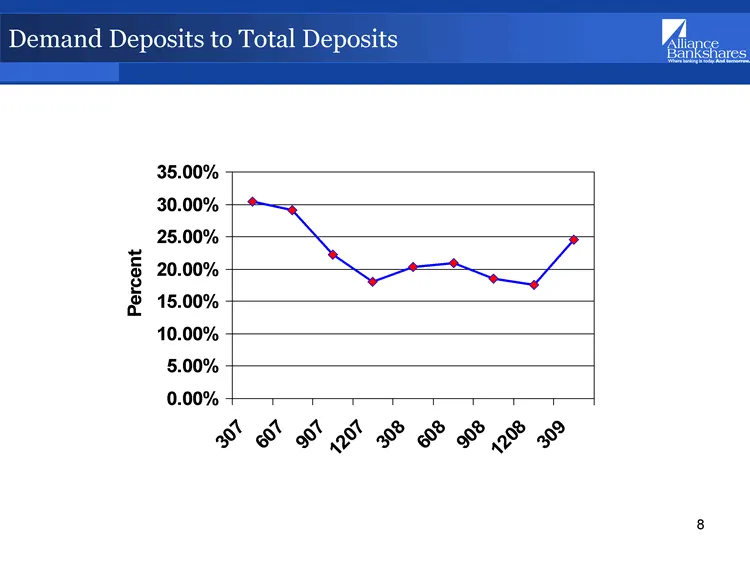
Demand Deposits to Total Deposits 307 607 907 1207 308 608 908 1208 309 0.304 0.291 0.223 0.181 0.203 0.209 0.185 0.176 0.245
Slide 9: Loan to Deposit Ratio
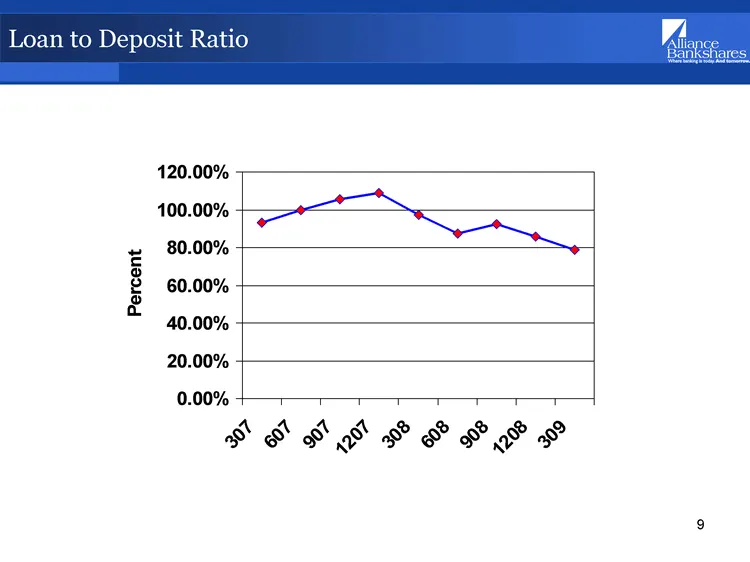
Loan to Deposit Ratio 307 607 907 1207 308 608 908 1208 309 0.933 1 1.055 1.09 0.974 0.873 0.924 0.857 0.787
Slide 10: Allowance for Loan Losses to Total Loans
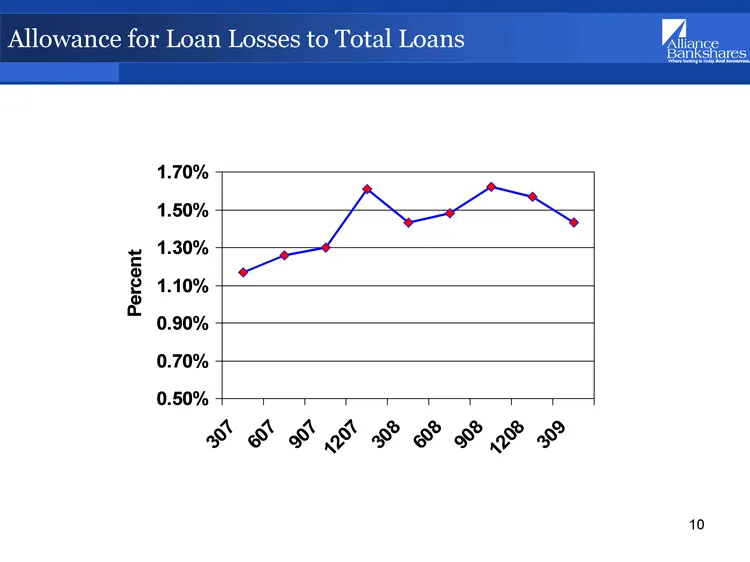
Allowance for Loan Losses to Total Loans 307 607 907 1207 308 608 908 1208 309 0.0117 0.0126 0.013 0.0161 0.0143 0.0148 0.0162 0.0157 0.0143
Slide 11: Non-Performing Assets
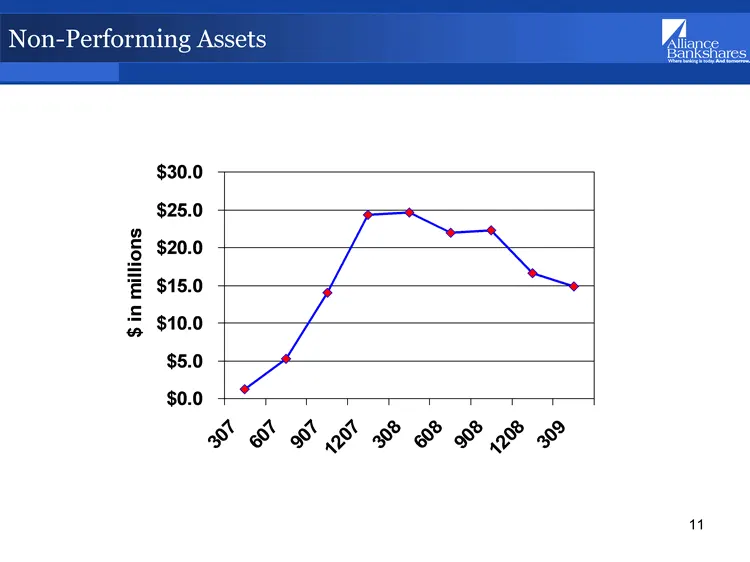
Non-Performing Assets 307 607 907 1207 308 608 908 1208 309 1.26 5.27 14 24.3 24.59 21.94 22.26 16.644 14.886
Slide 12: Nonperforming Assets to Total Assets
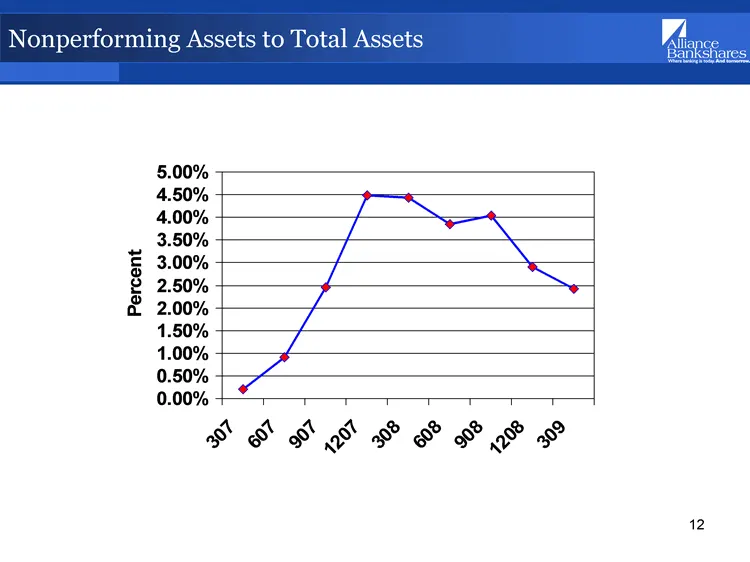
Nonperforming Assets to Total Assets 307 607 907 1207 308 608 908 1208 309 0.002 0.0091 0.0246 0.0449 0.0444 0.0385 0.0403 0.0291 0.0242
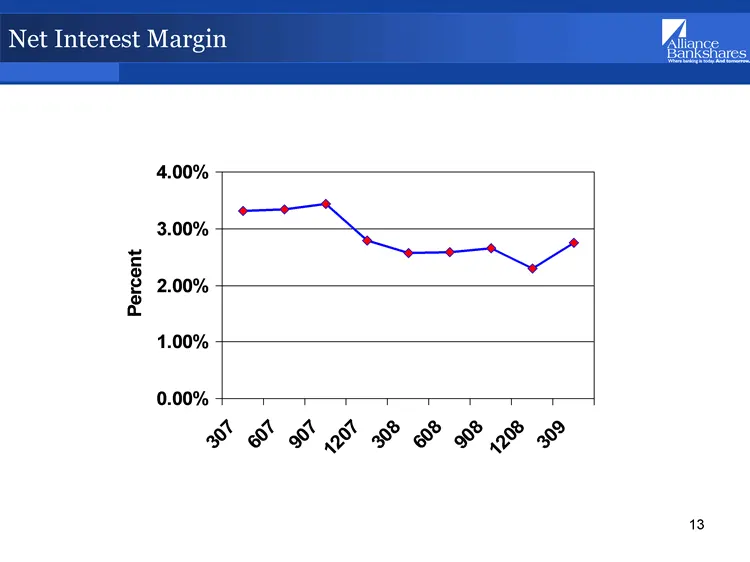
Slide 13: Net Interest Margin
Net Interest Margin 307 607 907 1207 308 608 908 1208 309 0.0331 0.0334 0.0344 0.0279 0.0257 0.0259 0.0265 0.0229 0.0275
Source: SEC EDGAR · 8-K filed May 8, 2009
More decks from Alliance Bankshares Corp
 FBR Fall Investor Conference 201146 slides · Nov 29, 2011
 Stifel Nicolaus Bank Conference (November 2011)51 slides · Nov 2, 2011
 Merger or Acquisition (September 2011)48 slides · Sep 19, 2011
 Investor Presentation (August 2007)34 slides · Aug 13, 2007
 Q1 2007 Earnings Presentation31 slides · May 17, 2007
 Investor Presentation (December 2006)36 slides · Dec 7, 2006