VEREIT — American Realty Capital Properties — Merger or Acquisition (November 2013)
31 slides from VEREIT's merger presentation, Nov 5, 2013
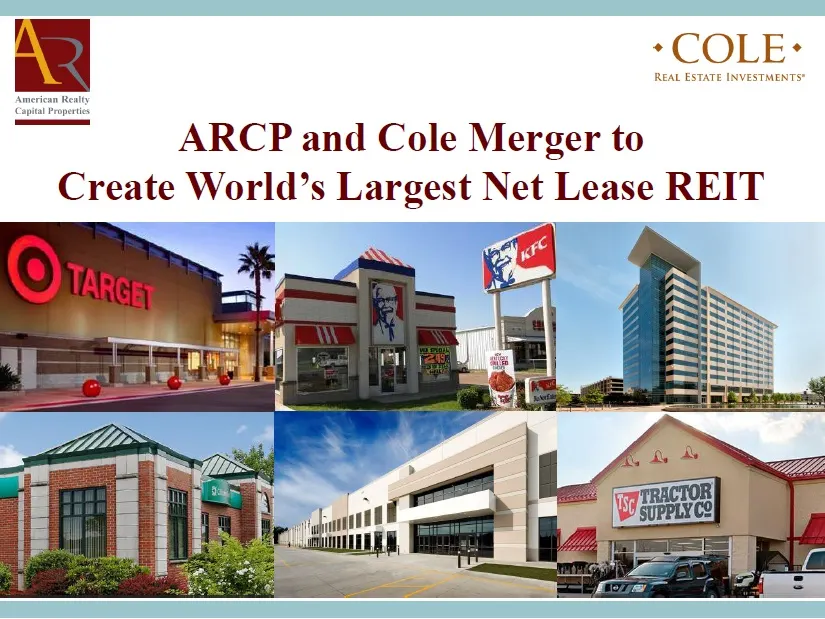
Slide 1: ARCP and Cole Merger to Create World’s Largest Net Lease REIT
ARCP and Cole Merger to Create World’s Largest Net Lease REIT
Slide 2: Forward-looking statements
2 Information set forth herein (including information included or incorporated by reference herein) contains “forward - looking statements” (as defined in Section 21 E of the Securities Exchange Act of 1934 , as amended), which reflect American Realty Capital Properties, Inc . ’s (“ARCP”), CapLease,
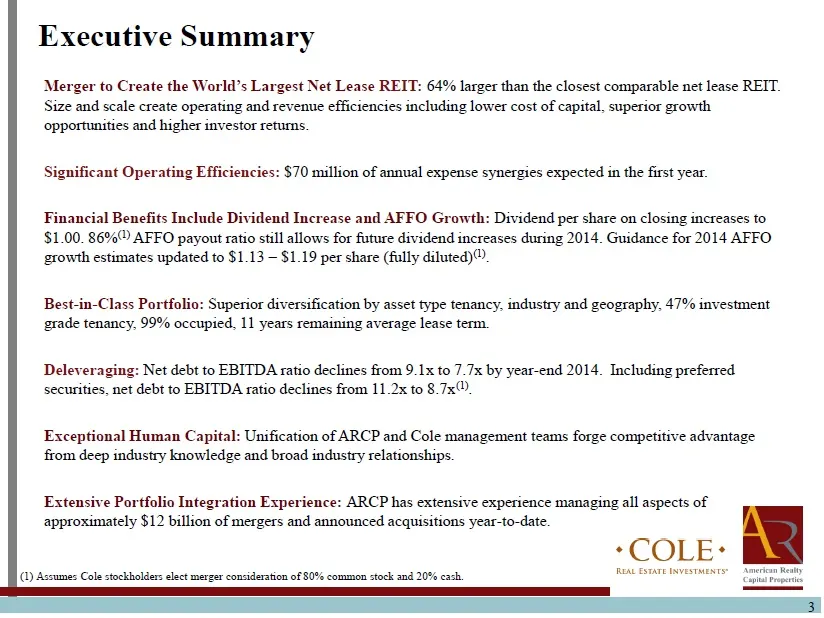
Slide 3: Executive Summary
3 Executive Summary Merger to Create the World’s Largest Net Lease REIT: 64% larger than the closest comparable net lease REIT. Size and scale create operating and revenue efficiencies including lower cost of capital, superior growth opportunities and higher investor returns. Significant Operating E
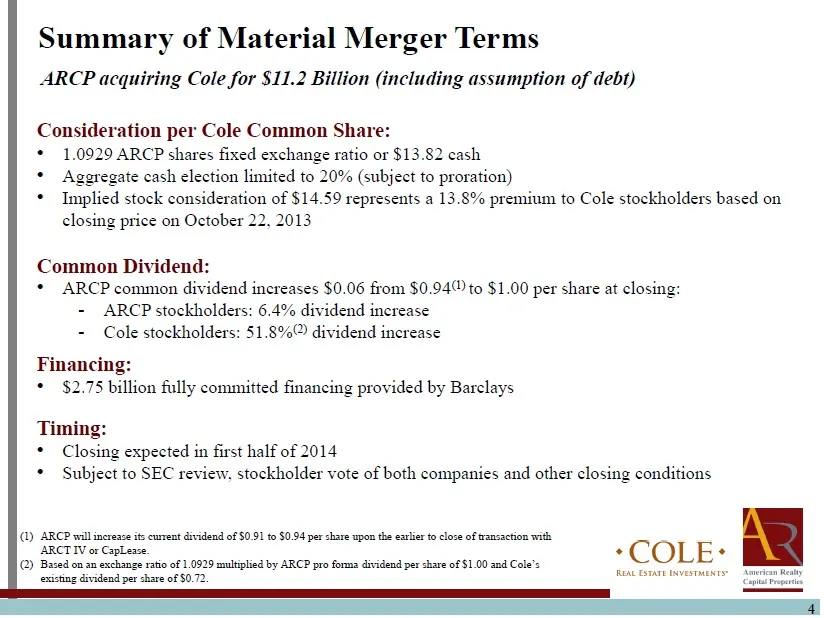
Slide 4: Summary of Material Merger Terms
4 Summary of Material Merger Terms Consideration per Cole Common Share: • 1.0929 ARCP shares fixed exchange ratio or $13.82 cash • Aggregate cash election limited to 20% (subject to proration) • Implied stock consideration of $14.59 represents a 13.8% premium to Cole stockholders based on closing pr
Slide 5: Net Lease Leadership
*COLE* REAL ESTATE INVESTMENTS" Net Lease Leadership
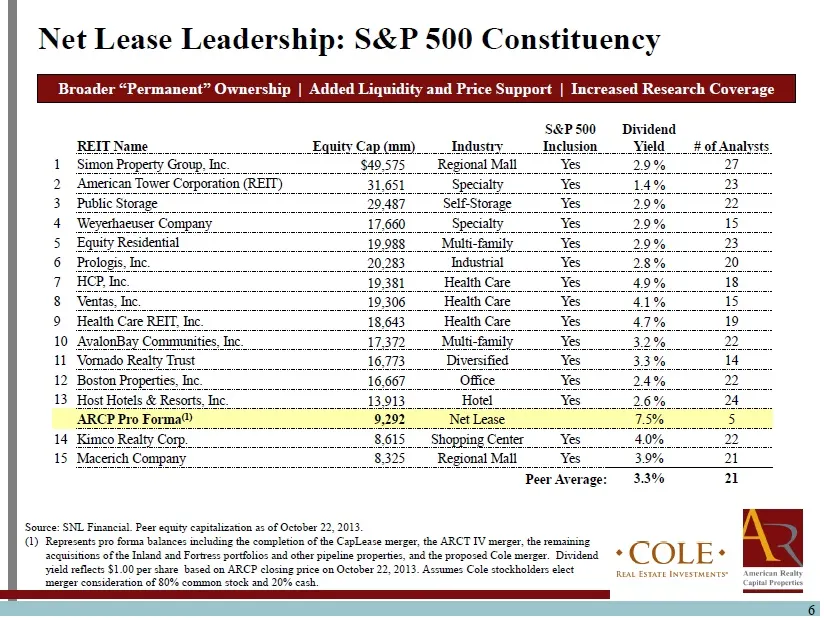
Slide 6: REIT equity cap ranking and dividend yield comparison
6 REIT Name Equity Cap (mm) Industry S&P 500 Inclusion Dividend Yield # of Analysts 1 Simon Property Group, Inc. $49,575 Regional Mall Yes 2.9 % 27 2 American Tower Corporation (REIT) 31,651 Specialty Yes 1.4 % 23 3 Public Storage 29,487 Self - Storage Yes 2.9 % 22 4 Weyerhaeuser Company 17,660 Spec
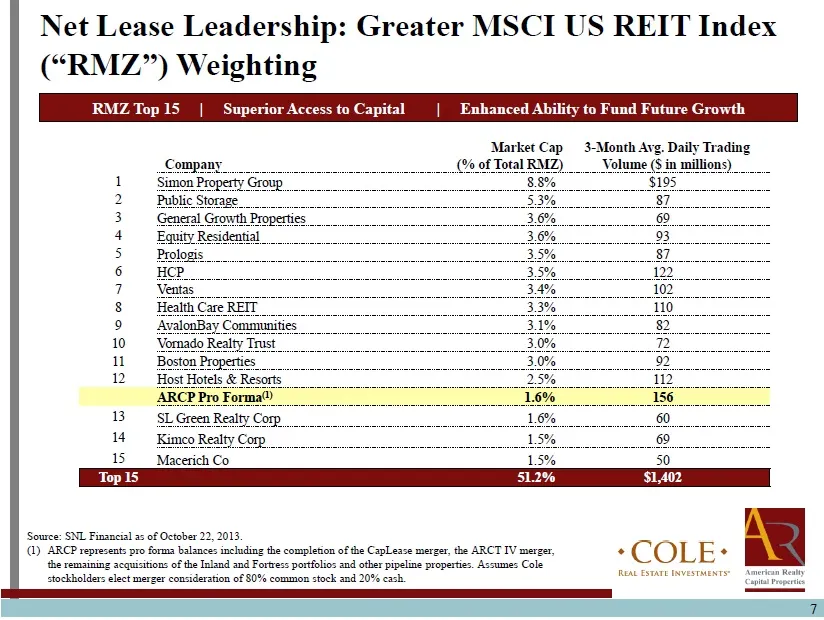
Slide 7: Net Lease Leadership: Greater MSCI US REIT Index Weighting
7 Net Lease Leadership: Greater MSCI US REIT Index (“RMZ ”) Weighting Source: SNL Financial as of October 22, 2013 . (1) ARCP represents pro forma balances including the completion of the CapLease merger, the ARCT IV merger, the remaining acquisitions of the Inland and Fortress portfolios and other
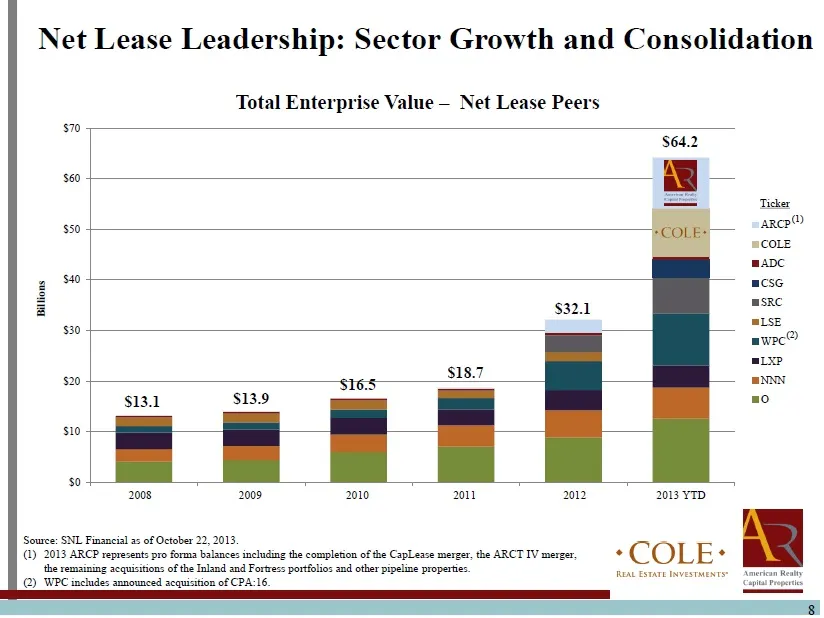
Slide 8: Net Lease Leadership: Sector Growth and Consolidation
$0 $10 $20 $30 $40 $50 $60 $70 2008 FY 2009 FY 2010 FY 2011 FY 2012 FY 2013 YTD Billions Total Enterprise Value – Net Lease Peers ARCP COLE ADC CSG SRC LSE WPC LXP NNN O 8 Net Lease Leadership: Sector Growth and Consolidation Source: SNL Financial as of October 22, 2013. (1) 2013 ARCP r epresents pr
Slide 9: Net Lease Leadership: Capitalizing on Consolidation
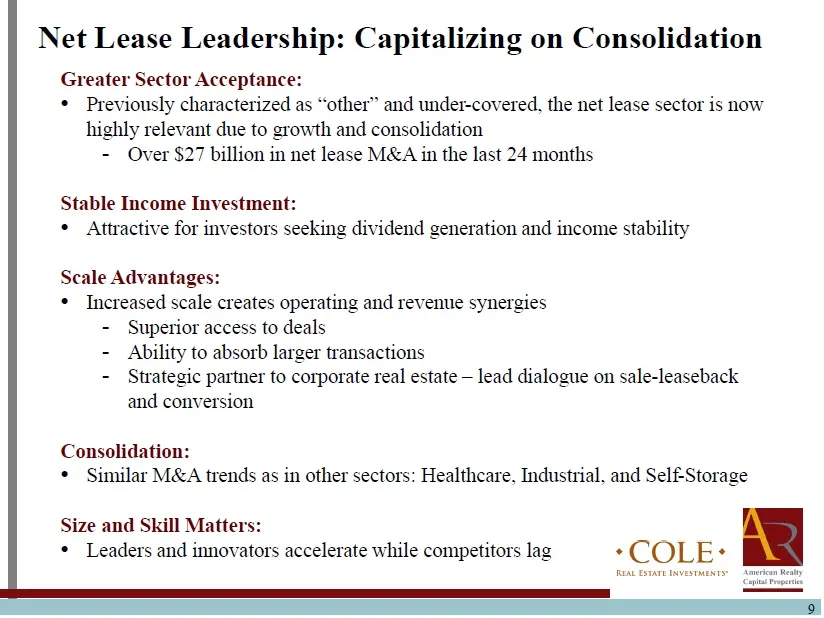
9 Net Lease Leadership: Capitalizing on Consolidation Greater Sector Acceptance: • Previously characterized as “other” and under - covered, the net lease sector is now highly relevant due to growth and consolidation - Over $27 billion in net lease M&A in the last 24 months Stable Income Investment:
Slide 10: Portfolio Statistics
*COLE* REAL ESTATE INVESTMENTS" Portfolio Statistics
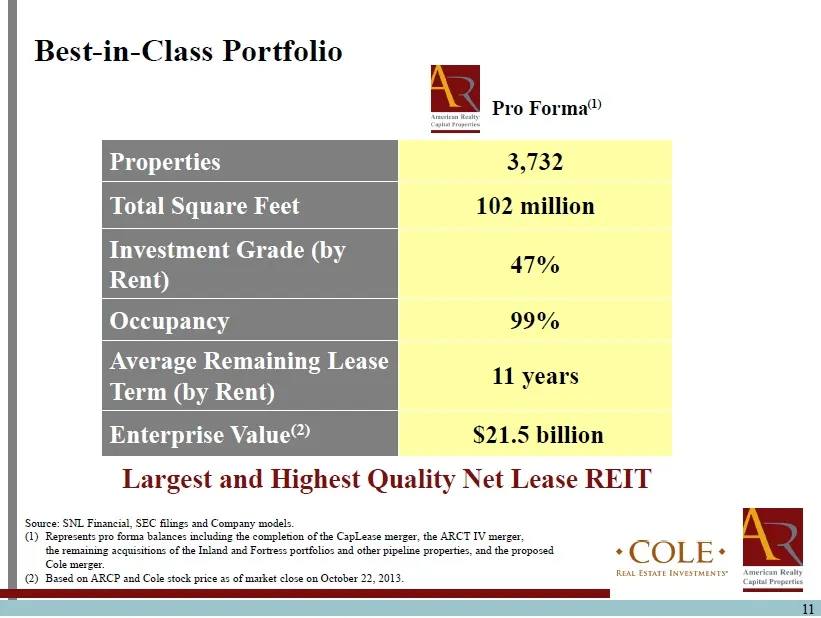
Slide 11: Best-in-Class Portfolio: Largest and Highest Quality Net Lease REIT
Properties 3,732 Total Square Feet 102 million Investment Grade (by Rent) 47% Occupancy 99% Average Remaining Lease Term (by Rent) 11 years Enterprise Value (2) $21.5 billion Pro Forma 11 Source: SNL Financial, SEC filings and Company models. (1) Represents pro forma balances including the completio
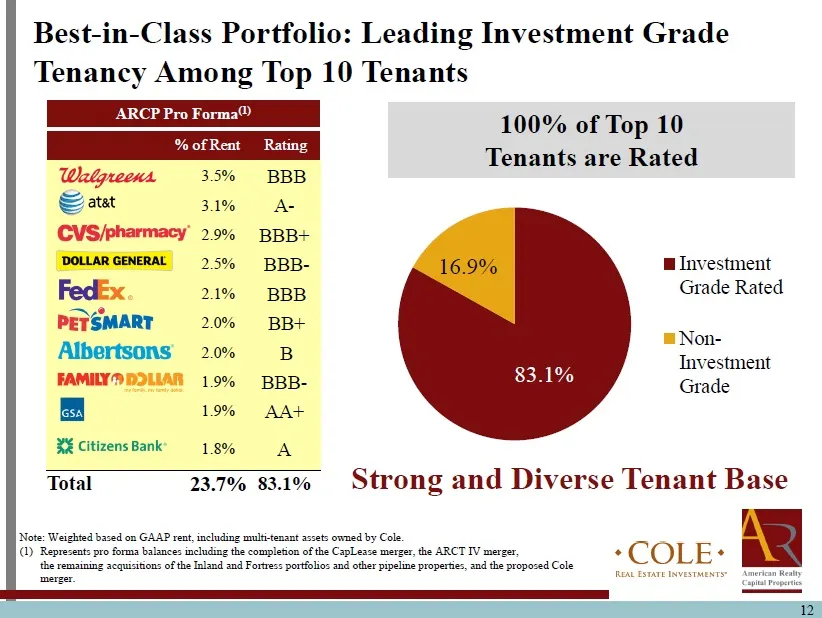
Slide 12: Leading Investment Grade Tenancy
100% of Top 10 Tenants are Rated 12 ARCP Pro Forma (1) % of Rent Rating 3.5% BBB 3.1% A - 2.9% BBB+ 2.5% BBB - 2.1% BBB 2.0% BB+ 2.0% B 1.9% BBB - 1.9% AA+ 1.8% A Total 23.7% 83.1% Best - in - Class Portfolio: Leading Investment Grade Tenancy Among Top 10 Tenants Strong and Diverse Tenant Base Note:
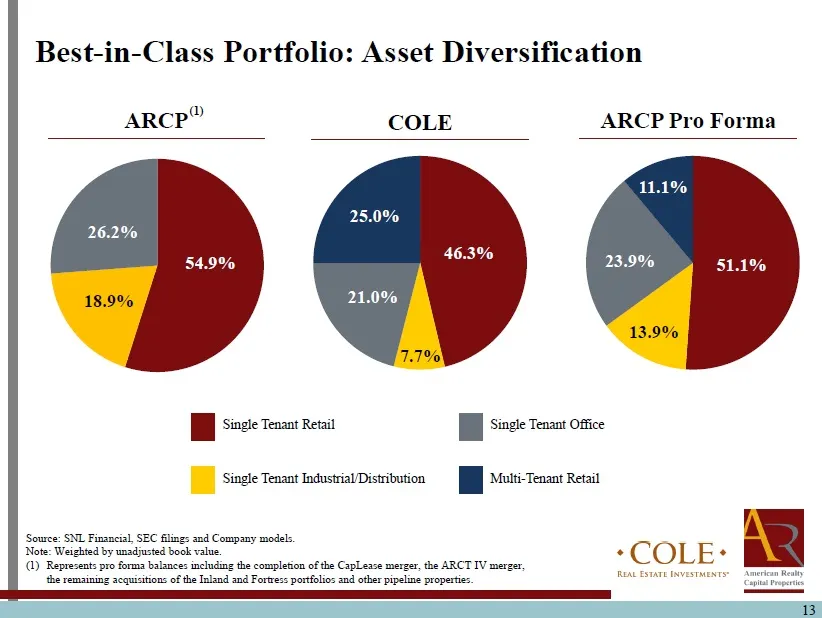
Slide 13: Best-in-Class Portfolio: Asset Diversification
13 Single Tenant Retail Single Tenant Industrial/Distribution Single Tenant Office Multi - Tenant Retail 54.9% 26.2% 18.9% 23.9% 11.1% 51.1% 13.9% ARCP ARCP Pro Forma Source : SNL Financial, SEC filings and Company models . Note: Weighted by unadjusted book value. (1) Represents pro forma balances i
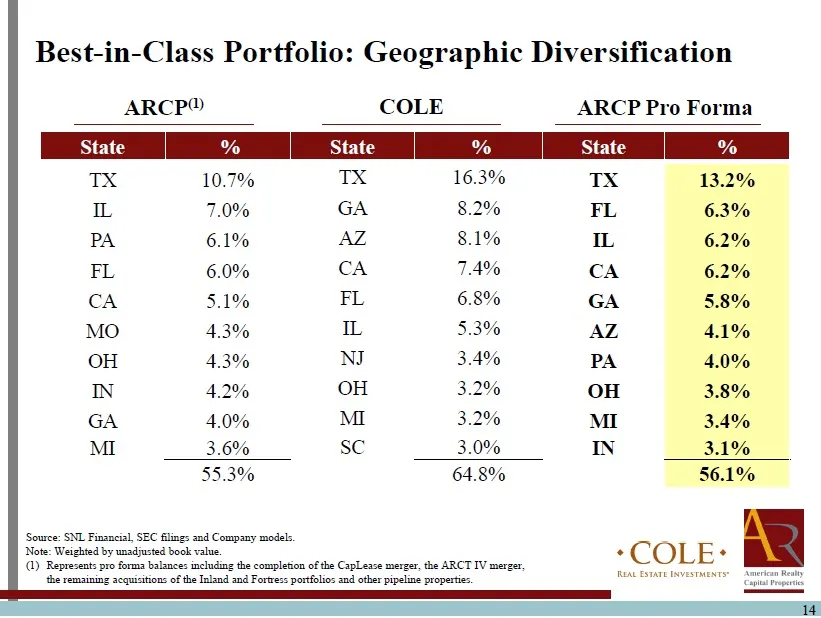
Slide 14: Best-in-Class Portfolio: Geographic Diversification
14 ARCP (1) ARCP Pro Forma COLE Best - in - Class Portfolio: Geographic D iversification State % State % State % TX 10.7% TX 16.3% TX 13.2% IL 7.0% GA 8.2% FL 6.3% PA 6.1% AZ 8.1% IL 6.2% FL 6.0% CA 7.4% CA 6.2% CA 5.1% FL 6.8% GA 5.8% MO 4.3% IL 5.3% AZ 4.1% OH 4.3% NJ 3.4% PA 4.0% IN 4.2% OH 3.2%
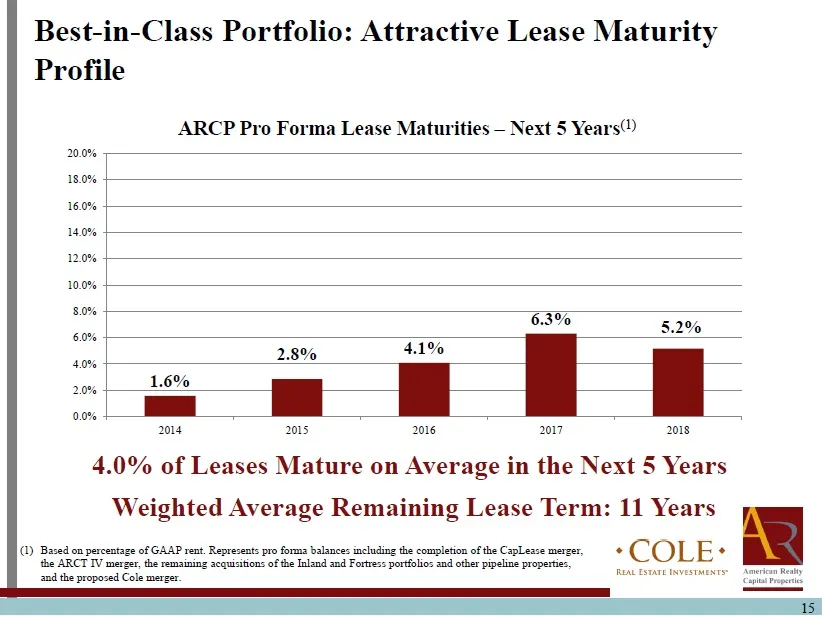
Slide 15: Attractive Lease Maturity Profile
15 15 (1) Based on percentage of GAAP rent. Represents pro forma balances including the completion of the CapLease merger, the ARCT IV merger, the remaining acquisitions of the Inland and Fortress portfolios and other pipeline properties, and the proposed Cole merger. 4.0% of Leases Mature on Averag
Slide 16: Financial Analysis
*COLE: REAL ESTATE INVESTMENTS" Financial Analysis
Slide 17: Pro Forma Capitalization
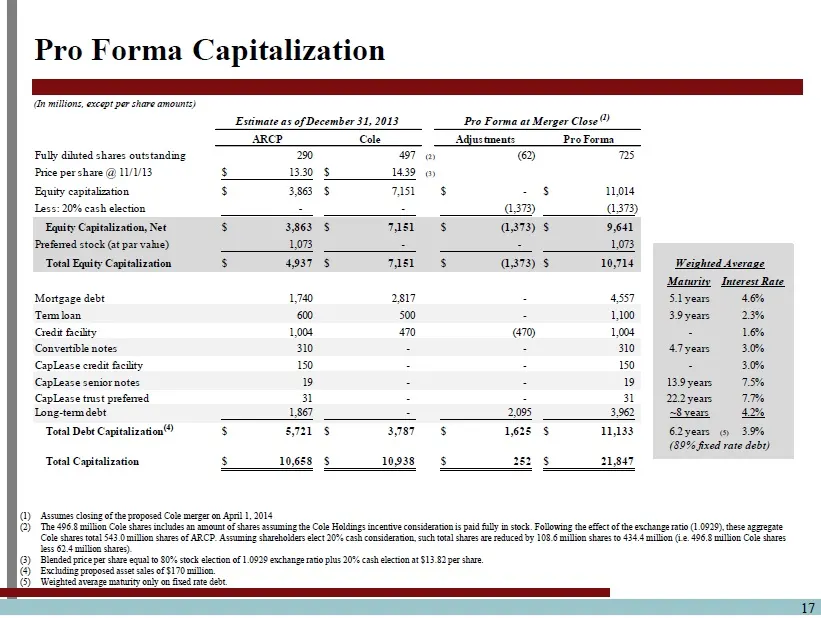
17 Pro Forma Capitalization (1) Assumes closing of the proposed Cole merger on April 1, 2014 (2) The 496.8 million Cole shares includes an amount of shares assuming the Cole Holdings incentive consideration is paid fully in stock. F oll owing the effect of the exchange ratio (1.0929), these aggregat
Slide 18: Pro Forma Capitalization Detail
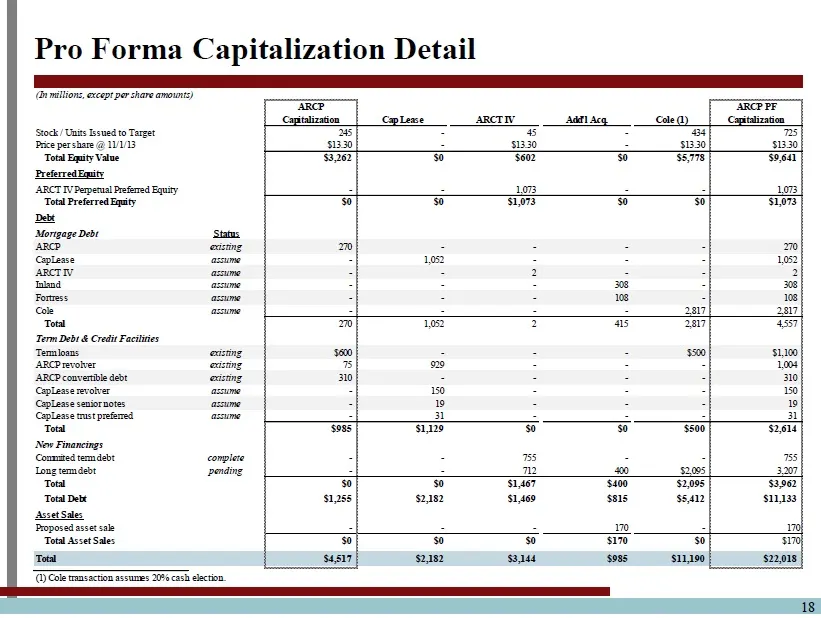
18 Pro Forma Capitalization Detail (In millions, except per share amounts) ARCP ARCP PF Capitalization Cap Lease ARCT IV Add'l Acq. Cole (1) Capitalization Stock / Units Issued to Target 245 - 45 - 434 725 Price per share @ 11/1/13 $13.30 - $13.30 - $13.30 $13.30 Total Equity Value $3,262 $0 $602 $0
Slide 19: Earnings Guidance Detail
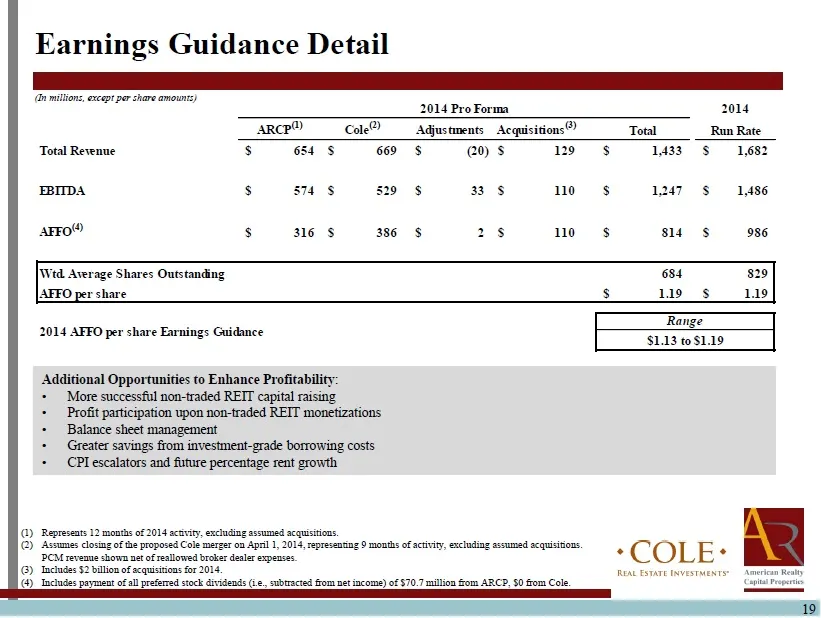
19 Earnings Guidance Detail (In millions, except per share amounts) Additional Opportunities to Enhance Profitability : • More successful non - traded REIT capital raising • Profit participation upon non - traded REIT monetizations • Balance sheet management • Greater savings from investment - grade
Slide 20: Implied Real Estate Capitalization Rate
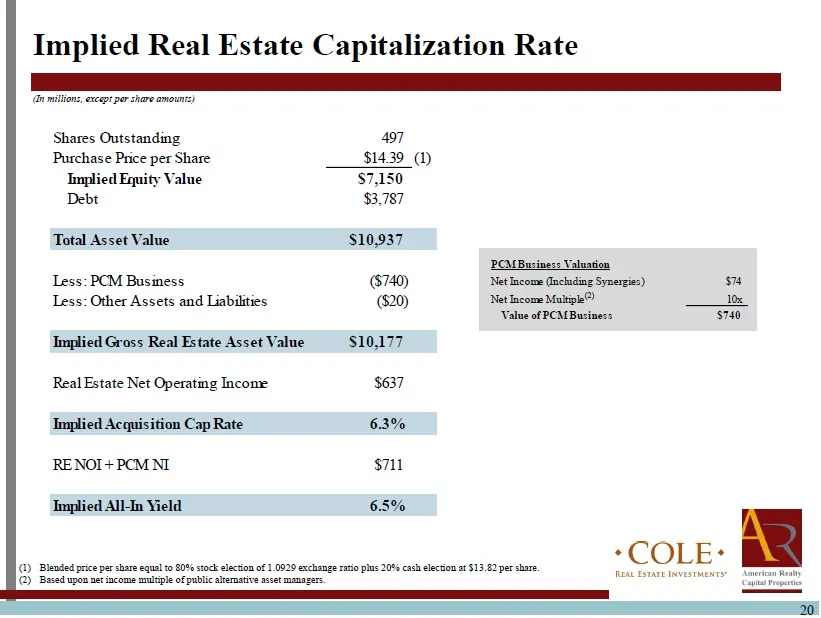
20 Implied Real Estate Capitalization Rate (In millions, except per share amounts) (1) Blended price per share equal to 80% stock election of 1.0929 exchange ratio plus 20% cash election at $13.82 per share. (2) Based upon net income multiple of public alternative asset managers. PCM Business Valuat
Slide 21: Shares Outstanding Guidance
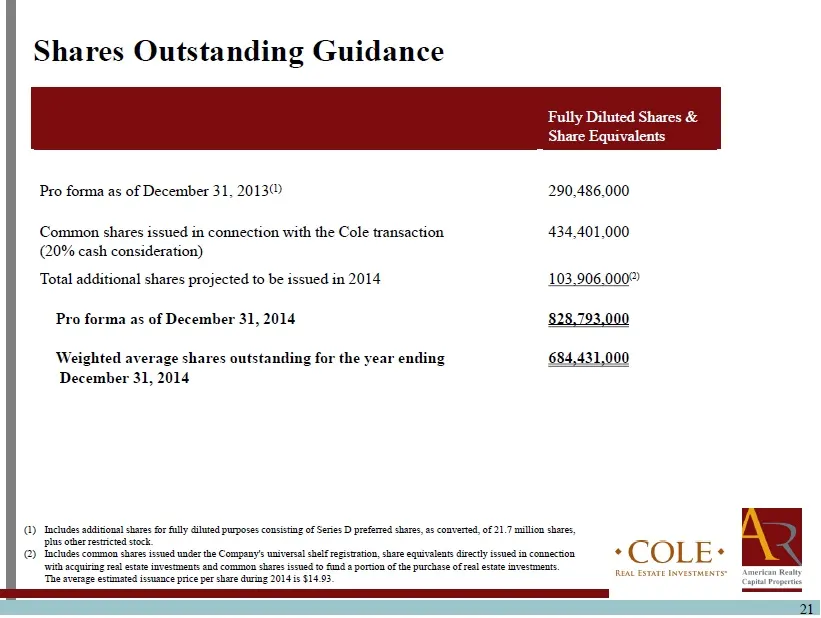
21 Shares Outstanding Guidance Fully Diluted Shares & Share Equivalents Pro forma as of December 31, 2013 (1) 290,486,000 Common shares issued in connection with the Cole transaction (20% cash consideration) 434,401,000 Total additional shares projected to be issued in 2014 103,906,000 (2) Pro forma
Slide 22: Non-GAAP FFO/AFFO Reconciliation
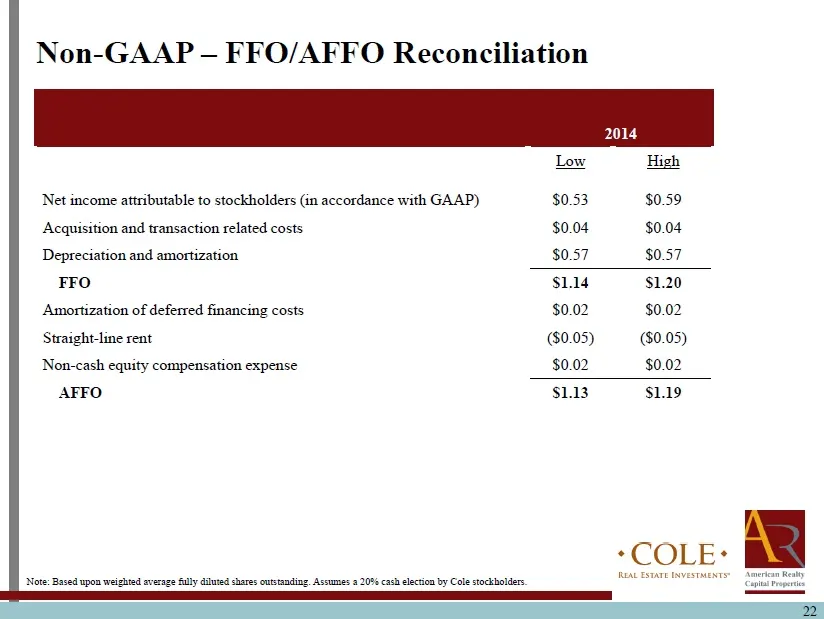
22 2014 Low High Net income attributable to stockholders (in accordance with GAAP) $0.53 $0.59 Acquisition and transaction related costs $0.04 $0.04 Depreciation and amortization $0.57 $0.57 FFO $1.14 $1.20 Amortization of deferred financing costs $0.02 $0.02 Straight - line rent ($0.05) ($0.05) Non

Slide 23: Moving Toward Self-Management
Moving Toward Self - Management 23
Slide 24: Pro Forma Organizational Chart
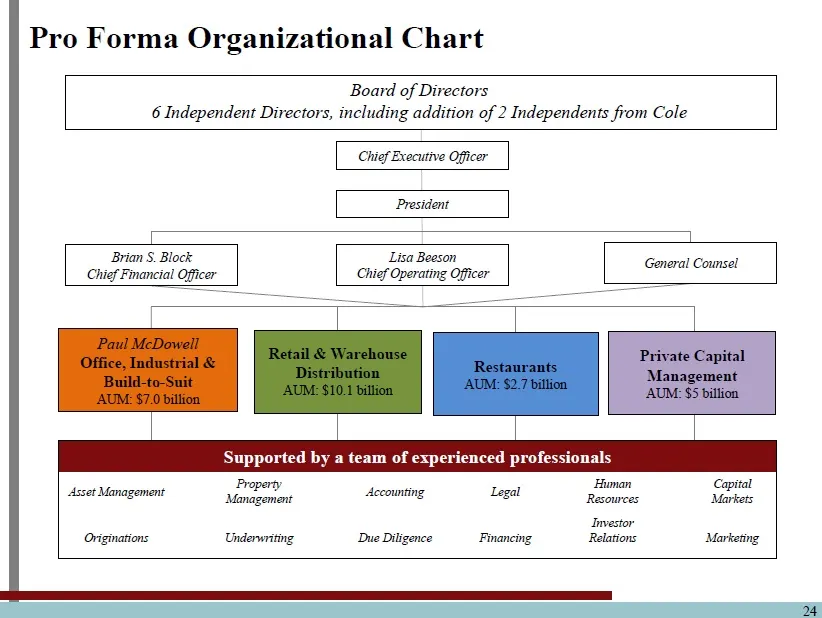
24 Paul McDowell Office , Industrial & Build - to - Suit AUM: $7.0 billion Retail & Warehouse Distribution AUM: $10.1 billion Restaurants AUM: $2.7 billion Private Capital Management AUM: $5 billion General Counsel Lisa Beeson Chief Operating Officer Brian S. Block Chief Financial Officer President
Slide 25: Uniquely Qualified Dedicated Senior Management Team
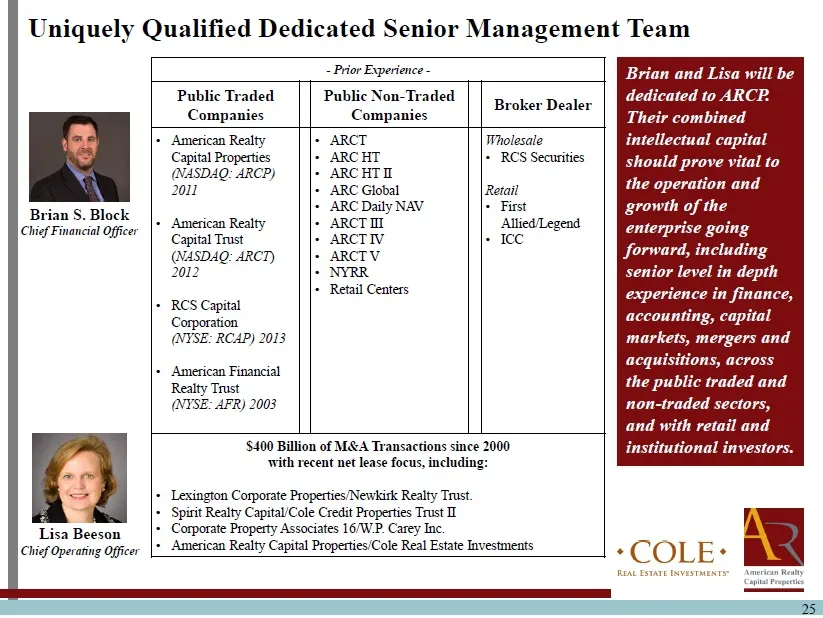
25 Uniquely Qualified Dedicated Senior Management Team - Prior Experience - Public Traded Companies Public Non - Traded Companies Broker Dealer • American Realty Capital Properties (NASDAQ: ARCP) 2011 • American Realty Capital Trust ( NASDAQ: ARCT ) 2012 • RCS Capital Corporation (NYSE: RCAP) 2013 •
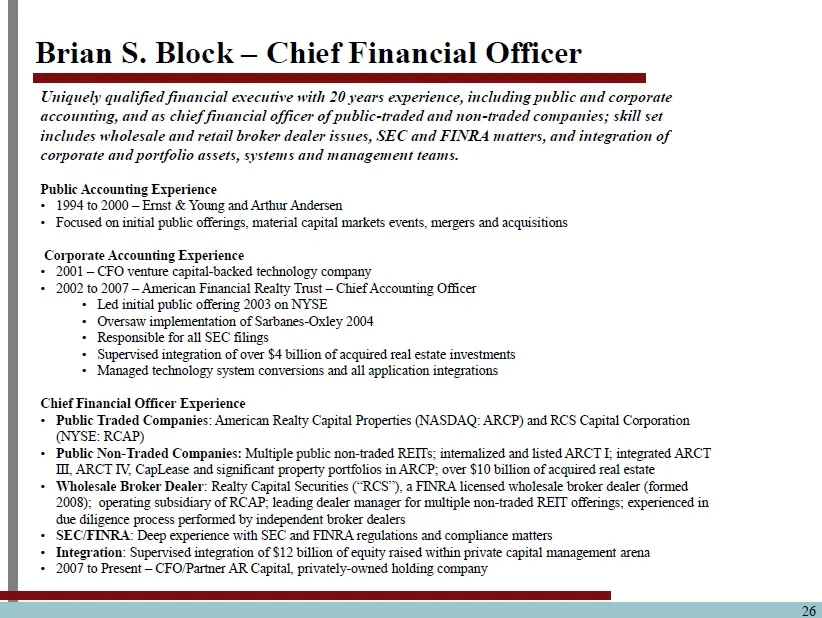
Slide 26: Brian S. Block – Chief Financial Officer
26 Brian S. Block – Chief Financial Officer Uniquely qualified financial executive with 20 years experience, including public and corporate accounting, and as chief financial officer of public - traded and non - traded companies; skill set includes wholesale and retail broker dealer issues, SEC and
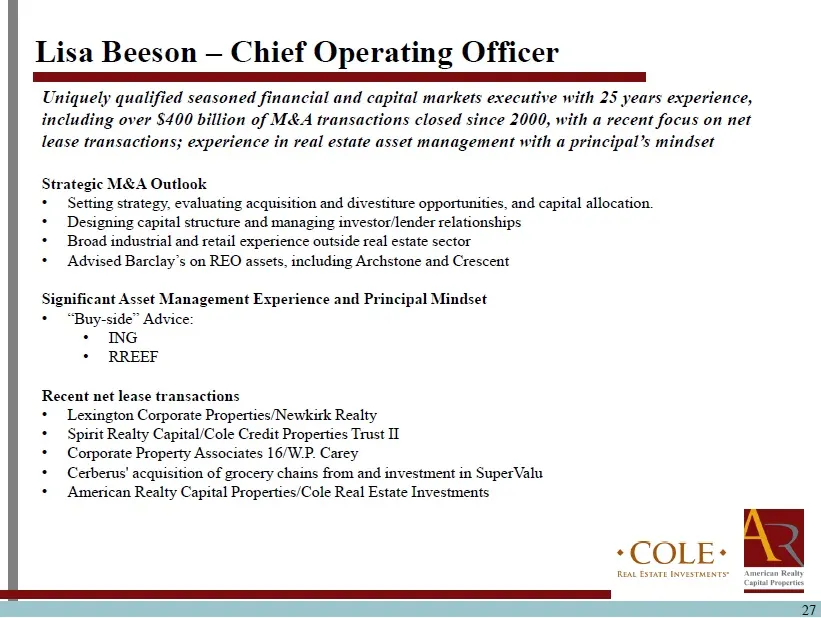
Slide 27: Lisa Beeson – Chief Operating Officer
27 Lisa Beeson – Chief Operating Officer Uniquely qualified seasoned financial and capital markets executive with 25 years experience, including over $400 billion of M&A transactions closed since 2000, with a recent focus on net lease transactions; experience in real estate asset management with a p
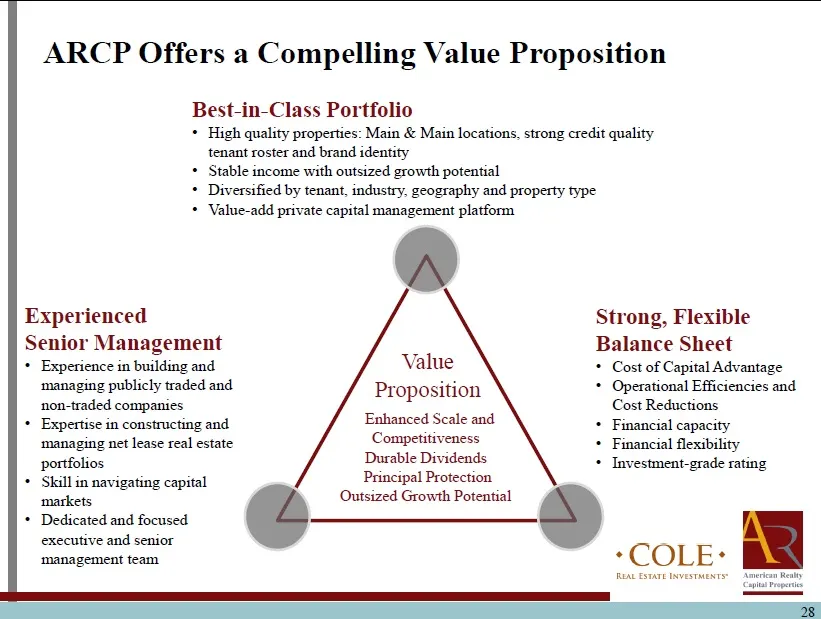
Slide 28: ARCP Offers a Compelling Value Proposition
28 Experienced Senior Management • Experience in building and managing publicly traded and non - traded companies • Expertise in constructing and managing net lease real estate portfolios • Skill in navigating capital markets • Dedicated and focused executive and senior management team Best - in - C
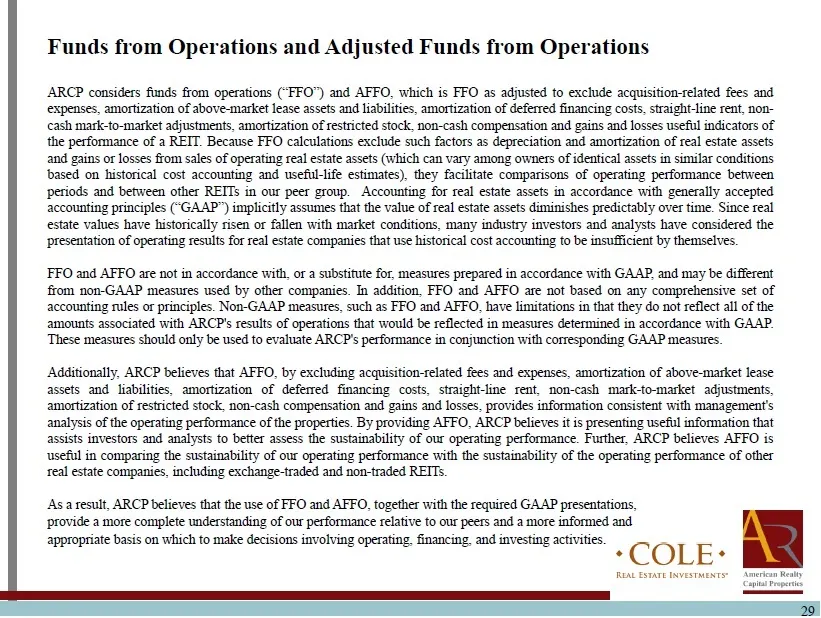
Slide 29: Funds from Operations and Adjusted Funds from Operations
29 Funds from Operations and Adjusted Funds from Operations ARCP considers funds from operations (“FFO”) and AFFO, which is FFO as adjusted to exclude acquisition - related fees and expenses, amortization of above - market lease assets and liabilities, amortization of deferred financing costs, strai
Slide 30: Additional information on the Cole merger
30 This communication does not constitute an offer to sell or the solicitation of an offer to buy any securities or a solicitation of any vote or approval . In connection with the proposed Cole merger, ARCP and Cole expect to prepare and file with the SEC a registration statement on Form S - 4 conta
Slide 31: Additional information on the ARCT IV merger
31 This communication does not constitute an offer to sell or the solicitation of an offer to buy any securities or a solicitation of any vote or approval . In connection with the proposed ARCT IV merger, ARCP and ARCT IV expect to prepare and file with the SEC an amendment to their proxy statement/
Source: SEC EDGAR · 8-K filed Nov 5, 2013
More decks from VEREIT Inc
 Q3 2021 Earnings Presentation35 slides · Oct 29, 2021
 Q2 2021 Earnings Presentation35 slides · Aug 5, 2021
 Q1 2021 Earnings Presentation35 slides · May 6, 2021
 Merger or Acquisition (April 2021)16 slides · Apr 29, 2021
 Q4 2020 Earnings Presentation44 slides · Feb 24, 2021
 Q1 2021 Earnings Presentation39 slides · 2021