Ditech — Walter Investment Management — Investor Presentation (May 2009)
35 slides from Ditech's investor presentation, May 12, 2009

Slide 1: Business Overview May 12, 2009
Business Overview May 12, 2009
Slide 2: Safe Harbor Statement
Safe Harbor Statement Certain statements in this presentation may constitute “forward-looking” statements as defined in Section 27A of the Securities Act of 1933, as amended and Section 21E of the Securities Exchange Act of 1934, as amended. Walter Investment Management Corp. is including this cauti
Slide 3: Table of Contents
Company Overview 4 History 10 Financial Overview 12 Mortgage Servicing 18 Advisory and Insurance Services 27 Growth Strategy 30 Appendix 33 Table of Contents

Slide 4: Company Overview
Company Overview
Slide 5: Walter Investment Management Corp
Walter Investment Management Corp Mortgage portfolio owner, mortgage servicer and asset manager specializing in subprime, non-conforming and other credit-challenged mortgage assets. The Company's long track record of superior financial and portfolio performance through up-and-down credit cycles is a
Slide 6: Company Highlights
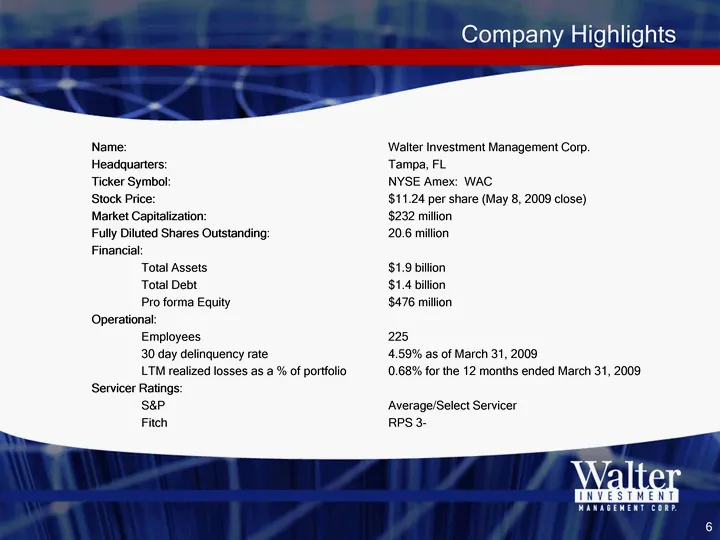
Company Highlights Name: Walter Investment Management Corp. Headquarters: Tampa, FL Ticker Symbol: NYSE Amex: WAC Stock Price: $11.24 per share (May 8, 2009 close) Market Capitalization: $232 million Fully Diluted Shares Outstanding: 20.6 million Financial: Total Assets $1.9 billion Total Debt $1.4
Slide 7: Our Strengths
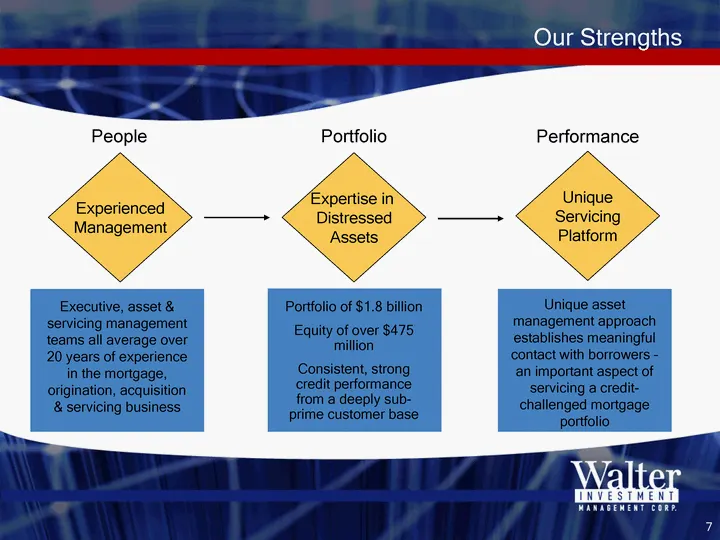
Our Strengths Experienced Management Expertise in Distressed Assets Unique Servicing Platform People Portfolio Performance Executive, asset & servicing management teams all average over 20 years of experience in the mortgage, origination, acquisition & servicing business Portfolio of $1.8 billion Eq
Slide 8: What makes WIMC different?
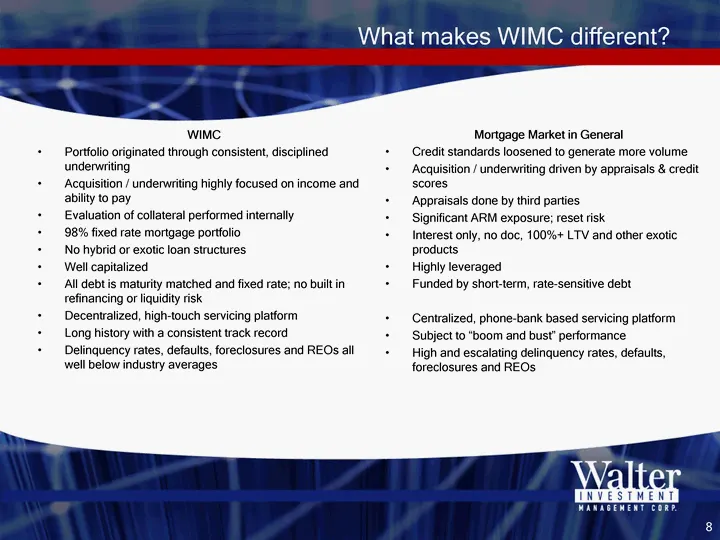
What makes WIMC different? WIMC Portfolio originated through consistent, disciplined underwriting Acquisition / underwriting highly focused on income and ability to pay Evaluation of collateral performed internally 98% fixed rate mortgage portfolio No hybrid or exotic loan structures Well capitalize
Slide 9: Our Approach to Servicing
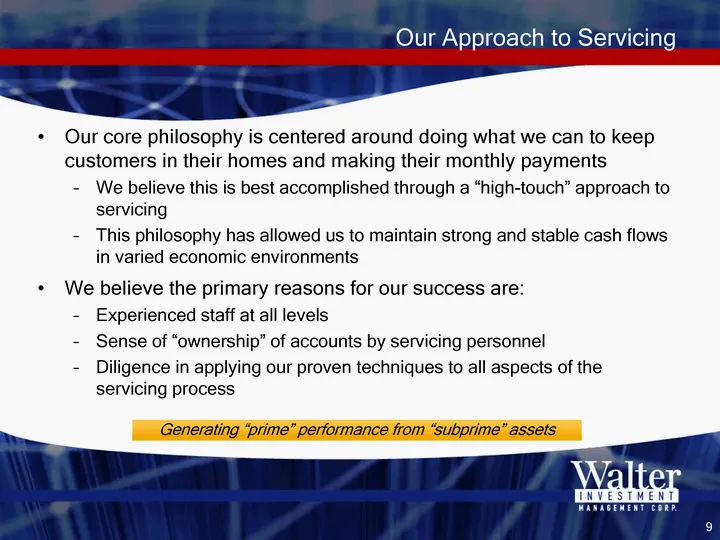
Our Approach to Servicing Our core philosophy is centered around doing what we can to keep customers in their homes and making their monthly payments We believe this is best accomplished through a "high-touch" approach to servicing This philosophy has allowed us to maintain strong and stable cash fl

Slide 10: History
History
Slide 11: History
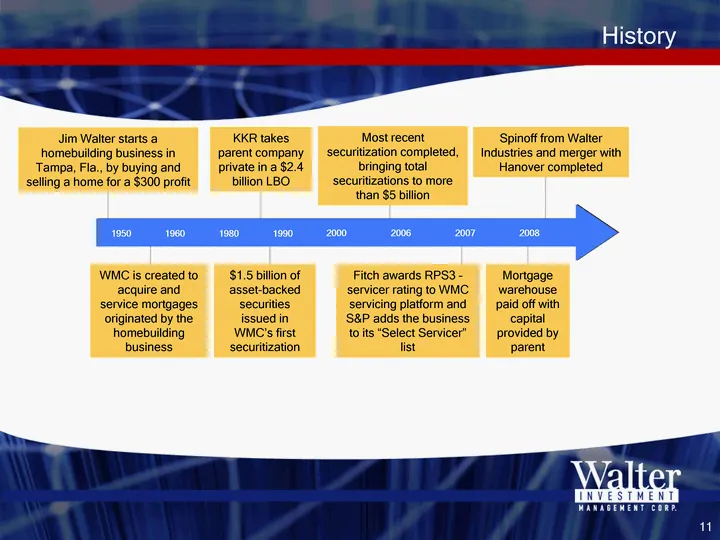
History 1950 1990 2000 2007 1960 1980 2006 2008 1950 1990 2000 2007 1960 1980 2006 2008 Jim Walter starts a homebuilding business in Tampa, Fla., by buying and selling a home for a $300 profit KKR takes parent company private in a $2.4 billion LBO Most recent securitization completed, bringing total

Slide 12: Financial Overview
Financial Overview
Slide 13: Historical Results - Walter's Financing Business
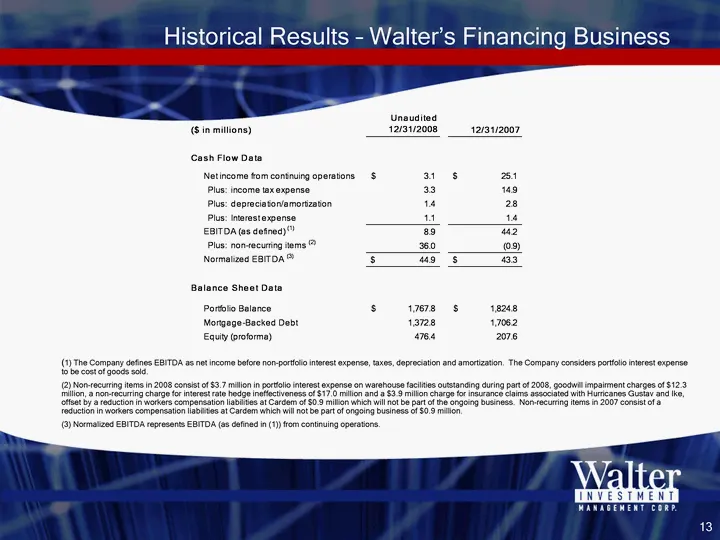
Historical Results - Walter's Financing Business (1) The Company defines EBITDA as net income before non-portfolio interest expense, taxes, depreciation and amortization. The Company considers portfolio interest expense to be cost of goods sold. (2) Non-recurring items in 2008 consist of $3.7 millio
Slide 14: Unaudited 12/31/2008 Historical Results Walter & Hanover Combined
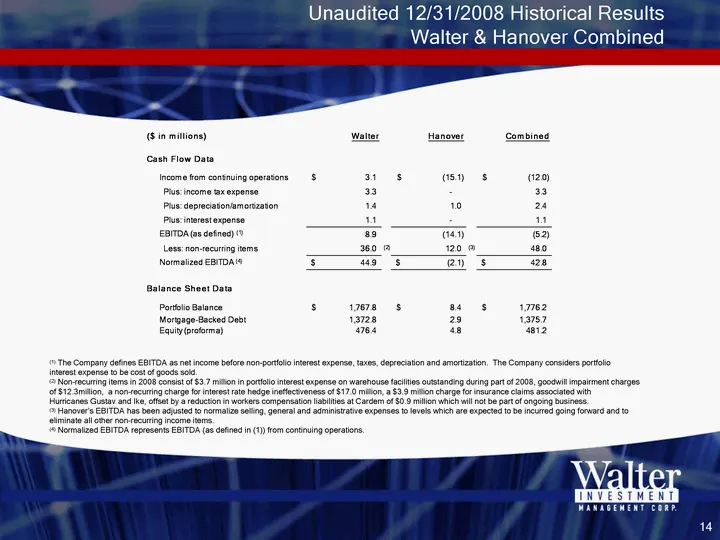
Unaudited 12/31/2008 Historical Results Walter & Hanover Combined (1) The Company defines EBITDA as net income before non-portfolio interest expense, taxes, depreciation and amortization. The Company considers portfolio interest expense to be cost of goods sold. (2) Non-recurring items in 2008 consi
Slide 15: Unaudited 12/31/2008 Historical Results Walter & Hanover Combined
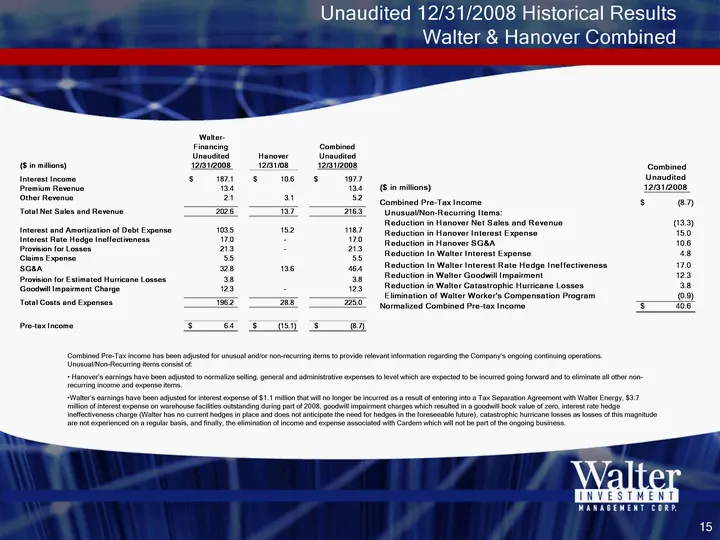
Unaudited 12/31/2008 Historical Results Walter & Hanover Combined Combined Pre-Tax income has been adjusted for unusual and/or non-recurring items to provide relevant information regarding the Company's ongoing continuing operations. Unusual/Non-Recurring items consist of: Hanover's earnings have be
Slide 16: Selected Financial Data - Loss Analysis
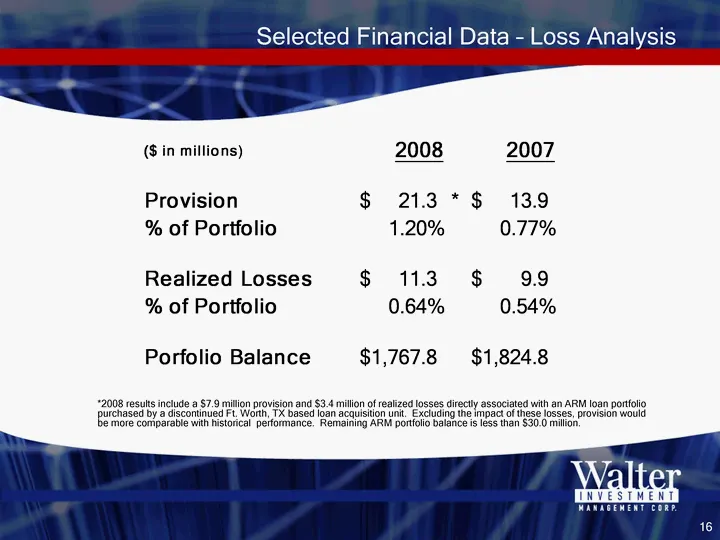
Selected Financial Data - Loss Analysis *2008 results include a $7.9 million provision and $3.4 million of realized losses directly associated with an ARM loan portfolio purchased by a discontinued Ft. Worth, TX based loan acquisition unit. Excluding the impact of these losses, provision would be mo
Slide 17: Proforma Balance Sheet Data
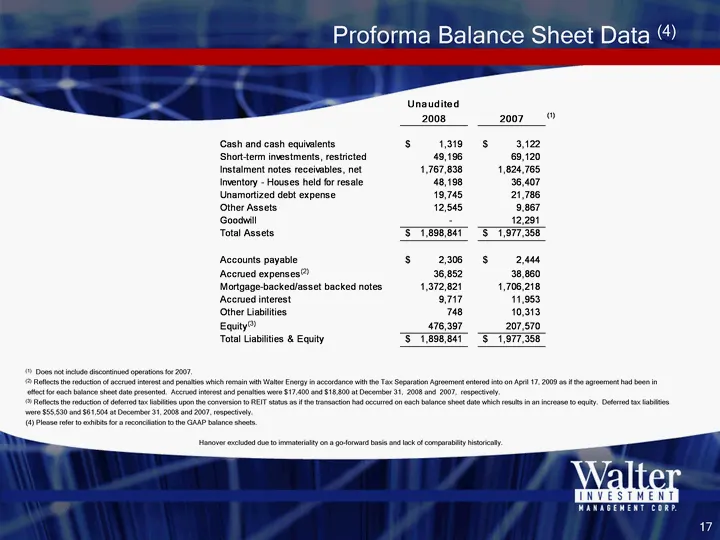
Proforma Balance Sheet Data (4) (1) Does not include discontinued operations for 2007. (2) Reflects the reduction of accrued interest and penalties which remain with Walter Energy in accordance with the Tax Separation Agreement entered into on April 17, 2009 as if the agreement had been in effect fo

Slide 18: Mortgage Servicing
Mortgage’Servicing LY Wi lwi- war
Slide 19: Why use a Field Servicing Approach?
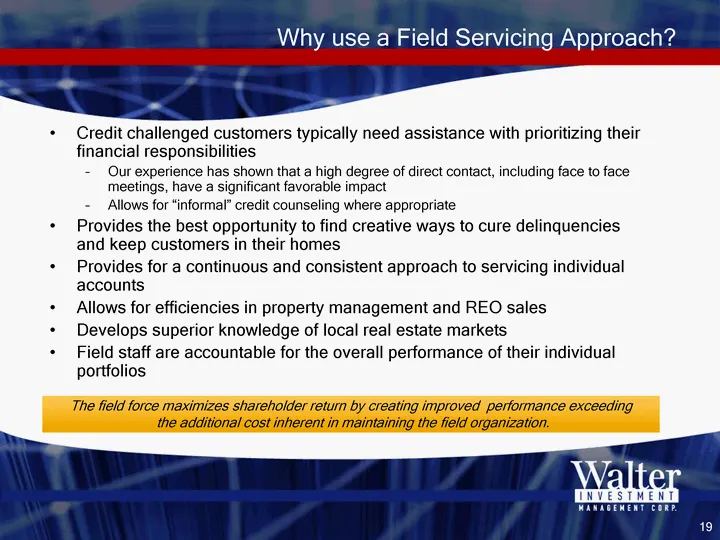
Why use a Field Servicing Approach? Credit challenged customers typically need assistance with prioritizing their financial responsibilities Our experience has shown that a high degree of direct contact, including face to face meetings, have a significant favorable impact Allows for "informal" credi
Slide 20: Why is our Performance Superior?
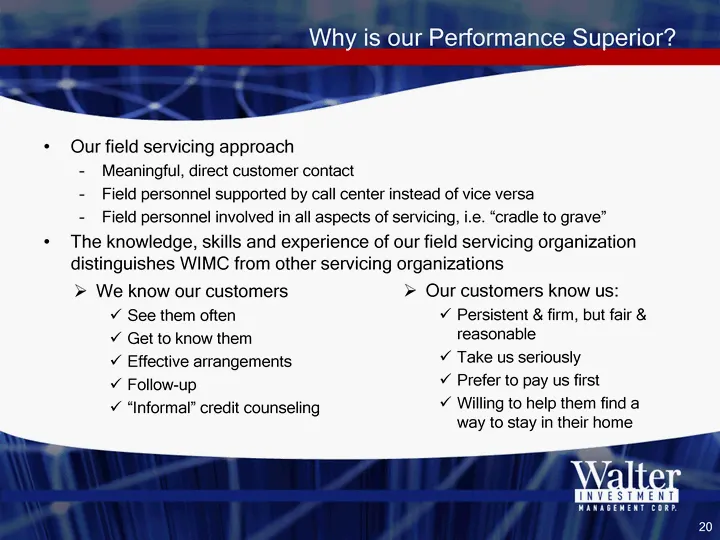
Why is our Performance Superior? Our field servicing approach Meaningful, direct customer contact Field personnel supported by call center instead of vice versa Field personnel involved in all aspects of servicing, i.e. "cradle to grave" The knowledge, skills and experience of our field servicing or
Slide 21: Strong Portfolio of Assets
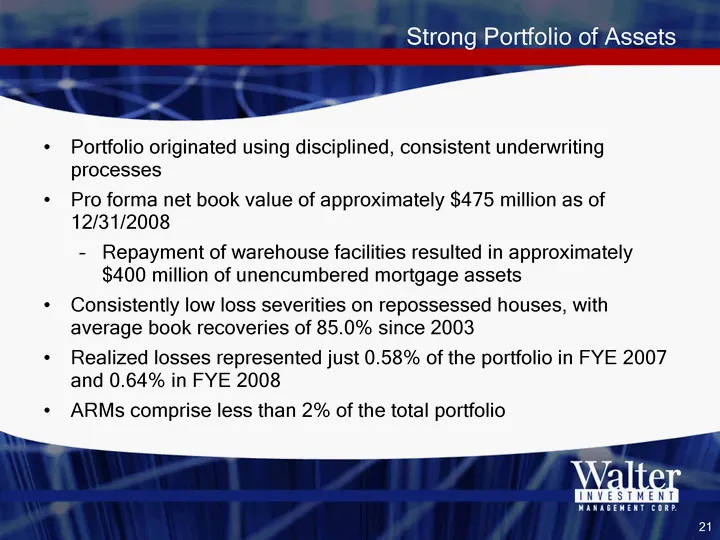
Strong Portfolio of Assets Portfolio originated using disciplined, consistent underwriting processes Pro forma net book value of approximately $475 million as of 12/31/2008 Repayment of warehouse facilities resulted in approximately $400 million of unencumbered mortgage assets Consistently low loss
Slide 22: Portfolio Performance - Proven Track Record
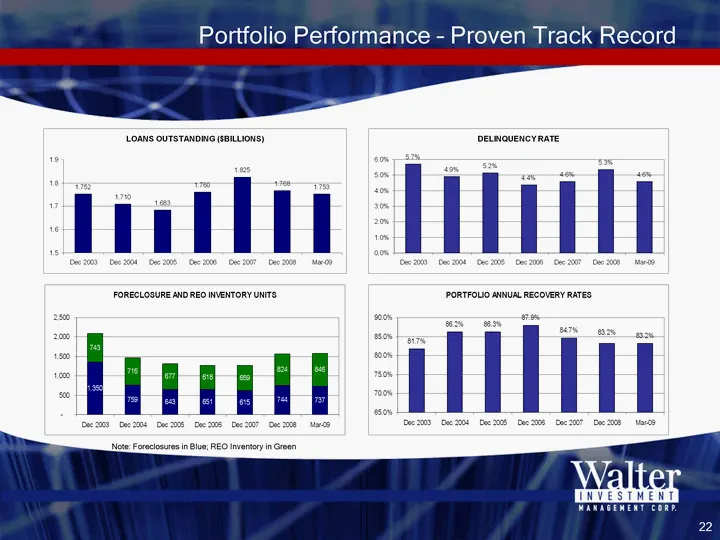
Portfolio Performance - Proven Track Record Note: Foreclosures in Blue; REO Inventory in Green
Slide 23: Delinquencies as Compared to Other Portfolios
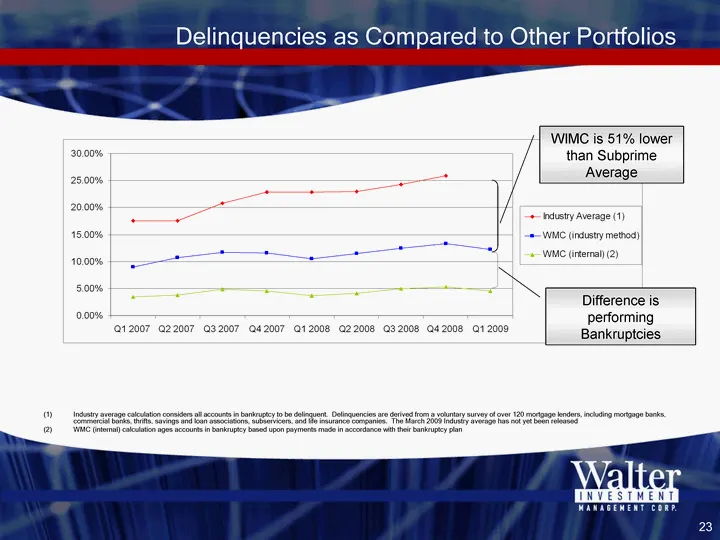
Delinquencies as Compared to Other Portfolios Industry average calculation considers all accounts in bankruptcy to be delinquent. Delinquencies are derived from a voluntary survey of over 120 mortgage lenders, including mortgage banks, commercial banks, thrifts, savings and loan associations, subser
Slide 24: Experienced Field Servicing Organization
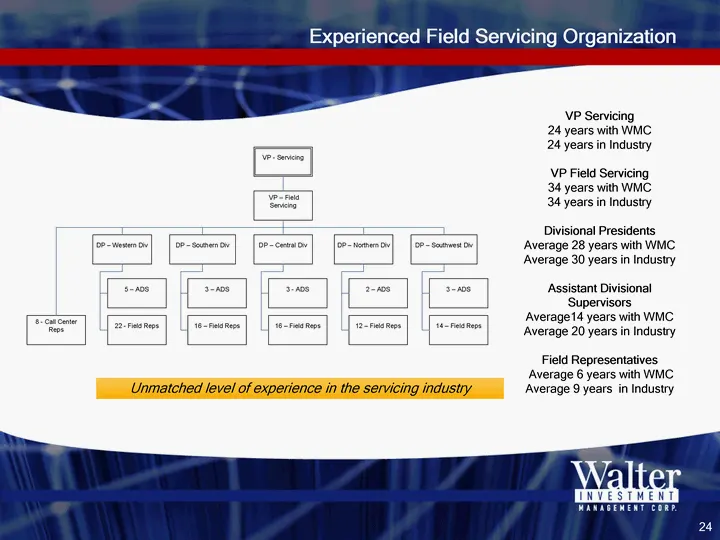
Experienced Field Servicing Organization Unmatched level of experience in the servicing industry VP Servicing 24 years with WMC 24 years in Industry VP Field Servicing 34 years with WMC 34 years in Industry Divisional Presidents Average 28 years with WMC Average 30 years in Industry Assistant Divisi
Slide 25: Geographic Areas and Dispersion of Accounts
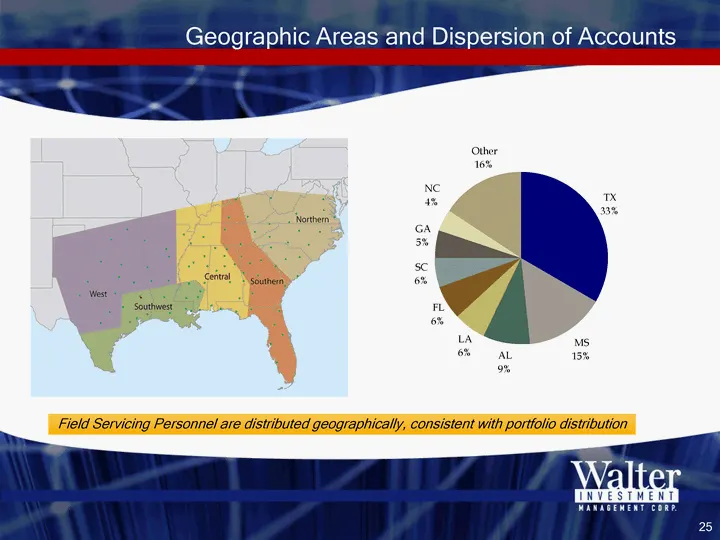
Geographic Areas and Dispersion of Accounts Field Servicing Personnel are distributed geographically, consistent with portfolio distribution TX 33% MS 15% AL 9% SC 6% FL 6% LA 6% GA 5% NC 4% Other 16%
Slide 26: Field Work Cycle for Delinquency/Default Management
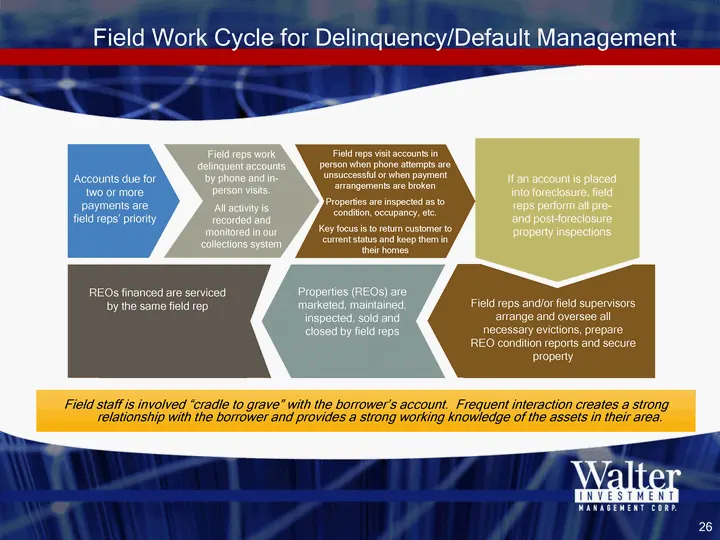
Field Work Cycle for Delinquency/Default Management Field staff is involved "cradle to grave" with the borrower's account. Frequent interaction creates a strong relationship with the borrower and provides a strong working knowledge of the assets in their area. Accounts due for two or more payments a

Slide 27: Advisory & Insurance Services
Advisory & Insurance Services
Slide 28: Advisory Services
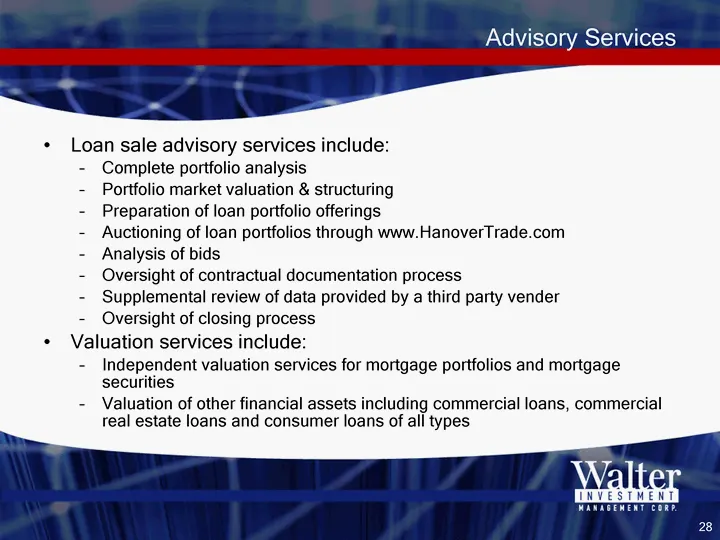
Advisory Services Loan sale advisory services include: Complete portfolio analysis Portfolio market valuation & structuring Preparation of loan portfolio offerings Auctioning of loan portfolios through www.HanoverTrade.com Analysis of bids Oversight of contractual documentation process Supplemental
Slide 29: Insurance Services
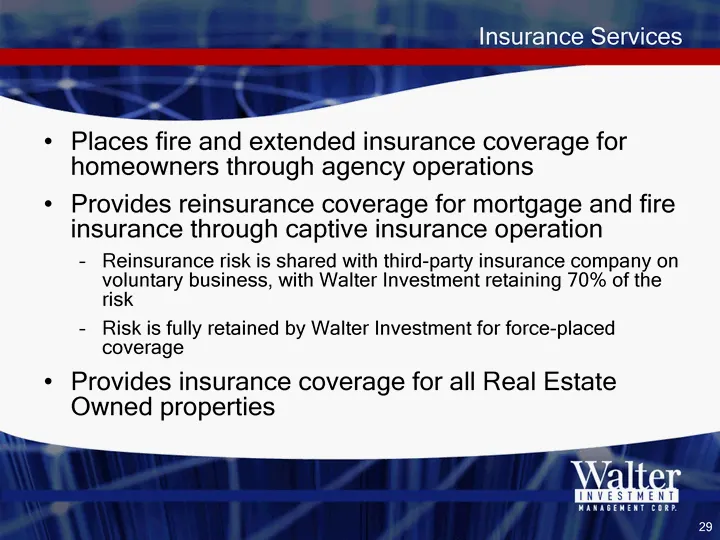
Insurance Services Places fire and extended insurance coverage for homeowners through agency operations Provides reinsurance coverage for mortgage and fire insurance through captive insurance operation Reinsurance risk is shared with third-party insurance company on voluntary business, with Walter I

Slide 30: Growth Strategy
Growth Strategy
Slide 31: Business Capabilities Subsequent to the Merger
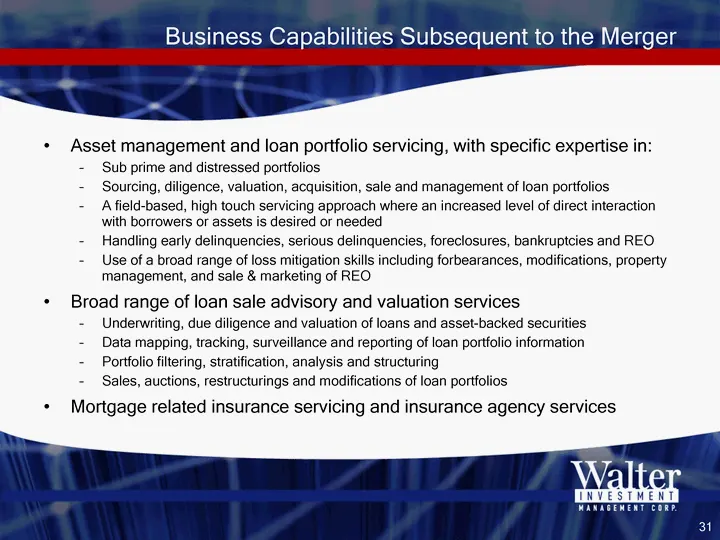
Business Capabilities Subsequent to the Merger Asset management and loan portfolio servicing, with specific expertise in: Sub prime and distressed portfolios Sourcing, diligence, valuation, acquisition, sale and management of loan portfolios A field-based, high touch servicing approach where an incr
Slide 32: Growth Initiatives
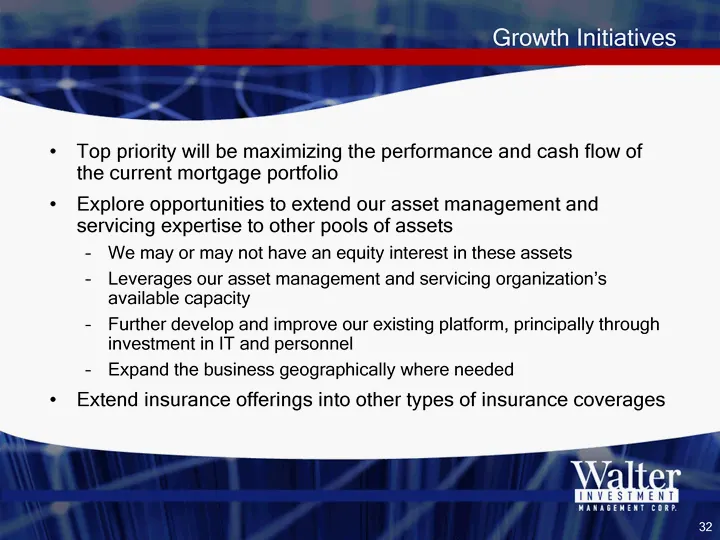
Growth Initiatives Top priority will be maximizing the performance and cash flow of the current mortgage portfolio Explore opportunities to extend our asset management and servicing expertise to other pools of assets We may or may not have an equity interest in these assets Leverages our asset manag

Slide 33: Appendix
Appendix
Slide 34: Reconciliation to GAAP Financial Statements 2008
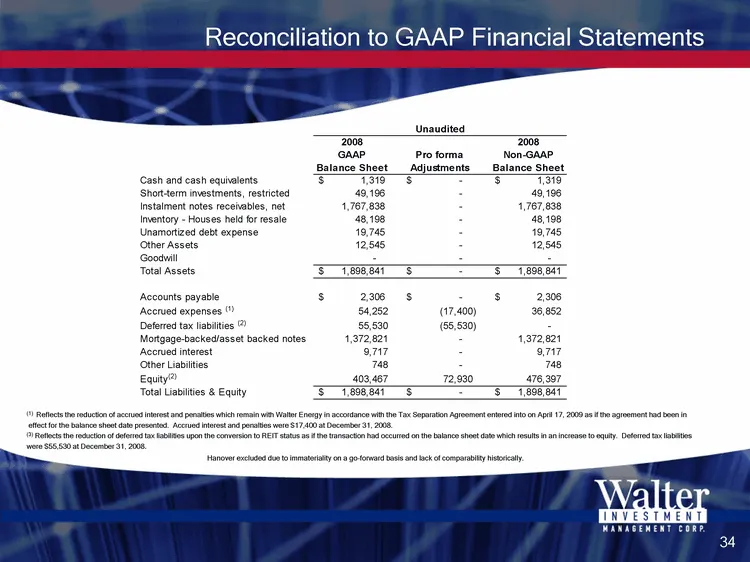
Reconciliation to GAAP Financial Statements Unaudited 2008 2008 GAAP Pro forma Non-GAAP Balance Sheet Adjustments Balance Sheet Cash and cash equivalents $ 1,319 $ — $ 1,319 Short-term investments, restricted 49,196 — 49,196 Instalment notes receivables, net 1,767,838 — 1,767,838 Inventory — Houses
Slide 35: Reconciliation to GAAP Financial Statements 2007
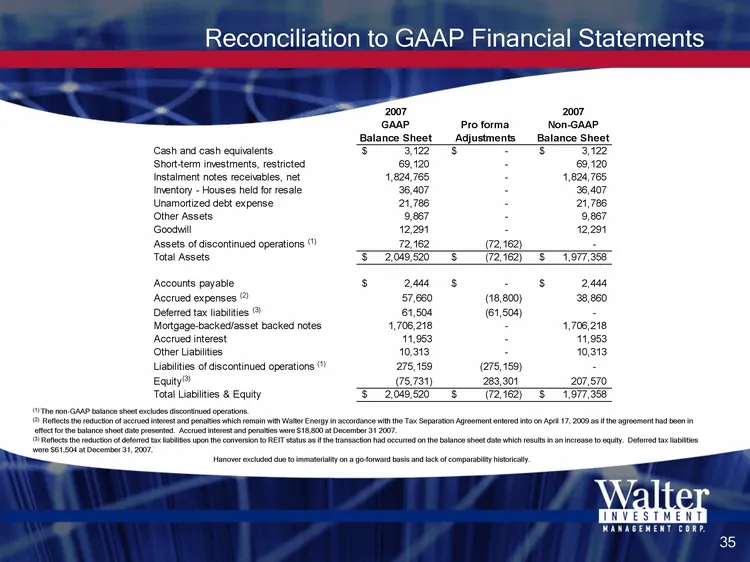
Reconciliation to GAAP Financial Statements 2007 2007 GAAP Pro forma Non-GAAP Balance Sheet Adjustments Balance Sheet Cash and cash equivalents $ 3,122 $ — $ 3,122 Short-term investments, restricted 69,120 — 69,120 Instalment notes receivables, net 1,824,765 — 1,824,765 Inventory - Houses held for r
Source: SEC EDGAR · 8-K filed May 12, 2009
More decks from Ditech Holding Corporation
 Presentation (December 2018)27 slides · Dec 14, 2018
 Q2 2018 Earnings Presentation21 slides · Aug 9, 2018
 Q1 2018 Earnings Presentation27 slides · Jun 6, 2018
 Walter Investment Management — Debt Investor Presentation (October 2017)15 slides · Oct 23, 2017
 Walter Investment Management — Debt Investor Presentation (August 2017)35 slides · Aug 1, 2017
 Walter Investment Management — Debt Investor Presentation (August 2017)5 slides · Aug 1, 2017