Aetna — J.P. Morgan 33rd Annual Healthcare Conference 2015
36 slides from Aetna's conference presentation, Jan 13, 2015
Slide 1: J.P. Morgan 33rd Annual Healthcare Conference
© Aetna Inc. 2015 All rights reserved. J.P. Morgan 33rd Annual Healthcare Conference January 13, 2015 Mark Bertolini Chairman and Chief Executive Officer
Slide 2: Cautionary Statement; Additional Information
Aetna Inc. 33rd Annual J.P. Morgan Healthcare Conference | January 13, 2015 2 Cautionary Statement; Additional Information Certain information in this presentation is forward‐looking, including our projections, estimates and expectations as to the future state of health care; our operating revenue g

Slide 3: Why Aetna
Aetna Inc. 33rd Annual J.P. Morgan Healthcare Conference | January 13, 2015 Why Aetna
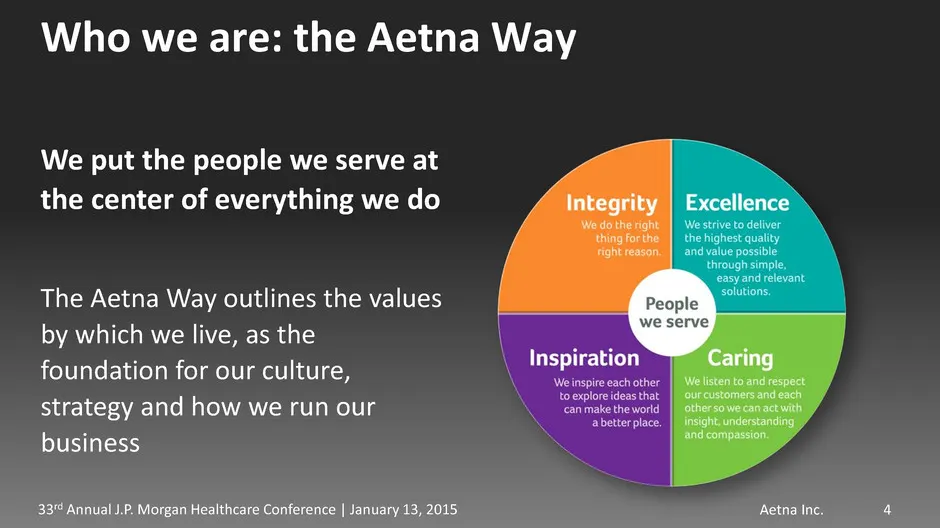
Slide 4: Who we are: the Aetna Way
Aetna Inc. 33rd Annual J.P. Morgan Healthcare Conference | January 13, 2015 We put the people we serve at the center of everything we do The Aetna Way outlines the values by which we live, as the foundation for our culture, strategy and how we run our business 4 Who we are: the Aetna Way
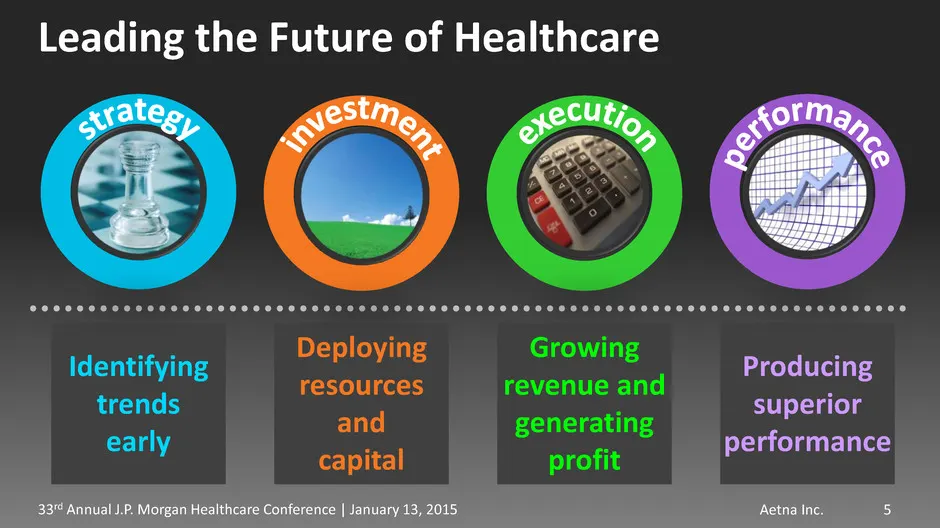
Slide 5: Leading the Future of Healthcare
Aetna Inc. 33rd Annual J.P. Morgan Healthcare Conference | January 13, 2015 Leading the Future of Healthcare 5 Identifying trends early Growing revenue and generating profit Deploying resources and capital Producing superior performance
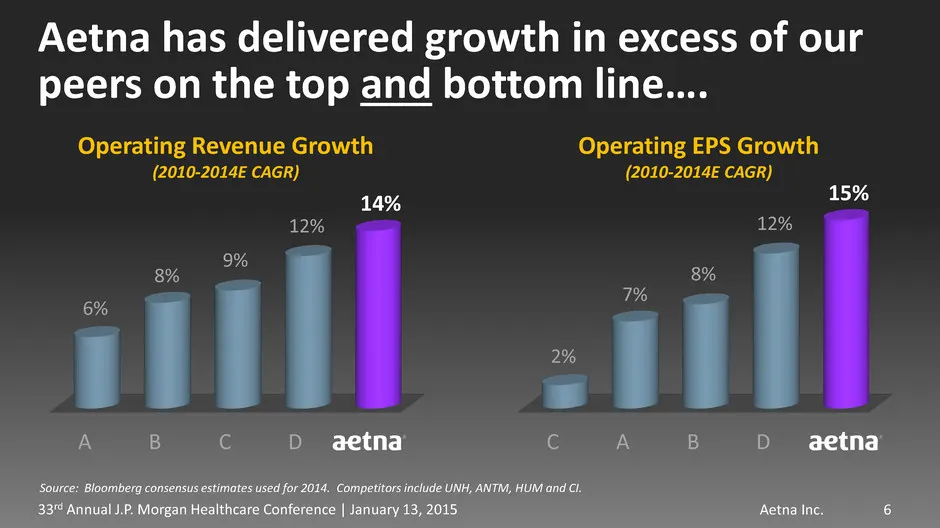
Slide 6: Aetna has delivered growth in excess of our peers
Aetna Inc. 33rd Annual J.P. Morgan Healthcare Conference | January 13, 2015 6 Aetna has delivered growth in excess of our peers on the top and bottom line…. Source: Bloomberg consensus estimates used for 2014. Competitors include UNH, ANTM, HUM and CI. C A B D 2% 7% 8% 12% 15% Operating EPS Growth (
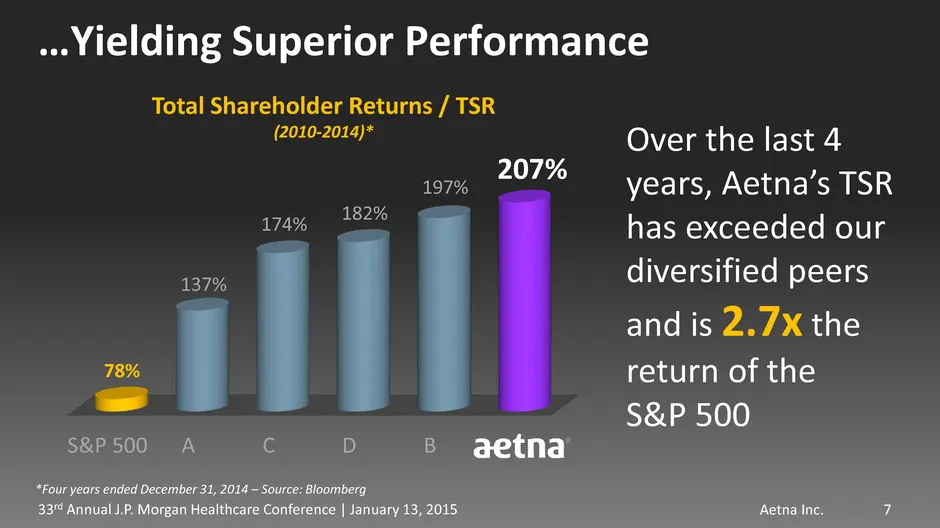
Slide 7: Yielding Superior Performance
Aetna Inc. 33rd Annual J.P. Morgan Healthcare Conference | January 13, 2015 …Yielding Superior Performance Total Shareholder Returns / TSR (2010-2014)* Over the last 4 years, Aetna’s TSR has exceeded our diversified peers and is 2.7x the return of the S&P 500 7 S&P 500 A C D B 78% 137% 174% 182% 197
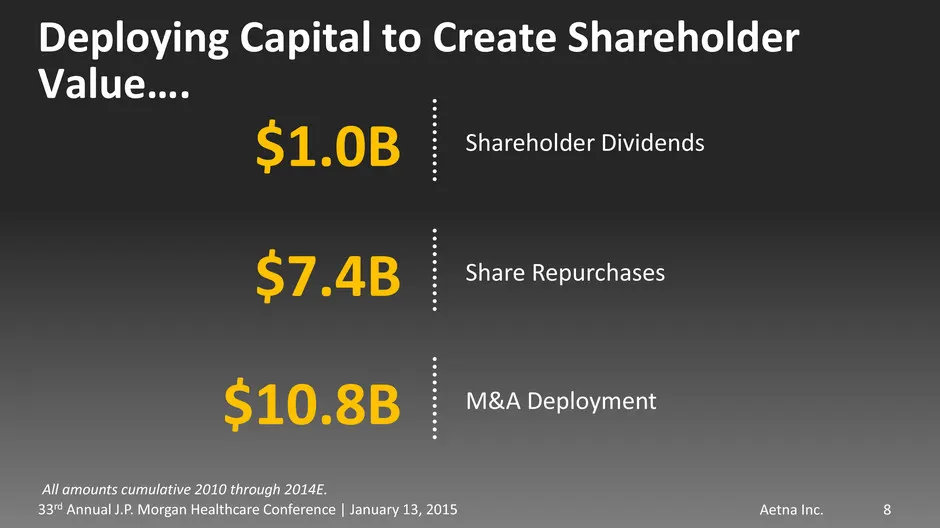
Slide 8: Deploying Capital to Create Shareholder Value
Aetna Inc. 33rd Annual J.P. Morgan Healthcare Conference | January 13, 2015 Deploying Capital to Create Shareholder Value…. 8 $1.0B Shareholder Dividends $7.4B Share Repurchases $10.8B M&A Deployment All amounts cumulative 2010 through 2014E.
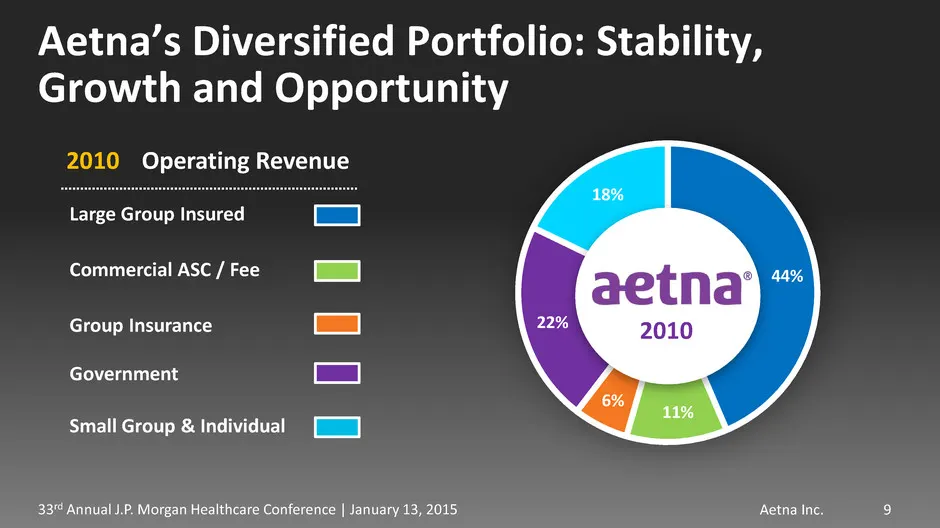
Slide 9: Aetna's Diversified Portfolio: 2010
Aetna Inc. 33rd Annual J.P. Morgan Healthcare Conference | January 13, 2015 9 Aetna’s Diversified Portfolio: Stability, Growth and Opportunity Large Group Insured Commercial ASC / Fee Group Insurance Government Small Group & Individual 2010 44% 11% 18% 22% 6% Operating Revenue 2010
Slide 10: Aetna's Diversified Portfolio: 2014E
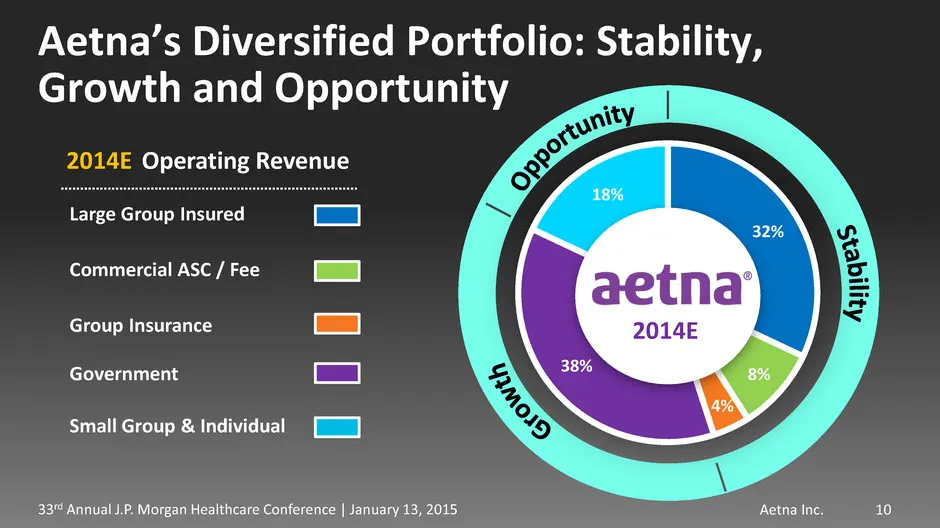
Aetna Inc. 33rd Annual J.P. Morgan Healthcare Conference | January 13, 2015 10 Aetna’s Diversified Portfolio: Stability, Growth and Opportunity Large Group Insured Commercial ASC / Fee Group Insurance Government Small Group & Individual 32% 8% 18% 38% 4% 2014E Operating Revenue 2014E
Slide 11: 2014 Expectations: The Death of Health Insurers
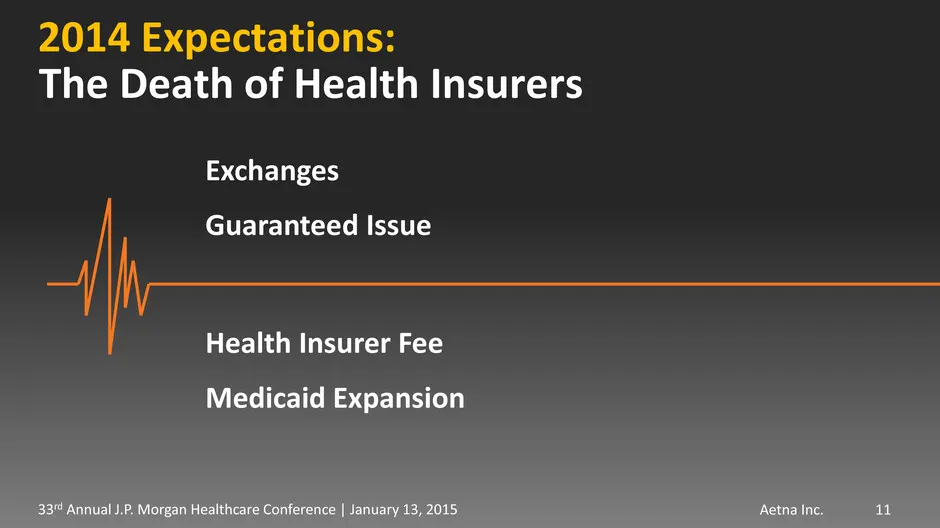
Aetna Inc. 33rd Annual J.P. Morgan Healthcare Conference | January 13, 2015 2014 Expectations: 11 Guaranteed Issue Health Insurer Fee Exchanges Medicaid Expansion The Death of Health Insurers
Slide 12: 2014 Actual: Beat and Raise
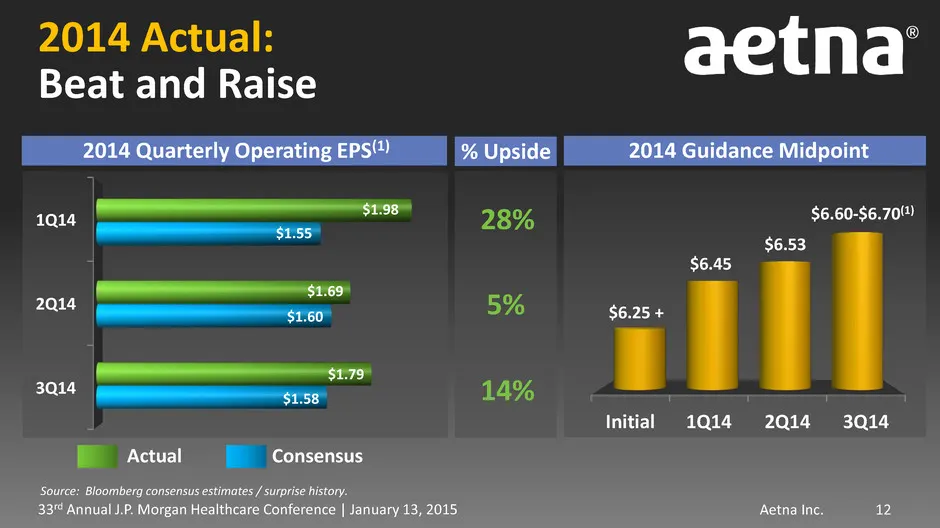
Aetna Inc. 33rd Annual J.P. Morgan Healthcare Conference | January 13, 2015 2014 Actual: Beat and Raise 12 3Q14 2Q14 1Q14 $1.55 $1.98 $1.60 $1.69 $1.58 $1.79 % Upside 28% 5% 14% Actual Consensus Initial 1Q14 2Q14 3Q14 $6.25 + $6.45 $6.53 2014 Guidance Midpoint 2014 Quarterly Operating EPS(1) Source:
Slide 13: Aetna's differentiated strategy
Aetna Inc. 33rd Annual J.P. Morgan Healthcare Conference | January 13, 2015 Aetna’s differentiated strategy
Slide 14: Einstein quote on solving problems
Aetna Inc. 33rd Annual J.P. Morgan Healthcare Conference | January 13, 2015 14 “We cannot solve our problems with the same thinking we used when we created them.” ─ALBERT EINSTEIN
Slide 15: The changing landscape: employer to retail
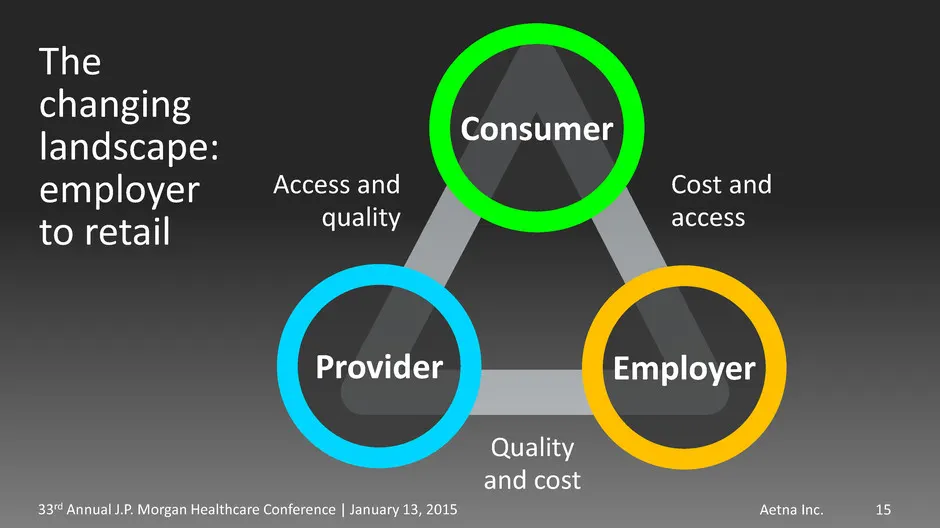
Aetna Inc. 33rd Annual J.P. Morgan Healthcare Conference | January 13, 2015 The changing landscape: employer to retail Cost and access Access and quality Quality and cost Consumer Provider Employer 15
Slide 16: The changing landscape: employer to retail
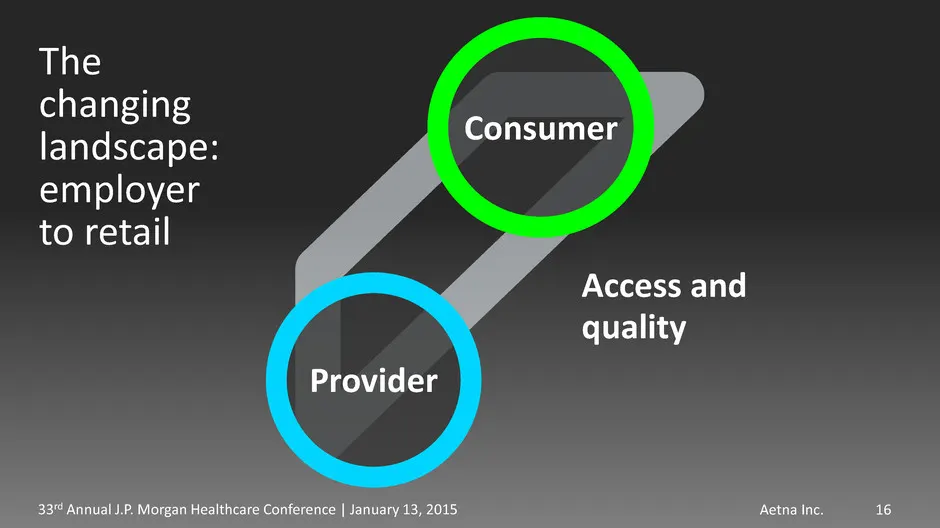
Aetna Inc. 33rd Annual J.P. Morgan Healthcare Conference | January 13, 2015 The changing landscape: employer to retail Access and quality Consumer Provider 16
Slide 17: Our business must evolve
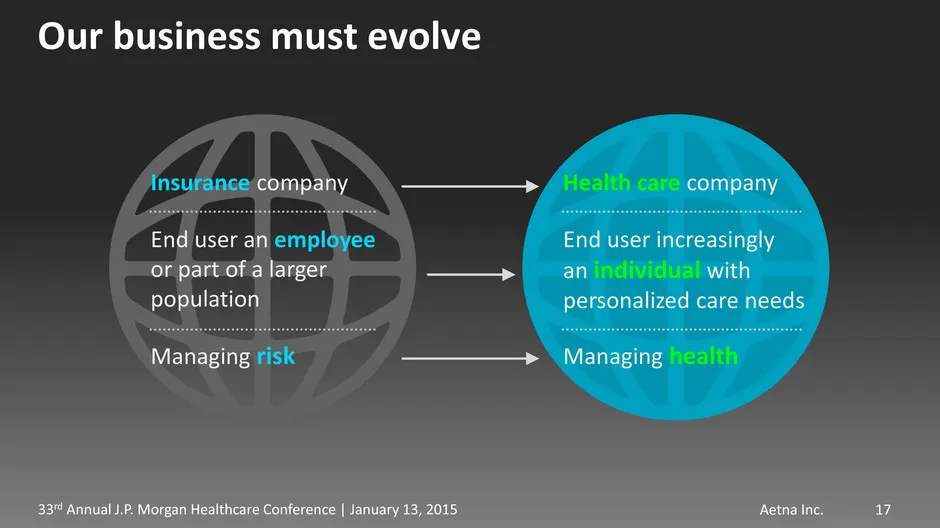
Aetna Inc. 33rd Annual J.P. Morgan Healthcare Conference | January 13, 2015 17 Our business must evolve Insurance company Managing risk End user an employee or part of a larger population Health care company End user increasingly an individual with personalized care needs Managing health
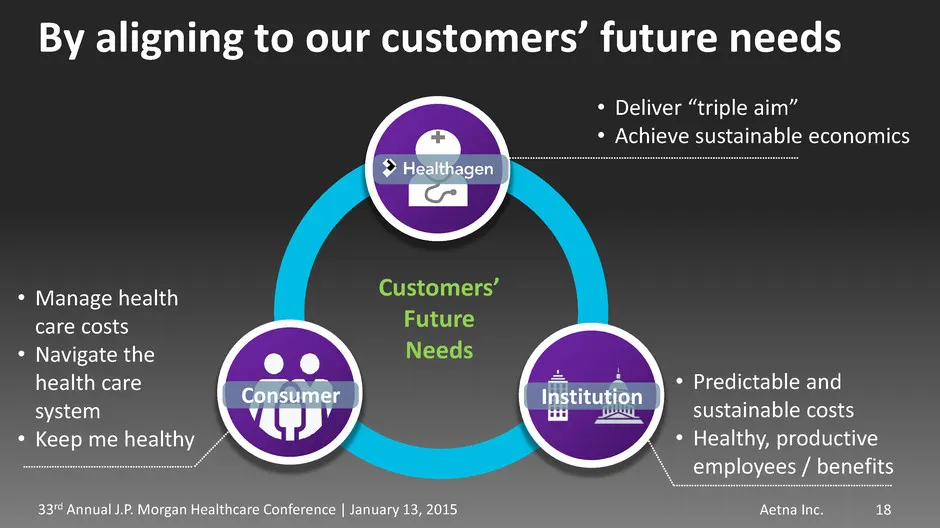
Slide 18: Aligning to our customers' future needs
Aetna Inc. 33rd Annual J.P. Morgan Healthcare Conference | January 13, 2015 18 Consumer Institution By aligning to our customers’ future needs • Manage health care costs • Navigate the health care system • Keep me healthy • Predictable and sustainable costs • Healthy, productive employees / benefits
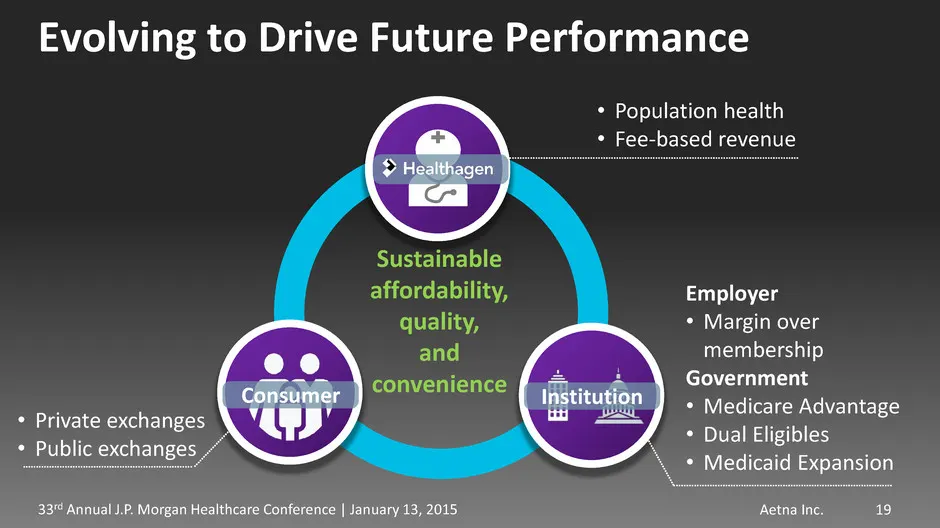
Slide 19: Evolving to Drive Future Performance
Aetna Inc. 33rd Annual J.P. Morgan Healthcare Conference | January 13, 2015 19 Consumer Institution Sustainable affordability, quality, and convenience Evolving to Drive Future Performance • Private exchanges • Public exchanges Employer • Margin over membership Government • Medicare Advantage • Dual
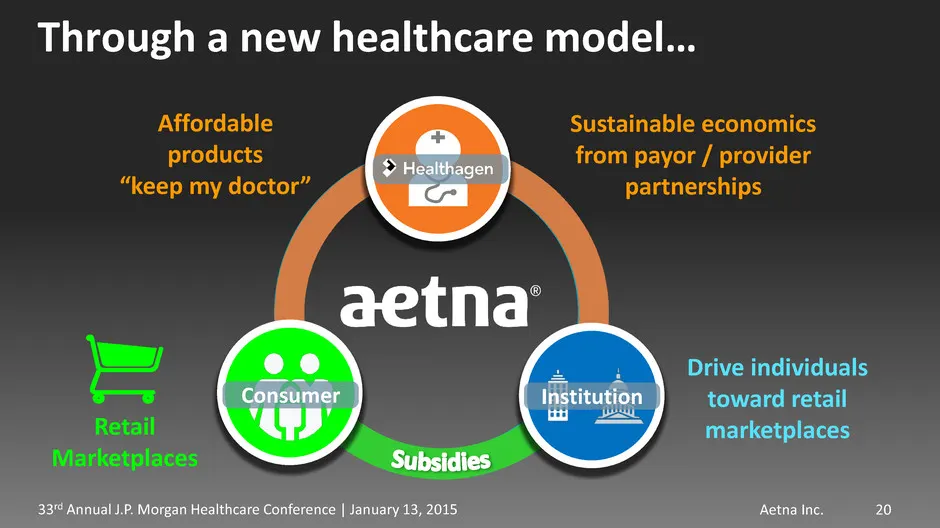
Slide 20: Through a new healthcare model
Aetna Inc. 33rd Annual J.P. Morgan Healthcare Conference | January 13, 2015 20 Institution Through a new healthcare model… Consumer Sustainable economics from payor / provider partnerships Affordable products “keep my doctor” Drive individuals toward retail marketplaces Retail Marketplaces
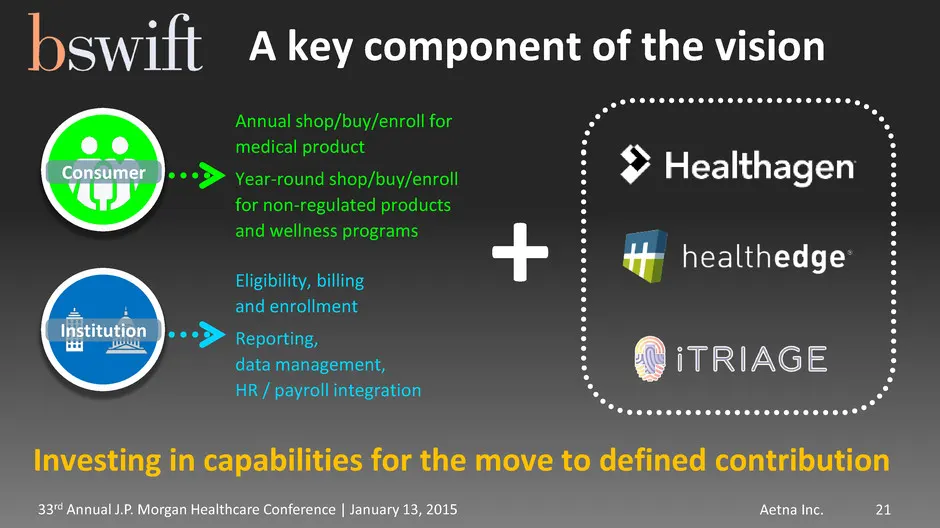
Slide 21: A key component of the vision
Aetna Inc. 33rd Annual J.P. Morgan Healthcare Conference | January 13, 2015 21 Annual shop/buy/enroll for medical product Year-round shop/buy/enroll for non-regulated products and wellness programs Eligibility, billing and enrollment Reporting, data management, HR / payroll integration Consumer Inst

Slide 22: Executing our growth strategy
Aetna Inc. 33rd Annual J.P. Morgan Healthcare Conference | January 13, 2015 Executing our growth strategy
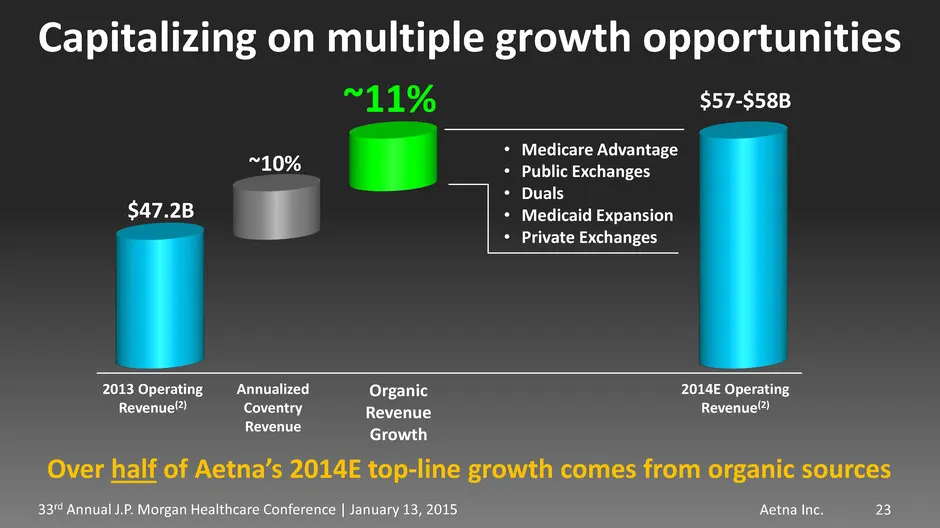
Slide 23: Capitalizing on multiple growth opportunities
Aetna Inc. 33rd Annual J.P. Morgan Healthcare Conference | January 13, 2015 Capitalizing on multiple growth opportunities 2013 Operating Revenue(2) Annualized Coventry Revenue Organic Revenue Growth 2014E Operating Revenue(2) • Medicare Advantage • Public Exchanges • Duals • Medicaid Expansion • Pri
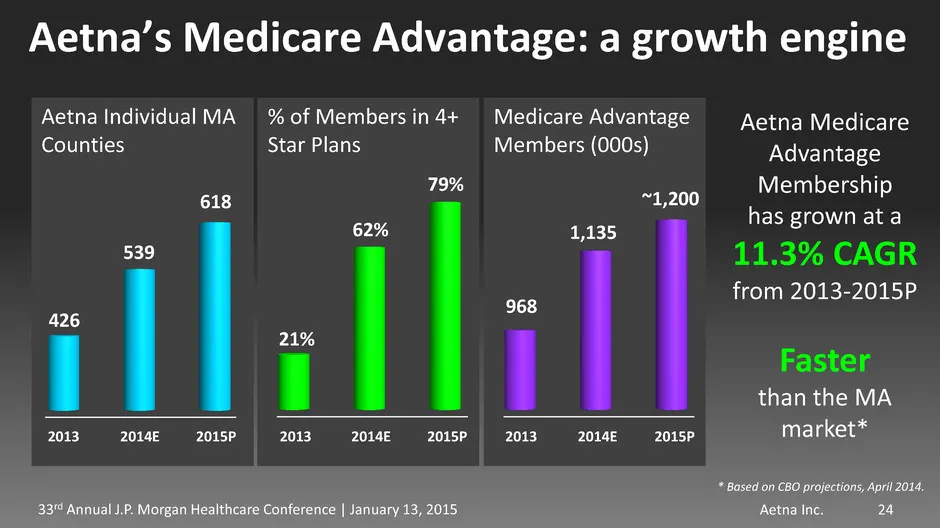
Slide 24: Aetna's Medicare Advantage: a growth engine
Aetna Inc. 33rd Annual J.P. Morgan Healthcare Conference | January 13, 2015 24 Aetna’s Medicare Advantage: a growth engine 2013 2014E 2015P 426 539 618 Aetna Individual MA Counties 2013 2014E 2015P 21% 62% 79% % of Members in 4+ Star Plans 2013 2014E 2015P 968 1,135 ~1,200 Medicare Advantage Members
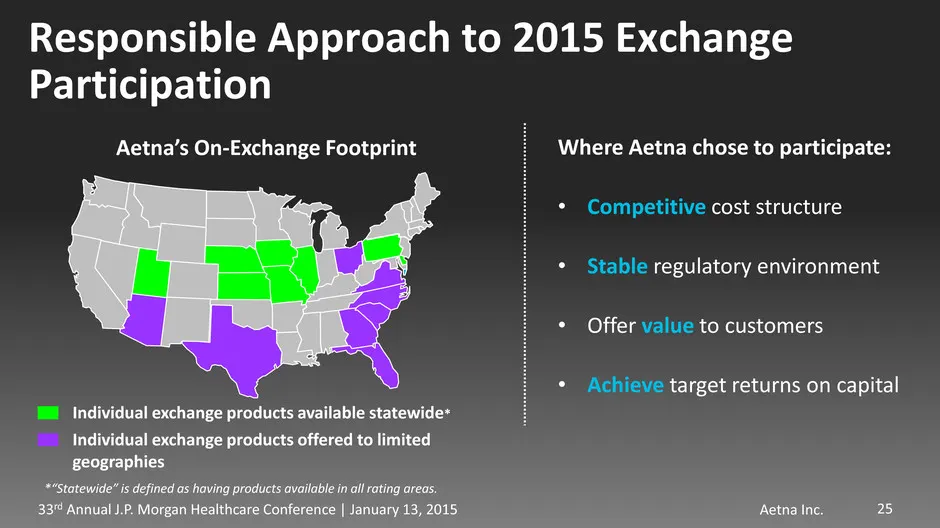
Slide 25: Responsible Approach to 2015 Exchange Participation
Aetna Inc. 33rd Annual J.P. Morgan Healthcare Conference | January 13, 2015 Responsible Approach to 2015 Exchange Participation 25 Individual exchange products available statewide* Individual exchange products offered to limited geographies *“Statewide” is defined as having products available in all
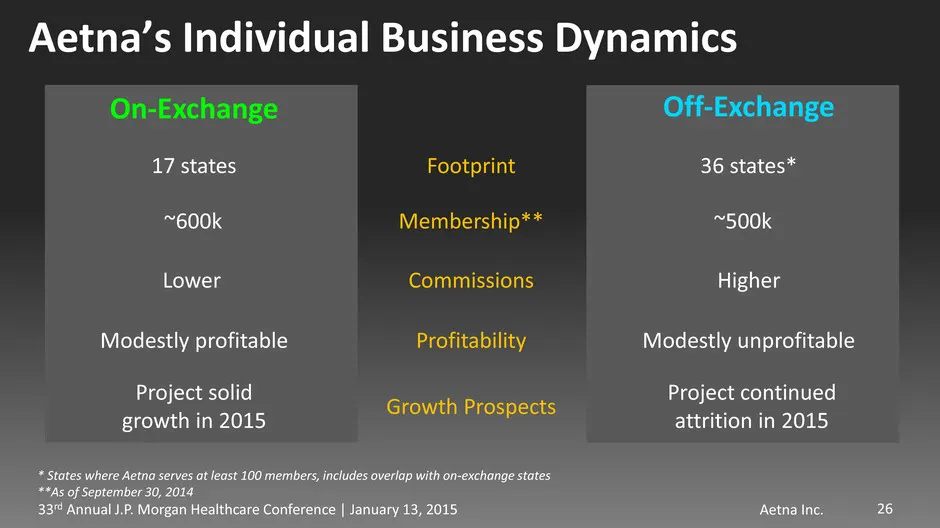
Slide 26: Aetna's Individual Business Dynamics
Aetna Inc. 33rd Annual J.P. Morgan Healthcare Conference | January 13, 2015 Aetna’s Individual Business Dynamics 26 On-Exchange Off-Exchange Commissions Footprint Growth Prospects Profitability 17 states 36 states* * States where Aetna serves at least 100 members, includes overlap with on-exchange s
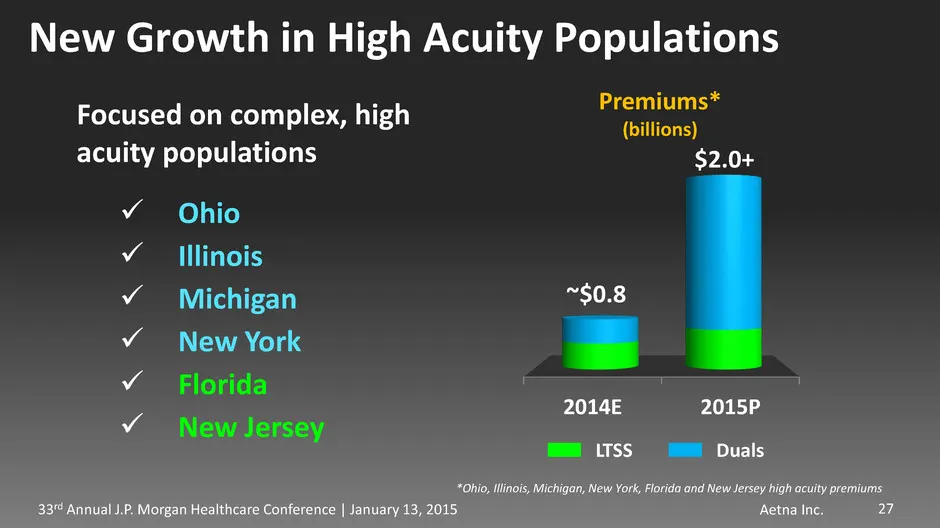
Slide 27: New Growth in High Acuity Populations
Aetna Inc. 33rd Annual J.P. Morgan Healthcare Conference | January 13, 2015 New Growth in High Acuity Populations 27 2014E 2015P LTSS Duals ~$0.8 $2.0+ Focused on complex, high acuity populations Premiums* (billions) *Ohio, Illinois, Michigan, New York, Florida and New Jersey high acuity premiums
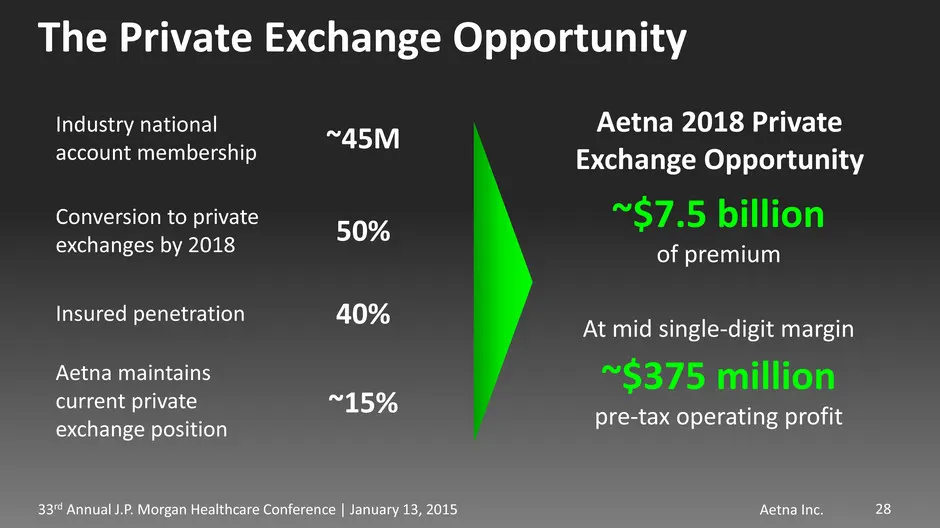
Slide 28: The Private Exchange Opportunity
Aetna Inc. 33rd Annual J.P. Morgan Healthcare Conference | January 13, 2015 The Private Exchange Opportunity 28 Industry national account membership Conversion to private exchanges by 2018 Insured penetration Aetna maintains current private exchange position ~45M 50% 40% ~15% Aetna 2018 Private Exch

Slide 29: Focused on continuing to deliver results
Aetna Inc. 33rd Annual J.P. Morgan Healthcare Conference | January 13, 2015 Focused on continuing to deliver results
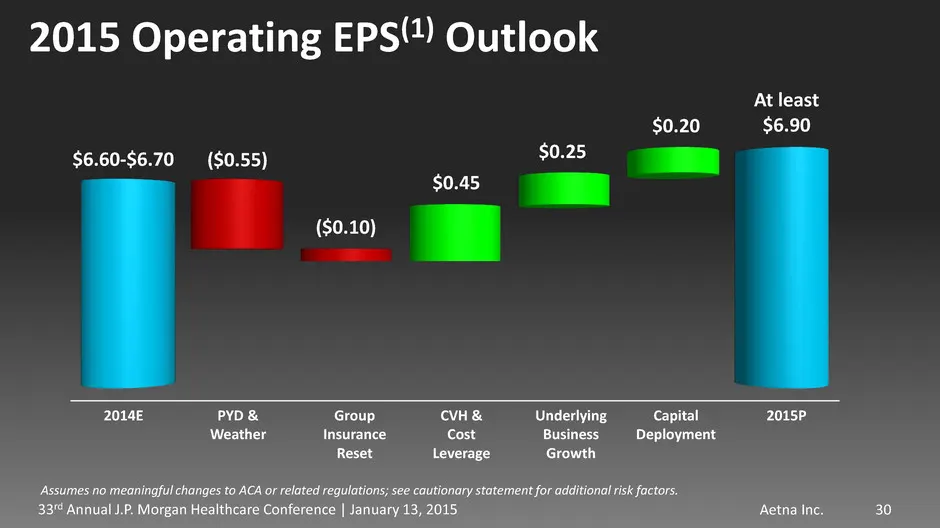
Slide 30: 2015 Operating EPS Outlook
Aetna Inc. 33rd Annual J.P. Morgan Healthcare Conference | January 13, 2015 PYD & Weather 2014E Group Insurance Reset CVH & Cost Leverage Capital Deployment Underlying Business Growth 2015P $6.60-$6.70 At least $6.90 $0.20 $0.25 $0.45 ($0.10) ($0.55) 2015 Operating EPS(1) Outlook Assumes no meaningf
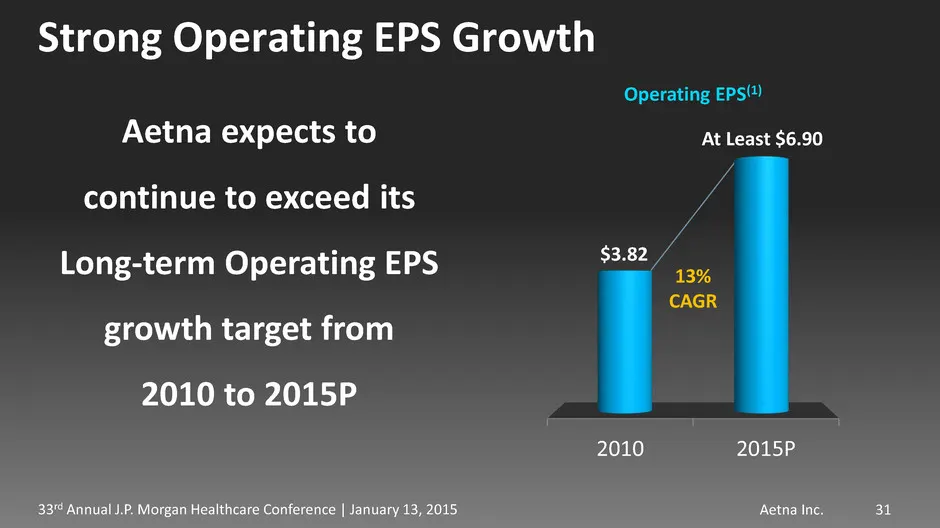
Slide 31: Strong Operating EPS Growth
Aetna Inc. 33rd Annual J.P. Morgan Healthcare Conference | January 13, 2015 Strong Operating EPS Growth 31 2010 2015P $3.82 13% CAGR Operating EPS(1) Aetna expects to continue to exceed its Long-term Operating EPS growth target from 2010 to 2015P At Least $6.90
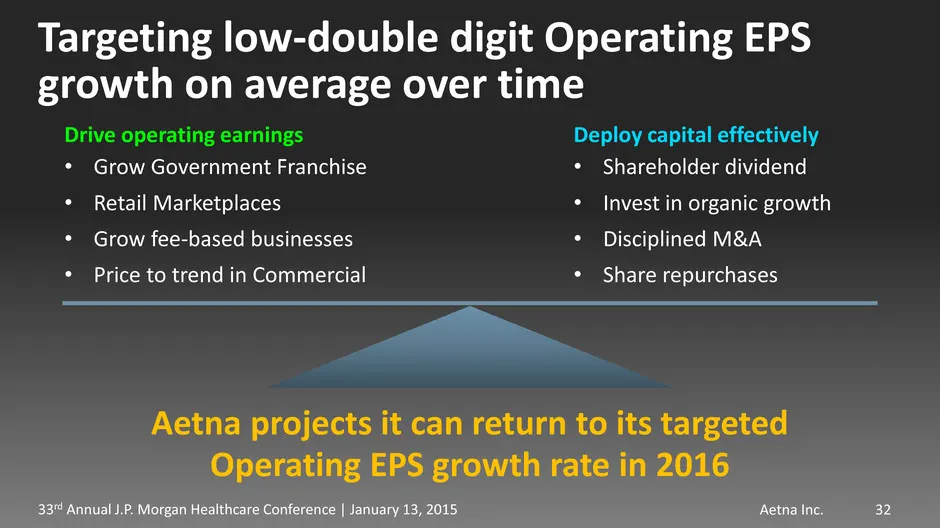
Slide 32: Targeting low-double digit Operating EPS growth over time
Aetna Inc. 33rd Annual J.P. Morgan Healthcare Conference | January 13, 2015 32 Targeting low-double digit Operating EPS growth on average over time Drive operating earnings • Grow Government Franchise • Retail Marketplaces • Grow fee-based businesses • Price to trend in Commercial Deploy capital eff
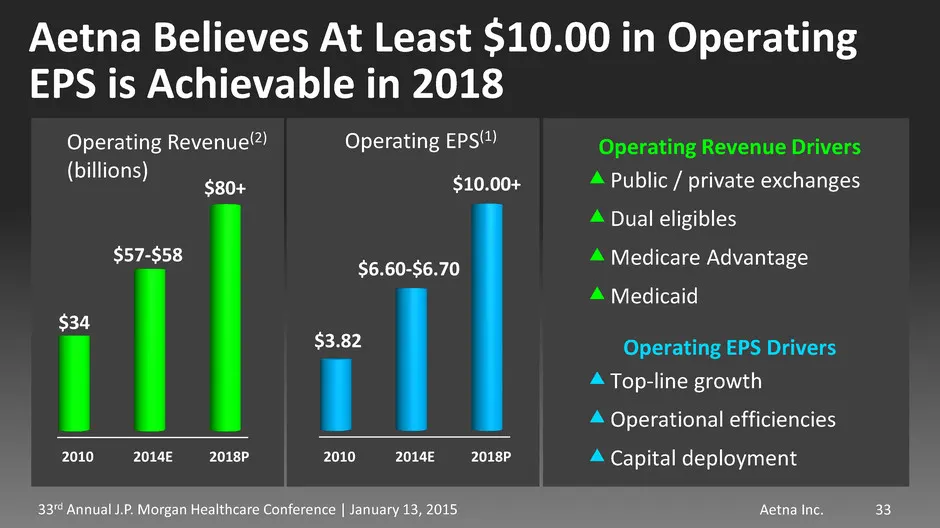
Slide 33: At Least $10.00 in Operating EPS Achievable in 2018
Aetna Inc. 33rd Annual J.P. Morgan Healthcare Conference | January 13, 2015 2010 2014E 2018P $34 Operating Revenue Drivers Public / private exchanges Dual eligibles Medicare Advantage Medicaid Aetna Believes At Least $10.00 in Operating EPS is Achievable in 2018 $57-$58 $80+ 2010 2014E 2018P $3.
Slide 34: Footnotes
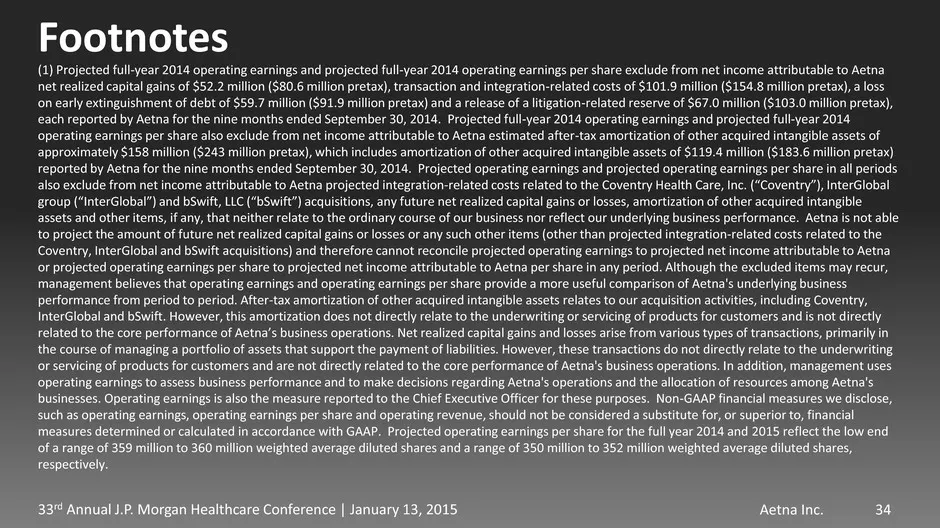
Aetna Inc. 33rd Annual J.P. Morgan Healthcare Conference | January 13, 2015 34 Footnotes (1) Projected full-year 2014 operating earnings and projected full-year 2014 operating earnings per share exclude from net income attributable to Aetna net realized capital gains of $52.2 million ($80.6 million
Slide 35: Footnotes (continued)
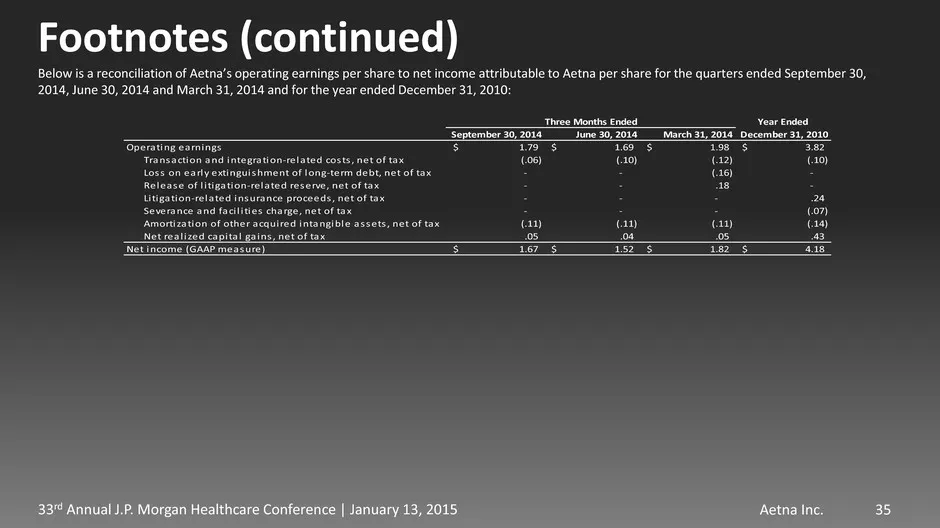
Aetna Inc. 33rd Annual J.P. Morgan Healthcare Conference | January 13, 2015 35 Footnotes (continued) Below is a reconciliation of Aetna’s operating earnings per share to net income attributable to Aetna per share for the quarters ended September 30, 2014, June 30, 2014 and March 31, 2014 and for the
Slide 36: Footnotes (continued)
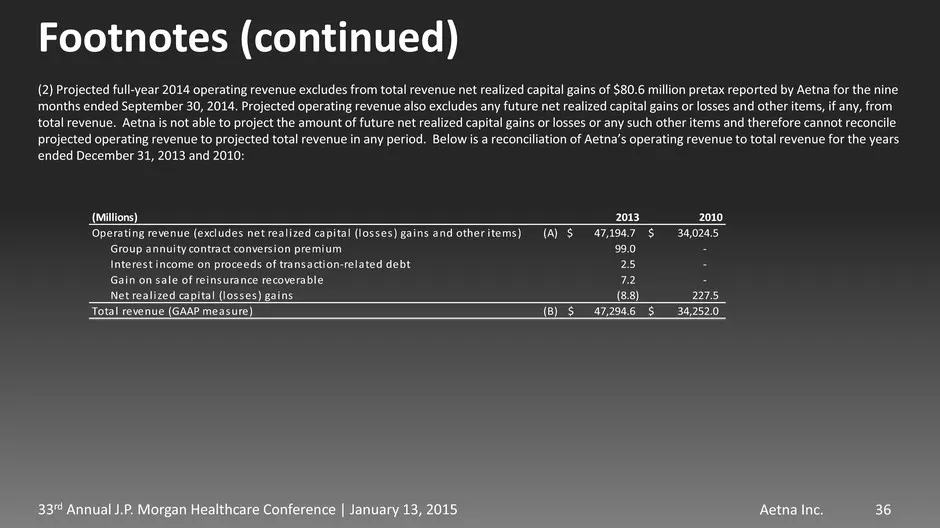
Aetna Inc. 33rd Annual J.P. Morgan Healthcare Conference | January 13, 2015 36 Footnotes (continued) (2) Projected full-year 2014 operating revenue excludes from total revenue net realized capital gains of $80.6 million pretax reported by Aetna for the nine months ended September 30, 2014. Projected
Source: SEC EDGAR · 8-K filed Jan 13, 2015
More decks from Aetna Inc
 Q3 2018 Earnings Presentation14 slides · Nov 6, 2018
 Q1 2018 Earnings Presentation38 slides · May 2, 2018
 Merger or Acquisition (February 2018)36 slides · Feb 26, 2018
 Q4 2017 Earnings Presentation35 slides · Feb 8, 2018
 Corporate Update (January 2018)14 slides · Jan 4, 2018
 J.P. Morgan 34th Annual Healthcare Conference 201628 slides · Jan 11, 2016