Medco Health Solutions — Investor Day (November 2010)
188 slides from Medco Health Solutions's investor day presentation, Nov 19, 2010
Slide 1: 2010 Analyst Day
2010 Analyst Day November 19, 2010 1

Slide 2: Welcome
Welcome Valerie C. Haertel 2 Vice President, Investor Relations
Slide 3: Forward-Looking Statement
Forward-Looking Statement 3 This presentation contains "forward-looking statements" as that term is defined in the Private Securities Litigation Reform Act of 1995. These statements involve risks and uncertainties that may cause results to differ materially from those set forth in the statements. No
Slide 4: Today's Agenda
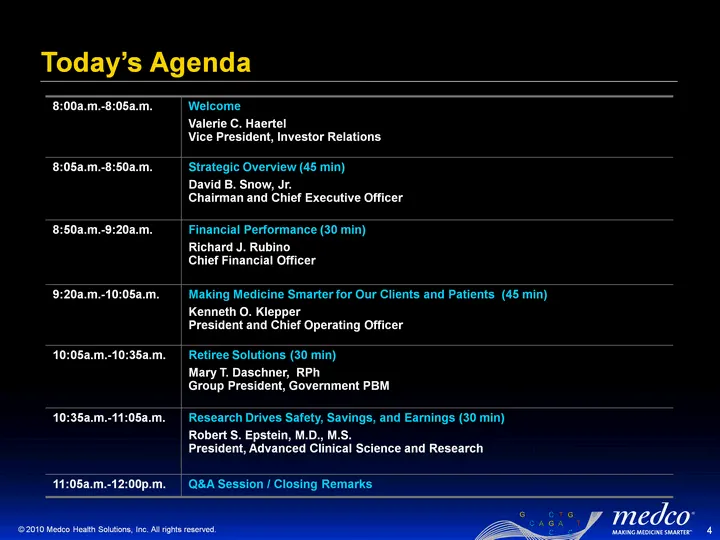
Today's Agenda 4 8:00a.m.-8:05a.m. WelcomeValerie C. Haertel Vice President, Investor Relations 8:05a.m.-8:50a.m. Strategic Overview (45 min)David B. Snow, Jr. Chairman and Chief Executive Officer 8:50a.m.-9:20a.m. Financial Performance (30 min)Richard J. Rubino Chief Financial Officer 9:20a.m.-10:0
Slide 5: Strategic Overview
Strategic Overview David B. Snow, Jr. Chairman and CEO
Slide 6: GAAP EPS Growth
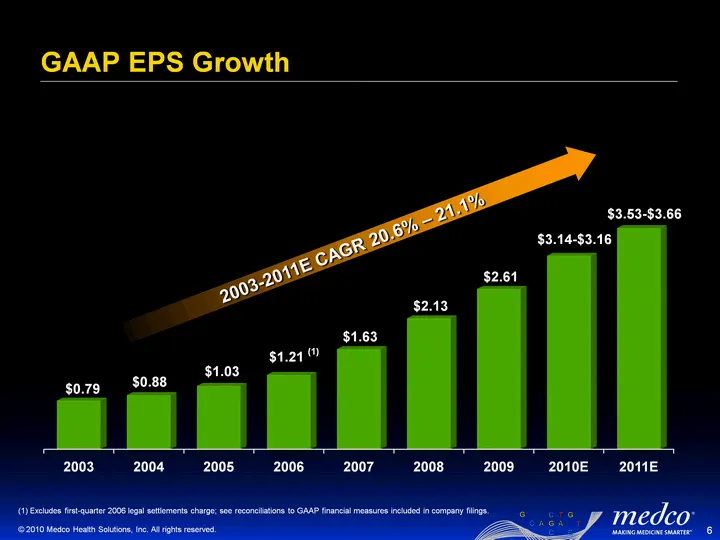
GAAP EPS Growth 6 (1) Excludes first-quarter 2006 legal settlements charge; see reconciliations to GAAP financial measures included in company filings. (CHART) 2003-2011E CAGR 20.6% - 21.1%
Slide 7: A Growing Portfolio of Drivers Fuels Growth
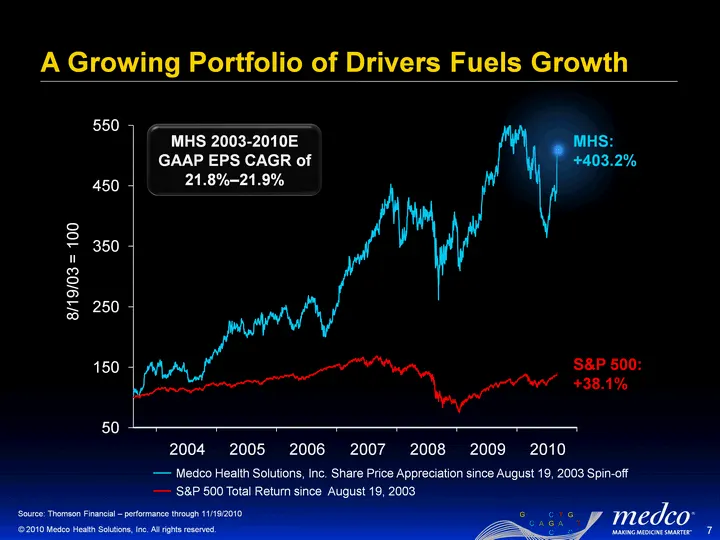
(CHART) A Growing Portfolio of Drivers Fuels Growth 7 Source: Thomson Financial - performance through 11/19/2010 8/19/03 = 100 MHS: +403.2% S&P 500: +38.1% Medco Health Solutions, Inc. Share Price Appreciation since August 19, 2003 Spin-off S&P 500 Total Return since August 19, 2003 2004 2005 2006 2
Slide 8: The Medco Growth Strategy: 2003 Growth Drivers
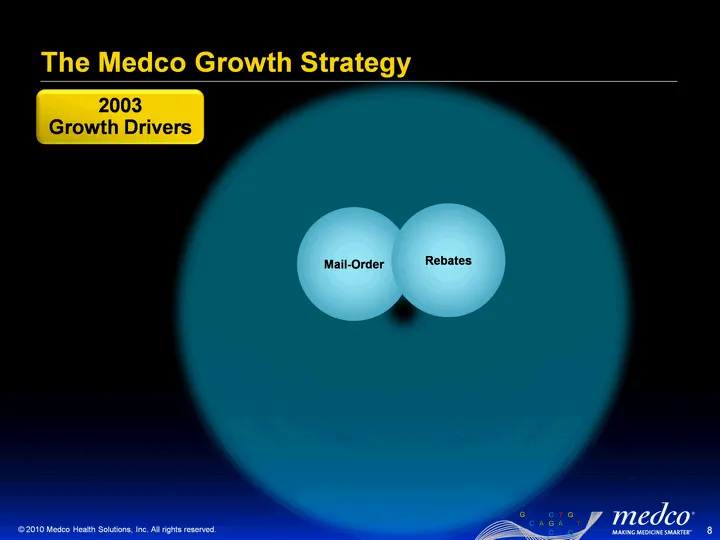
The Medco Growth Strategy 8 Mail-Order Rebates 2003 Growth Drivers
Slide 9: The Medco Growth Strategy: 2004 Growth Drivers
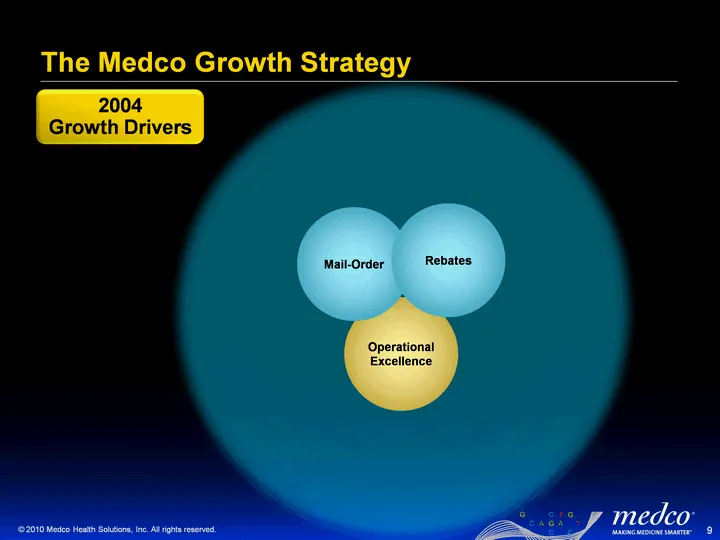
The Medco Growth Strategy 9 Operational Excellence Mail-Order Rebates 2004 Growth Drivers
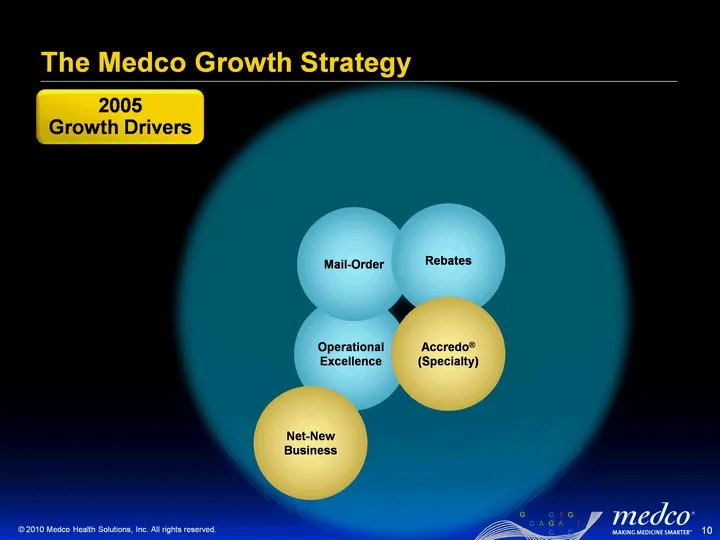
Slide 10: The Medco Growth Strategy: 2005 Growth Drivers
The Medco Growth Strategy 10 Operational Excellence Mail-Order Rebates Accredo(r) (Specialty) Net-New Business 2005 Growth Drivers
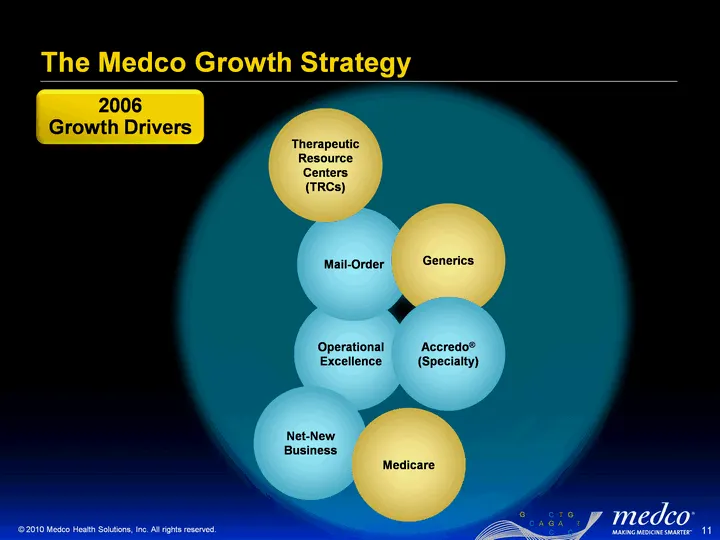
Slide 11: The Medco Growth Strategy: 2006 Growth Drivers
The Medco Growth Strategy 11 Operational Excellence Mail-Order Generics Accredo(r) (Specialty) Net-New Business Medicare Therapeutic Resource Centers (TRCs) 2006 Growth Drivers
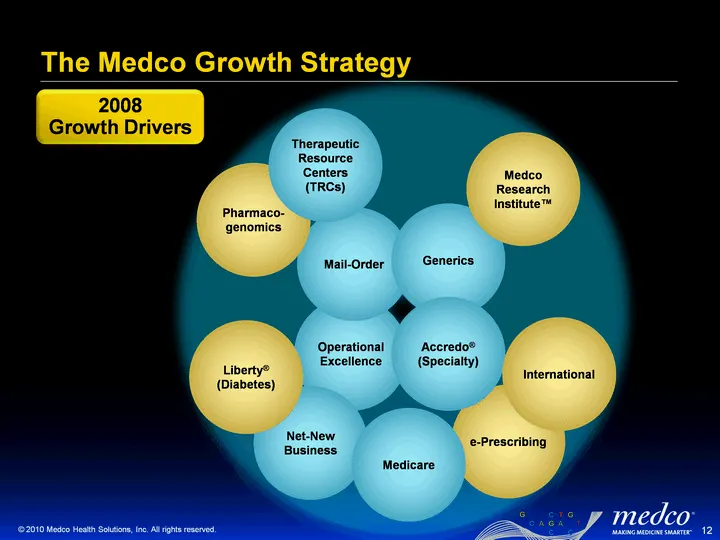
Slide 12: The Medco Growth Strategy: 2008 Growth Drivers
The Medco Growth Strategy 12 e-Prescribing Operational Excellence Mail-Order Generics Accredo(r) (Specialty) Net-New Business Medicare Liberty(r) (Diabetes) Medco Research Institute(tm) International Pharmaco- genomics Therapeutic Resource Centers (TRCs) 2008 Growth Drivers
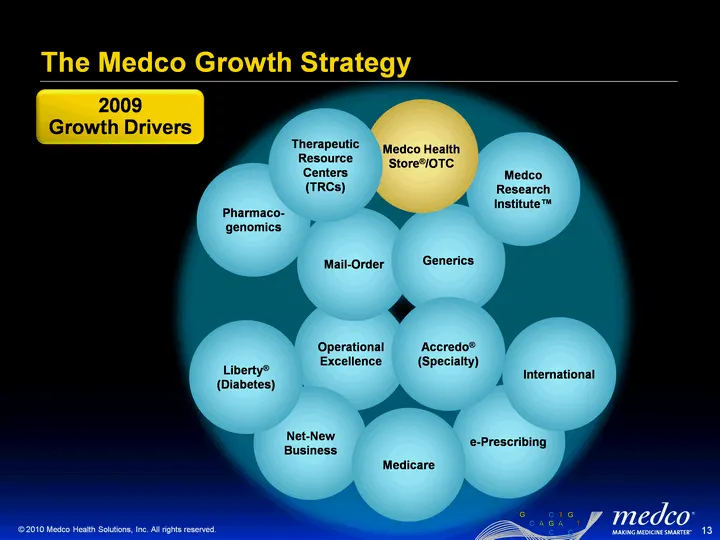
Slide 13: The Medco Growth Strategy: 2009 Growth Drivers
The Medco Growth Strategy 13 e-Prescribing Operational Excellence Mail-Order Generics Accredo(r) (Specialty) Net-New Business Medicare Liberty(r) (Diabetes) Medco Research Institute(tm) International Medco Health Store(r)/OTC Pharmaco- genomics Therapeutic Resource Centers (TRCs) 2009 Growth Drivers
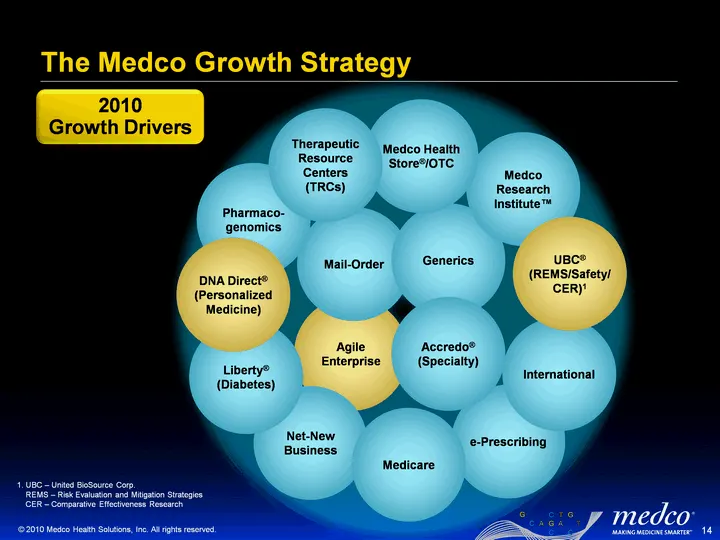
Slide 14: The Medco Growth Strategy: 2010 Growth Drivers
The Medco Growth Strategy 14 e-Prescribing Agile Enterprise Mail-Order Generics Accredo(r) (Specialty) Net-New Business Medicare Liberty(r) (Diabetes) Medco Research Institute(tm) International Medco Health Store(r)/OTC Pharmaco- genomics Therapeutic Resource Centers (TRCs) 2010 Growth Drivers UBC(r
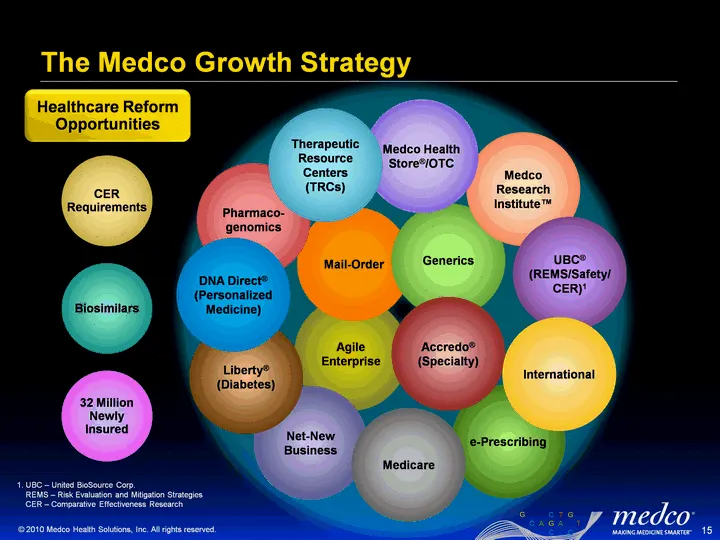
Slide 15: Healthcare Reform Opportunities
e-Prescribing Agile Enterprise Mail-Order Generics Accredo(r) (Specialty) Net-New Business Medicare Liberty(r) (Diabetes) Medco Research Institute(tm) Medco Health Store(r)/OTC UBC(r) (REMS/Safety/ CER)1 Pharmaco- genomics DNA Direct(r) (Personalized Medicine) Therapeutic Resource Centers (TRCs) CER
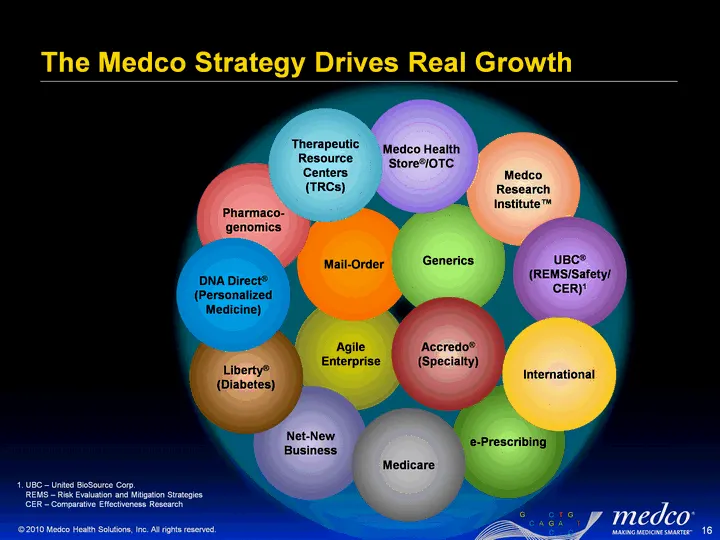
Slide 16: The Medco Strategy Drives Real Growth
e-Prescribing Agile Enterprise Mail-Order Generics Accredo(r) (Specialty) Net-New Business Medicare Liberty(r) (Diabetes) Medco Research Institute(tm) Medco Health Store(r)/OTC UBC(r) (REMS/Safety/ CER)1 Pharmaco- genomics DNA Direct(r) (Personalized Medicine) Therapeutic Resource Centers (TRCs) The
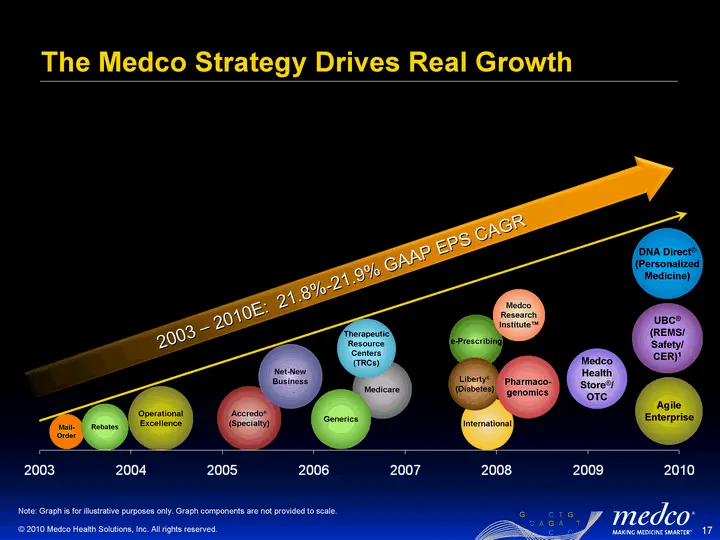
Slide 17: The Medco Strategy Drives Real Growth
The Medco Strategy Drives Real Growth 1 Note: Graph is for illustrative purposes only. Graph components are not provided to scale. Accredo(r) (Specialty) Medicare Therapeutic Resource Centers (TRCs) Net-New Business International e-Prescribing Liberty(r) (Diabetes) Mail- Order Rebates Operational Ex
Slide 18: The Medco Growth Strategy
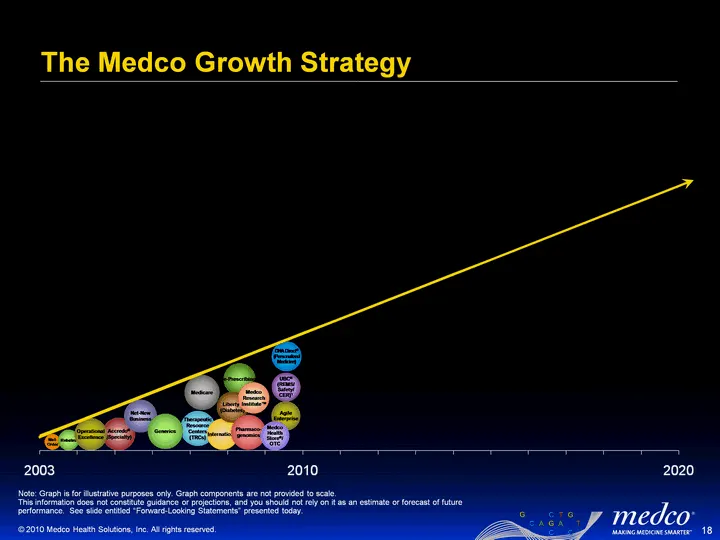
The Medco Growth Strategy 18 Note: Graph is for illustrative purposes only. Graph components are not provided to scale. This information does not constitute guidance or projections, and you should not rely on it as an estimate or forecast of future performance. See slide entitled "Forward-Looking St
Slide 19: The Medco Growth Strategy: History and Next Decade
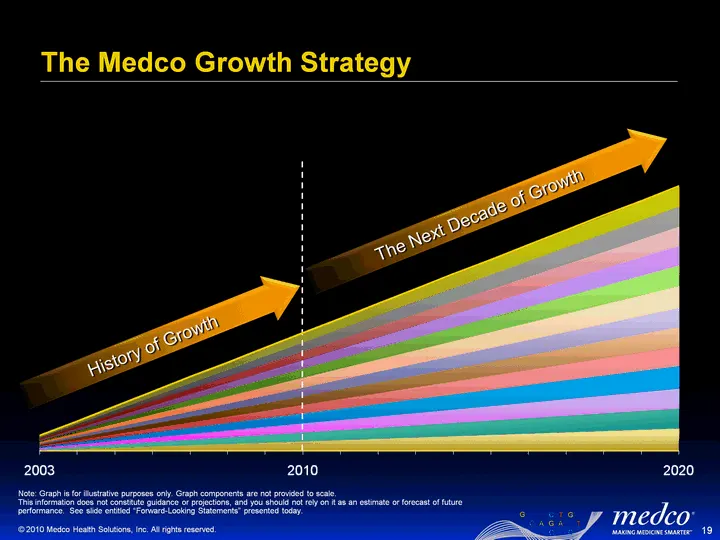
The Medco Growth Strategy 19 Note: Graph is for illustrative purposes only. Graph components are not provided to scale. This information does not constitute guidance or projections, and you should not rely on it as an estimate or forecast of future performance. See slide entitled "Forward-Looking St
Slide 20: Continued Strong GAAP EPS Growth
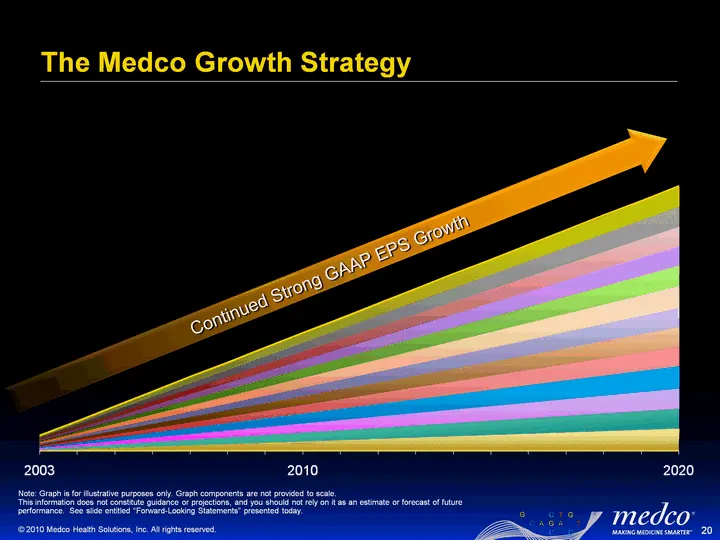
The Medco Growth Strategy 20 Note: Graph is for illustrative purposes only. Graph components are not provided to scale. This information does not constitute guidance or projections, and you should not rely on it as an estimate or forecast of future performance. See slide entitled "Forward-Looking St
Slide 21: A Strong Generic Pipeline Will Continue to Contribute
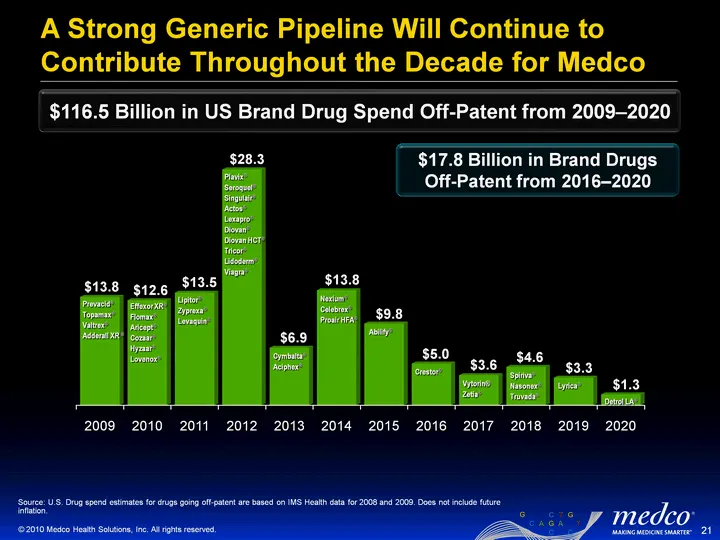
(CHART) A Strong Generic Pipeline Will Continue to Contribute Throughout the Decade for Medco 21 Source: U.S. Drug spend estimates for drugs going off-patent are based on IMS Health data for 2008 and 2009. Does not include future inflation. Prevacid(r) Topamax(r) Valtrex(r) Adderall XR (r) Effexor X
Slide 22: A Strong Generic Pipeline Will Continue to Contribute
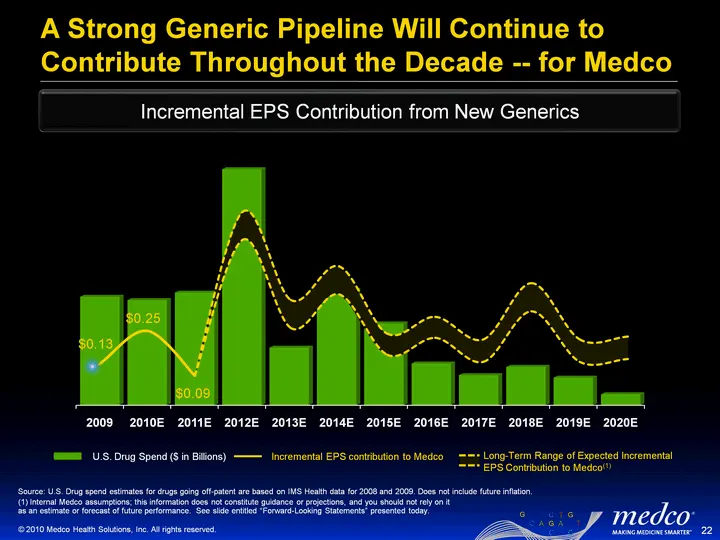
(CHART) (CHART) A Strong Generic Pipeline Will Continue to Contribute Throughout the Decade -- for Medco 22 Source: U.S. Drug spend estimates for drugs going off-patent are based on IMS Health data for 2008 and 2009. Does not include future inflation. (1) Internal Medco assumptions; this information
Slide 23: A Strong Generic Pipeline Will Continue to Contribute
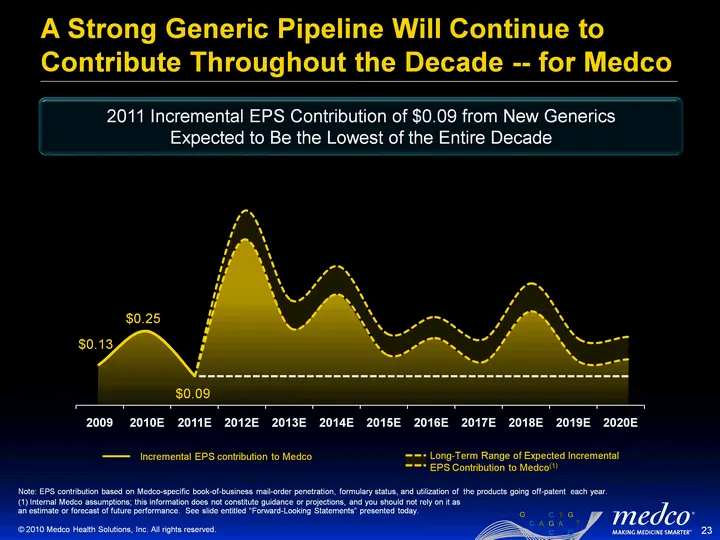
A Strong Generic Pipeline Will Continue to Contribute Throughout the Decade -- for Medco 23 Note: EPS contribution based on Medco-specific book-of-business mail-order penetration, formulary status, and utilization of the products going off-patent each year. (1) Internal Medco assumptions; this infor
Slide 24: Mail-Order Volume
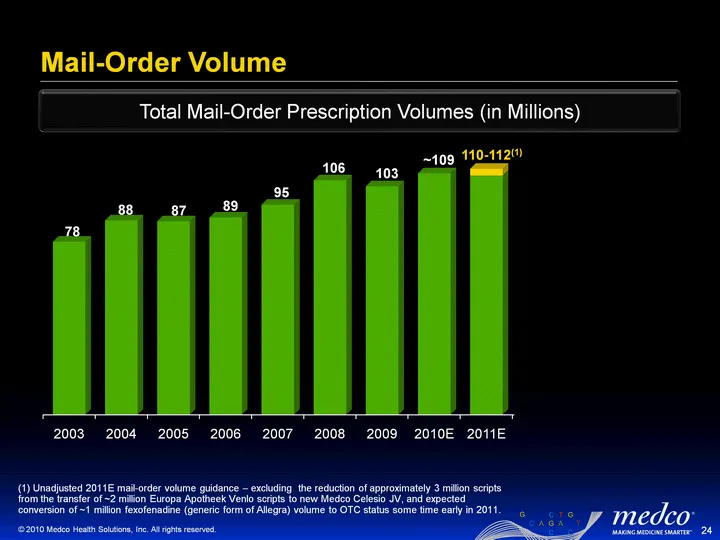
(CHART) Mail-Order Volume 24 (1) Unadjusted 2011E mail-order volume guidance - excluding the reduction of approximately 3 million scripts from the transfer of ~2 million Europa Apotheek Venlo scripts to new Medco Celesio JV, and expected conversion of ~1 million fexofenadine (generic form of Allegra
Slide 25: Mail-Order Volume
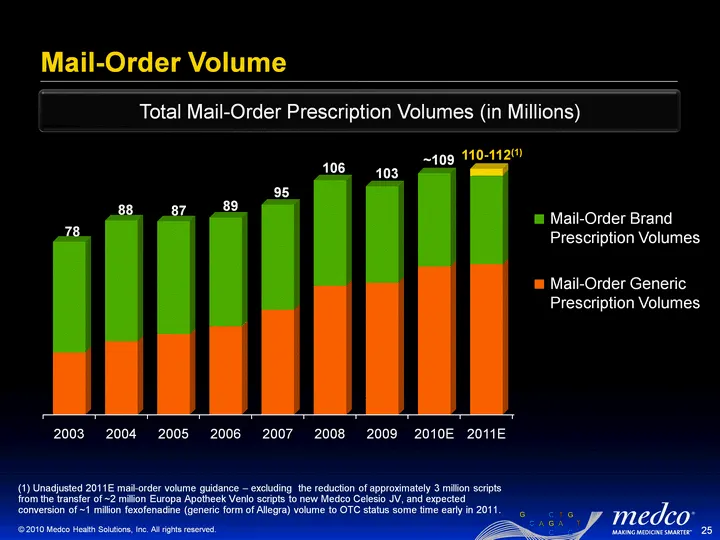
(CHART) Mail-Order Volume 25 (1) Unadjusted 2011E mail-order volume guidance - excluding the reduction of approximately 3 million scripts from the transfer of ~2 million Europa Apotheek Venlo scripts to new Medco Celesio JV, and expected conversion of ~1 million fexofenadine (generic form of Allegra
Slide 26: Strong Long-Term Generic Dispensing Rate Trends
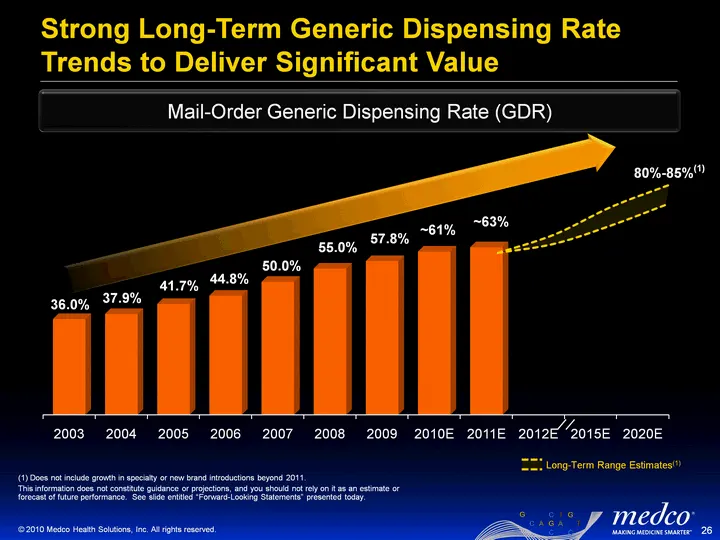
Strong Long-Term Generic Dispensing Rate Trends to Deliver Significant Value 26 (1) Does not include growth in specialty or new brand introductions beyond 2011. This information does not constitute guidance or projections, and you should not rely on it as an estimate or forecast of future performanc
Slide 27: Specialty Pharmacy is an Important Growth Engine
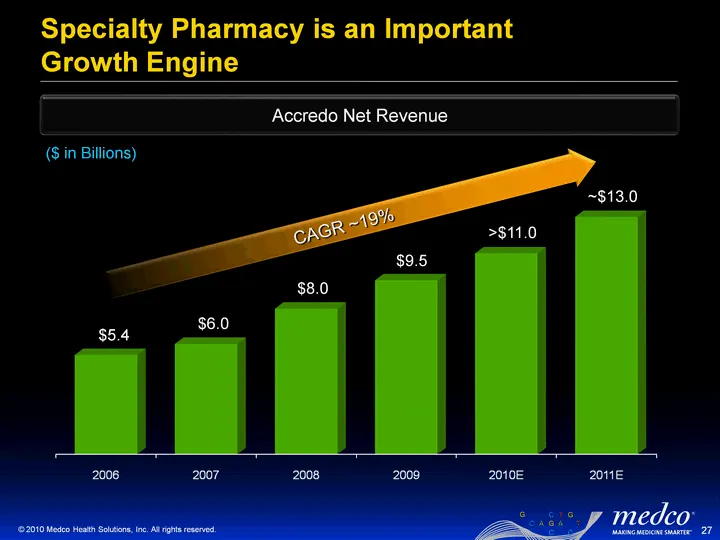
Specialty Pharmacy is an Important Growth Engine 27 ($ in Billions) Accredo Net Revenue $5.4 $9.5 $8.0 $6.0 >$11.0 ~$13.0 CAGR ~19%
Slide 28: Specialty Pharmacy is an Important Growth Engine
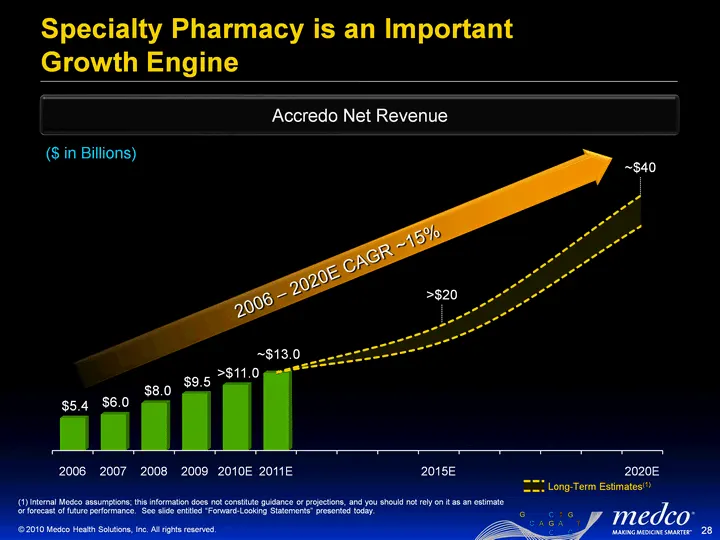
(CHART) Specialty Pharmacy is an Important Growth Engine 28 (1) Internal Medco assumptions; this information does not constitute guidance or projections, and you should not rely on it as an estimate or forecast of future performance. See slide entitled "Forward-Looking Statements" presented today. A
Slide 29: Over 600 New Drugs in the Specialty Pipeline
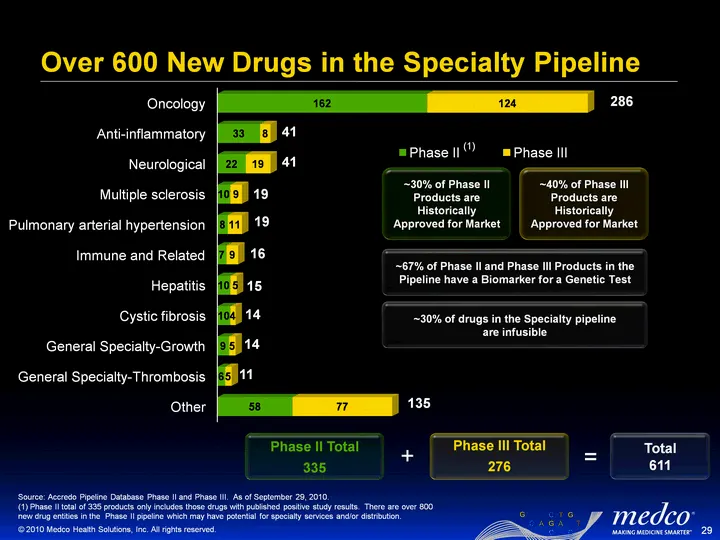
Over 600 New Drugs in the Specialty Pipeline 29 29 286 41 41 19 19 16 15 14 14 11 135 Phase II Total 335 Phase III Total 276 Total 611 Source: Accredo Pipeline Database Phase II and Phase III. As of September 29, 2010. (1) Phase II total of 335 products only includes those drugs with published posit
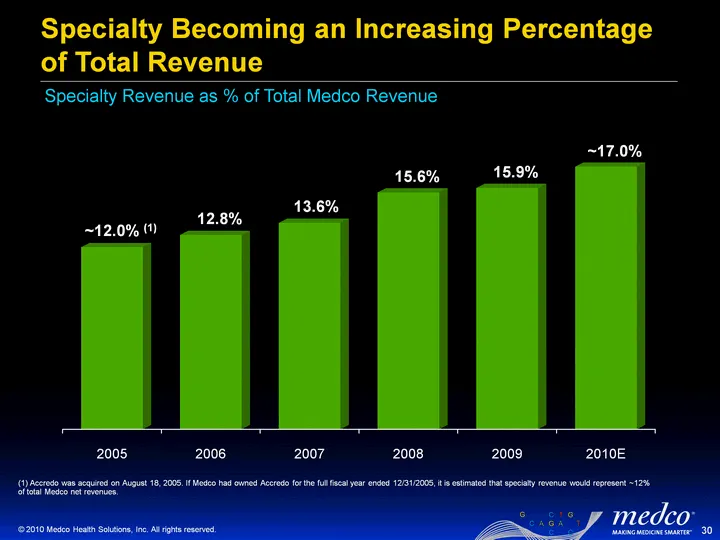
Slide 30: Specialty Becoming an Increasing Percentage of Total Revenue
(CHART) Specialty Becoming an Increasing Percentage of Total Revenue 30 Specialty Revenue as % of Total Medco Revenue (1) Accredo was acquired on August 18, 2005. If Medco had owned Accredo for the full fiscal year ended 12/31/2005, it is estimated that specialty revenue would represent ~12% of tota
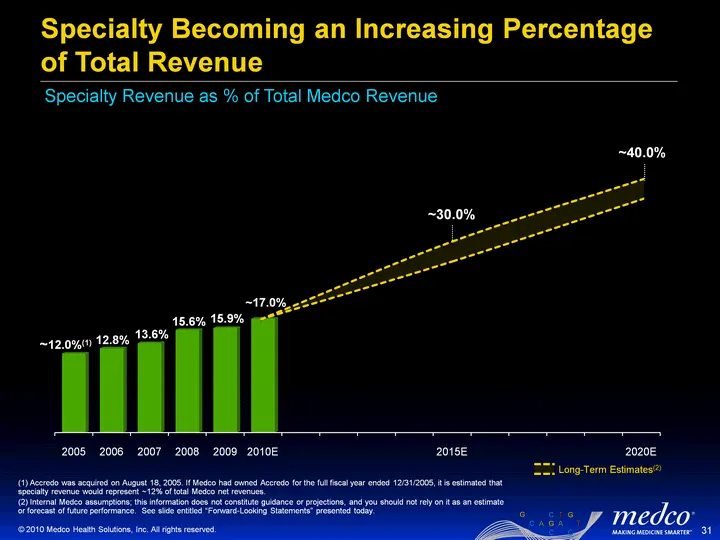
Slide 31: Specialty Becoming an Increasing Percentage of Total Revenue
~30.0% ~40.0% (CHART) (CHART) Specialty Becoming an Increasing Percentage of Total Revenue 31 Specialty Revenue as % of Total Medco Revenue (1) Accredo was acquired on August 18, 2005. If Medco had owned Accredo for the full fiscal year ended 12/31/2005, it is estimated that specialty revenue would
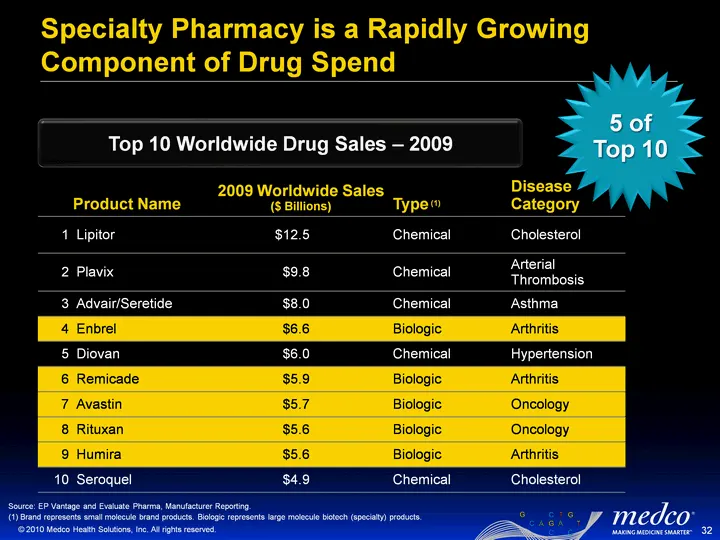
Slide 32: Specialty Pharmacy is a Rapidly Growing Component of Drug Spend
Specialty Pharmacy is a Rapidly Growing Component of Drug Spend 32 Source: EP Vantage and Evaluate Pharma, Manufacturer Reporting. (1) Brand represents small molecule brand products. Biologic represents large molecule biotech (specialty) products. Product Name Product Name 2009 Worldwide Sales ($ Bi
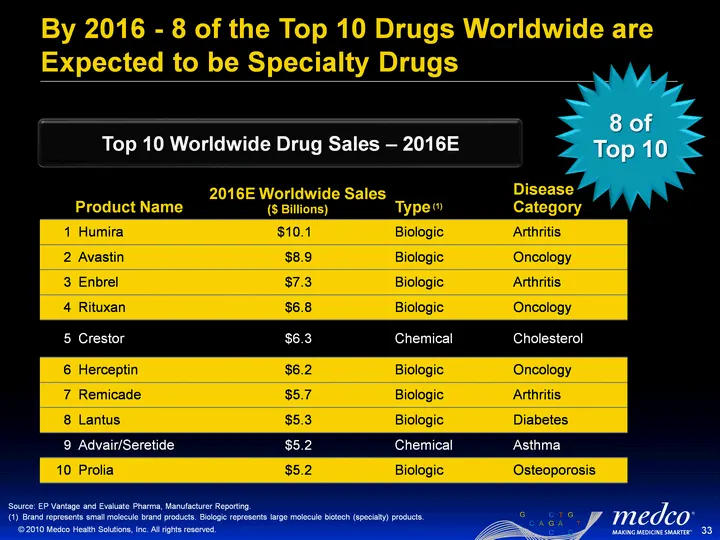
Slide 33: By 2016 Most Top Drugs Expected to be Specialty Drugs
By 2016 - 8 of the Top 10 Drugs Worldwide are Expected to be Specialty Drugs 33 Top 10 Worldwide Drug Sales - 2016E Product Name Product Name 2016E Worldwide Sales ($ Billions) Type (1) Disease Category 1 Humira $10.1 Biologic Arthritis 2 Avastin $8.9 Biologic Oncology 3 Enbrel $7.3 Biologic Arthrit
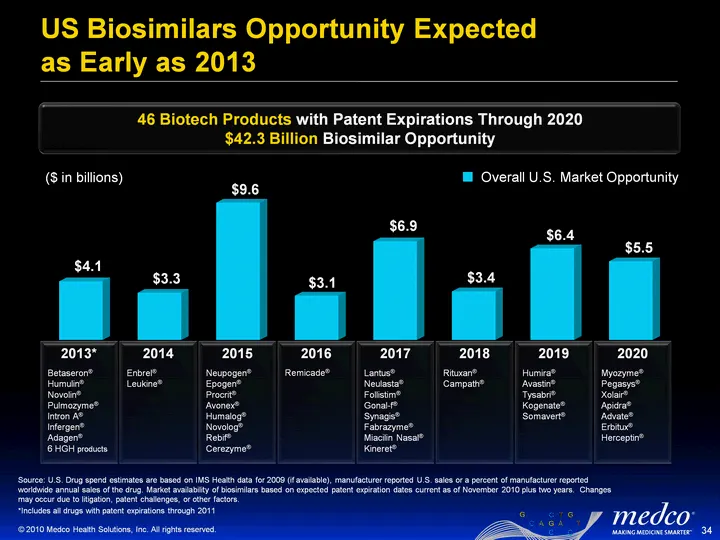
Slide 34: US Biosimilars Opportunity Expected as Early as 2013
2013* Betaseron(r) Humulin(r) Novolin(r) Pulmozyme(r) Intron A(r) Infergen(r) Adagen(r) 6 HGH products US Biosimilars Opportunity Expected as Early as 2013 34 Source: U.S. Drug spend estimates are based on IMS Health data for 2009 (if available), manufacturer reported U.S. sales or a percent of manu
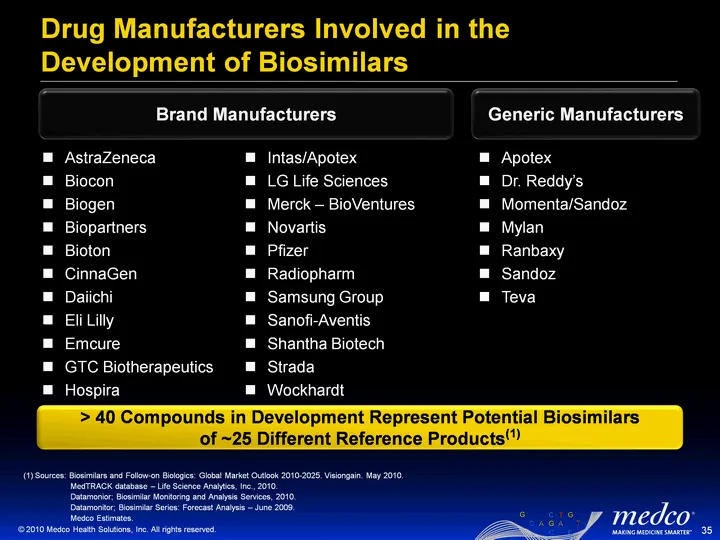
Slide 35: Drug Manufacturers Involved in the Development of Biosimilars
Drug Manufacturers Involved in the Development of Biosimilars 35 Apotex Dr. Reddy's Momenta/Sandoz Mylan Ranbaxy Sandoz Teva AstraZeneca Biocon Biogen Biopartners Bioton CinnaGen Daiichi Eli Lilly Emcure GTC Biotherapeutics Hospira > 40 Compounds in Development Represent Potential Biosimilars of ~25
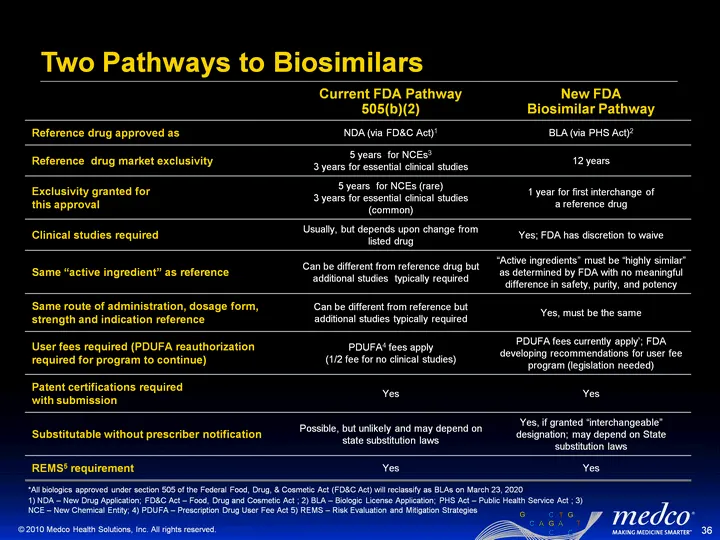
Slide 36: Two Pathways to Biosimilars
Two Pathways to Biosimilars 36 Current FDA Pathway 505(b)(2) New FDA Biosimilar Pathway Reference drug approved as NDA (via FD&C Act)1 BLA (via PHS Act)2 Reference drug market exclusivity 5 years for NCEs33 years for essential clinical studies 12 years Exclusivity granted for this approval 5 years f
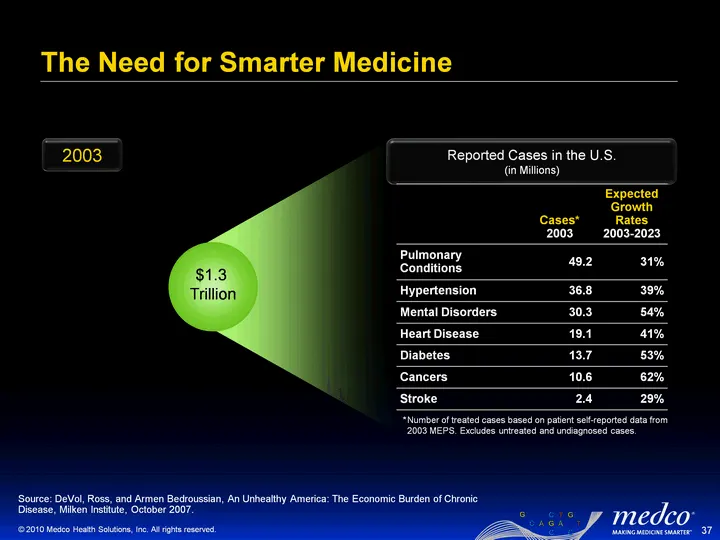
Slide 37: The Need for Smarter Medicine
The Need for Smarter Medicine 37 Source: DeVol, Ross, and Armen Bedroussian, An Unhealthy America: The Economic Burden of Chronic Disease, Milken Institute, October 2007. 2003 Cases* 2003 Expected Growth Rates 2003-2023 Pulmonary Conditions 49.2 31% Hypertension 36.8 39% Mental Disorders 30.3 54% He
Slide 38: Economic Burden of Chronic and Complex Disease
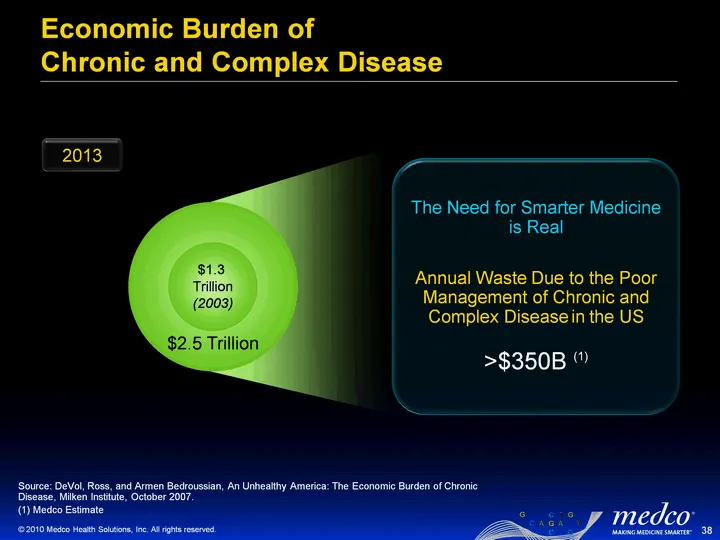
Economic Burden of Chronic and Complex Disease 38 Source: DeVol, Ross, and Armen Bedroussian, An Unhealthy America: The Economic Burden of Chronic Disease, Milken Institute, October 2007. (1) Medco Estimate The Need for Smarter Medicine is Real Annual Waste Due to the Poor Management of Chronic and
Slide 39: Economic Burden of Chronic and Complex Disease
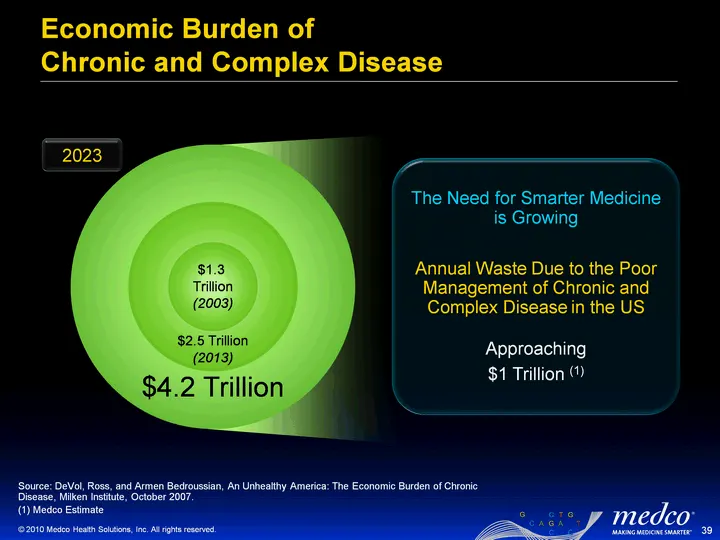
$4.2 Trillion Economic Burden of Chronic and Complex Disease 39 Source: DeVol, Ross, and Armen Bedroussian, An Unhealthy America: The Economic Burden of Chronic Disease, Milken Institute, October 2007. (1) Medco Estimate The Need for Smarter Medicine is Growing Annual Waste Due to the Poor Managemen
Slide 40: Medco's Clinical Innovations are Making Medicine Smarter
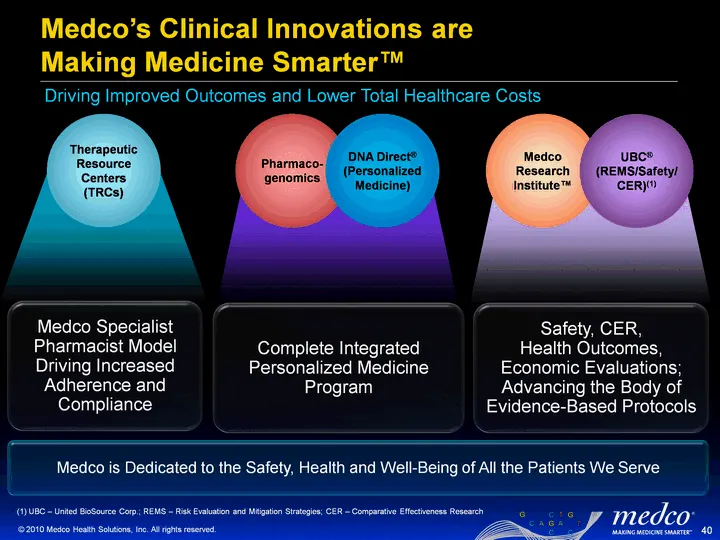
Medco's Clinical Innovations are Making Medicine Smarter(tm) 40 Driving Improved Outcomes and Lower Total Healthcare Costs Therapeutic Resource Centers (TRCs) Pharmaco- genomics DNA Direct(r) (Personalized Medicine) Medco Specialist Pharmacist Model Driving Increased Adherence and Compliance Complet
Slide 41: Medco is Exporting Smarter Medicine
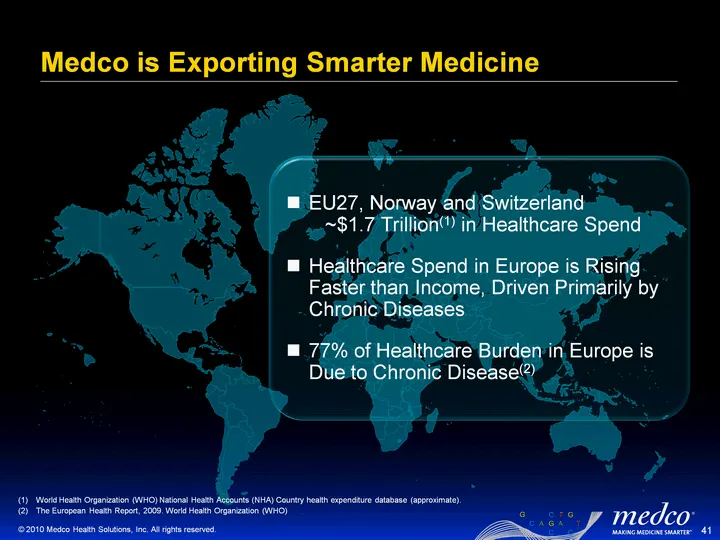
Medco is Exporting Smarter Medicine 41 World Health Organization (WHO) National Health Accounts (NHA) Country health expenditure database (approximate). The European Health Report, 2009. World Health Organization (WHO) EU27, Norway and Switzerland ~$1.7 Trillion(1) in Healthcare Spend Healthcare Spe
Slide 42: Medco is Exporting Smarter Medicine
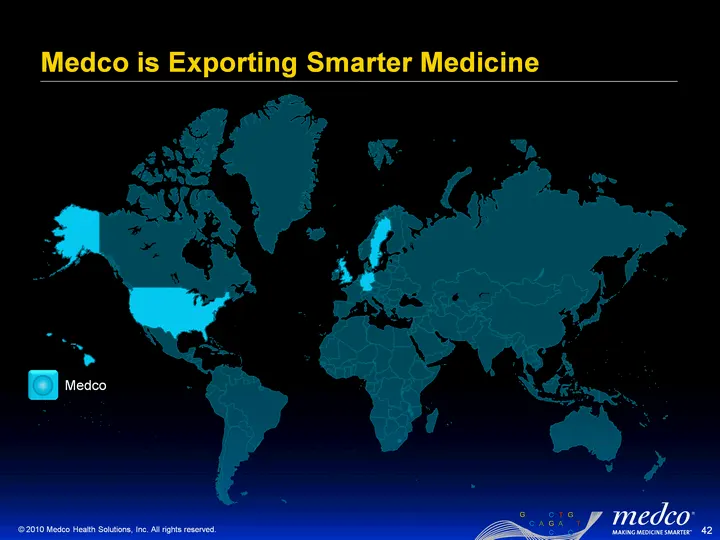
Medco is Exporting Smarter Medicine 42 Medco
Slide 43: Medco is Exporting Smarter Medicine
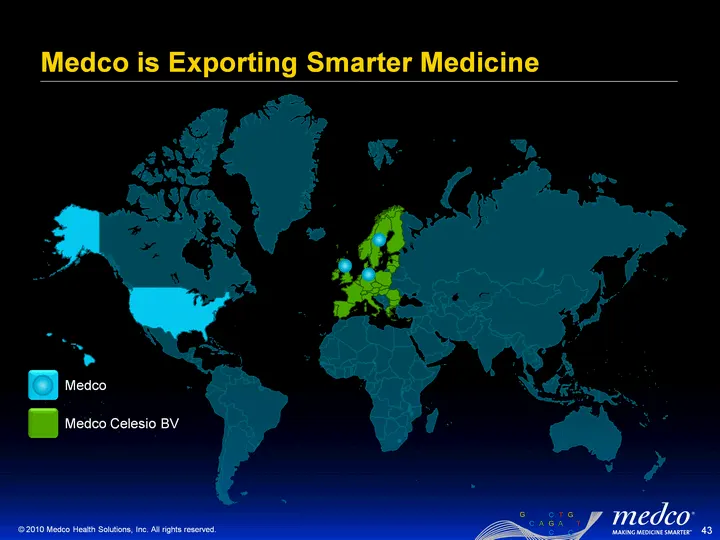
Medco is Exporting Smarter Medicine 43 Medco Celesio BV Medco
Slide 44: Medco is Exporting Smarter Medicine
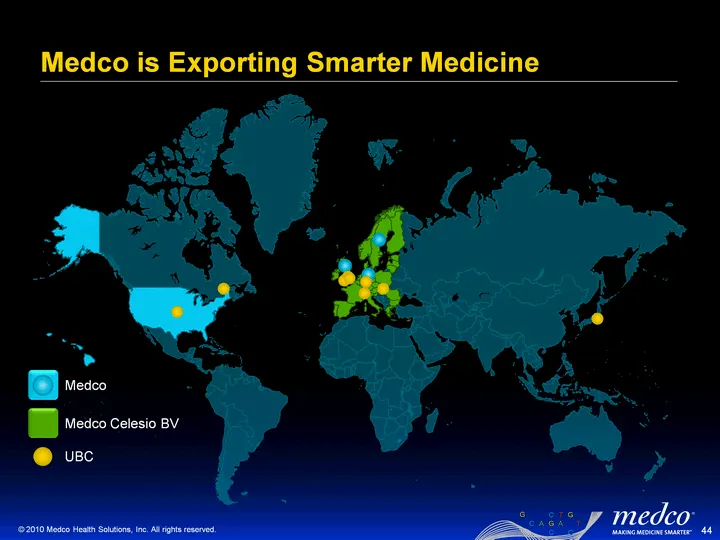
Medco is Exporting Smarter Medicine 44 Medco Celesio BV Medco UBC
Slide 45: Medco Drives Safety and Economic Effectiveness in the U.S. and Abroad
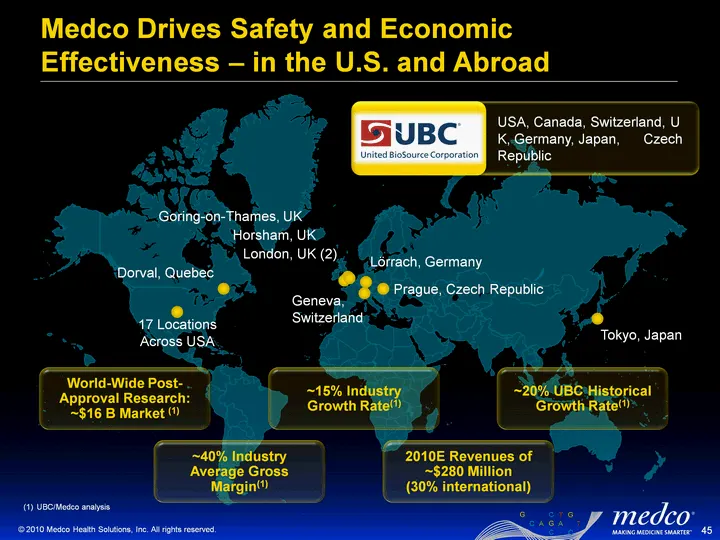
Medco Drives Safety and Economic Effectiveness - in the U.S. and Abroad Dorval, Quebec 17 Locations Across USA Geneva, Switzerland Goring-on-Thames, UK Horsham, UK London, UK (2) Lorrach, Germany Prague, Czech Republic Tokyo, Japan 45 USA, Canada, Switzerland, U K, Germany, Japan, Czech Republic Wor
Slide 46: Medco Health Store Extending the Safety Paradigm
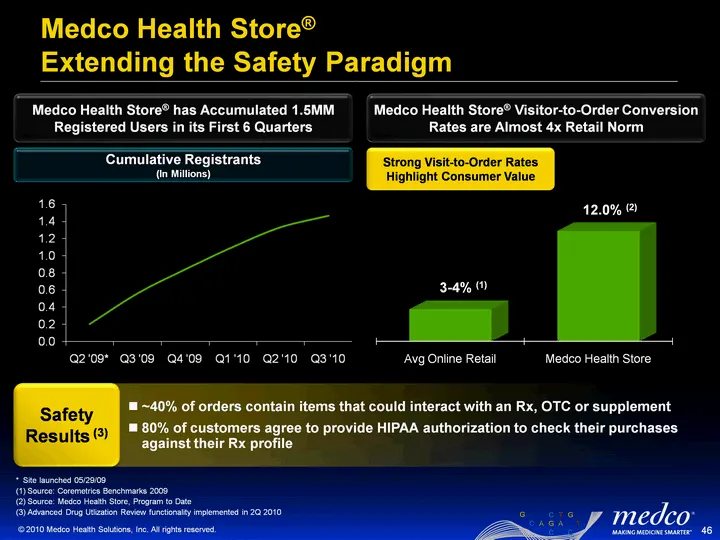
Medco Health Store(r) Extending the Safety Paradigm Medco Health Store(r) has Accumulated 1.5MM Registered Users in its First 6 Quarters Medco Health Store(r) Visitor-to-Order Conversion Rates are Almost 4x Retail Norm Cumulative Registrants (In Millions) Strong Visit-to-Order Rates Highlight Consum
Slide 47: e-Prescription Industry Adoption Continues to Grow
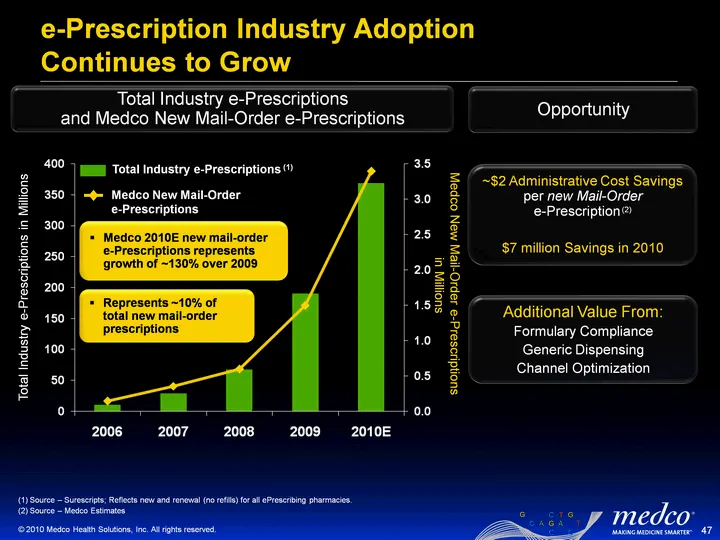
e-Prescription Industry Adoption Continues to Grow 47 (1) Source - Surescripts; Reflects new and renewal (no refills) for all ePrescribing pharmacies. (2) Source - Medco Estimates Total Industry e-Prescriptions in Millions Total Industry e-Prescriptions (1) Medco New Mail-Order e-Prescriptions Total
Slide 48: The Medco Strategic Goal
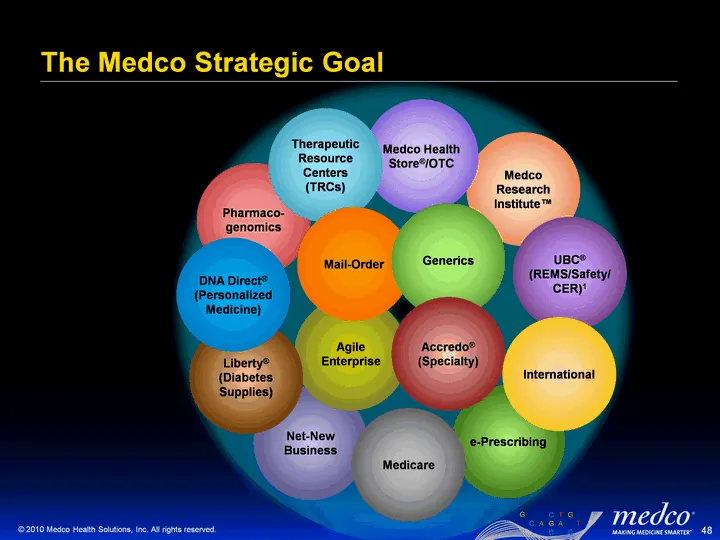
e-Prescribing Net-New Business Medicare Medco Research Institute(tm) Medco Health Store(r)/OTC Pharmaco- genomics Therapeutic Resource Centers (TRCs) The Medco Strategic Goal 48 Agile Enterprise Mail-Order Generics Accredo(r) (Specialty) Liberty(r) (Diabetes Supplies) UBC(r) (REMS/Safety/ CER)1 DNA
Slide 49: The Medco Strategic Goal
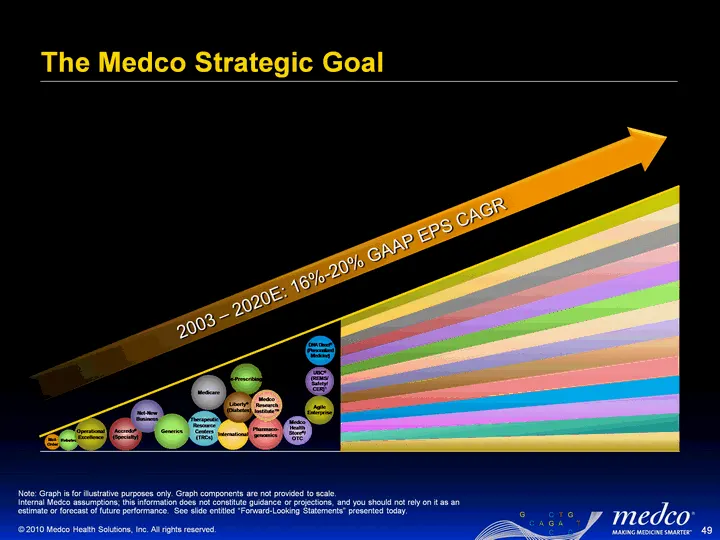
(CHART) The Medco Strategic Goal 49 Note: Graph is for illustrative purposes only. Graph components are not provided to scale. Internal Medco assumptions; this information does not constitute guidance or projections, and you should not rely on it as an estimate or forecast of future performance. See

Slide 50: Financial Performance
Financial Performance Richard J. Rubino 50 Chief Financial Officer
Slide 51: The Medco Growth Strategy
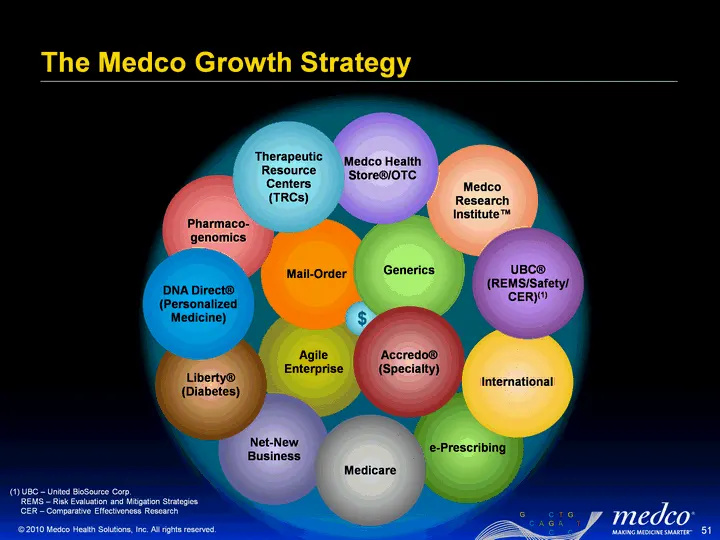
e-Prescribing Agile Enterprise Mail-Order $ Generics Accredo(r) (Specialty) Net-New Business Medicare Liberty(r) (Diabetes) Medco Research Institute(tm) International Medco Health Store(r)/OTC UBC(r) (REMS/Safety/ CER)(1) Pharmaco- genomics DNA Direct(r) (Personalized Medicine) Therapeutic Resource
Slide 52: The Medco Growth Strategy
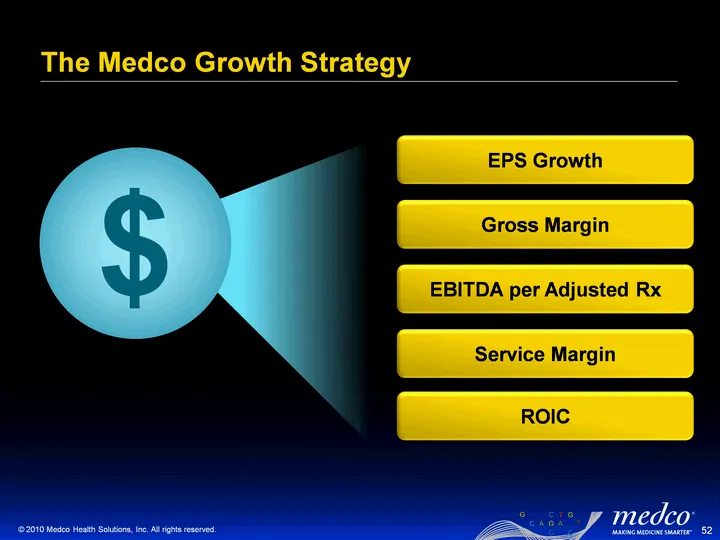
$ The Medco Growth Strategy 52 EPS Growth Gross Margin EBITDA per Adjusted Rx Service Margin ROIC
Slide 53: Medco 10-Year Strategic Financial Plan
Medco 10-Year Strategic Financial Plan 53 Detailed 10-year strategic financial plan Developed and refined over past year - "bottom-up" approach Full management participation End-to-end leadership accountability A powerful long-term management tool
Slide 54: Dave Snow Covered The Medco Strategy for the Next Decade
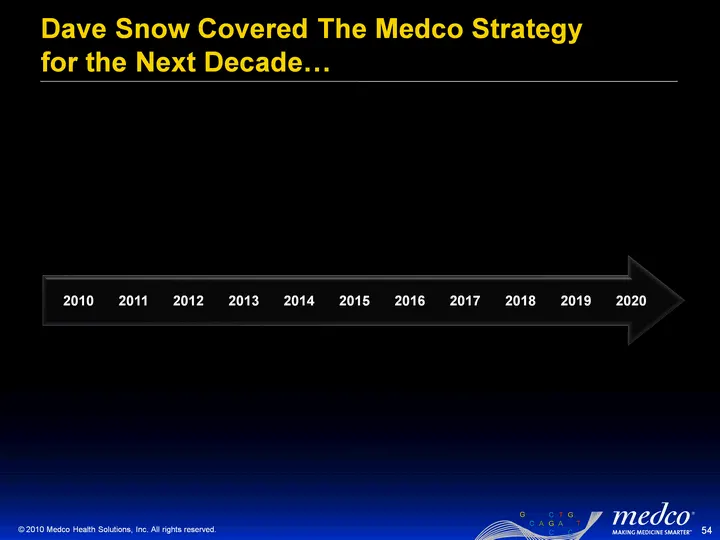
Dave Snow Covered The Medco Strategy for the Next Decade... 54 2010 2011 2012 2013 2014 2015 2016 2017 2018 2019 2020
Slide 55: I Will Focus on the Near-Term View
2010 2011 2012 2010 2011 2012 .... I Will Focus on the Near-Term View 55
Slide 56: Strong Cash EPS Growth
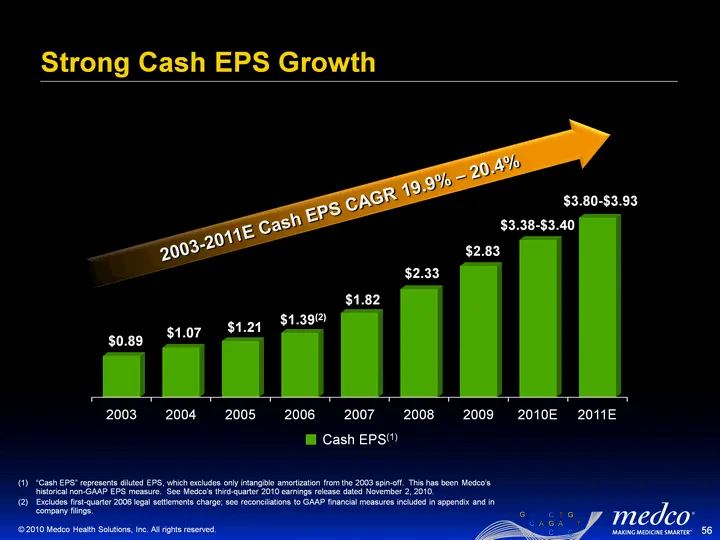
Cash EPS(1) Strong Cash EPS Growth "Cash EPS" represents diluted EPS, which excludes only intangible amortization from the 2003 spin-off. This has been Medco's historical non-GAAP EPS measure. See Medco's third-quarter 2010 earnings release dated November 2, 2010. Excludes first-quarter 2006 legal s
Slide 57: Pure Cash EPS Growth
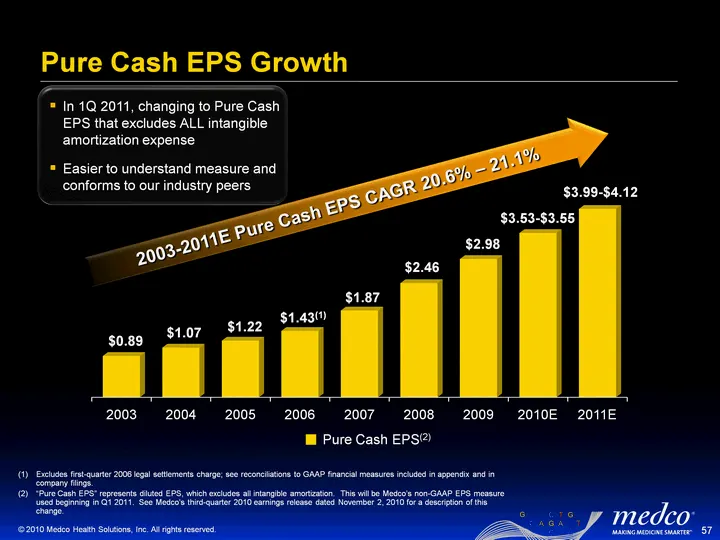
Pure Cash EPS Growth Excludes first-quarter 2006 legal settlements charge; see reconciliations to GAAP financial measures included in appendix and in company filings. "Pure Cash EPS" represents diluted EPS, which excludes all intangible amortization. This will be Medco's non-GAAP EPS measure used be
Slide 58: Success in Marketplace Leads to Solid Top Line Growth
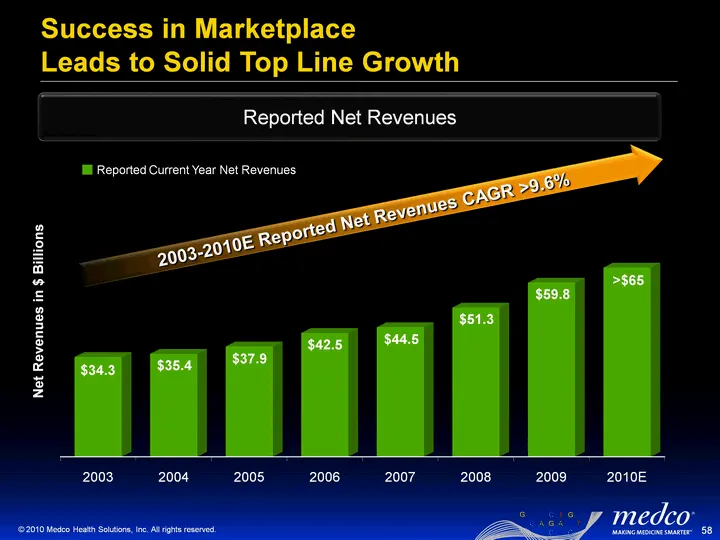
(CHART) Success in Marketplace Leads to Solid Top Line Growth 58 Net Revenues in $ Billions $37.9 $42.5 $44.5 $51.3 $59.8 >$65 $35.4 $34.3 Reported Net Revenues 2003-2010E Reported Net Revenues CAGR >9.6% Reported Current Year Net Revenues
Slide 59: Success in Marketplace Leads to Solid Top Line Growth
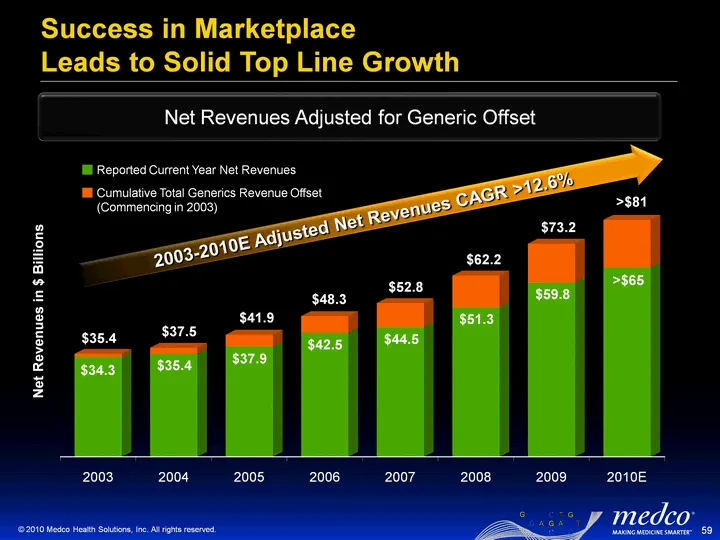
2003-2010E Adjusted Net Revenues CAGR >12.6% (CHART) Success in Marketplace Leads to Solid Top Line Growth 59 Net Revenues in $ Billions $37.9 $42.5 $44.5 $51.3 $59.8 >$65 $35.4 $34.3 $41.9 $48.3 $52.8 $62.2 $73.2 >$81 $37.5 $35.4 Net Revenues Adjusted for Generic Offset Reported Current Year Net Re
Slide 60: The Power of Generics: Significant Client and Patient Savings
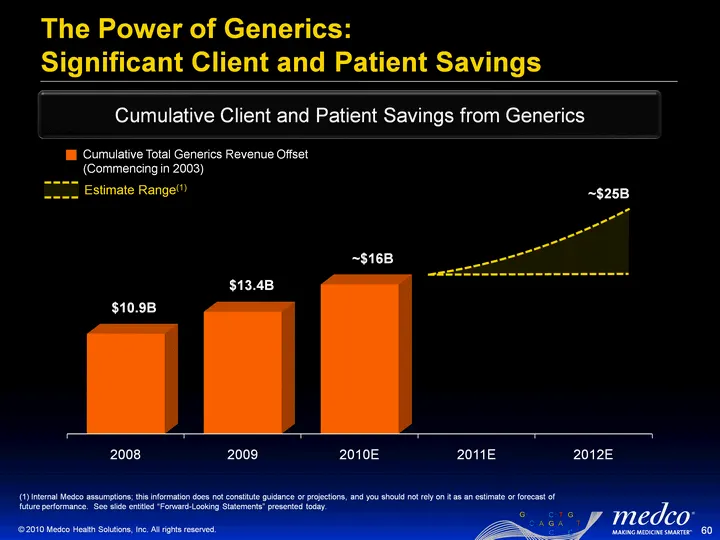
(CHART) The Power of Generics: Significant Client and Patient Savings 60 Cumulative Client and Patient Savings from Generics $10.9B $13.4B ~$16B Estimate Range(1) (1) Internal Medco assumptions; this information does not constitute guidance or projections, and you should not rely on it as an estimat
Slide 61: New Generics: Annual Incremental EPS Contribution
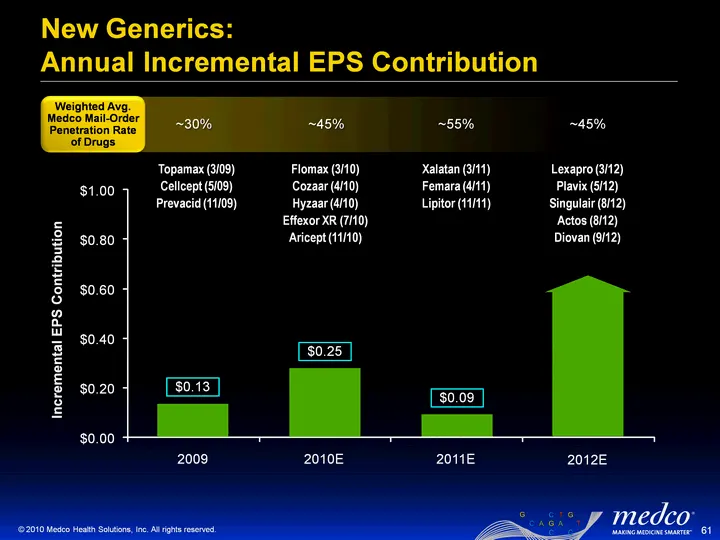
Weighted Avg. Medco Mail-Order Penetration Rate of Drugs 2012E 2011E $0.09 New Generics: Annual Incremental EPS Contribution 61 $0.00 $0.20 $0.40 $0.60 $0.80 $1.00 2009 $0.13 2010E $0.25 Incremental EPS Contribution ~30% ~45% ~55% Topamax (3/09) Cellcept (5/09) Prevacid (11/09) Flomax (3/10) Cozaar
Slide 62: Long-Term Expectations for Annual Incremental New Generic EPS Contribution
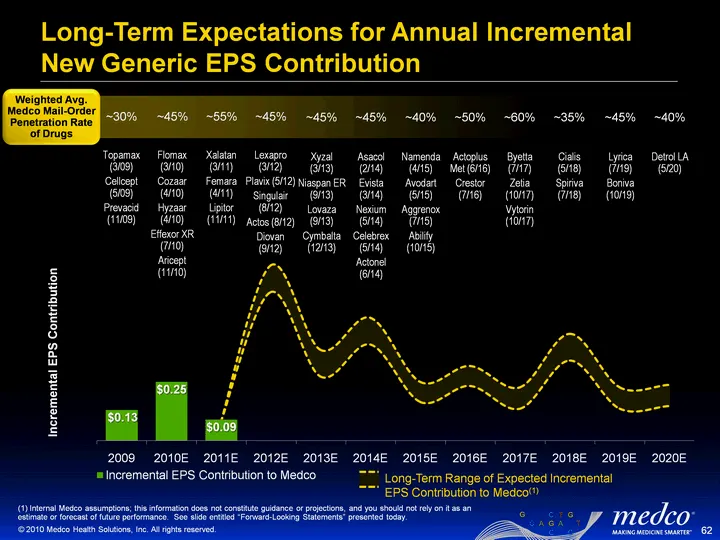
(CHART) (CHART) (1) Internal Medco assumptions; this information does not constitute guidance or projections, and you should not rely on it as an estimate or forecast of future performance. See slide entitled "Forward-Looking Statements" presented today. Long-Term Expectations for Annual Incremental
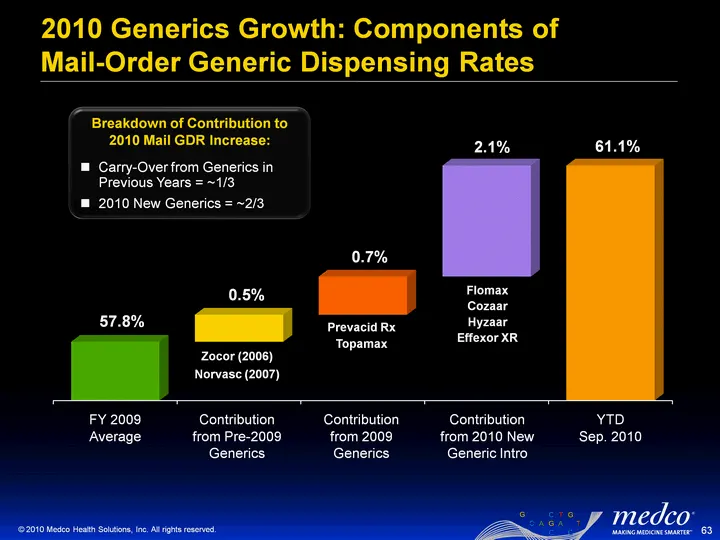
Slide 63: 2010 Generics Growth: Components of Mail-Order Generic Dispensing Rates
2010 Generics Growth: Components of Mail-Order Generic Dispensing Rates 63 (CHART) Prevacid Rx Topamax Flomax Cozaar Hyzaar Effexor XR FY 2009 Average Contribution from Pre-2009 Generics YTD Sep. 2010 Contribution from 2009 Generics Contribution from 2010 New Generic Intro Zocor (2006) Norvasc (2007
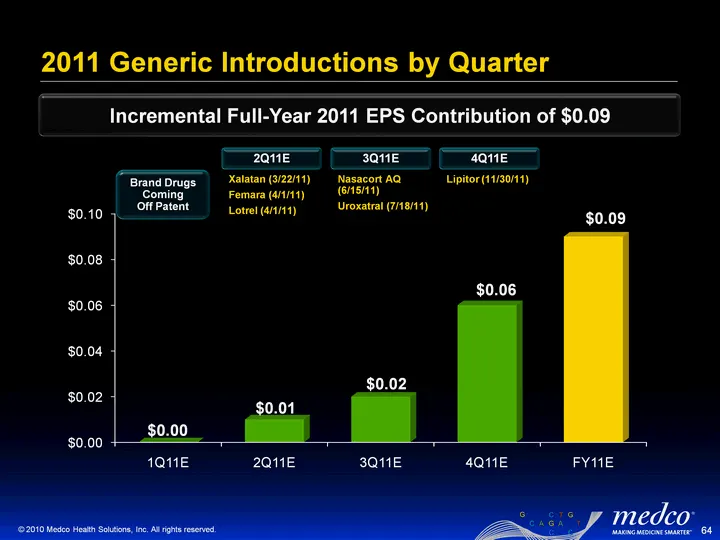
Slide 64: 2011 Generic Introductions by Quarter
2011 Generic Introductions by Quarter 64 (CHART) Xalatan (3/22/11) Femara (4/1/11) Lotrel (4/1/11) Nasacort AQ (6/15/11) Uroxatral (7/18/11) Lipitor (11/30/11) $0.06 Incremental Full-Year 2011 EPS Contribution of $0.09 $0.02 $0.01 $0.00 Brand Drugs Coming Off Patent 2Q11E 3Q11E 4Q11E $0.09
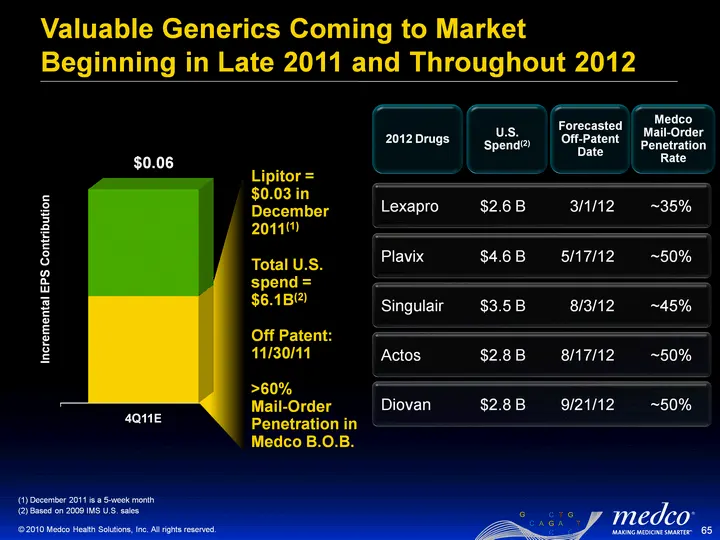
Slide 65: Valuable Generics Coming to Market Beginning in Late 2011 and 2012
(CHART) Valuable Generics Coming to Market Beginning in Late 2011 and Throughout 2012 65 $0.06 Plavix $4.6 B 5/17/12 ~50% Actos $2.8 B 8/17/12 ~50% Singulair $3.5 B 8/3/12 ~45% Lexapro $2.6 B 3/1/12 ~35% Diovan $2.8 B 9/21/12 ~50% Incremental EPS Contribution (1) December 2011 is a 5-week month (2)
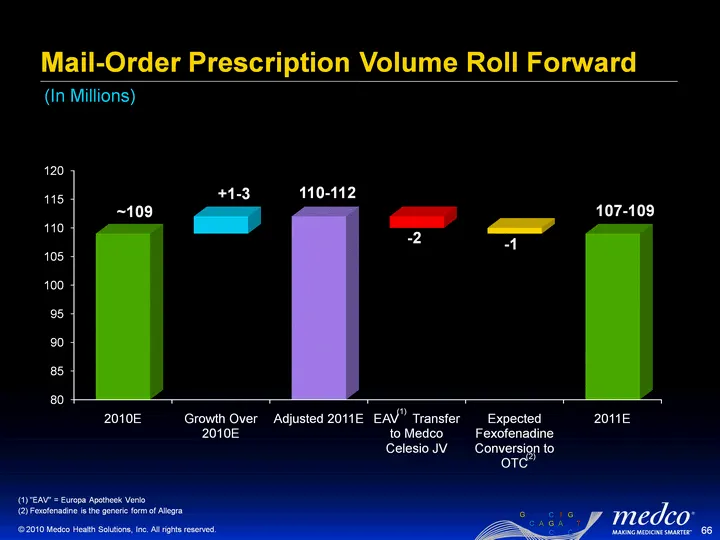
Slide 66: Mail-Order Prescription Volume Roll Forward
Mail-Order Prescription Volume Roll Forward 66 (In Millions) (1) "EAV" = Europa Apotheek Venlo (2) Fexofenadine is the generic form of Allegra (CHART) (1) (2)
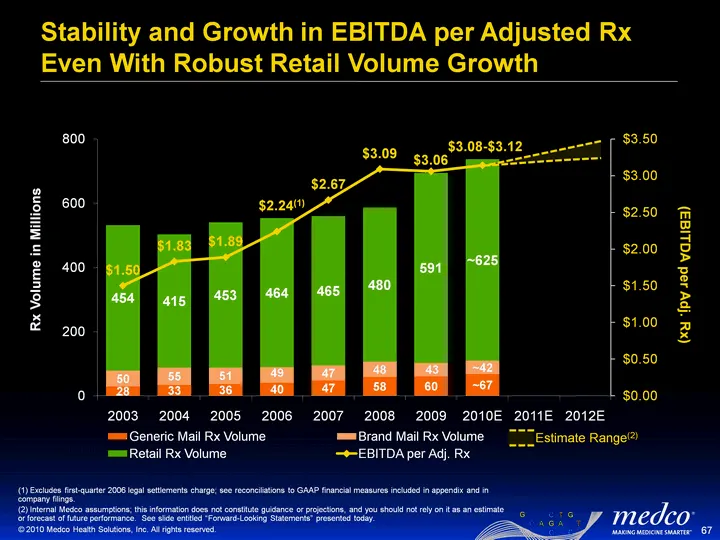
Slide 67: Stability and Growth in EBITDA per Adjusted Rx
(1) Excludes first-quarter 2006 legal settlements charge; see reconciliations to GAAP financial measures included in appendix and in company filings. (2) Internal Medco assumptions; this information does not constitute guidance or projections, and you should not rely on it as an estimate or forecast
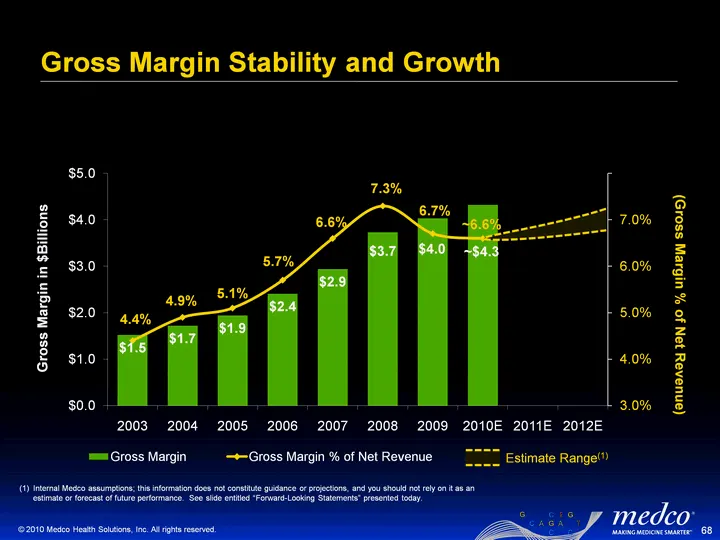
Slide 68: Gross Margin Stability and Growth
Gross Margin Stability and Growth (CHART) Gross Margin in $Billions 68 (Gross Margin % of Net Revenue) Estimate Range(1) (1) Internal Medco assumptions; this information does not constitute guidance or projections, and you should not rely on it as an estimate or forecast of future performance. See s
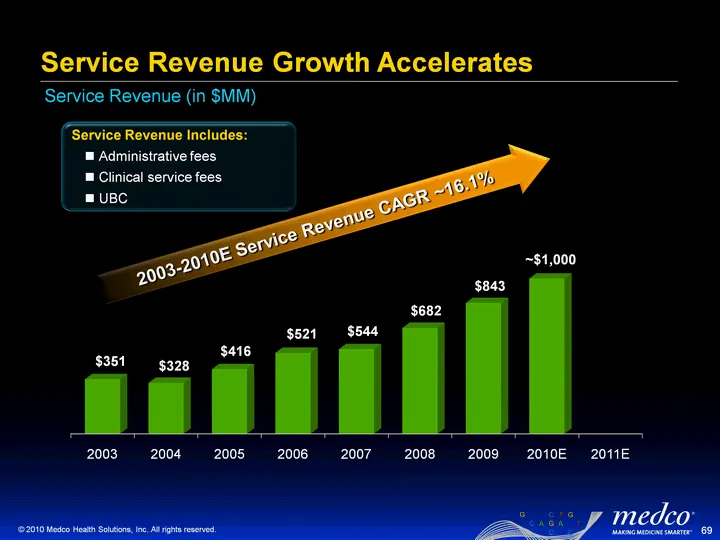
Slide 69: Service Revenue Growth Accelerates
(CHART) Service Revenue Growth Accelerates Service Revenue (in $MM) 69 Service Revenue Includes: Administrative fees Clinical service fees UBC 2003-2010E Service Revenue CAGR ~16.1%
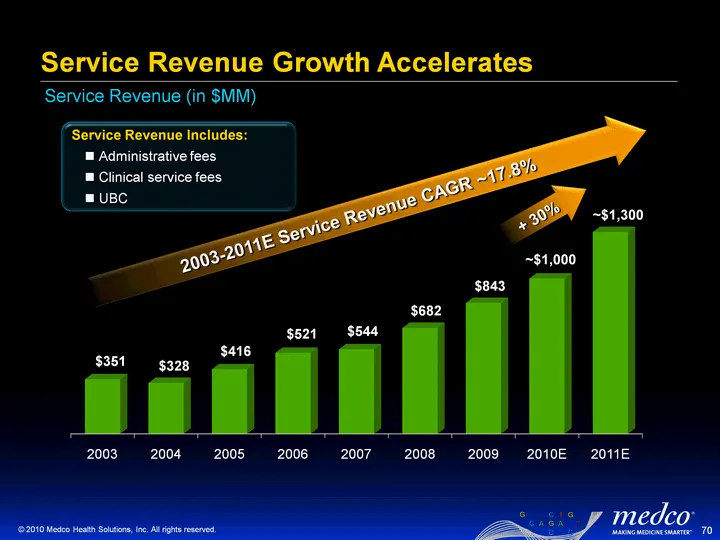
Slide 70: Service Revenue Growth Accelerates
2003-2011E Service Revenue CAGR ~17.8% (CHART) Service Revenue Growth Accelerates Service Revenue (in $MM) 70 Service Revenue Includes: Administrative fees Clinical service fees UBC + 30%
Slide 71: SG&A Expense Management
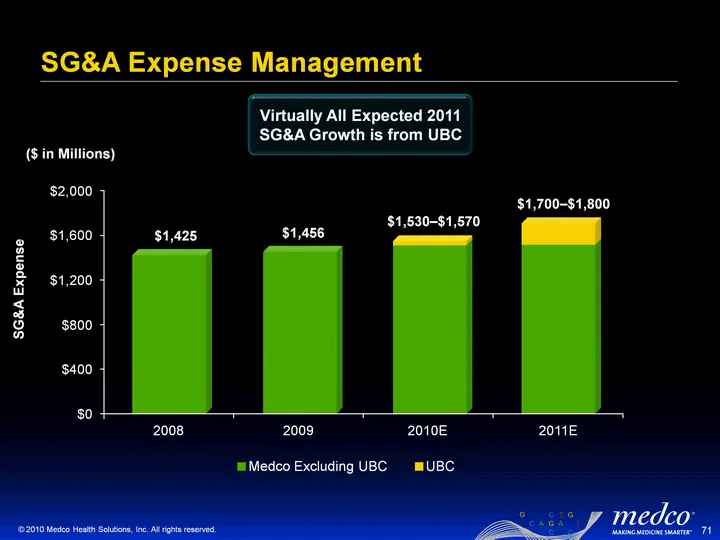
SG&A Expense Management 71 $1,456 $1,425 ($ in Millions) $1,530-$1,570 $1,700-$1,800 Virtually All Expected 2011 SG&A Growth is from UBC (CHART) LIVE CHART DATE - Please Keep 2008 2009 2010E 2011E Medco Excluding UBC UBC $0 $400 $800 $1,200 $1,600 $2,000 SG&A Expense
Slide 72: SG&A Expense Management
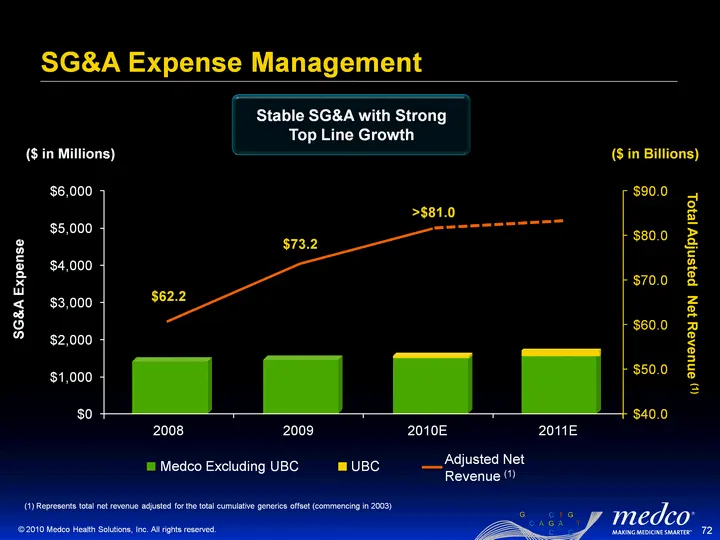
(CHART) SG&A Expense Management 72 Stable SG&A with Strong Top Line Growth Medco Excluding UBC UBC LIVE CHART DATE - Please Keep SG&A Expense 2008 2009 2010E 2011E $0 $1,000 $2,000 $3,000 $5,000 $6,000 $4,000 ($ in Millions) ($ in Billions) Total Adjusted Net Revenue (1) $40.0 $50.0 $70.0 $90.0 $60.
Slide 73: Efficiently Managing Inventory Levels
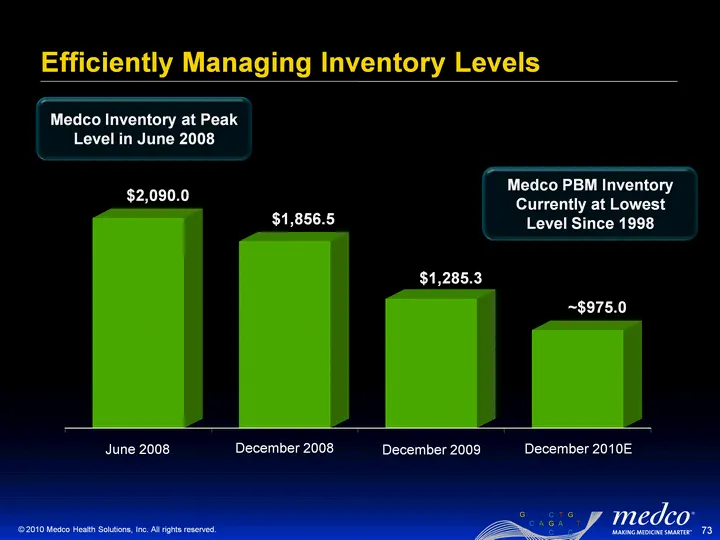
(CHART) Efficiently Managing Inventory Levels 73 Medco PBM Inventory Currently at Lowest Level Since 1998 Medco Inventory at Peak Level in June 2008 June 2008 December 2008 December 2009 December 2010E
Slide 74: ROIC Growth Expected to Remain Strong
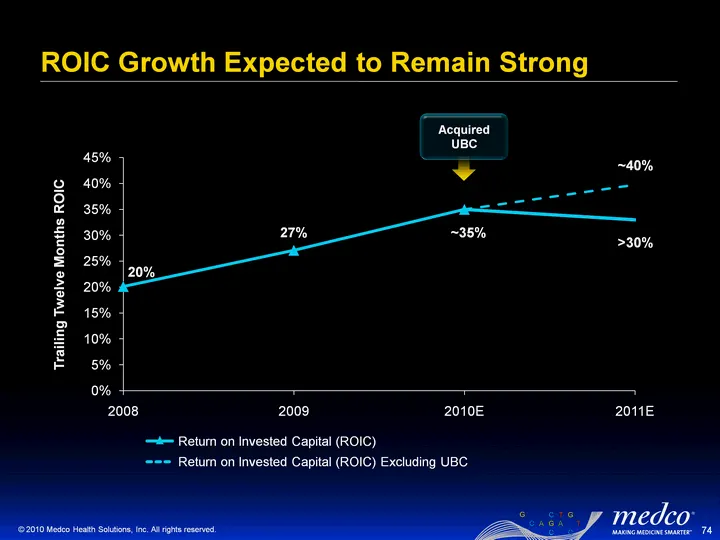
ROIC Growth Expected to Remain Strong 74 Acquired UBC ~40% Return on Invested Capital (ROIC) Excluding UBC Return on Invested Capital (ROIC) >30%
Slide 75: Strong Cash Flow from Operations in 2011
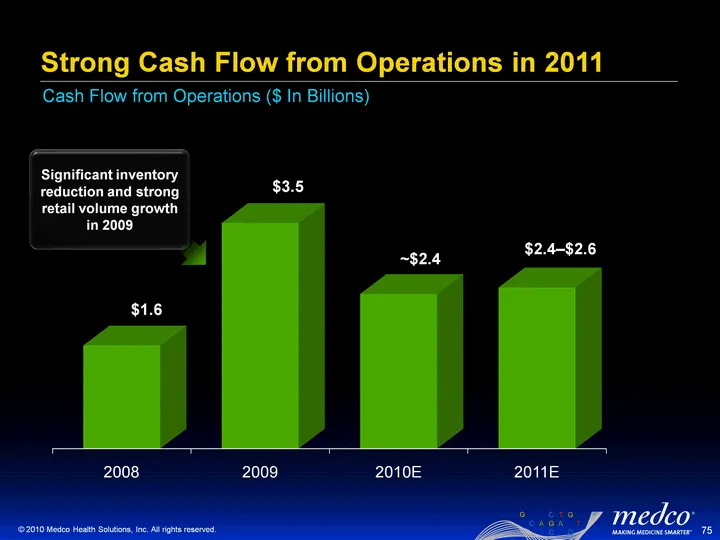
(CHART) Strong Cash Flow from Operations in 2011 Cash Flow from Operations ($ In Billions) 75 $2.4-$2.6 Significant inventory reduction and strong retail volume growth in 2009
Slide 76: Strong Cash Flow from Operations in 2011
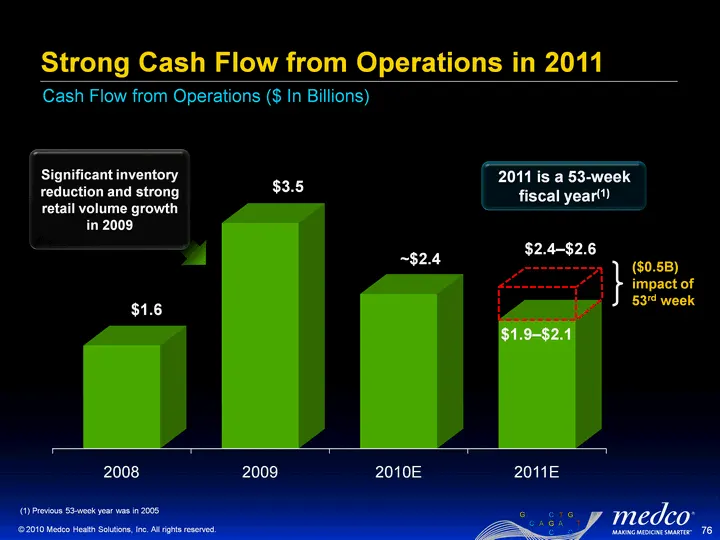
(CHART) Strong Cash Flow from Operations in 2011 Cash Flow from Operations ($ In Billions) (1) Previous 53-week year was in 2005 76 ($0.5B) impact of 53rd week $1.9-$2.1 $2.4-$2.6 Significant inventory reduction and strong retail volume growth in 2009 2011 is a 53-week fiscal year(1)
Slide 77: Medco Benefits from Favorable Interest Rate Environment
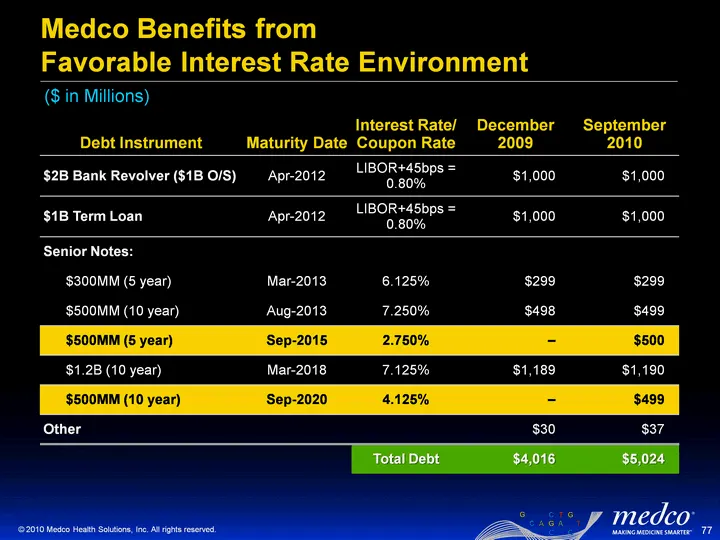
Medco Benefits from Favorable Interest Rate Environment 77 ($ in Millions) Debt Instrument Maturity Date Interest Rate/ Coupon Rate December 2009 September 2010 $2B Bank Revolver ($1B O/S) Apr-2012 LIBOR+45bps = 0.80% $1,000 $1,000 $1B Term Loan Apr-2012 LIBOR+45bps = 0.80% $1,000 $1,000 Senior Note
Slide 78: Capital Expenditures
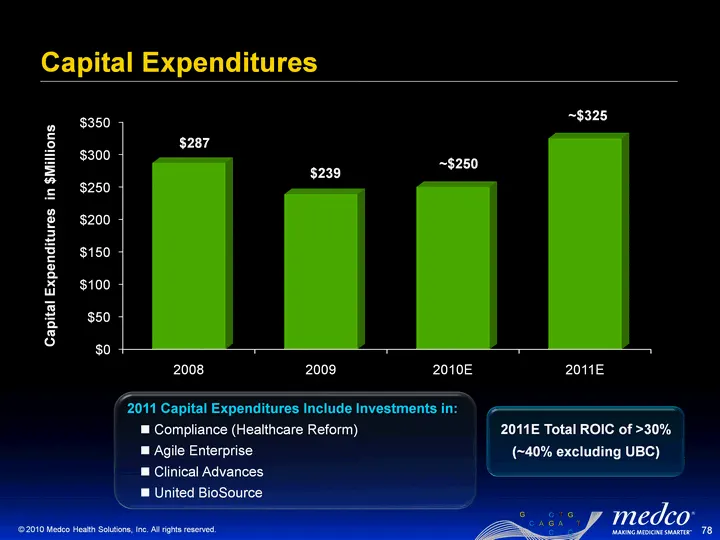
Capital Expenditures 78 (CHART) Capital Expenditures in $Millions 2011 Capital Expenditures Include Investments in: Compliance (Healthcare Reform) Agile Enterprise Clinical Advances United BioSource 2011E Total ROIC of >30% (~40% excluding UBC)
Slide 79: Share Repurchase History - Returning Value to Shareholders
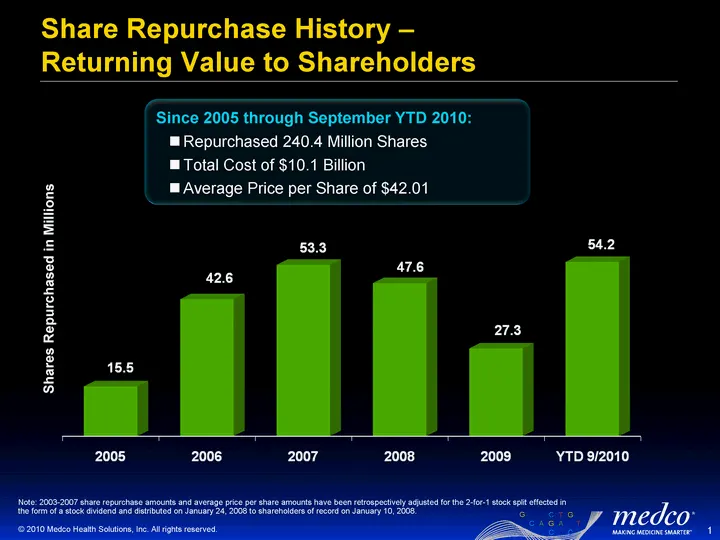
Share Repurchase History - Returning Value to Shareholders Note: 2003-2007 share repurchase amounts and average price per share amounts have been retrospectively adjusted for the 2-for-1 stock split effected in the form of a stock dividend and distributed on January 24, 2008 to shareholders of recor
Slide 80: Share Repurchases Will Continue
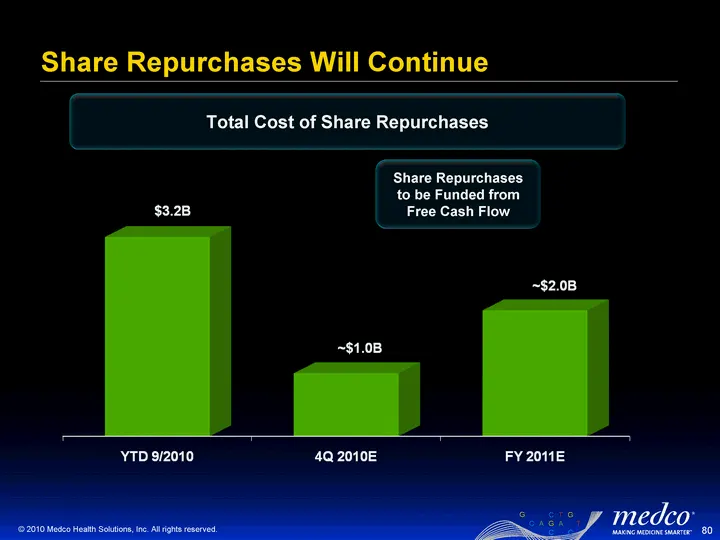
Share Repurchases Will Continue Total Cost of Share Repurchases Share Repurchases to be Funded from Free Cash Flow 2
Slide 81: Medco Has a History of Balanced Capital Allocation
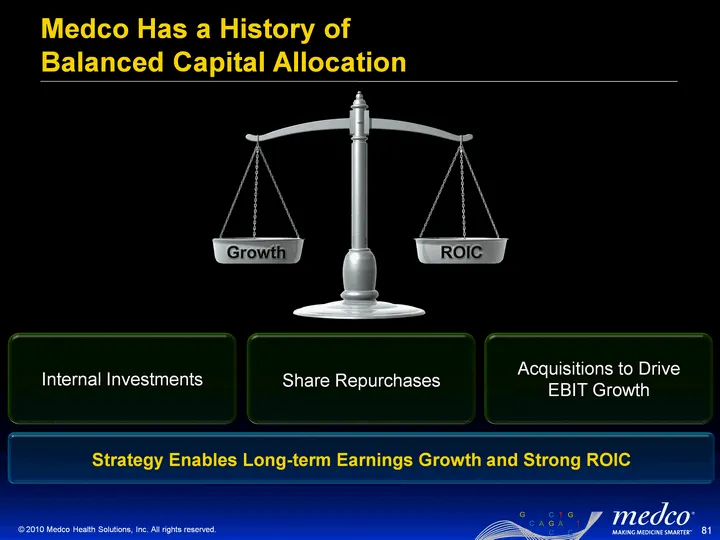
Medco Has a History of Balanced Capital Allocation 81 Internal Investments Share Repurchases Acquisitions to Drive EBIT Growth Strategy Enables Long-term Earnings Growth and Strong ROIC
Slide 82: What to Expect from Medco
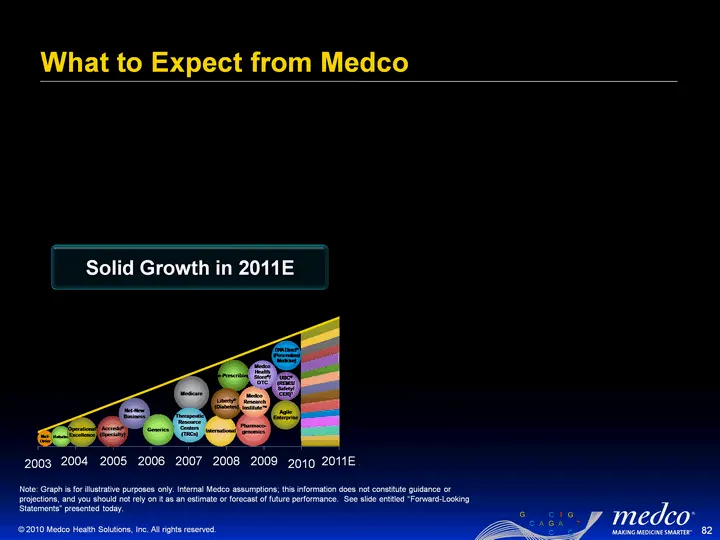
(CHART) Accredo(r) (Specialty) Medicare Therapeutic Resource Centers (TRCs) Net-New Business International e-Prescribing Liberty(r) (Diabetes) Mail- Order Rebates Operational Excellence DNA Direct(r) (Personalized Medicine) Pharmaco- genomics Medco Research Institute(tm) Agile Enterprise UBC(r) (REM
Slide 83: What to Expect from Medco
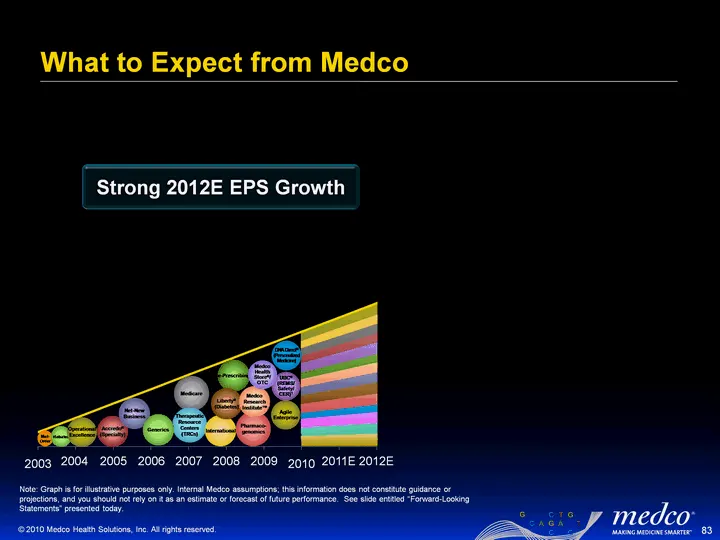
(CHART) Accredo(r) (Specialty) Medicare Therapeutic Resource Centers (TRCs) Net-New Business International e-Prescribing Liberty(r) (Diabetes) Mail- Order Rebates Operational Excellence DNA Direct(r) (Personalized Medicine) Pharmaco- genomics Medco Research Institute(tm) Agile Enterprise UBC(r) (REM
Slide 84: What to Expect from Medco
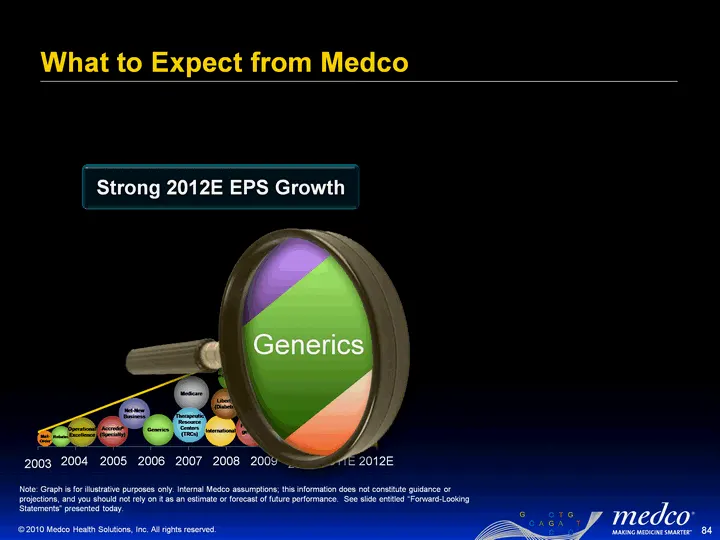
(CHART) Accredo(r) (Specialty) Medicare Therapeutic Resource Centers (TRCs) Net-New Business International e-Prescribing Liberty(r) (Diabetes) Mail- Order Rebates Operational Excellence DNA Direct(r) (Personalized Medicine) Pharmaco- genomics Medco Research Institute(tm) Agile Enterprise UBC(r) (REM
Slide 85: What to Expect from Medco
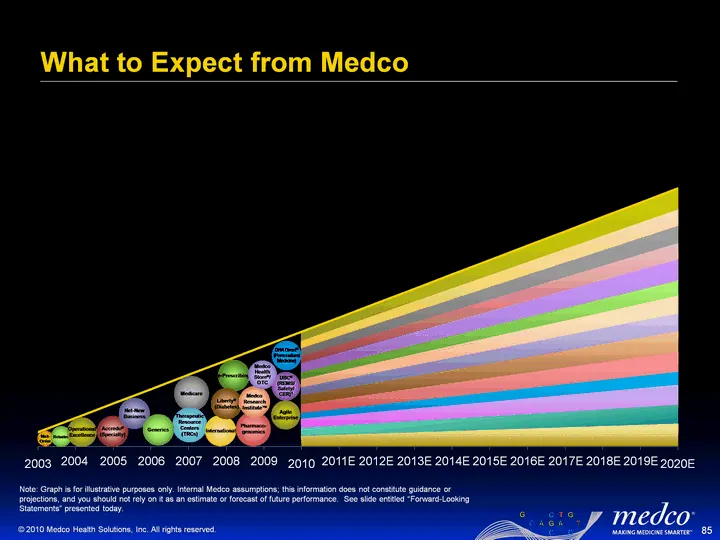
(CHART) Accredo(r) (Specialty) Medicare Therapeutic Resource Centers (TRCs) Net-New Business International e-Prescribing Liberty(r) (Diabetes) Mail- Order Rebates Operational Excellence DNA Direct(r) (Personalized Medicine) Pharmaco- genomics Medco Research Institute(tm) Agile Enterprise UBC(r) (REM
Slide 86: What to Expect from Medco
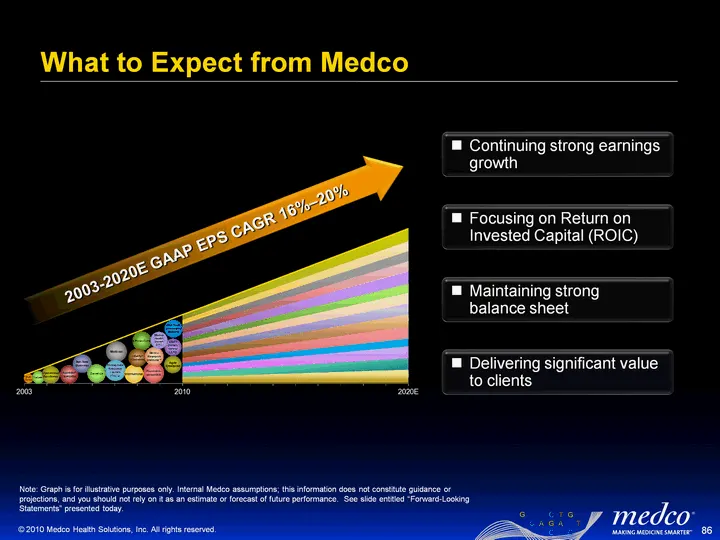
What to Expect from Medco 86 Note: Graph is for illustrative purposes only. Internal Medco assumptions; this information does not constitute guidance or projections, and you should not rely on it as an estimate or forecast of future performance. See slide entitled "Forward-Looking Statements" presen
Slide 87: Making Medicine Smarter for Our Clients and Patients
Making Medicine Smarter for Our Clients and Patients Kenneth O. Klepper 87 President and Chief Operating Officer
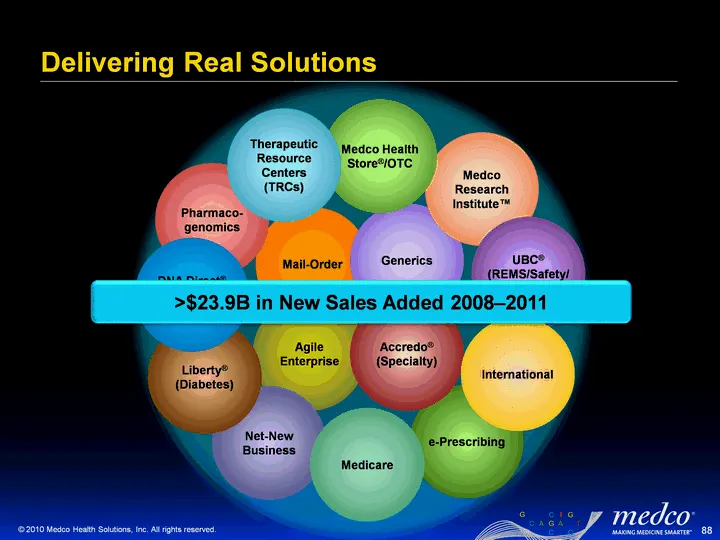
Slide 88: Delivering Real Solutions
Delivering Real Solutions 88 e-Prescribing Agile Enterprise Mail-Order Generics Accredo(r) (Specialty) Net-New Business Medicare Liberty(r) (Diabetes) Medco Research Institute(tm) Medco Health Store(r)/OTC UBC(r) (REMS/Safety/ CER)1 Pharmaco- genomics DNA Direct(r) (Personalized Medicine) Therapeuti
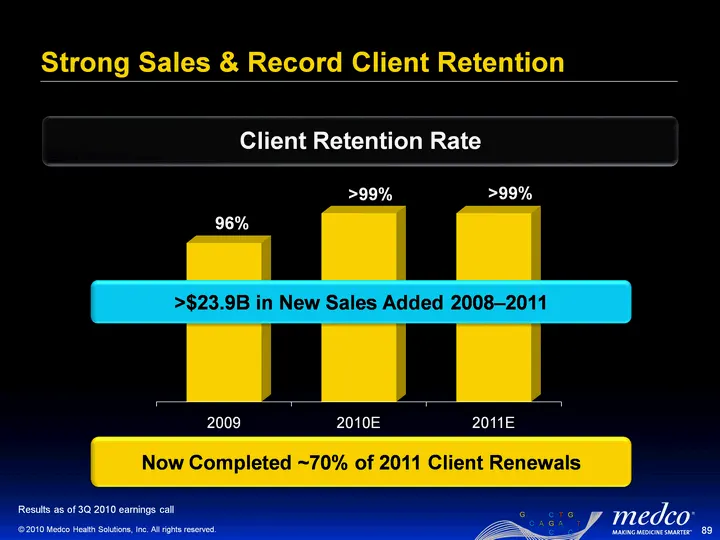
Slide 89: Strong Sales & Record Client Retention
Strong Sales & Record Client Retention 89 Results as of 3Q 2010 earnings call Results as of 3Q 2010 earnings call Client Retention Rate >$23.9B in New Sales Added 2008-2011 Now Completed ~70% of 2011 Client Renewals
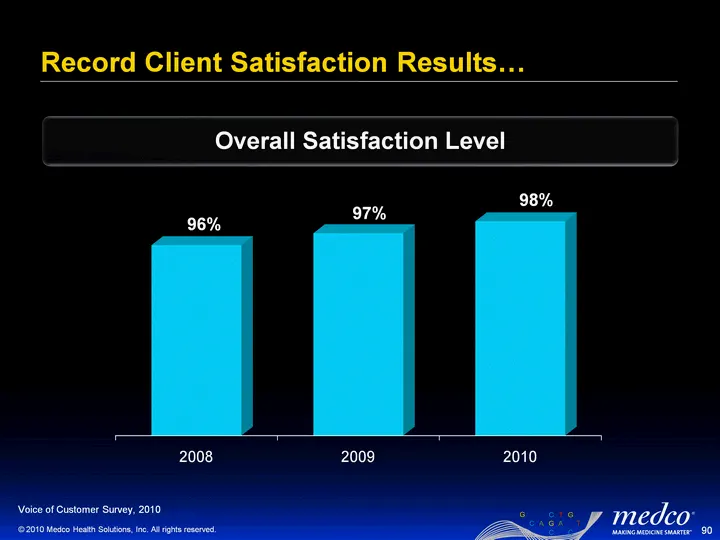
Slide 90: Record Client Satisfaction Results
Record Client Satisfaction Results... 90 Voice of Customer Survey, 2010 Overall Satisfaction Level Overall Satisfaction Level
Slide 91: What Delights our Customers?
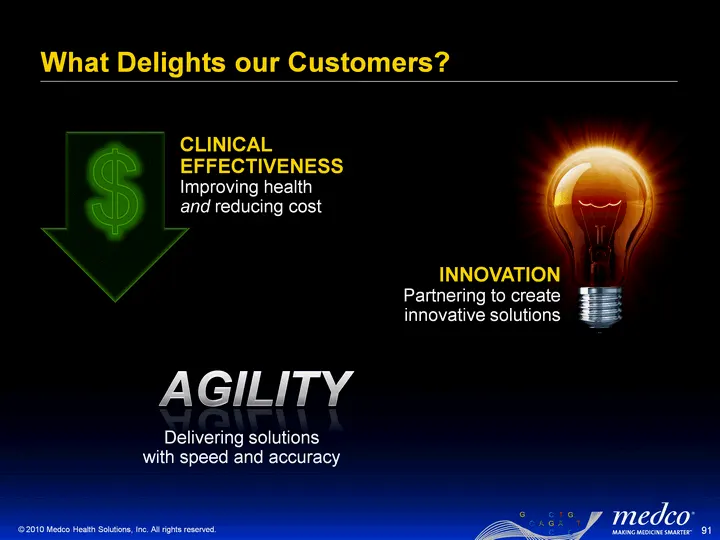
$ AgILITY What Delights our Customers? 91 CLINICAL EFFECTIVENESS Improving health and reducing cost INNOVATION Partnering to create innovative solutions Delivering solutions with speed and accuracy
Slide 92: Increasing Customization Demands Agility
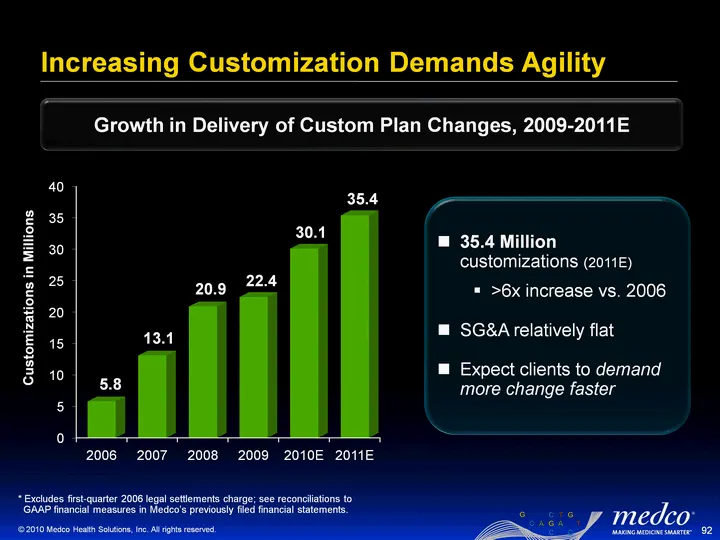
Increasing Customization Demands Agility 92 * Excludes first-quarter 2006 legal settlements charge; see reconciliations to GAAP financial measures in Medco's previously filed financial statements. (CHART) Customizations in Millions 35.4 Million customizations (2011E) >6x increase vs. 2006 SG&A relat
Slide 93: Why Clients Are Satisfied
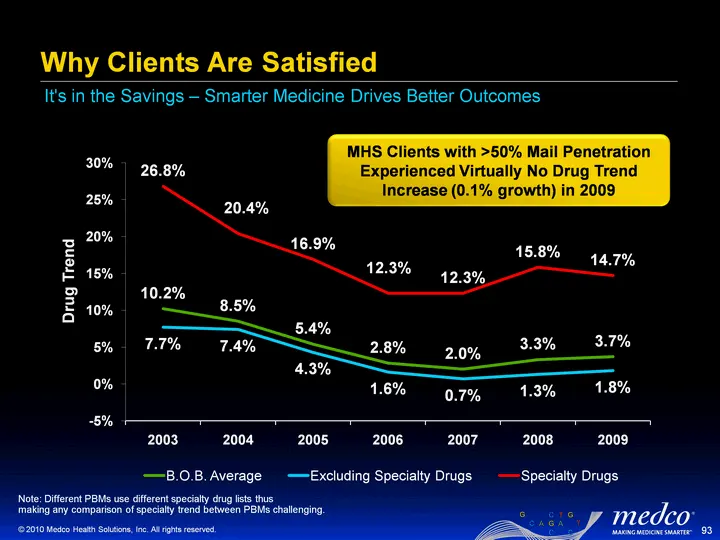
Why Clients Are Satisfied (CHART) 93 MHS Clients with >50% Mail Penetration Experienced Virtually No Drug Trend Increase (0.1% growth) in 2009 It's in the Savings - Smarter Medicine Drives Better Outcomes Note: Different PBMs use different specialty drug lists thus making any comparison of specialty
Slide 94: What Clients Worry About
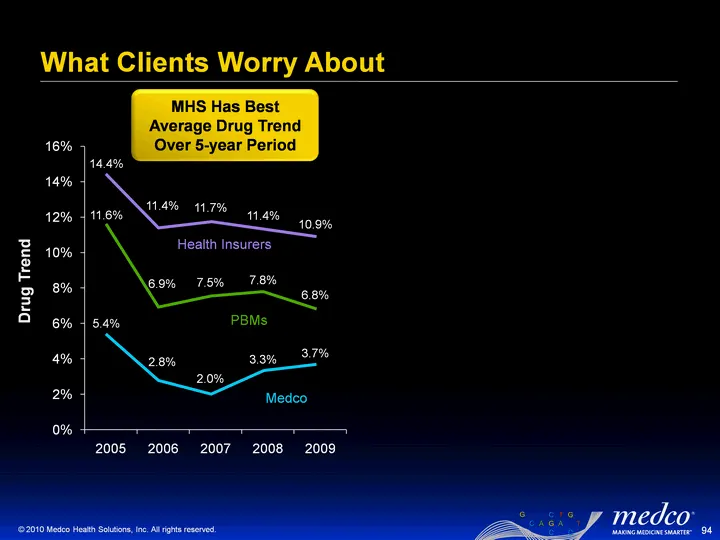
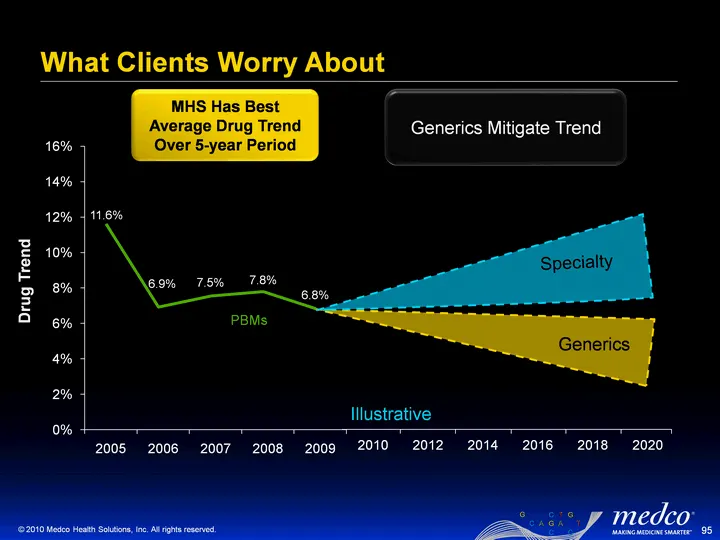
What Clients Worry About 94 PBMs 11.6% 6.9% 7.5% 7.8% 6.8% Health Insurers 14.4% 11.4% 11.7% 11.4% 10.9% Medco 5.4% 2.8% 2.0% 3.3% 3.7% Drug Trend MHS Has Best Average Drug Trend Over 5-year Period
Slide 95: Generics Mitigate Trend
Generics Mitigate Trend What Clients Worry About 95 PBMs 2010 2012 2014 2016 2018 2020 11.6% 6.9% 7.5% 7.8% 6.8% Illustrative Drug Trend Generics Specialty MHS Has Best Average Drug Trend Over 5-year Period
Slide 96: Delivering Solutions
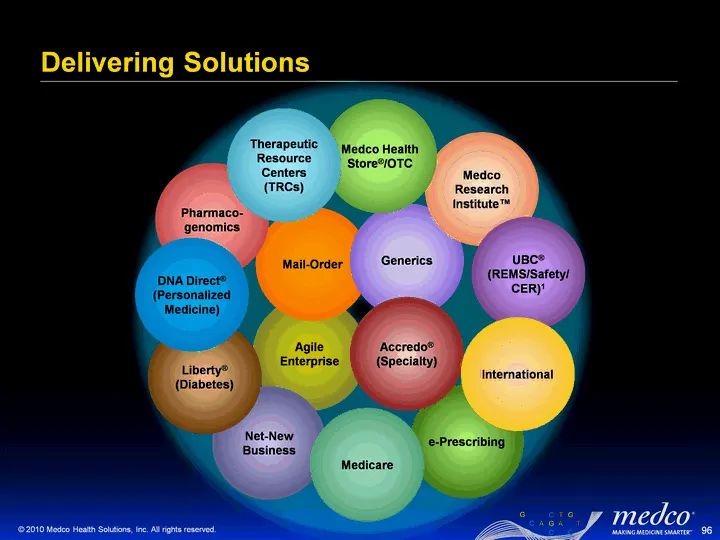
Delivering Solutions 96 e-Prescribing Agile Enterprise Mail-Order Generics Accredo(r) (Specialty) Net-New Business Medicare Liberty(r) (Diabetes) Medco Research Institute(tm) Medco Health Store(r)/OTC UBC(r) (REMS/Safety/ CER)1 Pharmaco- genomics DNA Direct(r) (Personalized Medicine) Therapeutic Res
Slide 97: Delivering Solutions
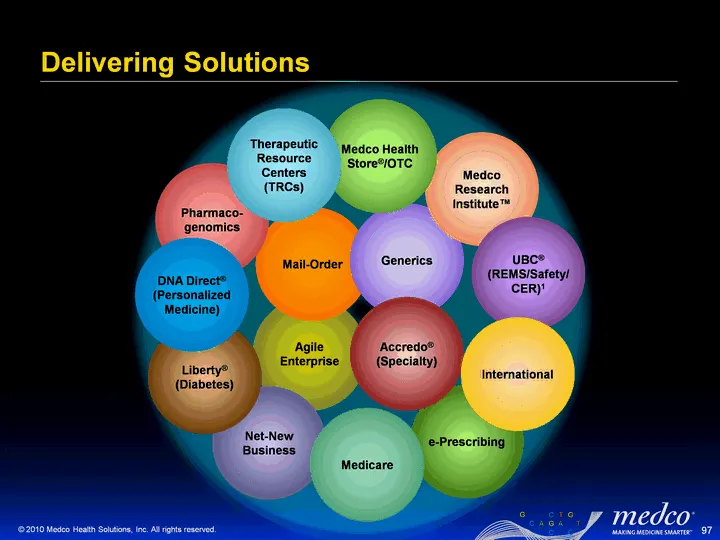
Delivering Solutions 97 e-Prescribing Agile Enterprise Mail-Order Generics Accredo(r) (Specialty) Net-New Business Medicare Liberty(r) (Diabetes) Medco Research Institute(tm) Medco Health Store(r)/OTC UBC(r) (REMS/Safety/ CER)1 Pharmaco- genomics DNA Direct(r) (Personalized Medicine) Therapeutic Res
Slide 98: TRCs on medco.com
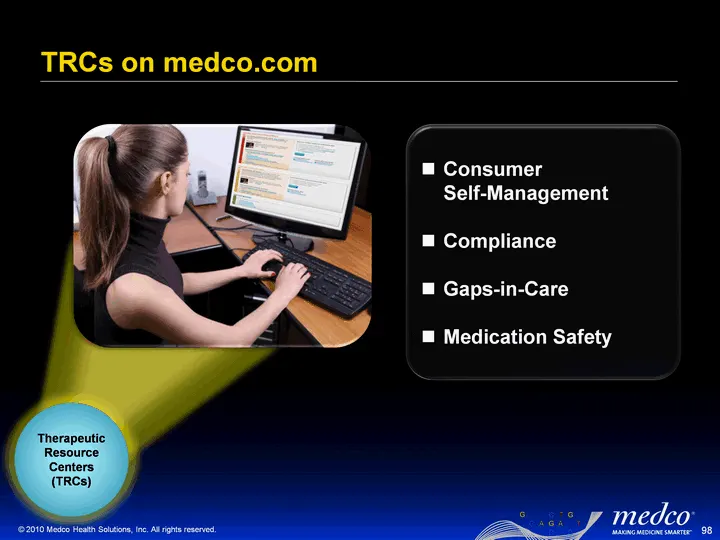
98 TRCs on medco.com Therapeutic Resource Centers (TRCs) Consumer Self-Management Compliance Gaps-in-Care Medication Safety
Slide 99: TRCs on medco.com: Closing Gaps
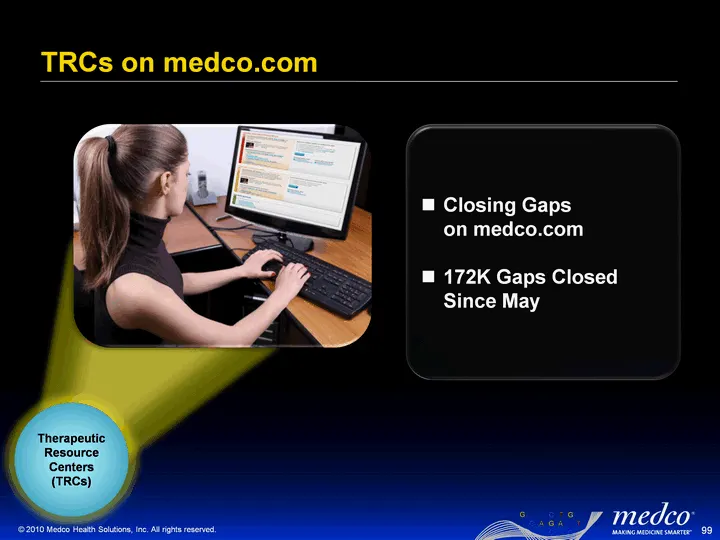
TRCs on medco.com 99 Therapeutic Resource Centers (TRCs) Closing Gaps on medco.com 172K Gaps Closed Since May
Slide 100: Mobile Applications
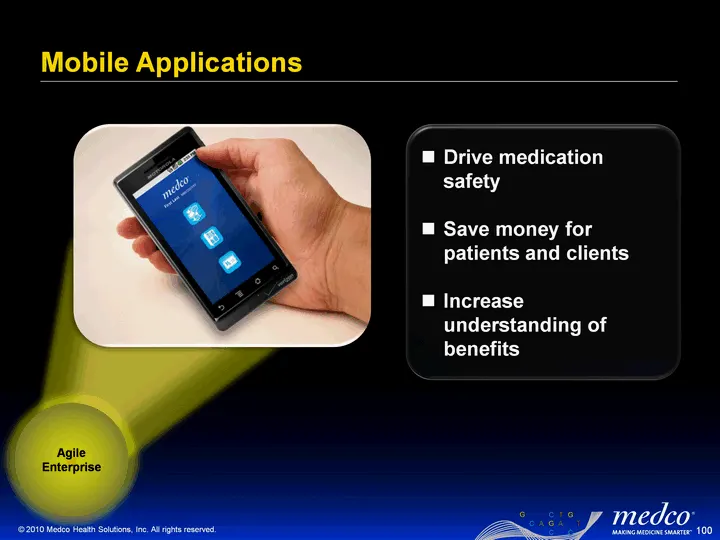
Mobile Applications 100 Agile Enterprise Drive medication safety Save money for patients and clients Increase understanding of benefits
Slide 101: Mobile Applications
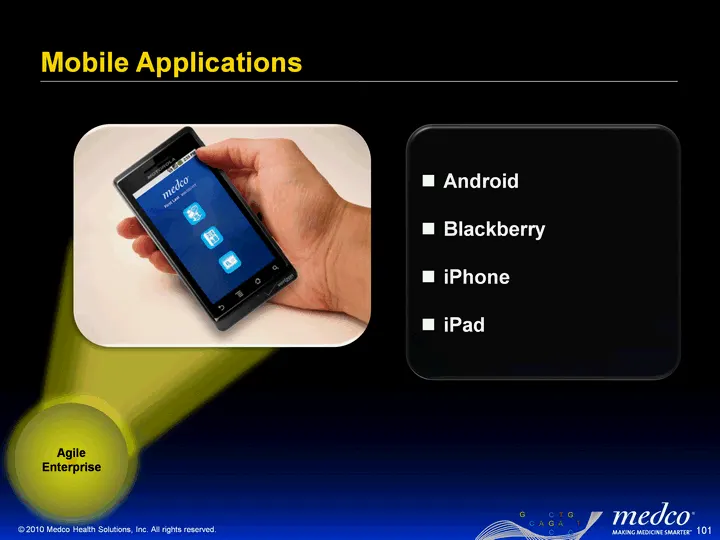
Mobile Applications 101 Agile Enterprise Android Blackberry iPhone iPad
Slide 102: Mobile Nursing Solutions
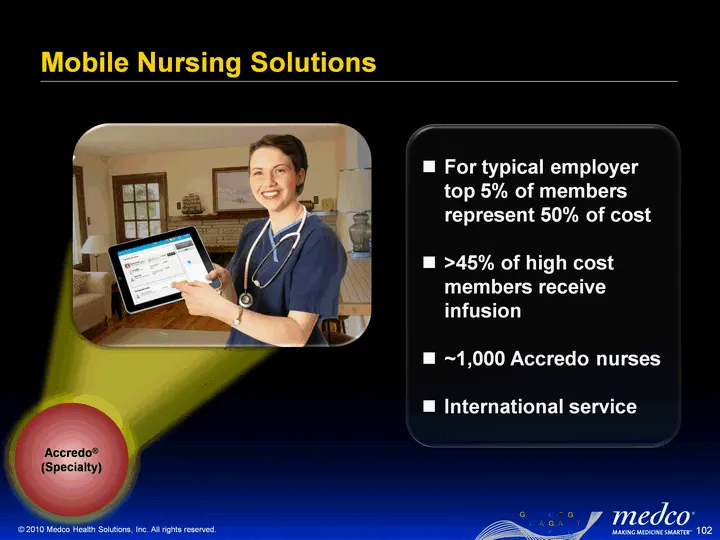
Mobile Nursing Solutions 102 Accredo(r) (Specialty) For typical employer top 5% of members represent 50% of cost >45% of high cost members receive infusion ~1,000 Accredo nurses International service
Slide 103: Mobile Point of Care: Wiring Infusion Nursing
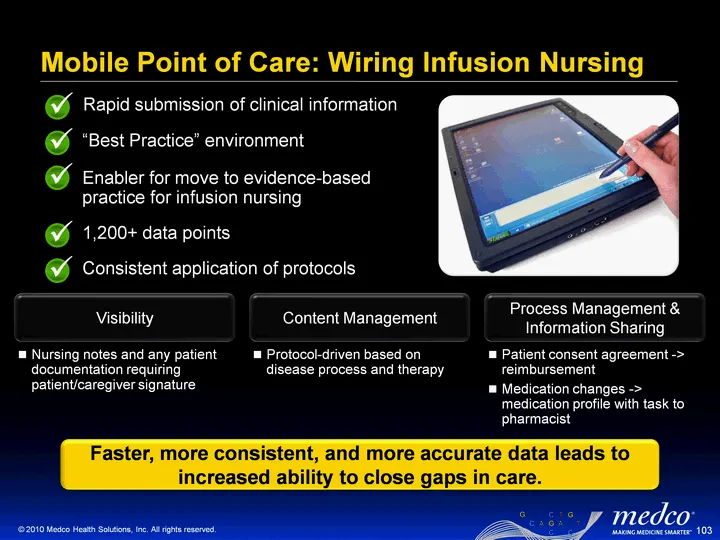
103 Mobile Point of Care: Wiring Infusion Nursing Rapid submission of clinical information "Best Practice" environment Enabler for move to evidence-based practice for infusion nursing 1,200+ data points Consistent application of protocols Nursing notes and any patient documentation requiring patient
Slide 104: Medco is Exporting Solutions Internationally
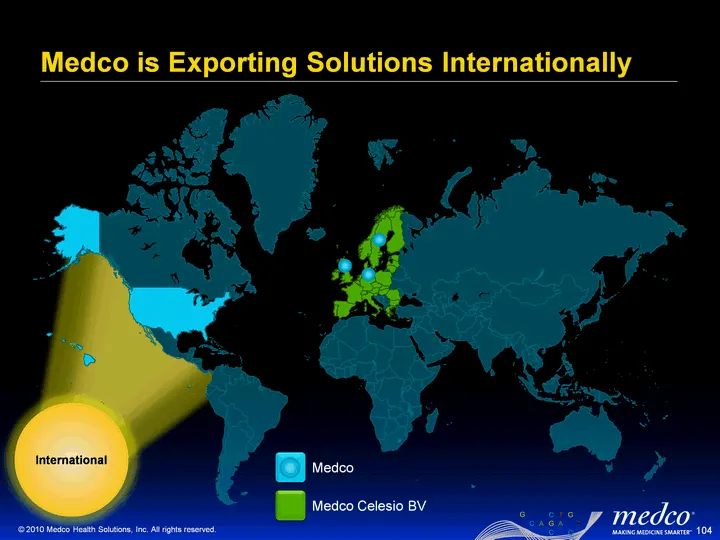
Medco Celesio BV Medco Medco is Exporting Solutions Internationally 104 International
Slide 105: Medco is Exporting Solutions Internationally
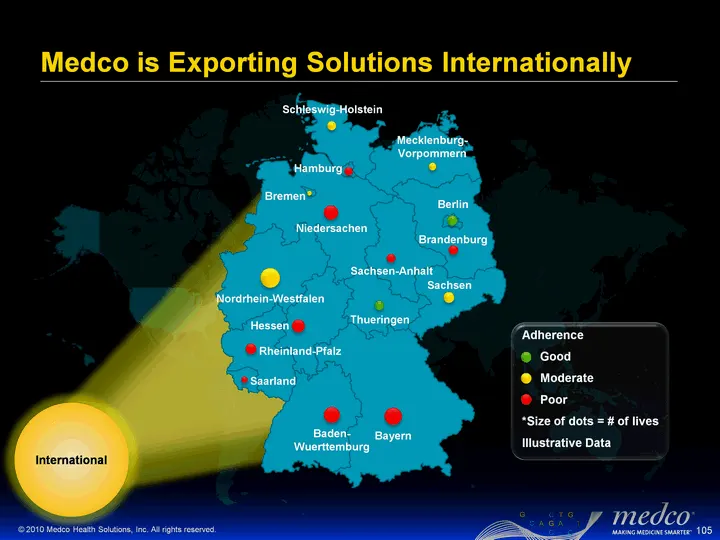
Medco is Exporting Solutions Internationally 105 International Schleswig-Holstein Mecklenburg- Vorpommern Hamburg Bremen Niedersachen Berlin Brandenburg Sachsen Nordrhein-Westfalen Saarland Rheinland-Pfalz Sachsen-Anhalt Thueringen Bayern Baden- Wuerttemburg Hessen Adherence Good Moderate Poor *Size

Slide 106: On-screen Animation
On-screen Animation 106

Slide 107: On-screen Animation
On-screen Animation 107
Slide 108: Enabling the Point of Care "Extended Enterprise"
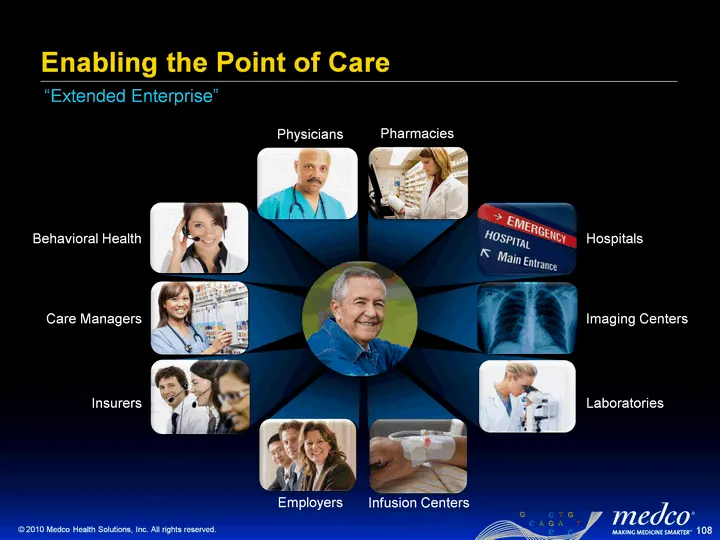
Enabling the Point of Care 108 "Extended Enterprise" Behavioral Health Physicians Pharmacies Hospitals Imaging Centers Laboratories Infusion Centers Employers Insurers Care Managers
Slide 109: Enabling the Point of Care
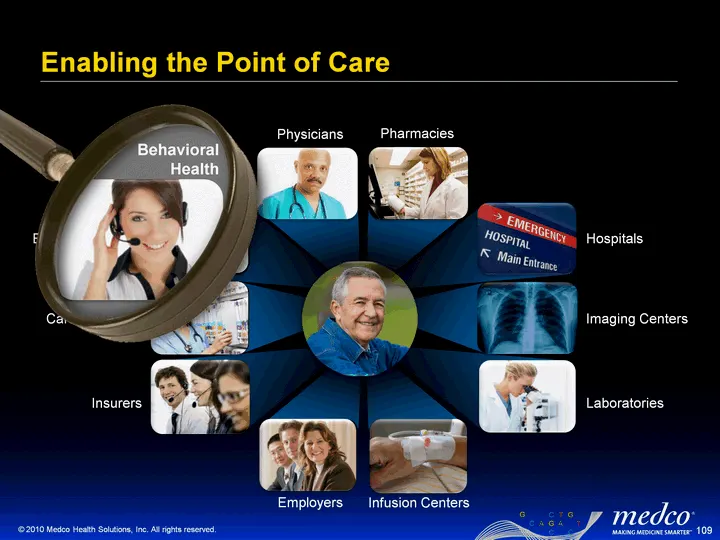
Enabling the Point of Care 109 Behavioral Health Physicians Pharmacies Hospitals Imaging Centers Laboratories Infusion Centers Employers Insurers Care Managers Behavioral Health
Slide 110: Large Employer Case Study
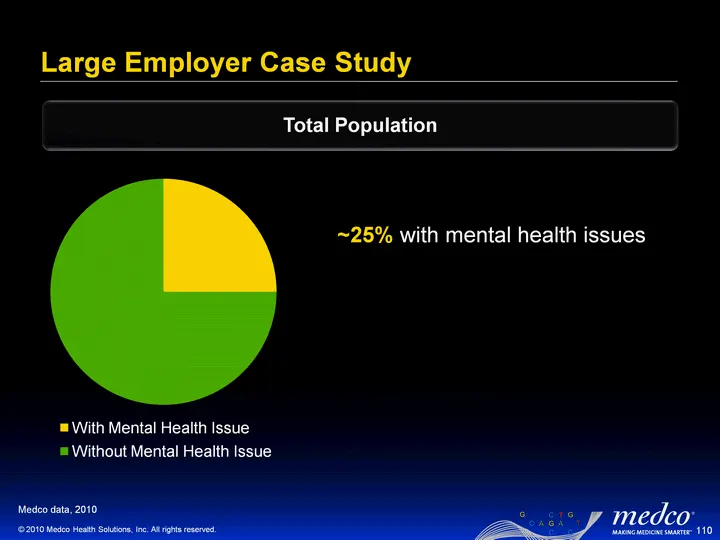
Large Employer Case Study 110 Medco data, 2010 Total Population ~25% with mental health issues (CHART)
Slide 111: Large Employer Case Study
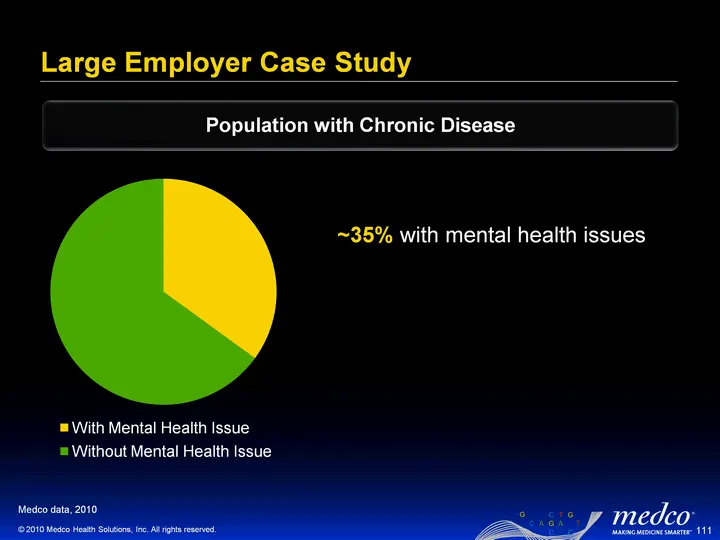
Large Employer Case Study 111 Medco data, 2010 Population with Chronic Disease ~35% with mental health issues (CHART)
Slide 112: Large Employer Case Study
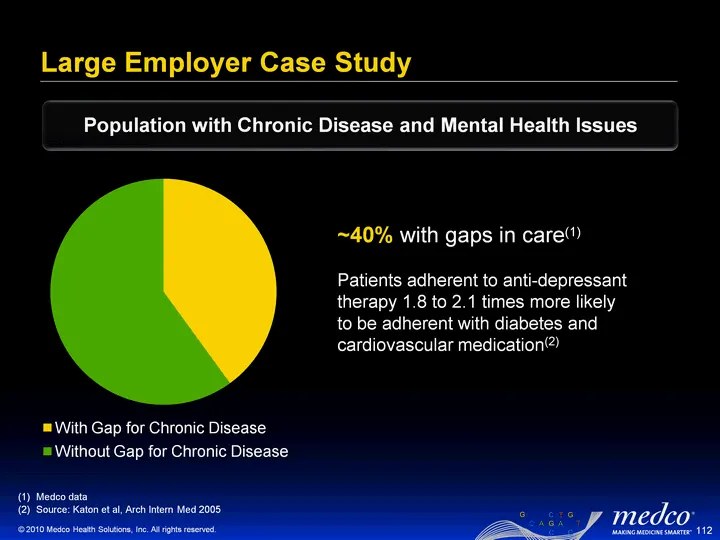
Large Employer Case Study 112 Medco data Source: Katon et al, Arch Intern Med 2005 Source: Katon et al, Arch Intern Med 2005 Source: Katon et al, Arch Intern Med 2005 Population with Chronic Disease and Mental Health Issues ~40% with gaps in care(1) Patients adherent to anti-depressant therapy 1.8 t
Slide 113: Large Employer Case Study
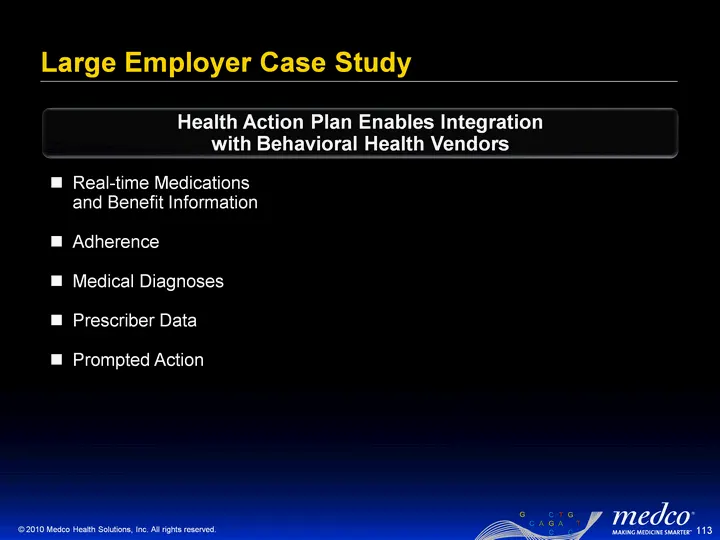
Large Employer Case Study 113 Real-time Medications and Benefit Information Adherence Medical Diagnoses Prescriber Data Prompted Action Health Action Plan Enables Integration with Behavioral Health Vendors
Slide 114: Wiring Healthcare: Medco as a Convener
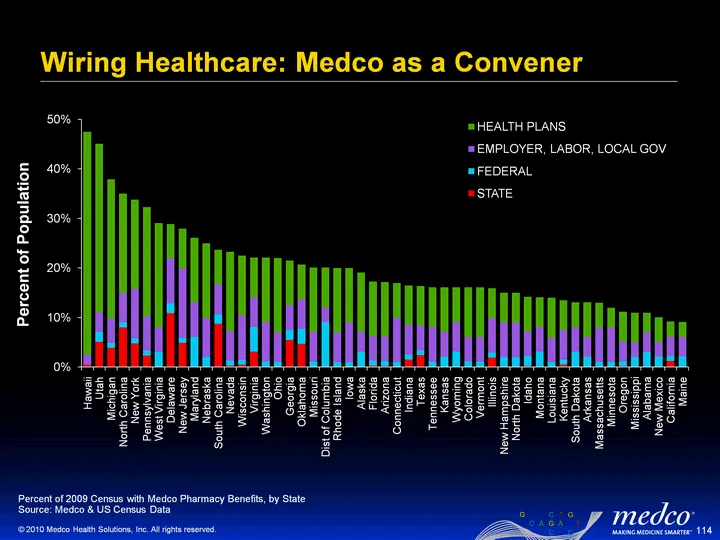
Wiring Healthcare: Medco as a Convener 114 Percent of 2009 Census with Medco Pharmacy Benefits, by State Source: Medco & US Census Data Source: Medco & US Census Data Source: Medco & US Census Data Percent of Population
Slide 115: Use Data to Identify Physicians with Patients with Diabetes
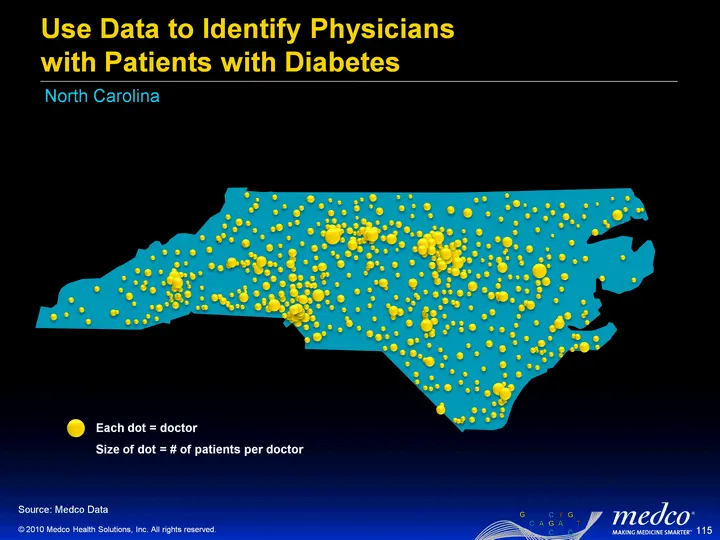
Use Data to Identify Physicians with Patients with Diabetes 115 North Carolina Source: Medco Data Each dot = doctor Size of dot = # of patients per doctor
Slide 116: Focus on the 20% with 80% of Patients
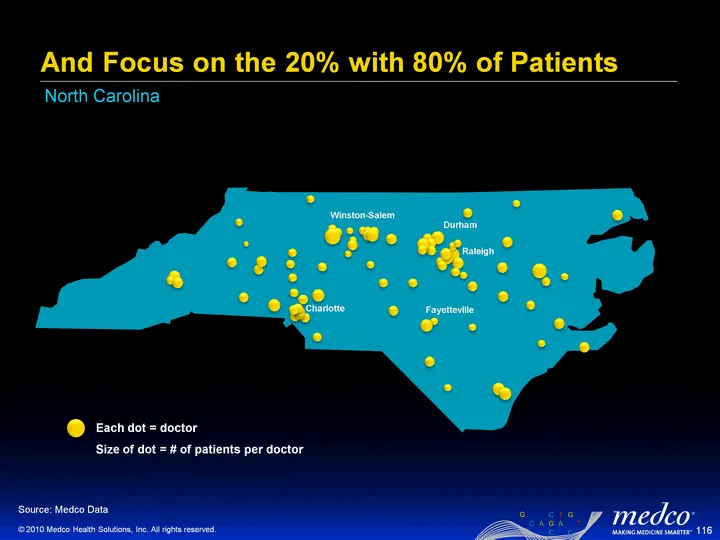
And Focus on the 20% with 80% of Patients 116 North Carolina Source: Medco Data Each dot = doctor Size of dot = # of patients per doctor
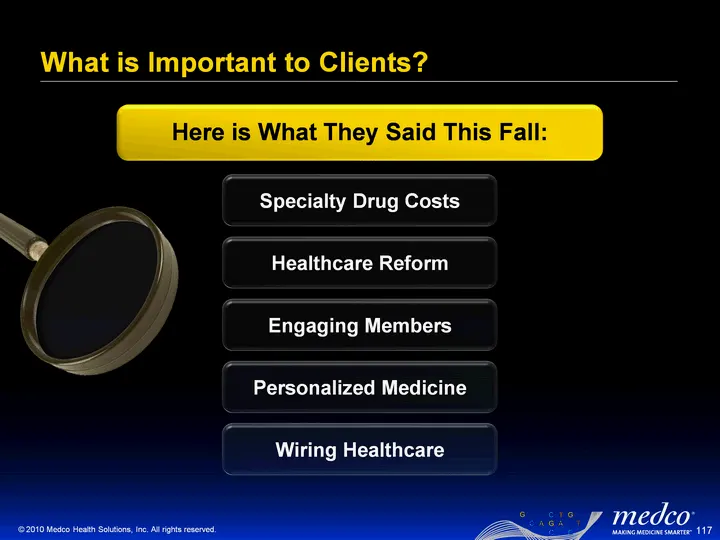
Slide 117: What is Important to Clients?
What is Important to Clients? 117 Specialty Drug Costs Healthcare Reform Engaging Members Here is What They Said This Fall: Personalized Medicine Wiring Healthcare
Slide 118: Retiree Solutions
Retiree Solutions Mary T. Daschner, RPh 118 Group President, Government PBM
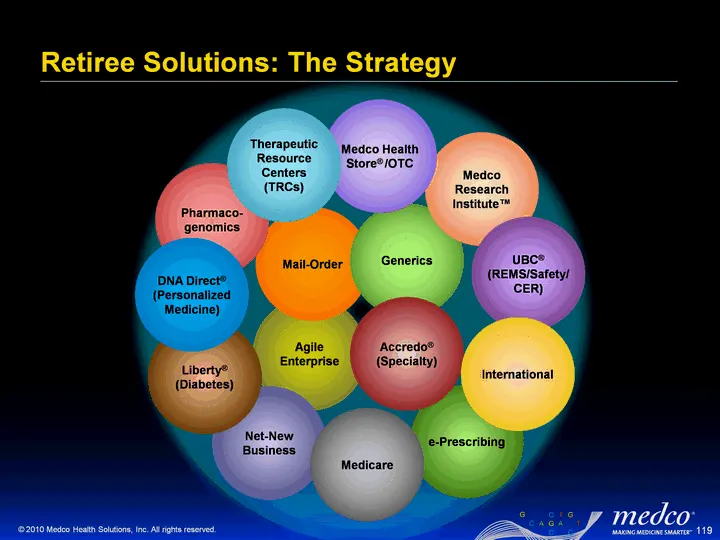
Slide 119: Retiree Solutions: The Strategy
e-Prescribing Agile Enterprise Mail-Order Generics Accredo(r) (Specialty) Net-New Business Medicare Liberty(r) (Diabetes) Medco Research Institute(tm) Medco Health Store(r) /OTC UBC(r) (REMS/Safety/ CER) Pharmaco- genomics DNA Direct(r) (Personalized Medicine) Therapeutic Resource Centers (TRCs) Int
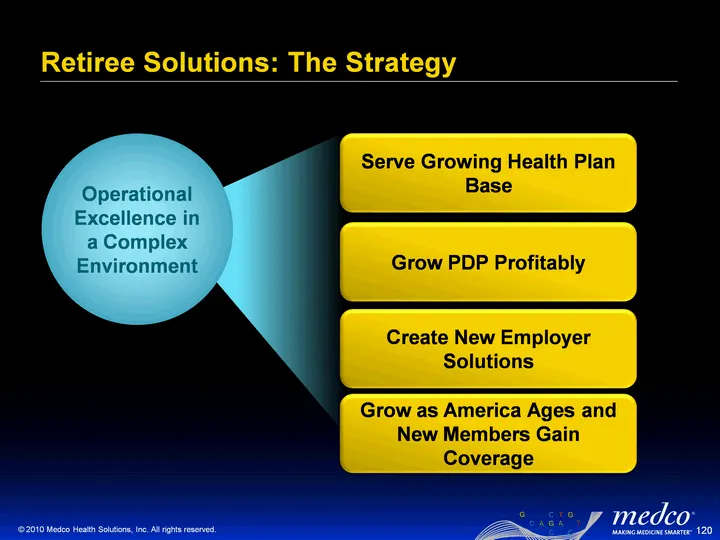
Slide 120: Retiree Solutions: The Strategy
Operational Excellence in a Complex Environment Retiree Solutions: The Strategy 120 Serve Growing Health Plan Base Grow PDP Profitably Create New Employer Solutions Grow as America Ages and New Members Gain Coverage
Slide 121: Retiree Solutions: The Evolution of Complexity
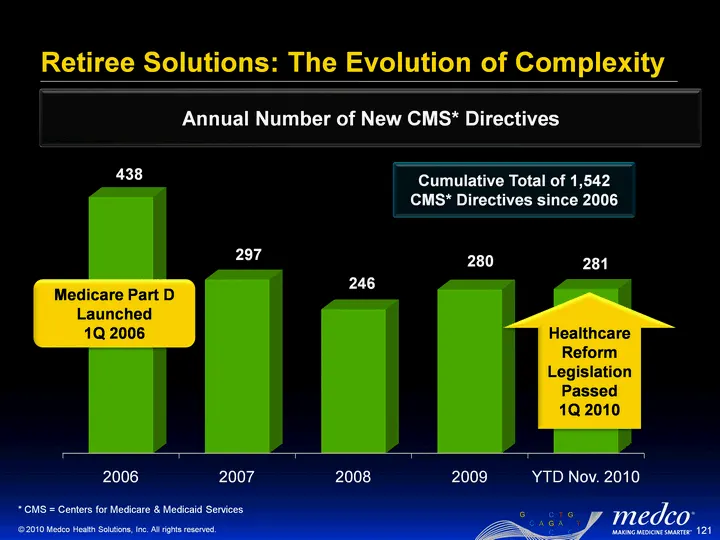
Retiree Solutions: The Evolution of Complexity 121 * CMS = Centers for Medicare & Medicaid Services (CHART) Medicare Part D Launched 1Q 2006 Annual Number of New CMS* Directives Healthcare Reform Legislation Passed 1Q 2010 Cumulative Total of 1,542 CMS* Directives since 2006
Slide 122: Medco Manages Compliance Complexity with Agility and Accuracy
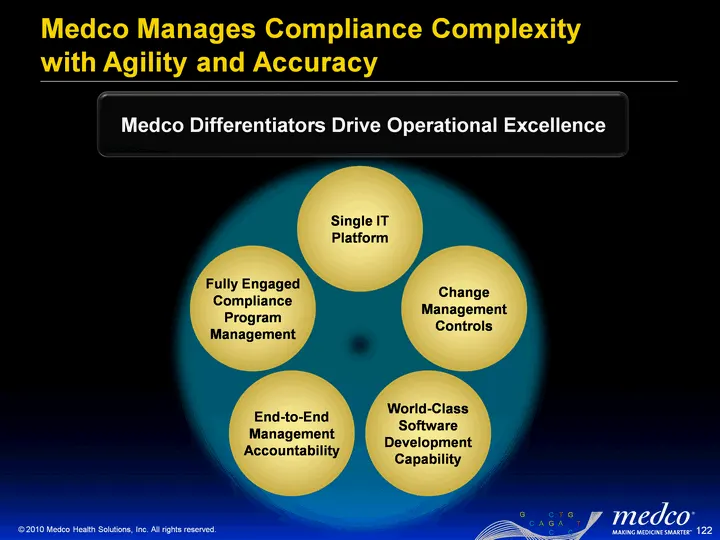
Medco Manages Compliance Complexity with Agility and Accuracy 122 Medco Differentiators Drive Operational Excellence Single IT Platform Change Management Controls World-Class Software Development Capability End-to-End Management Accountability Fully Engaged Compliance Program Management
Slide 123: Retiree Solutions: The Result of Operational Excellence
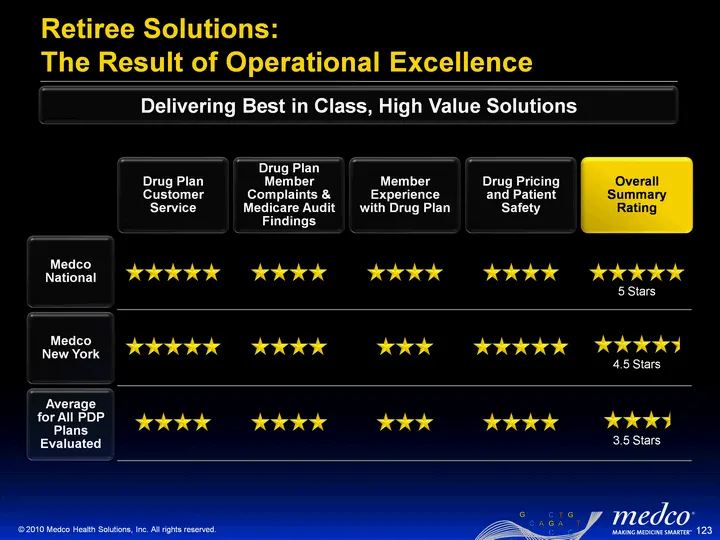
Retiree Solutions: The Result of Operational Excellence 123 Delivering Best in Class, High Value Solutions Drug Plan Customer Service Drug Plan Member Complaints & Medicare Audit Findings Member Experience with Drug Plan Drug Pricing and Patient Safety Overall Summary Rating Medco National Medco New
Slide 124: Medco Receives the Highest Possible CMS Star Rating
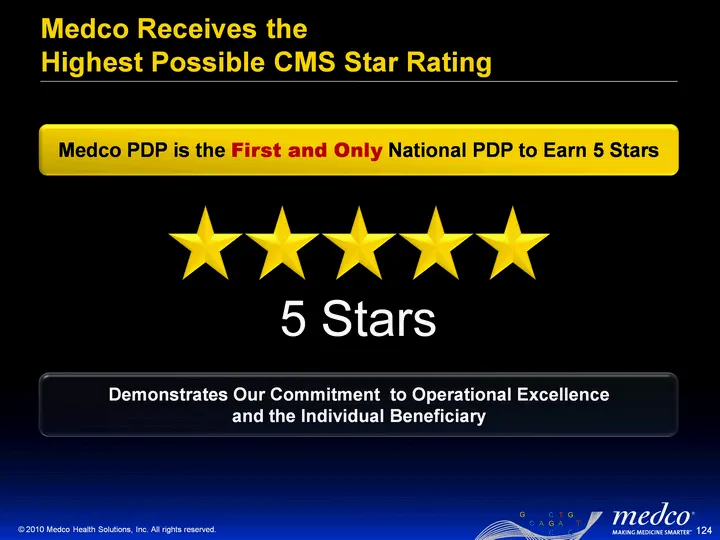
Medco Receives the Highest Possible CMS Star Rating 124 5 Stars Demonstrates Our Commitment to Operational Excellence and the Individual Beneficiary Medco PDP is the First and Only National PDP to Earn 5 Stars
Slide 125: Operational Excellence Drives Opportunities for Portfolio Growth
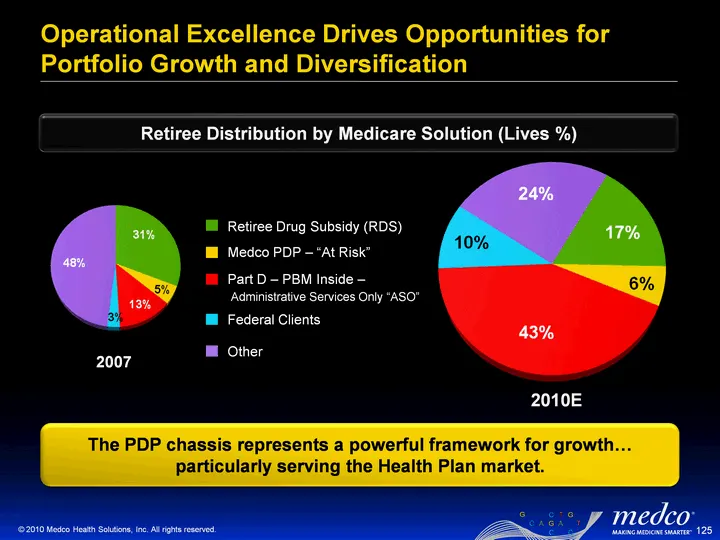
The PDP chassis represents a powerful framework for growth... particularly serving the Health Plan market. Operational Excellence Drives Opportunities for Portfolio Growth and Diversification 125 2007 2010E Retiree Drug Subsidy (RDS) Federal Clients Part D - PBM Inside - Administrative Services Only
Slide 126: The PDP Chassis - Medco's Retiree Growth Engine
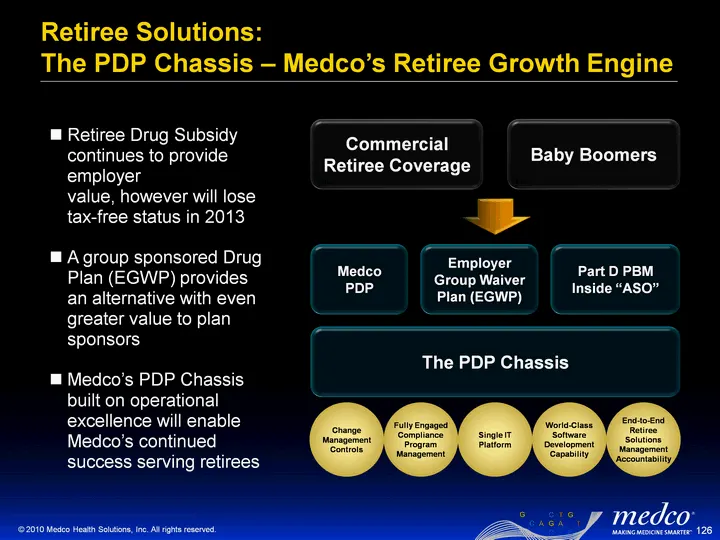
Retiree Solutions: The PDP Chassis - Medco's Retiree Growth Engine 126 The PDP Chassis Medco PDP Employer Group Waiver Plan (EGWP) Part D PBM Inside "ASO" Commercial Retiree Coverage Retiree Drug Subsidy continues to provide employer value, however will lose tax-free status in 2013 A group sponsored
Slide 127: Retiree Solutions PDP Generates Direct Value to Medco
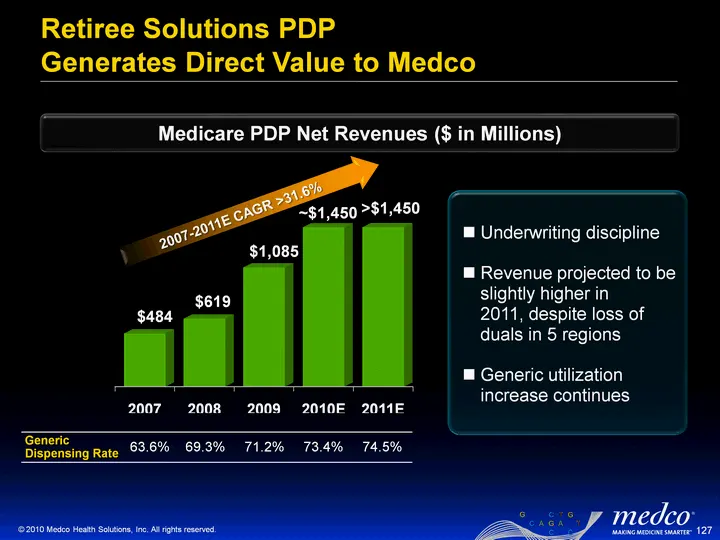
Retiree Solutions PDP Generates Direct Value to Medco 127 (CHART) Medicare PDP Net Revenues ($ in Millions) Generic Dispensing Rate 63.6% 69.3% 71.2% 73.4% 74.5% 2007-2011E CAGR >31.6% Underwriting discipline Revenue projected to be slightly higher in 2011, despite loss of duals in 5 regions Generic
Slide 128: Medco PDP Strategy - Retain Dual Eligibles Where Profitable
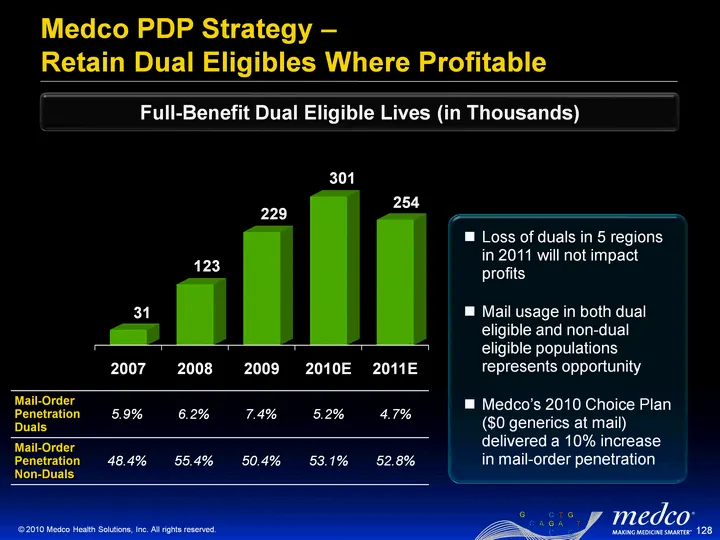
Medco PDP Strategy - Retain Dual Eligibles Where Profitable 128 (CHART) Mail-Order Penetration Duals 5.9% 6.2% 7.4% 5.2% 4.7% Mail-Order Penetration Non-Duals 48.4% 55.4% 50.4% 53.1% 52.8% Full-Benefit Dual Eligible Lives (in Thousands) Loss of duals in 5 regions in 2011 will not impact profits Mail
Slide 129: Group PDP (EGWP): Creating Client Value Under Healthcare Reform
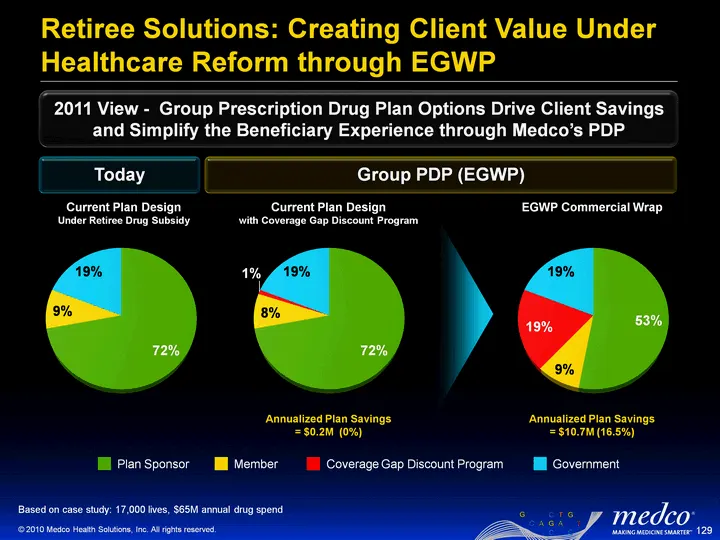
Group PDP (EGWP) Retiree Solutions: Creating Client Value Under Healthcare Reform through EGWP 129 Based on case study: 17,000 lives, $65M annual drug spend Current Plan Design Under Retiree Drug Subsidy Annualized Plan Savings = $10.7M (16.5%) EGWP Commercial Wrap Annualized Plan Savings = $0.2M (0
Slide 130: Retiree Solutions: Strategy in Motion
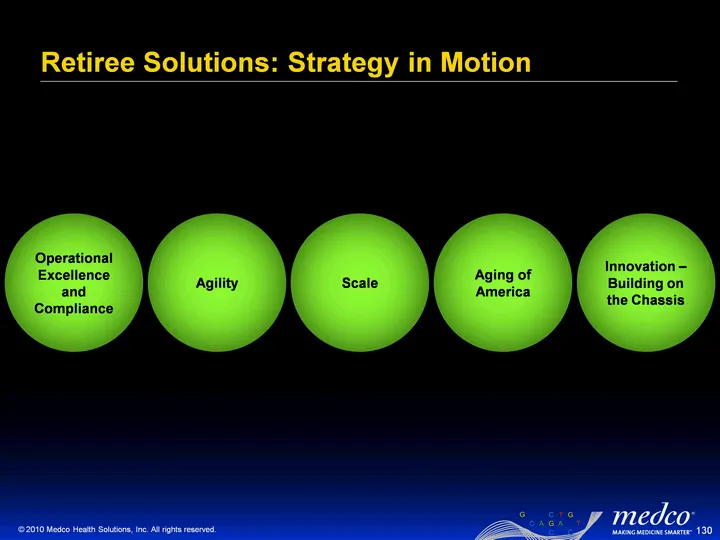
Retiree Solutions: Strategy in Motion 130 Operational Excellence and Compliance Innovation - Building on the Chassis Scale Aging of America Agility
Slide 131: Retiree Solutions: Strategy in Motion
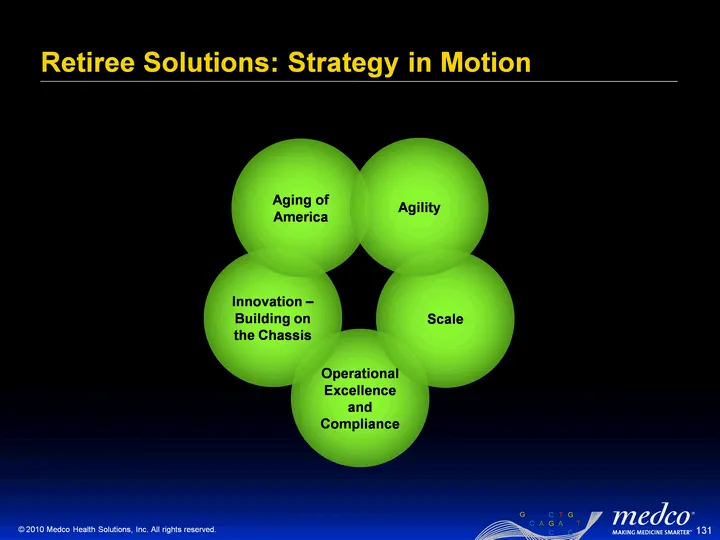
Retiree Solutions: Strategy in Motion 131 Operational Excellence and Compliance Innovation - Building on the Chassis Scale Aging of America Agility
Slide 132: Retiree Solutions: A Medco Advantage
Retiree Solutions: Strategy in Motion 132 Retiree Solutions: A Medco Advantage

Slide 133: Research Drives Safety, Savings and Earnings
Research Drives Safety, Savings and Earnings Robert S. Epstein, M.D., M.S. 133 President, Advanced Clinical Science and Research
Slide 134: Smarter Medicine: A Component of the Medco Growth Strategy
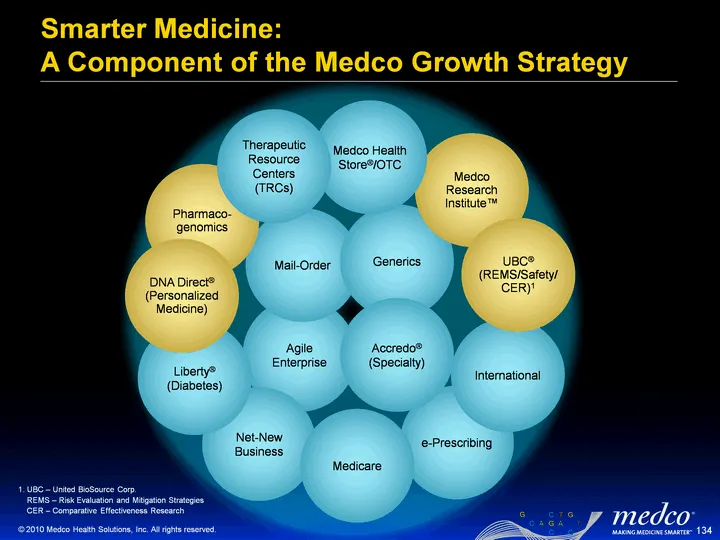
Smarter Medicine: A Component of the Medco Growth Strategy 134 1. UBC - United BioSource Corp. REMS - Risk Evaluation and Mitigation Strategies CER - Comparative Effectiveness Research e-Prescribing Agile Enterprise Mail-Order Generics Accredo(r) (Specialty) Net-New Business Medicare Liberty(r) (Dia
Slide 135: Smarter Medicine: A Component of the Medco Growth Strategy
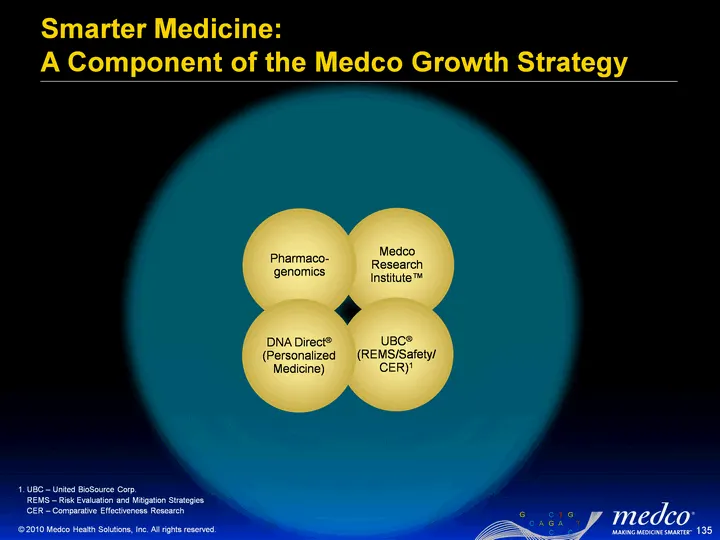
Smarter Medicine: A Component of the Medco Growth Strategy 135 1. UBC - United BioSource Corp. REMS - Risk Evaluation and Mitigation Strategies CER - Comparative Effectiveness Research Medco Research Institute(tm) UBC(r) (REMS/Safety/ CER)1 Pharmaco- genomics DNA Direct(r) (Personalized Medicine)
Slide 136: Medco Research: The Smarter Medicine Imperative
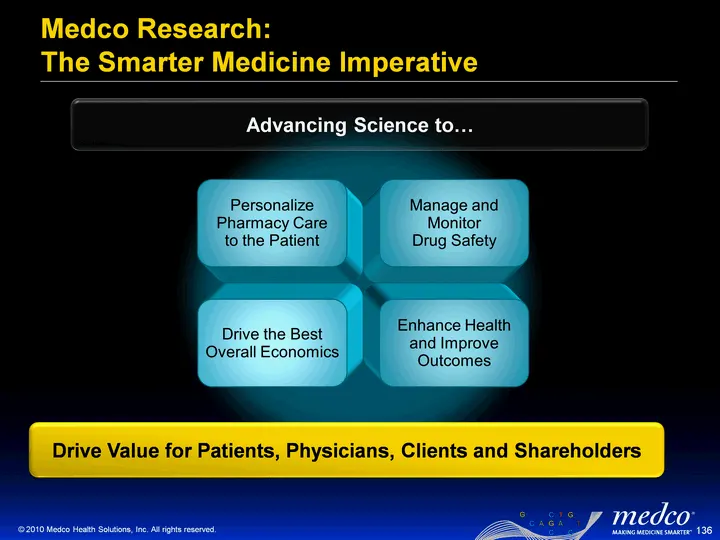
Medco Research: The Smarter Medicine Imperative 136 Drive Value for Patients, Physicians, Clients and Shareholders Personalize Pharmacy Care to the Patient Manage and Monitor Drug Safety Advancing Science to... Drive the Best Overall Economics Enhance Health and Improve Outcomes
Slide 137: Tailoring Care: The Power of DNA
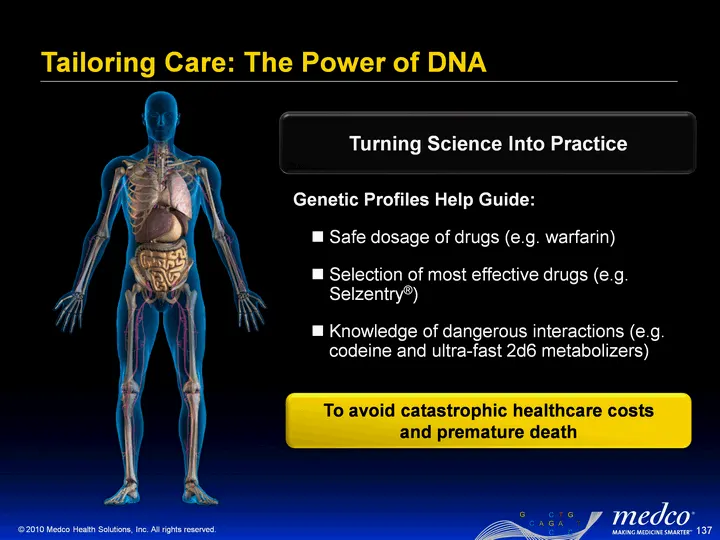
Tailoring Care: The Power of DNA 137 Genetic Profiles Help Guide: Safe dosage of drugs (e.g. warfarin) Selection of most effective drugs (e.g. Selzentry(r)) Knowledge of dangerous interactions (e.g. codeine and ultra-fast 2d6 metabolizers) Turning Science Into Practice To avoid catastrophic healthca
Slide 138: Tailoring Care: How Medco Does it Today
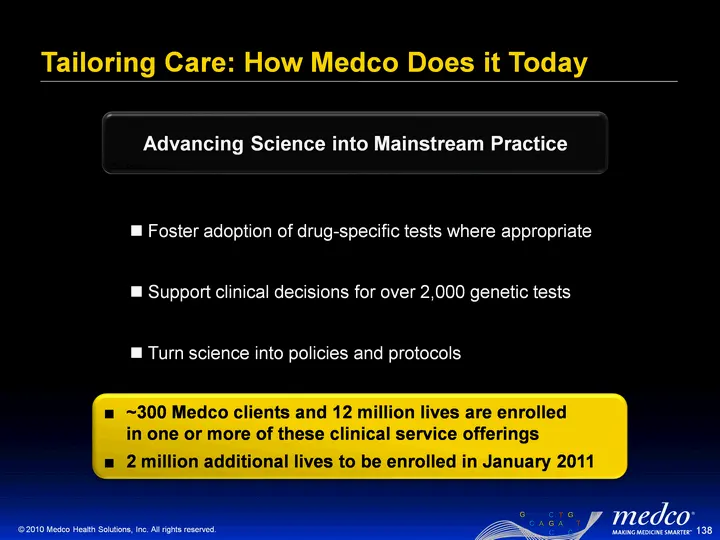
Tailoring Care: How Medco Does it Today 138 Foster adoption of drug-specific tests where appropriate Support clinical decisions for over 2,000 genetic tests Turn science into policies and protocols Advancing Science into Mainstream Practice ~300 Medco clients and 12 million lives are enrolled in one
Slide 139: Fostering Adoption of Drug-Specific Tests Where Appropriate
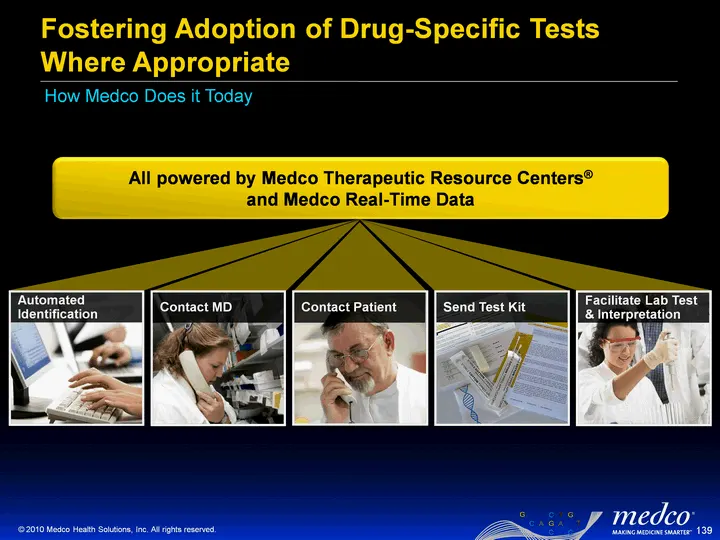
Fostering Adoption of Drug-Specific Tests Where Appropriate 139 How Medco Does it Today Automated Identification Facilitate Lab Test & Interpretation Send Test Kit Contact MD Contact Patient All powered by Medco Therapeutic Resource Centers(r) and Medco Real-Time Data
Slide 140: Supporting Clinical Decisions for Over 2,000 Genetic Tests
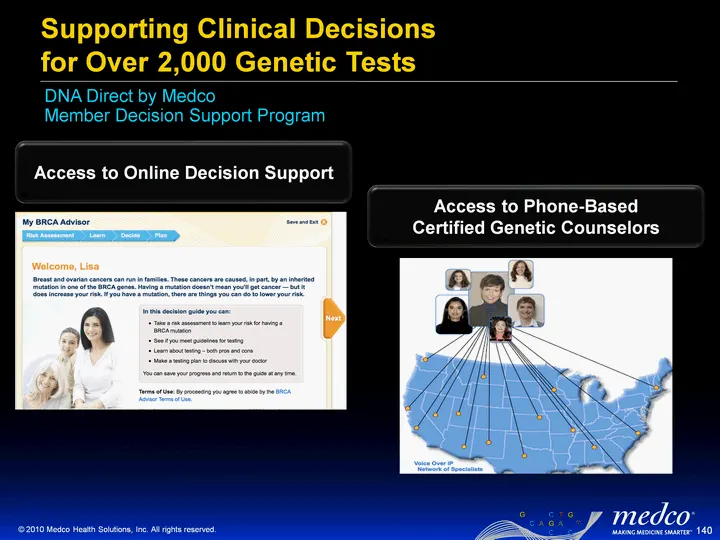
Supporting Clinical Decisions for Over 2,000 Genetic Tests 140 DNA Direct by Medco Member Decision Support Program Access to Online Decision Support Access to Phone-Based Certified Genetic Counselors
Slide 141: Supporting Clinical Decisions for Over 2,000 Genetic Tests
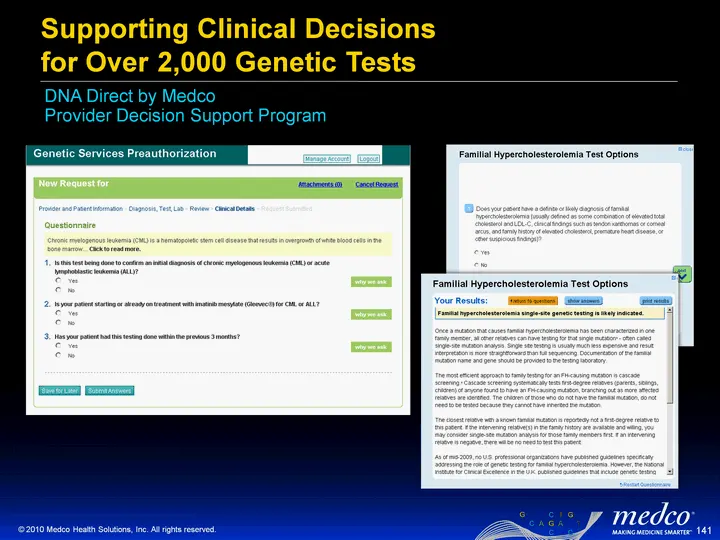
Supporting Clinical Decisions for Over 2,000 Genetic Tests 141 DNA Direct by Medco Provider Decision Support Program
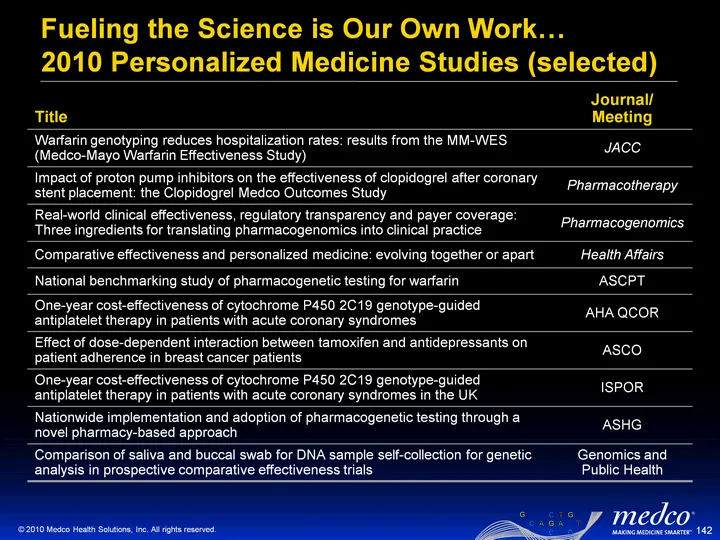
Slide 142: Fueling the Science is Our Own Work
Fueling the Science is Our Own Work... 2010 Personalized Medicine Studies (selected) 2010 Personalized Medicine Studies (selected) 2010 Personalized Medicine Studies (selected) 142
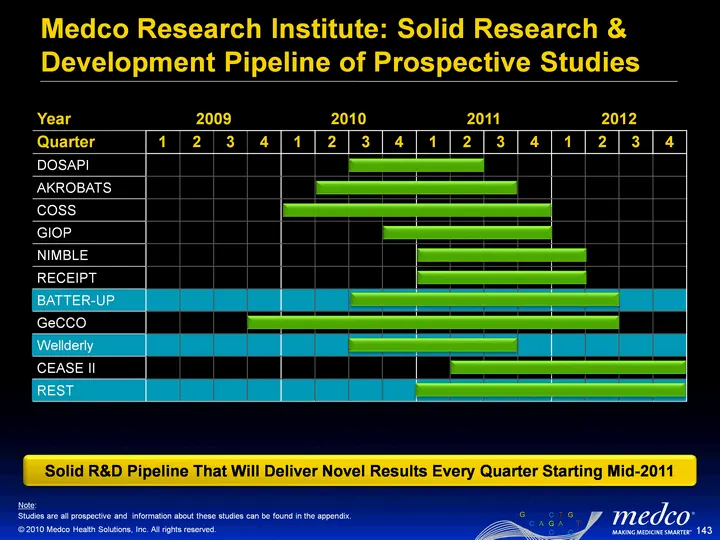
Slide 143: Medco Research Institute: R&D Pipeline of Prospective Studies
Medco Research Institute: Solid Research & Development Pipeline of Prospective Studies 143 Note: Studies are all prospective and information about these studies can be found in the appendix. Year 2009 2009 2009 2009 2010 2010 2010 2010 2011 2011 2011 2011 2012 2012 2012 2012 Quarter 1 2 3 4 1 2 3 4
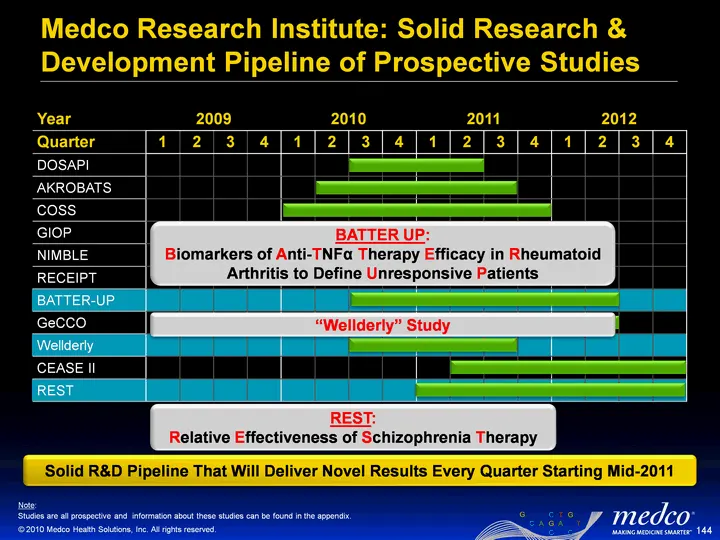
Slide 144: Medco Research Institute: R&D Pipeline of Prospective Studies
Medco Research Institute: Solid Research & Development Pipeline of Prospective Studies 144 Note: Studies are all prospective and information about these studies can be found in the appendix. Year 2009 2009 2009 2009 2010 2010 2010 2010 2011 2011 2011 2011 2012 2012 2012 2012 Quarter 1 2 3 4 1 2 3 4
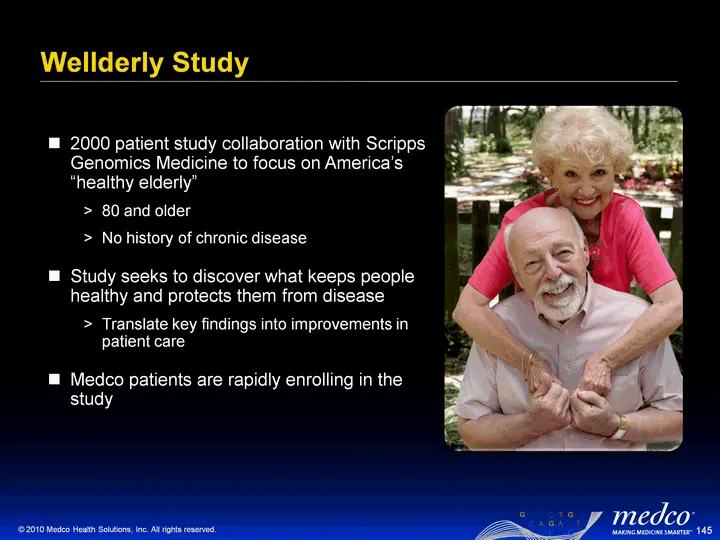
Slide 145: Wellderly Study
Wellderly Study 145 2000 patient study collaboration with Scripps Genomics Medicine to focus on America's "healthy elderly" 80 and older No history of chronic disease Study seeks to discover what keeps people healthy and protects them from disease Translate key findings into improvements in patient
Slide 146: REST Study: Medco Addresses Neuropsychiatry Category
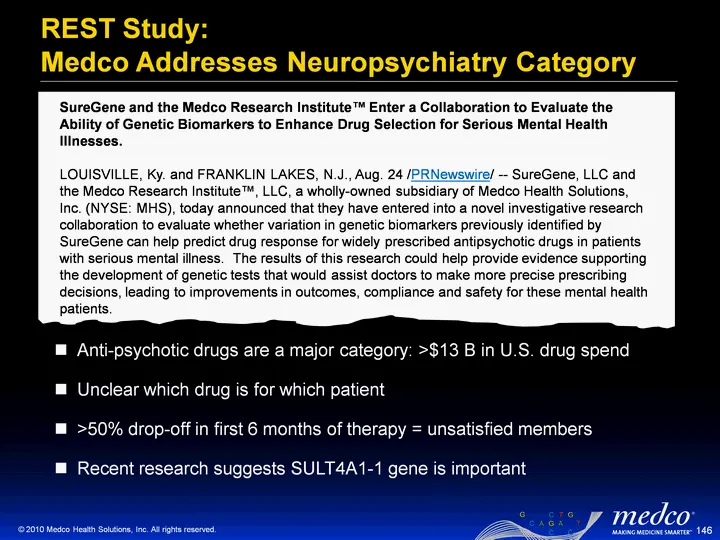
REST Study: Medco Addresses Neuropsychiatry Category Anti-psychotic drugs are a major category: >$13 B in U.S. drug spend Unclear which drug is for which patient >50% drop-off in first 6 months of therapy = unsatisfied members Recent research suggests SULT4A1-1 gene is important 146 SureGene and the
Slide 147: REST Study: Prior Research
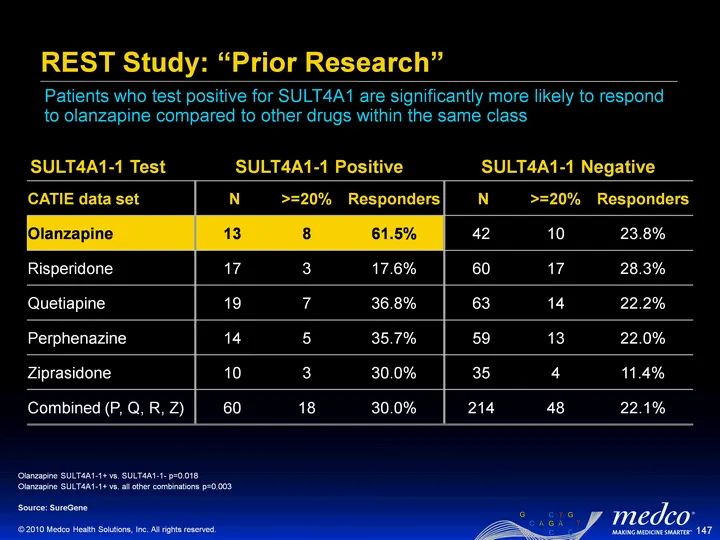
REST Study: "Prior Research" Olanzapine SULT4A1-1+ vs. SULT4A1-1- p=0.018 Olanzapine SULT4A1-1+ vs. all other combinations p=0.003 Source: SureGene SULT4A1-1 Test SULT4A1-1 Positive SULT4A1-1 Positive SULT4A1-1 Positive SULT4A1-1 Negative SULT4A1-1 Negative SULT4A1-1 Negative CATIE data set N >=20%
Slide 148: BATTER-UP: Rheumatoid Arthritis
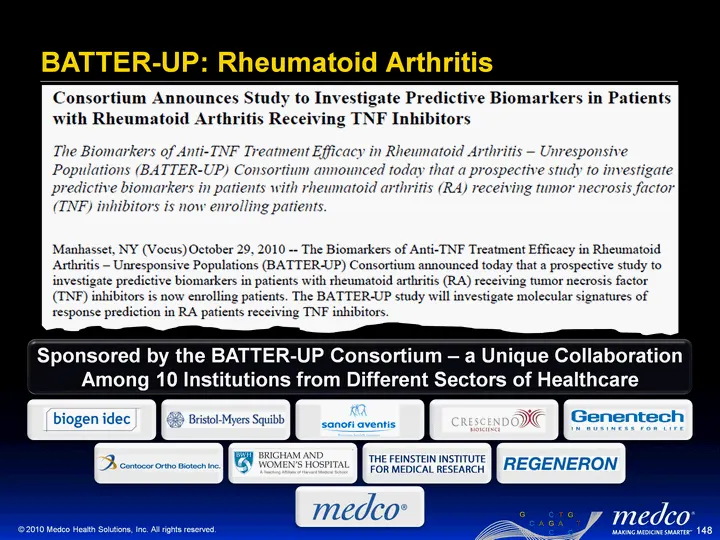
BATTER-UP: Rheumatoid Arthritis 148 Sponsored by the BATTER-UP Consortium - a Unique Collaboration Among 10 Institutions from Different Sectors of Healthcare
Slide 149: Latest on BATTER UP Study
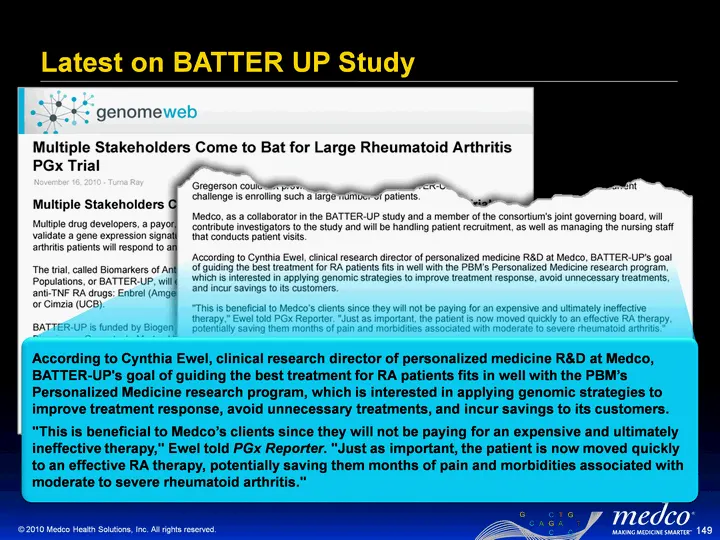
Latest on BATTER UP Study 149 According to Cynthia Ewel, clinical research director of personalized medicine R&D at Medco, BATTER-UP's goal of guiding the best treatment for RA patients fits in well with the PBM's Personalized Medicine research program, which is interested in applying genomic strate
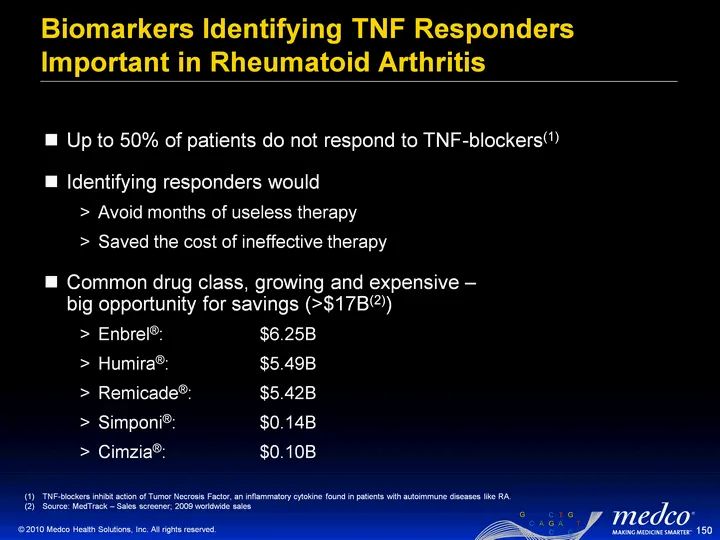
Slide 150: Biomarkers Identifying TNF Responders Important in Rheumatoid Arthritis
Biomarkers Identifying TNF Responders Important in Rheumatoid Arthritis Up to 50% of patients do not respond to TNF-blockers(1) Identifying responders would Avoid months of useless therapy Saved the cost of ineffective therapy Common drug class, growing and expensive - big opportunity for savings (>
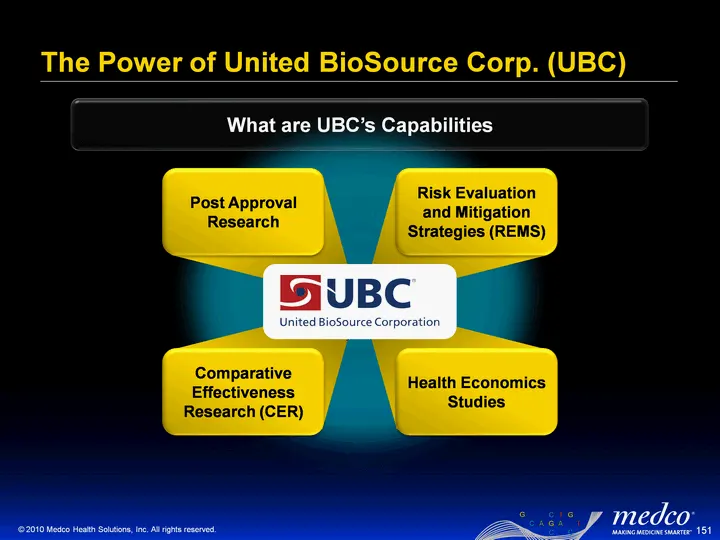
Slide 151: The Power of United BioSource Corp. (UBC)
The Power of United BioSource Corp. (UBC) 151 What are UBC's Capabilities Post Approval Research Comparative Effectiveness Research (CER) Health Economics Studies Risk Evaluation and Mitigation Strategies (REMS)
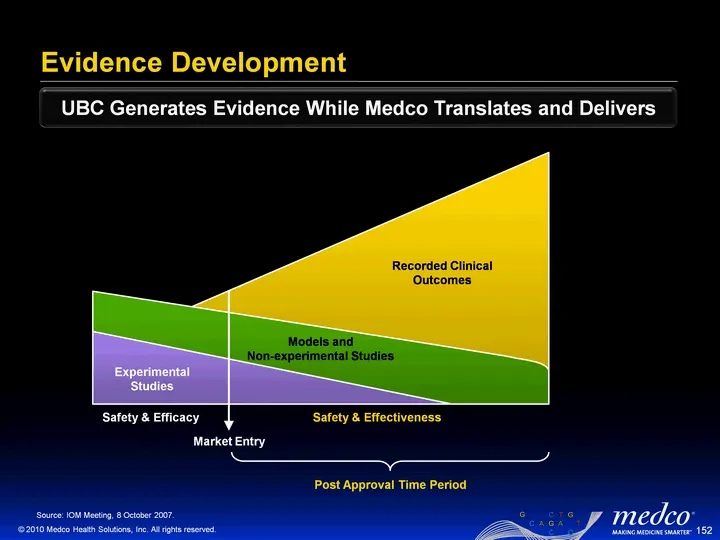
Slide 152: UBC Generates Evidence While Medco Translates and Delivers
Source: IOM Meeting, 8 October 2007. Evidence Development 152 Recorded Clinical Outcomes Safety & Efficacy Safety & Effectiveness Post Approval Time Period Market Entry Models and Non-experimental Studies Experimental Studies UBC Generates Evidence While Medco Translates and Delivers
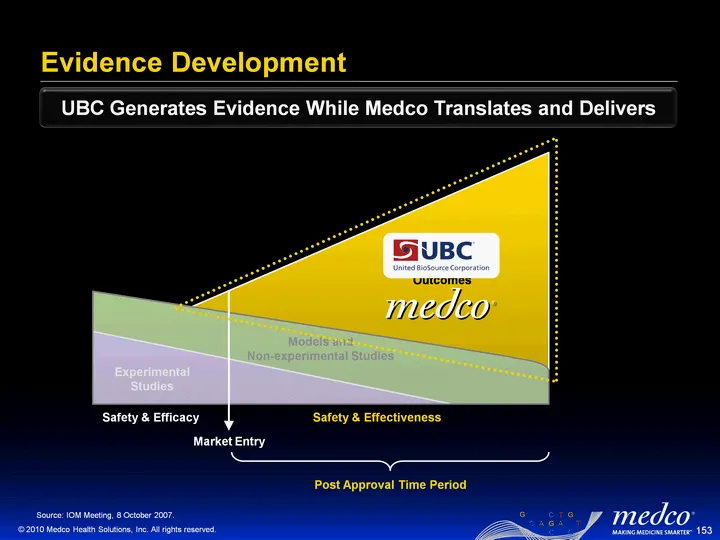
Slide 153: UBC Generates Evidence While Medco Translates and Delivers
Source: IOM Meeting, 8 October 2007. Evidence Development 153 Recorded Clinical Outcomes Safety & Efficacy Safety & Effectiveness Post Approval Time Period Market Entry Models and Non-experimental Studies Experimental Studies UBC Generates Evidence While Medco Translates and Delivers
Slide 154: UBC - Growing in a Growth Industry
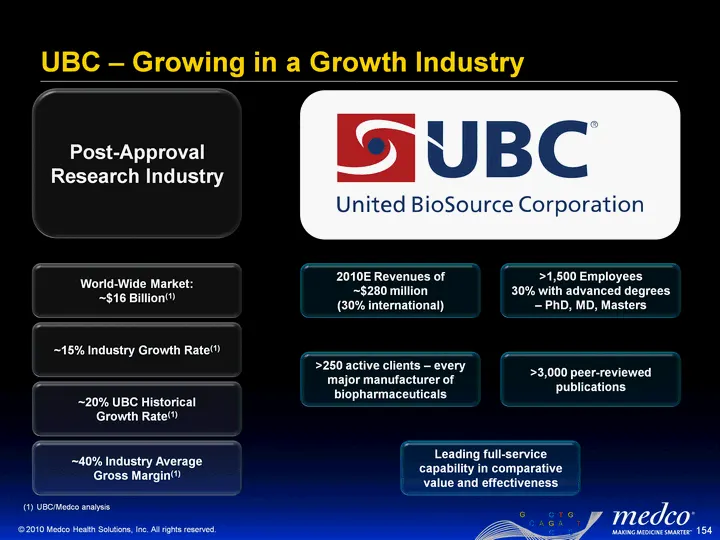
UBC - Growing in a Growth Industry 154 World-Wide Market: ~$16 Billion(1) ~15% Industry Growth Rate(1) Post-Approval Research Industry ~40% Industry Average Gross Margin(1) >1,500 Employees 30% with advanced degrees - - PhD, MD, Masters 2010E Revenues of ~$280 million (30% international) >3,000 peer
Slide 155: What is a Risk Evaluation and Mitigation Strategies (REMS) Study?
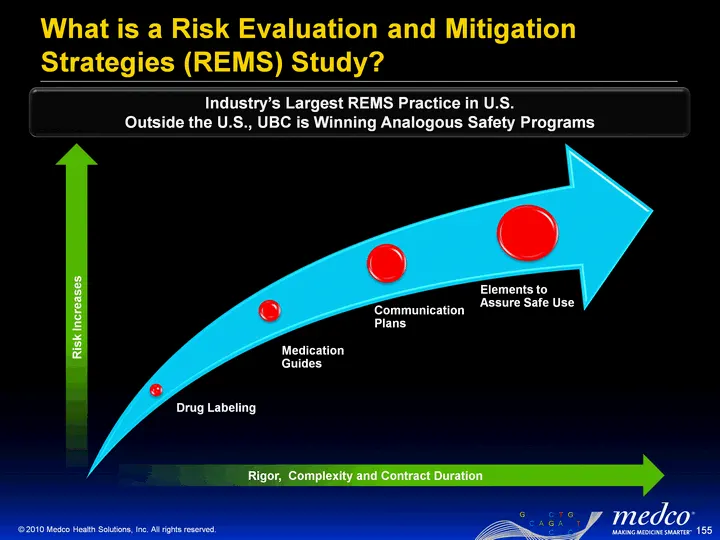
What is a Risk Evaluation and Mitigation Strategies (REMS) Study? 155 Drug Labeling Medication Guides Communication Plans Elements to Assure Safe Use Risk Increases Rigor, Complexity and Contract Duration Industry's Largest REMS Practice in U.S. Outside the U.S., UBC is Winning Analogous Safety Prog
Slide 156: The Number of Post-Approval Research Studies is Growing
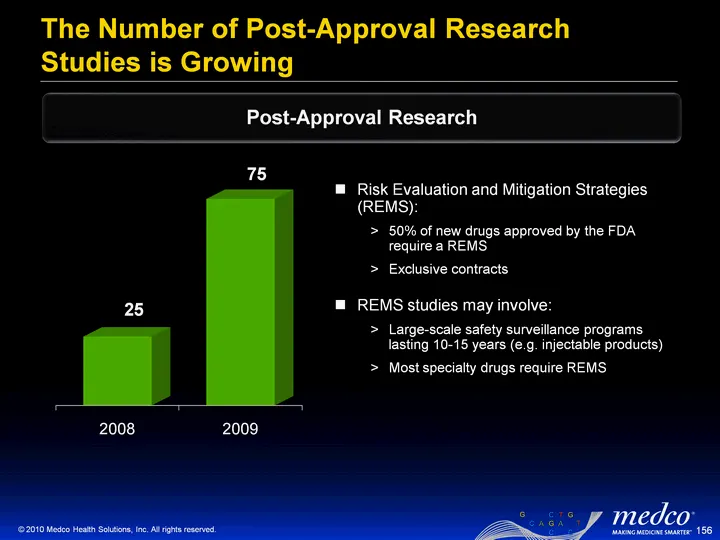
The Number of Post-Approval Research Studies is Growing 156 156 Risk Evaluation and Mitigation Strategies (REMS): 50% of new drugs approved by the FDA require a REMS Exclusive contracts REMS studies may involve: Large-scale safety surveillance programs lasting 10-15 years (e.g. injectable products)
Slide 157: UBC is Highly Regarded in the Marketplace
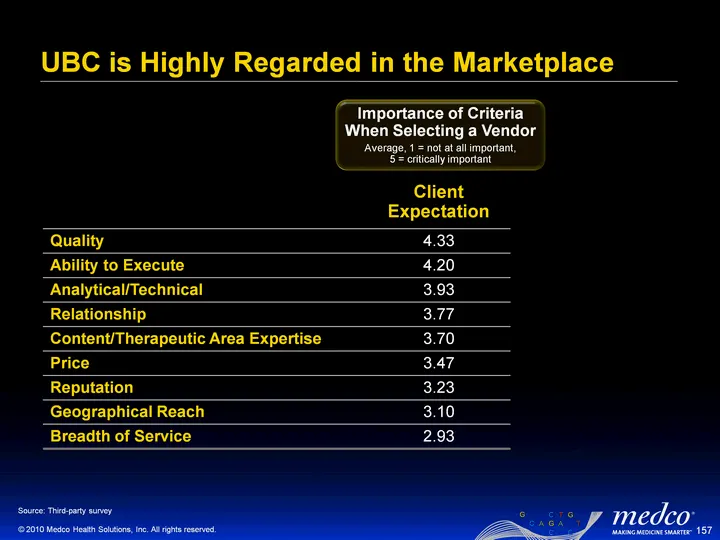
UBC is Highly Regarded in the Marketplace Source: Third-party survey 157 Importance of Criteria When Selecting a Vendor Average, 1 = not at all important, 5 = critically important Client Expectation 4.33 4.20 3.93 3.77 3.70 3.47 3.23 3.10 2.93 Quality Ability to Execute Analytical/Technical Relation
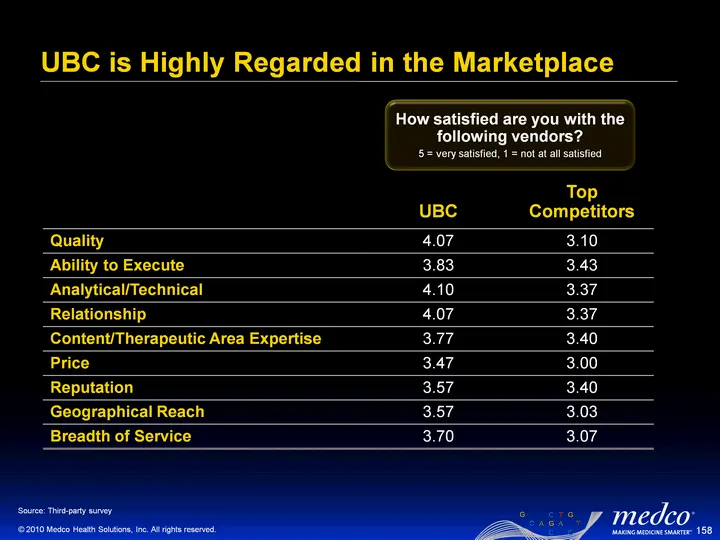
Slide 158: UBC is Highly Regarded in the Marketplace
UBC is Highly Regarded in the Marketplace Source: Third-party survey 158 Quality Ability to Execute Analytical/Technical Relationship Content/Therapeutic Area Expertise Price Reputation Geographical Reach Breadth of Service Client Expectation UBC Top Competitors Quality 4.33 4.07 3.10 Ability to Exe
Slide 159: UBC Value to the Medco Continuum
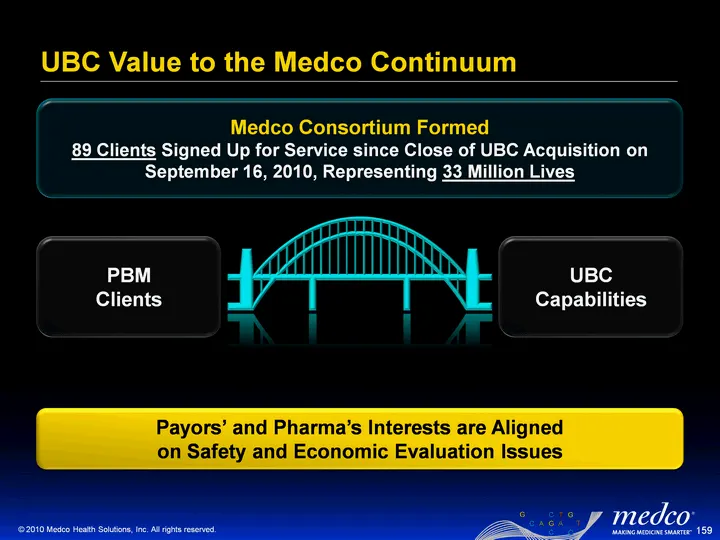
UBC Value to the Medco Continuum 159 Medco Consortium Formed 89 Clients Signed Up for Service since Close of UBC Acquisition on September 16, 2010, Representing 33 Million Lives Payors' and Pharma's Interests are Aligned on Safety and Economic Evaluation Issues PBM Clients UBC Capabilities
Slide 160: The Need for Economic Evaluation of Drugs is Global
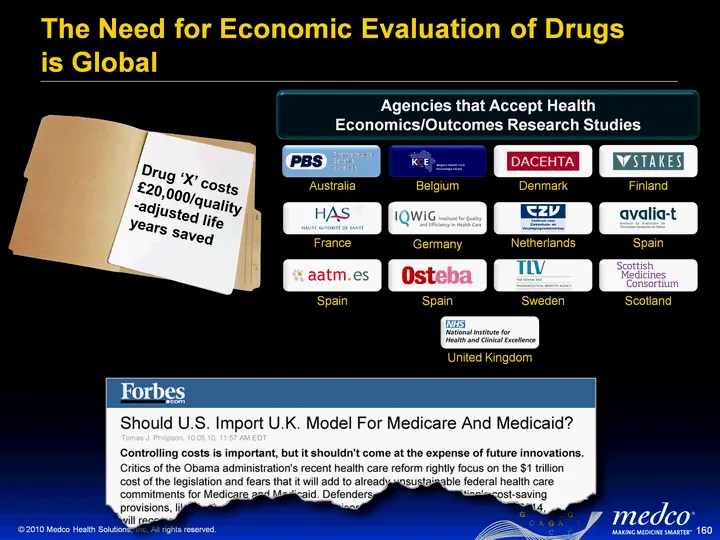
The Need for Economic Evaluation of Drugs is Global 160 Germany France Australia Agencies that Accept Health Economics/Outcomes Research Studies Drug 'X' costs £20,000/quality - -adjusted life years saved Pharmaceutical Benefits Schedule Belgium Spain Spain Netherlands Denmark United Kingdom Sweden
Slide 161: Future Growth Opportunities for UBC
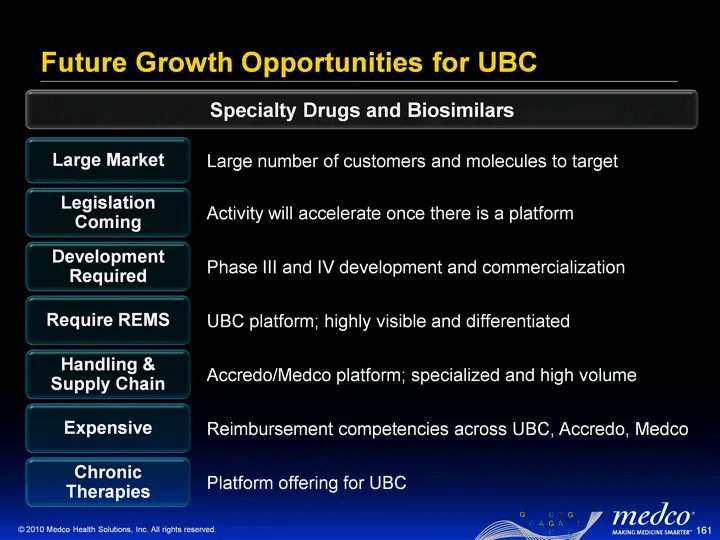
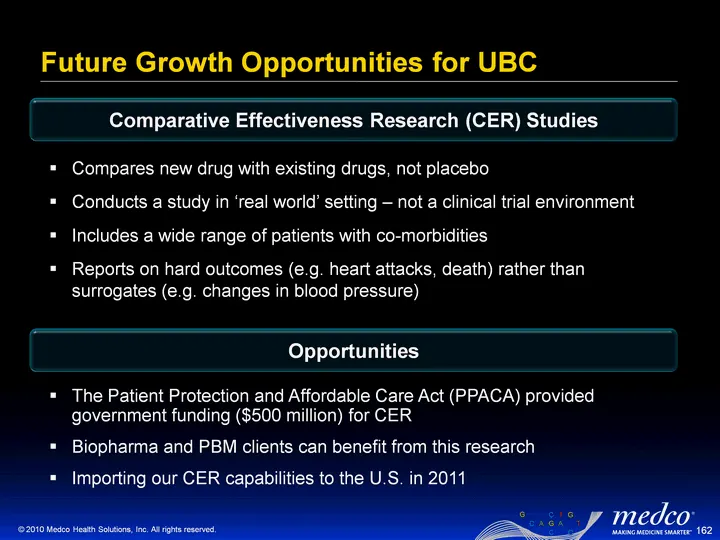
Future Growth Opportunities for UBC 161 Specialty Drugs and Biosimilars Large Market Large number of customers and molecules to target Legislation Coming Activity will accelerate once there is a platform Development Required Phase III and IV development and commercialization Require REMS UBC platfor
Slide 162: Future Growth Opportunities for UBC
Future Growth Opportunities for UBC 162 The Patient Protection and Affordable Care Act (PPACA) provided government funding ($500 million) for CER Biopharma and PBM clients can benefit from this research Importing our CER capabilities to the U.S. in 2011 Comparative Effectiveness Research (CER) Studi
Slide 163: Medco - Supporting the Evidence Continuum
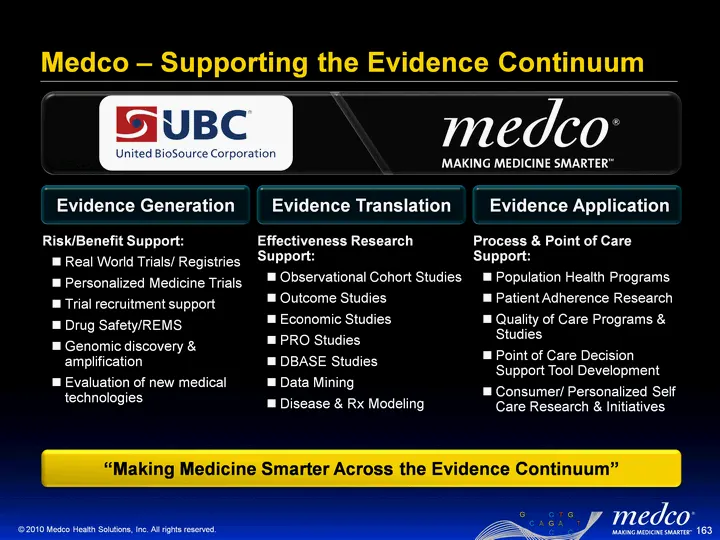
Medco - Supporting the Evidence Continuum 163 Risk/Benefit Support: Real World Trials/ Registries Personalized Medicine Trials Trial recruitment support Drug Safety/REMS Genomic discovery & amplification Evaluation of new medical technologies Evidence Generation Evidence Translation Effectiveness Re
Slide 164: Why UBC?
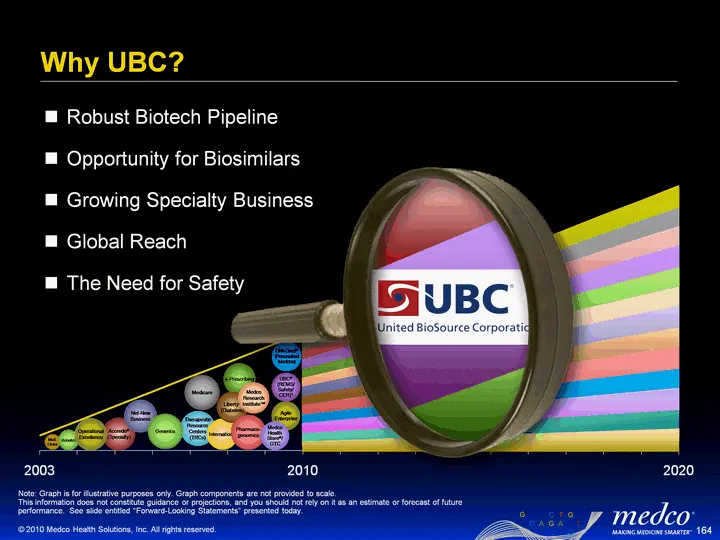
Why UBC? 164 Note: Graph is for illustrative purposes only. Graph components are not provided to scale. This information does not constitute guidance or projections, and you should not rely on it as an estimate or forecast of future performance. See slide entitled "Forward-Looking Statements" presen
Slide 165: Why UBC?
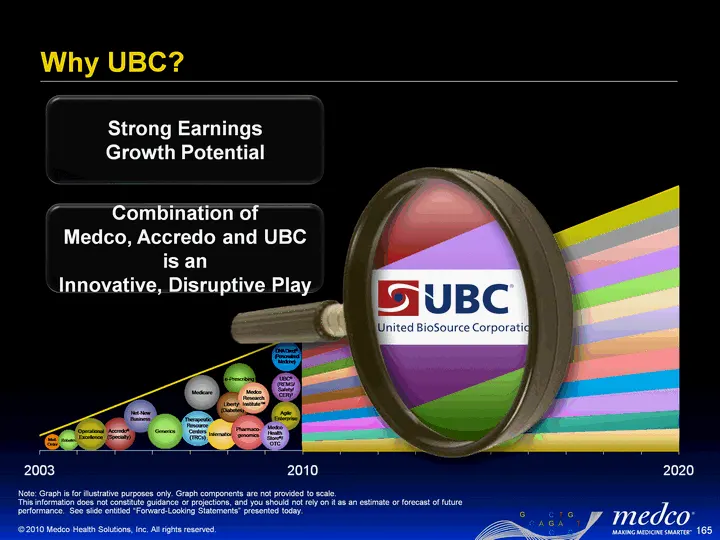
Why UBC? 165 Note: Graph is for illustrative purposes only. Graph components are not provided to scale. This information does not constitute guidance or projections, and you should not rely on it as an estimate or forecast of future performance. See slide entitled "Forward-Looking Statements" presen

Slide 166: Q&A
Q&A 166
Slide 167: Appendix
Appendix 167
Slide 168: MRI Clinical Trials Acronyms Cheat Sheet
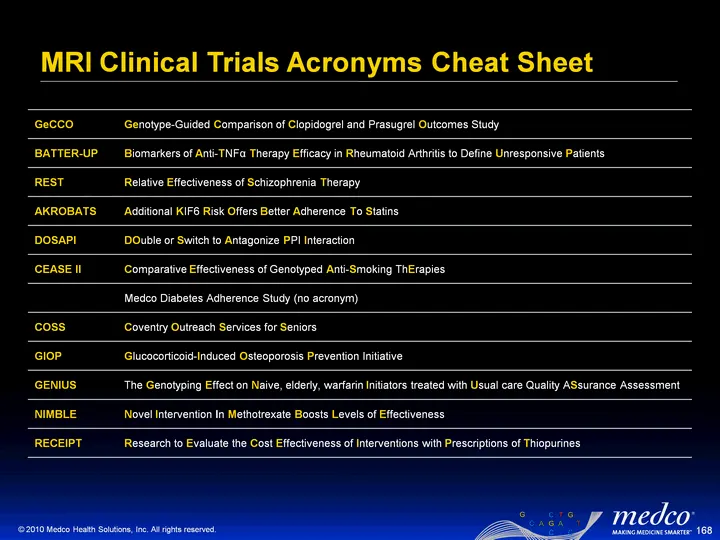
MRI Clinical Trials Acronyms Cheat Sheet 168 GeCCO Genotype-Guided Comparison of Clopidogrel and Prasugrel Outcomes Study BATTER-UP Biomarkers of Anti-TNF^ Therapy Efficacy in Rheumatoid Arthritis to Define Unresponsive Patients REST Relative Effectiveness of Schizophrenia Therapy AKROBATS Additiona
Slide 169: 2010 EPS Guidance Improved
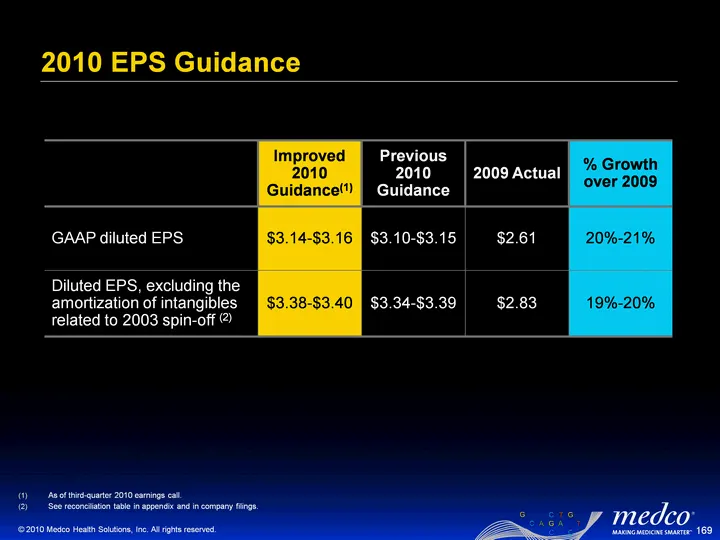
2010 EPS Guidance 169 Improved 2010 Guidance(1) Previous 2010 Guidance 2009 Actual % Growth over 2009 GAAP diluted EPS $3.14-$3.16 $3.10-$3.15 $2.61 20%-21% Diluted EPS, excluding the amortization of intangibles related to 2003 spin-off (2) $3.38-$3.40 $3.34-$3.39 $2.83 19%-20% As of third-quarter 2
Slide 170: Review of 2010 Guidance Assumptions
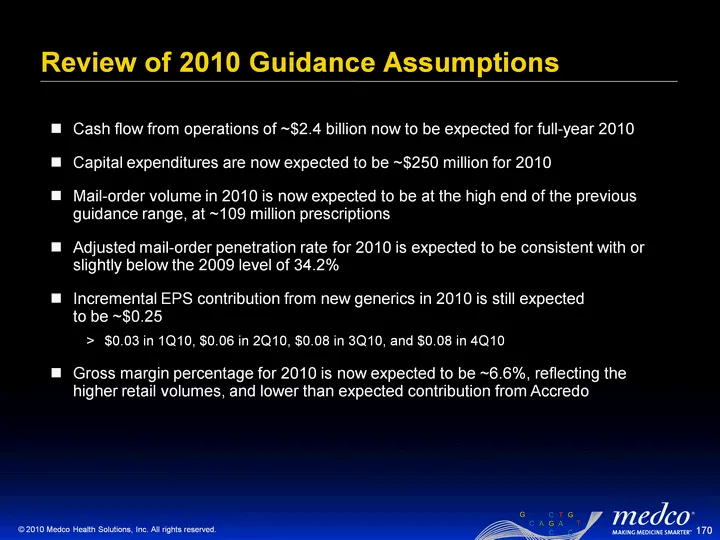
Review of 2010 Guidance Assumptions 170 Cash flow from operations of ~$2.4 billion now to be expected for full-year 2010 Capital expenditures are now expected to be ~$250 million for 2010 Mail-order volume in 2010 is now expected to be at the high end of the previous guidance range, at ~109 million
Slide 171: Review of 2010 Guidance Assumptions (cont'd)
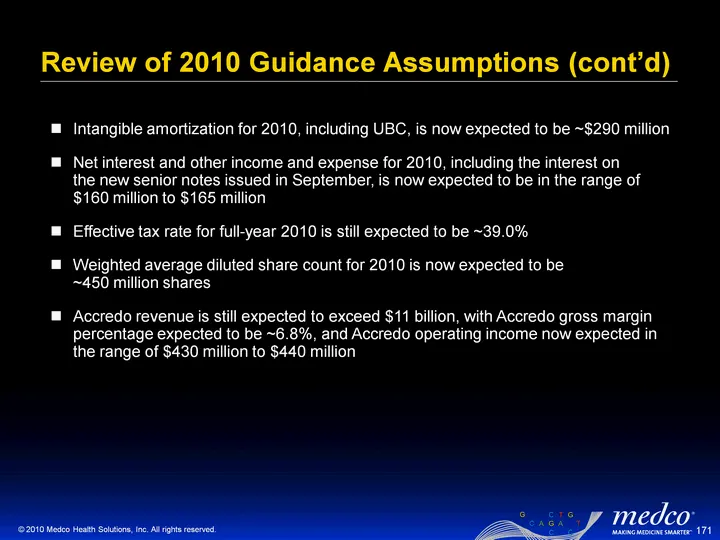
Review of 2010 Guidance Assumptions (cont'd) 171 Intangible amortization for 2010, including UBC, is now expected to be ~$290 million Net interest and other income and expense for 2010, including the interest on the new senior notes issued in September, is now expected to be in the range of $160 mil
Slide 172: Review of 2010 Guidance Assumptions (cont'd)
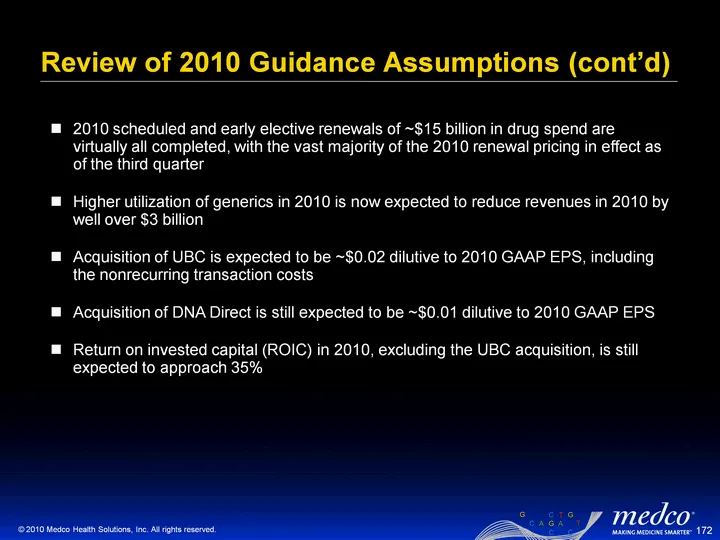
Review of 2010 Guidance Assumptions (cont'd) 172 2010 scheduled and early elective renewals of ~$15 billion in drug spend are virtually all completed, with the vast majority of the 2010 renewal pricing in effect as of the third quarter Higher utilization of generics in 2010 is now expected to reduce
Slide 173: Revised/Additional 2010 Guidance Points
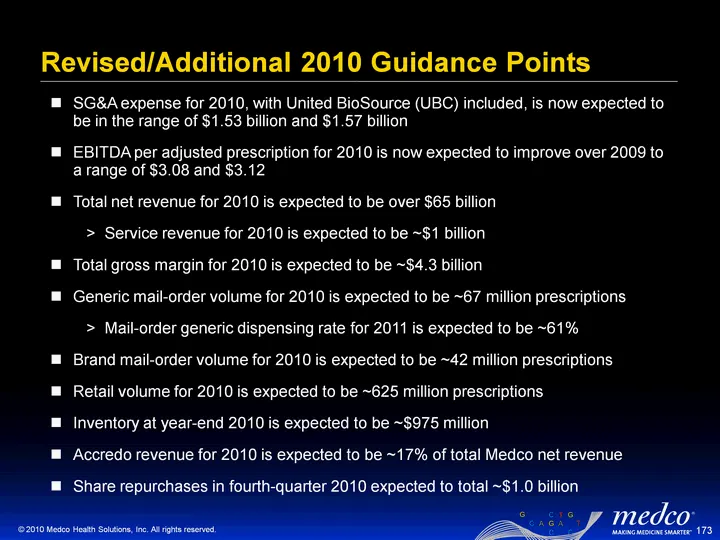
Revised/Additional 2010 Guidance Points 173 SG&A expense for 2010, with United BioSource (UBC) included, is now expected to be in the range of $1.53 billion and $1.57 billion EBITDA per adjusted prescription for 2010 is now expected to improve over 2009 to a range of $3.08 and $3.12 Total net revenu
Slide 174: 2011 EPS Guidance
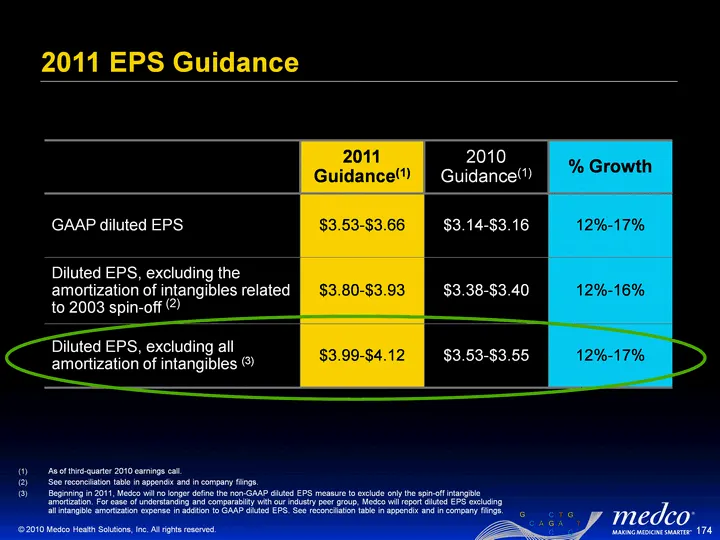
2011 EPS Guidance 174 2011 Guidance(1) 2010 Guidance(1) % Growth GAAP diluted EPS $3.53-$3.66 $3.14-$3.16 12%-17% Diluted EPS, excluding the amortization of intangibles related to 2003 spin-off (2) $3.80-$3.93 $3.38-$3.40 12%-16% Diluted EPS, excluding all amortization of intangibles (3) $3.99-$4.12
Slide 175: Review of 2011 Guidance Assumptions
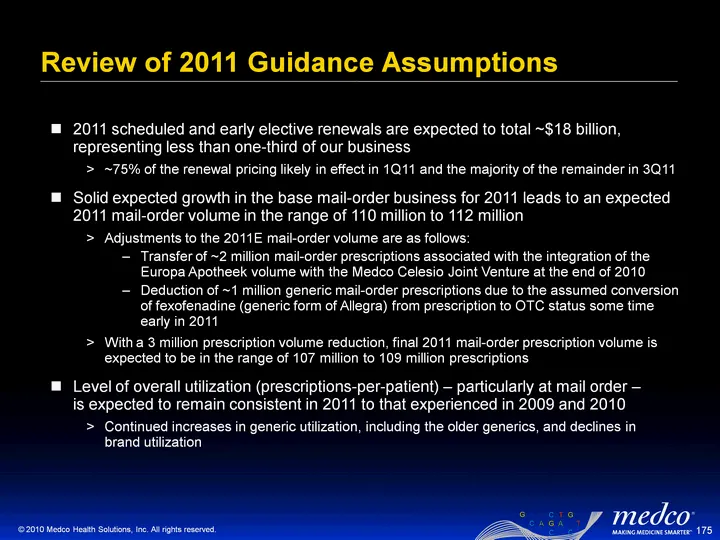
Review of 2011 Guidance Assumptions 175 2011 scheduled and early elective renewals are expected to total ~$18 billion, representing less than one-third of our business ~75% of the renewal pricing likely in effect in 1Q11 and the majority of the remainder in 3Q11 Solid expected growth in the base mai
Slide 176: Review of 2011 Guidance Assumptions (cont'd)
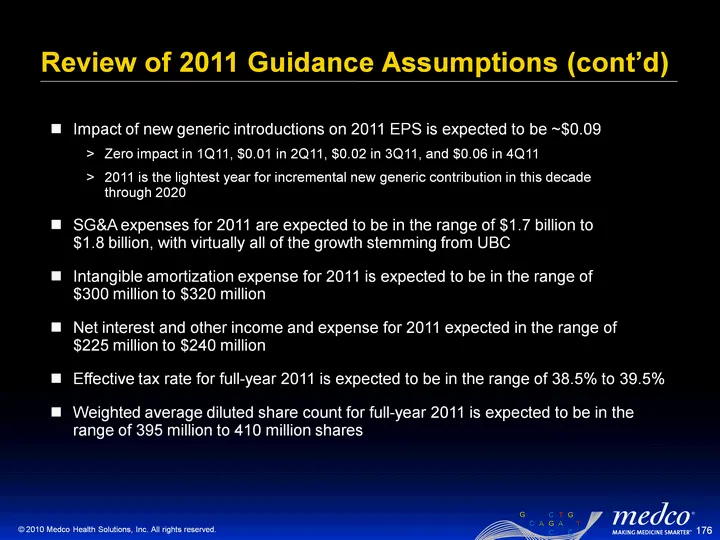
Review of 2011 Guidance Assumptions (cont'd) 176 Impact of new generic introductions on 2011 EPS is expected to be ~$0.09 Zero impact in 1Q11, $0.01 in 2Q11, $0.02 in 3Q11, and $0.06 in 4Q11 2011 is the lightest year for incremental new generic contribution in this decade through 2020 SG&A expenses
Slide 177: Review of 2011 Guidance Assumptions (cont'd)
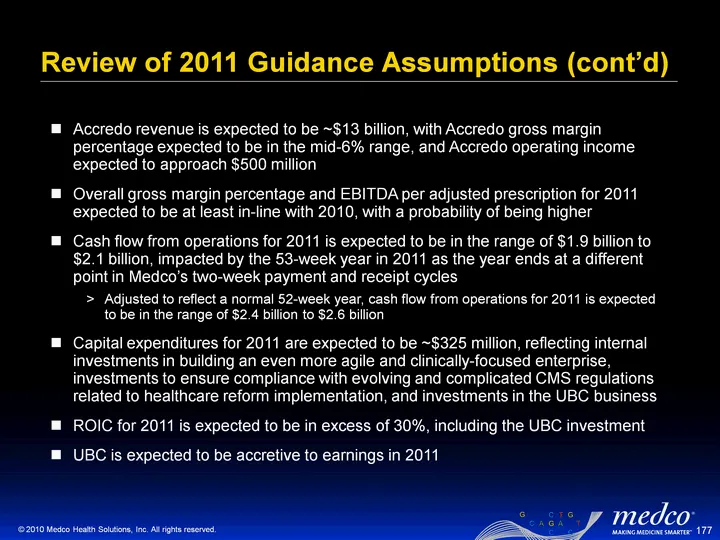
Review of 2011 Guidance Assumptions (cont'd) 177 Accredo revenue is expected to be ~$13 billion, with Accredo gross margin percentage expected to be in the mid-6% range, and Accredo operating income expected to approach $500 million Overall gross margin percentage and EBITDA per adjusted prescriptio
Slide 178: Revised/Additional 2011 Guidance Points
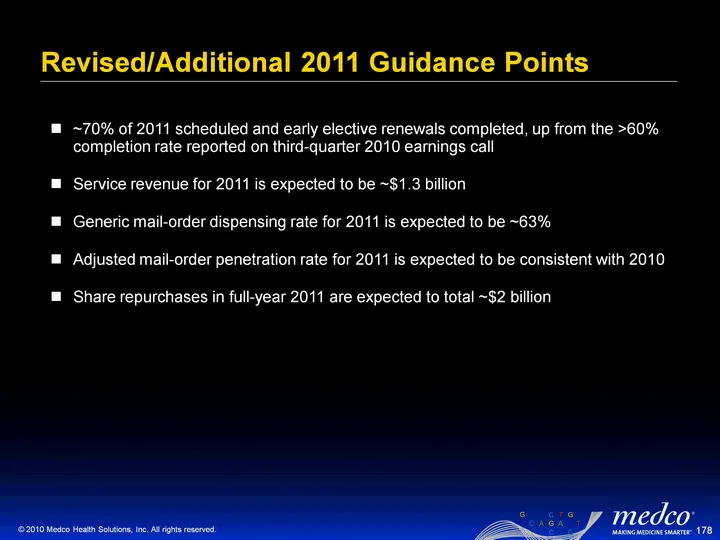
Revised/Additional 2011 Guidance Points 178 ~70% of 2011 scheduled and early elective renewals completed, up from the >60% completion rate reported on third-quarter 2010 earnings call Service revenue for 2011 is expected to be ~$1.3 billion Generic mail-order dispensing rate for 2011 is expected to
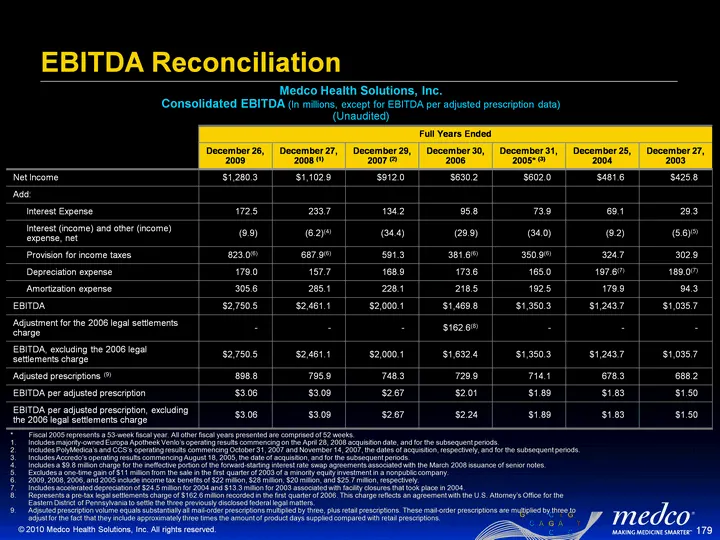
Slide 179: EBITDA Reconciliation
EBITDA Reconciliation 179 Medco Health Solutions, Inc. Consolidated EBITDA (In millions, except for EBITDA per adjusted prescription data) (Unaudited) * Fiscal 2005 represents a 53-week fiscal year. All other fiscal years presented are comprised of 52 weeks. Includes majority-owned Europa Apotheek V
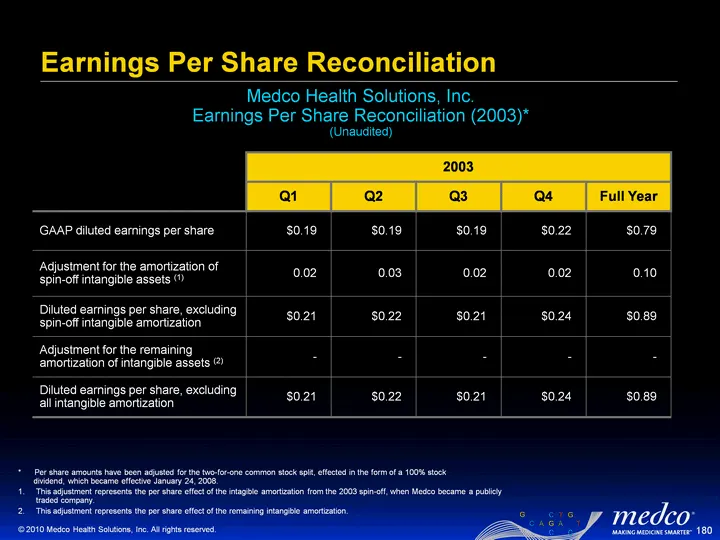
Slide 180: Earnings Per Share Reconciliation (2003)
Earnings Per Share Reconciliation 180 Medco Health Solutions, Inc. Earnings Per Share Reconciliation (2003)* (Unaudited) * Per share amounts have been adjusted for the two-for-one common stock split, effected in the form of a 100% stock dividend, which became effective January 24, 2008. This adjustm
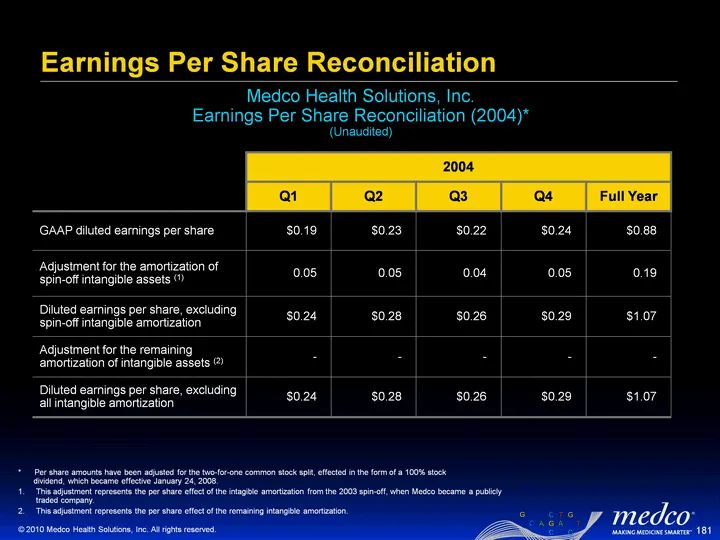
Slide 181: Earnings Per Share Reconciliation (2004)
Earnings Per Share Reconciliation 181 Medco Health Solutions, Inc. Earnings Per Share Reconciliation (2004)* (Unaudited) * Per share amounts have been adjusted for the two-for-one common stock split, effected in the form of a 100% stock dividend, which became effective January 24, 2008. This adjustm
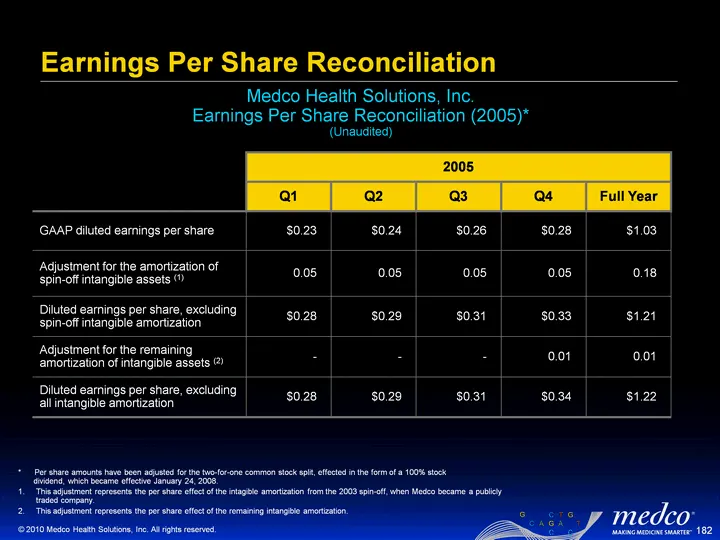
Slide 182: Earnings Per Share Reconciliation (2005)
Earnings Per Share Reconciliation 182 Medco Health Solutions, Inc. Earnings Per Share Reconciliation (2005)* (Unaudited) * Per share amounts have been adjusted for the two-for-one common stock split, effected in the form of a 100% stock dividend, which became effective January 24, 2008. This adjustm
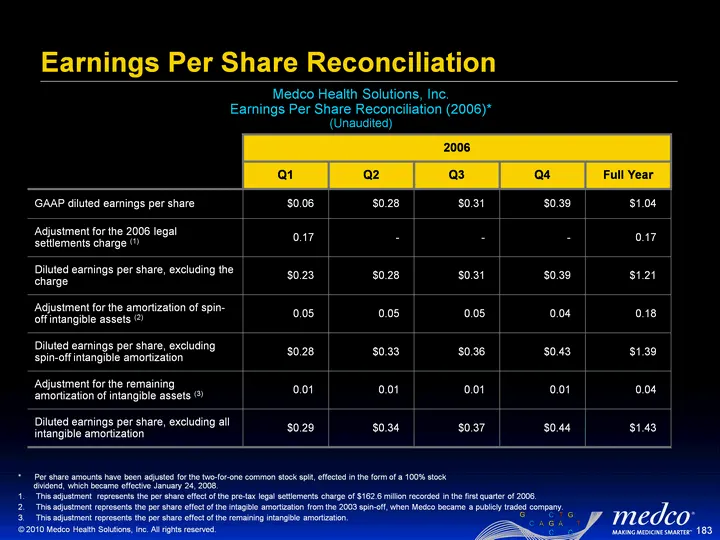
Slide 183: Earnings Per Share Reconciliation (2006)
Earnings Per Share Reconciliation 183 Medco Health Solutions, Inc. Earnings Per Share Reconciliation (2006)* (Unaudited) * Per share amounts have been adjusted for the two-for-one common stock split, effected in the form of a 100% stock dividend, which became effective January 24, 2008. This adjustm
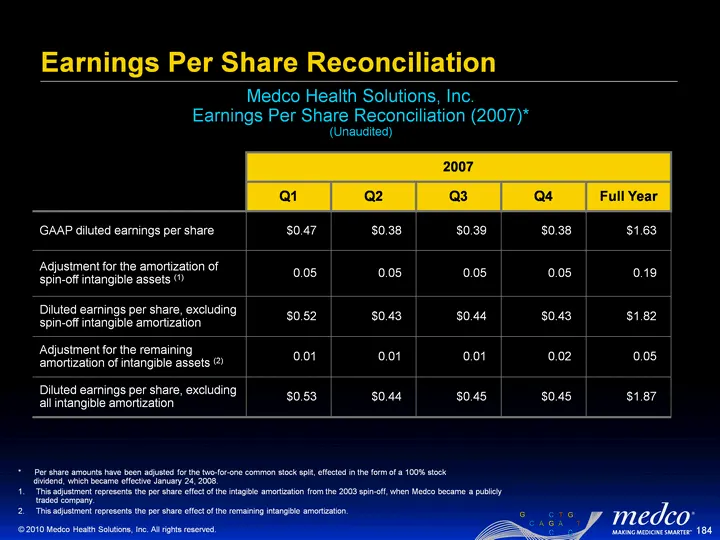
Slide 184: Earnings Per Share Reconciliation (2007)
Earnings Per Share Reconciliation 184 Medco Health Solutions, Inc. Earnings Per Share Reconciliation (2007)* (Unaudited) * Per share amounts have been adjusted for the two-for-one common stock split, effected in the form of a 100% stock dividend, which became effective January 24, 2008. This adjustm
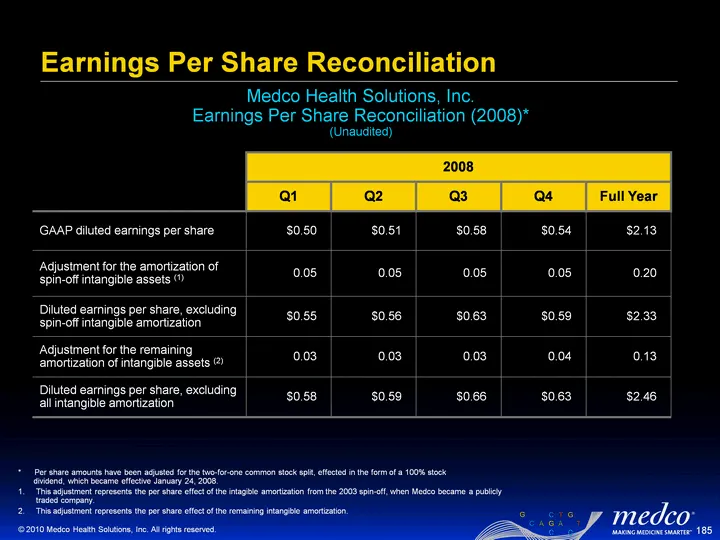
Slide 185: Earnings Per Share Reconciliation (2008)
Earnings Per Share Reconciliation 185 Medco Health Solutions, Inc. Earnings Per Share Reconciliation (2008)* (Unaudited) * Per share amounts have been adjusted for the two-for-one common stock split, effected in the form of a 100% stock dividend, which became effective January 24, 2008. This adjustm
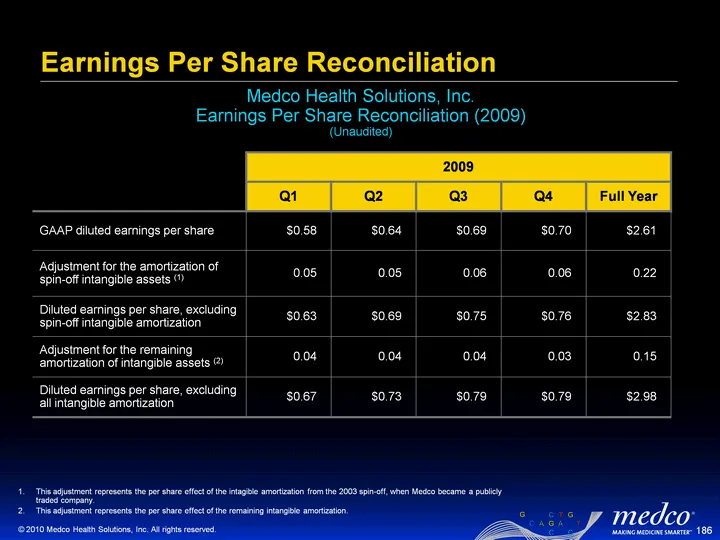
Slide 186: Earnings Per Share Reconciliation (2009)
Earnings Per Share Reconciliation 186 Medco Health Solutions, Inc. Earnings Per Share Reconciliation (2009) (Unaudited) This adjustment represents the per share effect of the intagible amortization from the 2003 spin-off, when Medco became a publicly traded company. This adjustment represents the pe
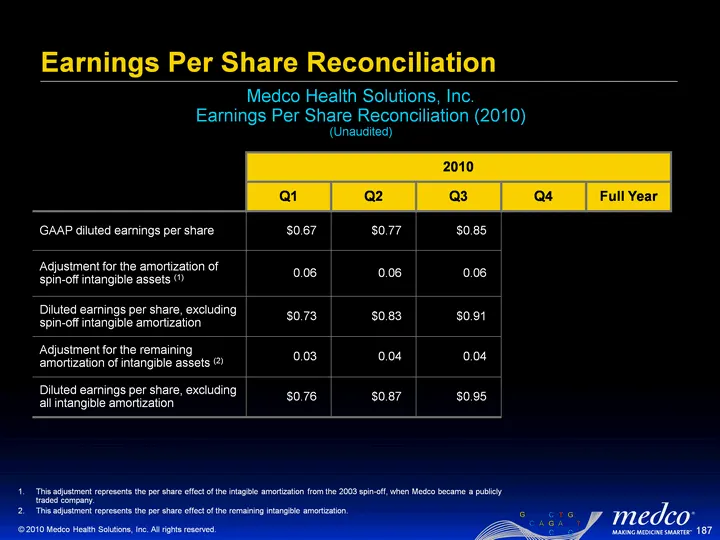
Slide 187: Earnings Per Share Reconciliation (2010)
Earnings Per Share Reconciliation 187 Medco Health Solutions, Inc. Earnings Per Share Reconciliation (2010) (Unaudited) This adjustment represents the per share effect of the intagible amortization from the 2003 spin-off, when Medco became a publicly traded company. This adjustment represents the pe
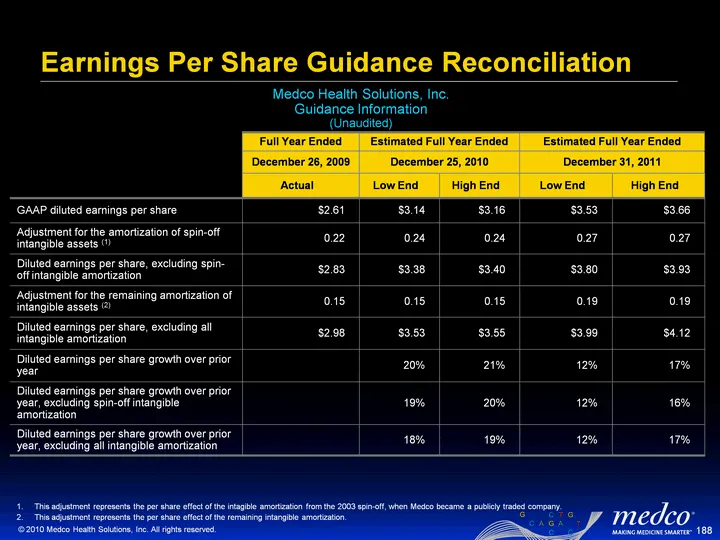
Slide 188: Earnings Per Share Guidance Reconciliation
Earnings Per Share Guidance Reconciliation 188 Medco Health Solutions, Inc. Guidance Information (Unaudited) This adjustment represents the per share effect of the intagible amortization from the 2003 spin-off, when Medco became a publicly traded company. This adjustment represents the per share eff
Source: SEC EDGAR · 8-K filed Nov 19, 2010
More decks from Medco Health Solutions Inc
 Merger or Acquisition (July 2011)20 slides · Jul 22, 2011
 Sanford C. Bernstein 27th Annual Strategic Decisions Conference 201125 slides · Jun 1, 2011
 Deutsche Bank 36th Annual Health Care Conference 201130 slides · May 3, 2011
 Investor Presentation (March 2011)36 slides · Mar 24, 2011
 Barclays Capital 2011 Global Health Care Conference36 slides · Mar 17, 2011
 Citi 2011 Global Health Care Conference37 slides · Mar 1, 2011